1College of Information Studies, 2Department of Computer Science, University of Maryland, College Park, MD, USA3Center for Entrepreneurship, 4School of Mechanical Engineering, 5School of Electrical & Computer Engineering, Purdue University, West Lafayette, IN, USA
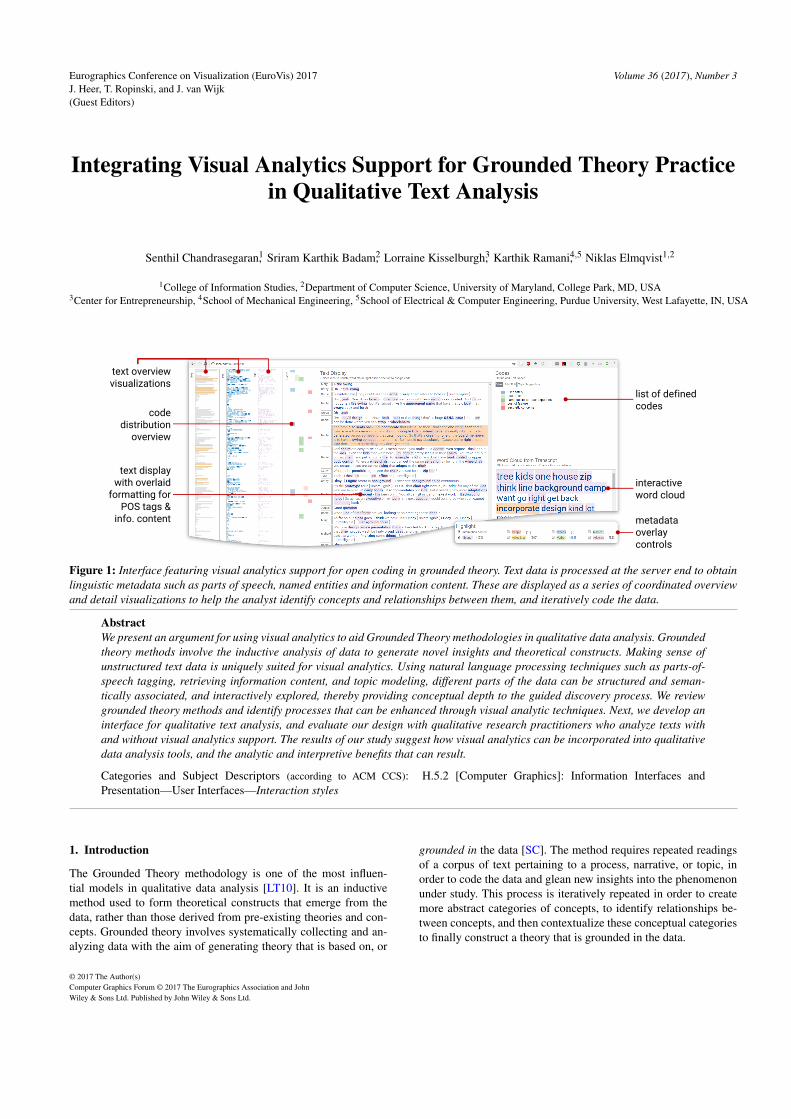
text overview visualizations
text display with overlaid
formatting for POS tags &
info. content
list of defined codes
interactive word cloud
code distribution
overview
metadata overlay controls
Figure 1: Interface featuring visual analytics support for open coding in grounded theory. Text data is processed at the server end to obtainlinguistic metadata such as parts of speech, named entities and information content. These are displayed as a series of coordinated overviewand detail visualizations to help the analyst identify concepts and relationships between them, and iteratively code the data.
AbstractWe present an argument for using visual analytics to aid Grounded Theory methodologies in qualitative data analysis. Groundedtheory methods involve the inductive analysis of data to generate novel insights and theoretical constructs. Making sense ofunstructured text data is uniquely suited for visual analytics. Using natural language processing techniques such as parts-of-speech tagging, retrieving information content, and topic modeling, different parts of the data can be structured and seman-tically associated, and interactively explored, thereby providing conceptual depth to the guided discovery process. We reviewgrounded theory methods and identify processes that can be enhanced through visual analytic techniques. Next, we develop aninterface for qualitative text analysis, and evaluate our design with qualitative research practitioners who analyze texts withand without visual analytics support. The results of our study suggest how visual analytics can be incorporated into qualitativedata analysis tools, and the analytic and interpretive benefits that can result.
Categories and Subject Descriptors (according to ACM CCS): H.5.2 [Computer Graphics]: Information Interfaces andPresentation—User Interfaces—Interaction styles
1. Introduction
The Grounded Theory methodology is one of the most influen-tial models in qualitative data analysis [LT10]. It is an inductivemethod used to form theoretical constructs that emerge from thedata, rather than those derived from pre-existing theories and con-cepts. Grounded theory involves systematically collecting and an-alyzing data with the aim of generating theory that is based on, or
grounded in the data [SC]. The method requires repeated readingsof a corpus of text pertaining to a process, narrative, or topic, inorder to code the data and glean new insights into the phenomenonunder study. This process is iteratively repeated in order to createmore abstract categories of concepts, to identify relationships be-tween concepts, and then contextualize these conceptual categoriesto finally construct a theory that is grounded in the data.
S. Chandrasegaran, S. K. Badam, L. Kisselburgh, K. Ramani, & N.Elmqvist / Supporting Grounded Theory Practice with Visual Analytics
The first stage of grounded theory practice, called open cod-ing, is data immersive where the analyst generates descriptivecodes through multiple readings of the data. This method bears astrong resemblance to the sensemaking loop proposed by Pirolliand Card [PC05], where analysts make sense of data by foragingfor information, collecting evidence, and forming schema that leadsto hypotheses. The stages of “shoeboxing” information, organizingevidence, forming schema, and forming hypotheses in the sense-making loop closely parallel the processes of open coding, axialcoding, selective coding, and theory formation of the grounded the-ory method. The science of visual analytics supports data analysisusing computational techniques and interactive visualizations de-signed to facilitate this sensemaking loop [CT05]. In this paper,we draw parallels between the data-driven, bottom-up approach ofgrounded theory to the data-driven, bottom-up approach inherentto visual analytics. We review the methods of grounded theory, fo-cusing on the open coding stage, and determine the design require-ments for identifying and coding concepts and relationships duringtext analysis. We then explore the design space of visual analyt-ics and text visualization, and implement a prototype to supportopen coding, using multiple coordinated visualizations to exploreand analyze text data. We use parts-of-speech, named-entity recog-nition, and topic modeling algorithms to assist in identifying po-tential concepts, which are presented to the analyst in the form ofoverview and detail visualizations.
We conduct a user study with novices and experienced practi-tioners in qualitative analysis perform a set of tasks to create codes,assign codes, and infer relationships between the data and themesgenerated through topic modeling. Through observations, partici-pant feedback, and coding activity logs, we identify differences ininteraction patterns between two interfaces—with and without vi-sual analytic support—and find that participants exhibit a distinctpattern of data exploration when using the interface with visual an-alytics support. Based on these findings, we suggest guidelines forproviding visual analytics support to grounded theory practice.
The contributions of this paper are (a) identifying the require-ments for grounded theory support by drawing parallels betweenthe grounded theory method and the sense-making process sup-ported by visual analytics, (b) an exploration of text analytics tech-niques to address the identified requirements, (c) the prototype in-terface designed to address the requirements, and (d) a set of guide-lines informed by the user study for designing visual analytics toolsto aid grounded theory.
2. Background
The social scientist Donald Campbell famously stated, “all researchultimately has a qualitative grounding” [MH94, p. 40]. We can cer-tainly agree that qualitative evaluation is necessary when the goal isto answer open-ended research questions. Qualitative data are typ-ically non-numerical information about a phenomenon and its at-tributes, and are generated through a variety of methods, includingin-depth interviews, direct observation, written documents, as wellas non-verbal data such as sketches, images, and videos [Dey05].Grounded theory is a method of qualitative data analysis where atheoretical understanding is developed inductively by identifyingthemes that emerge from a given dataset [Cha06,SC]. In this section
we briefly discuss the grounded theory method and draw parallelsbetween its approach and that of visual analytics. We then reviewrelated research in visual analytics and text visualization, drawinginspiration to support text data exploration in grounded theory.
2.1. Grounded Theory
One of the fundamental principles of grounded theory is thatdata collection and analysis are interrelated and iterative [CS90].Grounded theory is characterized by its “fitness” or faithfulness tothe realities of what transpires in the data. This forms the basis of itsinductive nature according to Strauss and Corbin [SC], who main-tain that a theoretical construct is sound only when it is inducedfrom the given dataset. Concepts lie at the root of grounded theory.A concept in this context is shorthand for conceptual label, a de-scriptive identifier for an activity or phenomenon in the raw dataset.For instance, if the dataset were a transcript of a design session,then “idea generation” can be a conceptual label that can be used totag all instances in the transcript where the speakers come up withan idea and describe it. The process of labeling raw qualitative datawith conceptual labels is called coding.
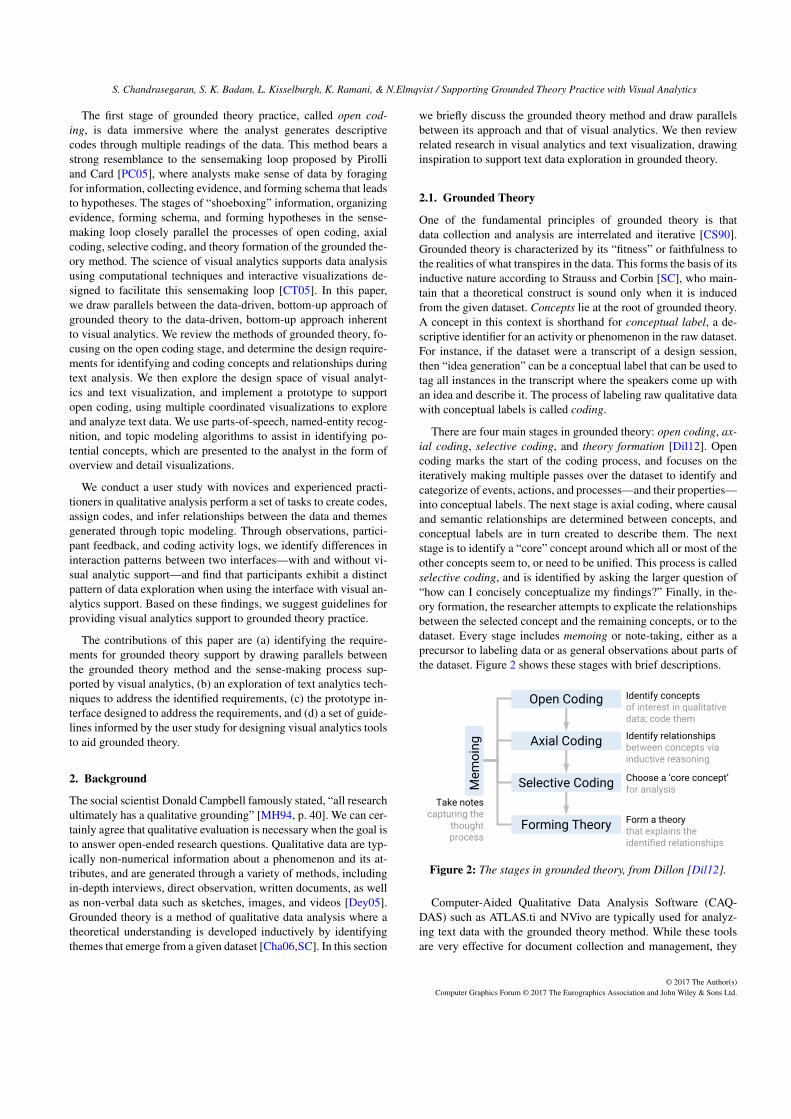
There are four main stages in grounded theory: open coding, ax-ial coding, selective coding, and theory formation [Dil12]. Opencoding marks the start of the coding process, and focuses on theiteratively making multiple passes over the dataset to identify andcategorize of events, actions, and processes—and their properties—into conceptual labels. The next stage is axial coding, where causaland semantic relationships are determined between concepts, andconceptual labels are in turn created to describe them. The nextstage is to identify a “core” concept around which all or most of theother concepts seem to, or need to be unified. This process is calledselective coding, and is identified by asking the larger question of“how can I concisely conceptualize my findings?” Finally, in the-ory formation, the researcher attempts to explicate the relationshipsbetween the selected concept and the remaining concepts, or to thedataset. Every stage includes memoing or note-taking, either as aprecursor to labeling data or as general observations about parts ofthe dataset. Figure 2 shows these stages with brief descriptions.
Open Coding
Axial Coding
Selective Coding
Forming Theory
Me
mo
ing
Identify concepts of interest in qualitative data; code them
Identify relationships between concepts via inductive reasoning
Choose a ‘core concept’ for analysis
Form a theory that explains the identified relationships
Take notes capturing the
thought process
Figure 2: The stages in grounded theory, from Dillon [Dil12].
Computer-Aided Qualitative Data Analysis Software (CAQ-DAS) such as ATLAS.ti and NVivo are typically used for analyz-ing text data with the grounded theory method. While these toolsare very effective for document collection and management, they
S. Chandrasegaran, S. K. Badam, L. Kisselburgh, K. Ramani, & N.Elmqvist / Supporting Grounded Theory Practice with Visual Analytics
could be enhanced by integrating NLP techniques to identify poten-tial concepts and relationships, and by facilitating the explorationof these relationships through multiple coordinated views or ab-stractions. This allows deeper and more abstract explorations ofmeanings and relationships among text data, thus enhancing theconceptual density that is a fundamental part of grounded the-ory approaches. The visual representations that are available inthese tools facilitate code comparison and linking, which are pro-cesses followed after open coding. Case studies with NVivo andAtlas.ti [BJB06, WPAM15] confirm that analysts chiefly use thesesoftware for organizing data and comparing coded text.
Corbin and Strauss [CS90] emphasize the importance of mak-ing constant comparisons between an observed incident and otherincidents in the data. Identifying similarities and differences by ex-ploring the data and making comparisons is a crucial to establishredundancy and reliability in data interpretations. Eventually, thisgraduates to looking for patterns and anomalies in the dataset, or“looking at the data for regularity and where that regularity is notapparent” [CS90, p. 421].
The grounded theory method bears a strong resemblance to thesensemaking loop proposed by Pirolli and Card [PC05], where an-alysts make sense of data by foraging for information, collectingevidence, and forming schema that leads to hypotheses. The fieldof visual analytics is strongly motivated by this sensemaking loop,and has developed techniques that aid the exploration and foragingof raw, unstructured data—precisely the kind of support that is cur-rently lacking for open coding. Our goal is to enrich interpretivepossibilities and conceptual depth during coding, and to explore re-lationships. Through visually scaffolding the systematic process ofcoding, categorization, constant comparison, and triangulation withother data and theory, this approach serves to facilitate the explo-ration of concepts and relationships, enhance analytic reliability,and ultimately deepen the interpretive depth of grounded theorypractice [Pat99]. Our goal is not to replace existing CAQDAS tools,but to emphasize the benefits such tools stand to gain by integratingvisual analytic approaches.
2.2. Visual Analytics and Text Analysis
Defined as “the science of analytical reasoning facilitated by in-teractive visual interfaces” [CT05, p. 4], visual analytics was de-veloped for the intelligence analysis community to aid informationprocessing of unstructured data. The analyst is kept at the centerof all visual analytics systems and techniques, and is aided towardtheir goal of developing an effective understanding of large, com-plex, and unstructured datasets by combining automated analysistechniques with interactive visualizations. As Keim et al. [KAF∗08,p. 155] state, “the goal of visual analytics is to make our way of pro-cessing data and information transparent for an analytic discourse.”
When dealing with text data, the automated analysis techniquestypically involve natural language processing (NLP) techniquesand topic modelling, using various forms of visualizations to dis-play the results. Visual analytics support for text analysis often fo-cuses on analyzing connections between multiple sources of text,from intelligence reports to news articles to microblogs. Perhapsone of the more influential tools in this domain, Jigsaw [SGL08],
designed for intelligence analysis, identifies entities and establishesconnections between documents using occurrences of these en-tities. These connections are displayed to the analyst through acombination of coordinated views such as lists, graphs, calendarviews, as well as views of the documents, allowing the analystto examine, filter, and analyze intelligence data to identify threats.Tiara [WLS∗10] is a system designed for analysis of text documentswith a temporal component, such as emails and patient records. Ituses topic modeling to summarize document collections into setsof topics, and displays the prominence of each topic over time, al-lowing users to select a topic and drill down to examine the un-derlying documents at that time. HierarchicalTopics [DYW∗13] in-tegrates a hierarchical topic modeling algorithm with a temporalview showing evolution of topics over time, allowing users to ex-plore topics hierarchically, and edit them based on their own mentalmodels. VariFocal Reader [KJW∗14] combines visual abstractionswith focus+context techniques to help navigate and analyze largedocuments, using topic segmentations and automatic annotation toreveal inherent document structure and entities in a document. Withthe exception of Varifocal reader, the techniques listed here are de-signed to draw connections between large collections of small doc-uments, while our approach is to support the identification of con-cepts and relationships within a large document.
2.3. Exploring Text Data through Abstractions
Visual abstractions of text are often used to convey an overview ofa document, to give the user a general understanding of it withouthaving to delve into the text. Such overviews can reveal documentstructure, mapping lines of software code to thin lines colored toshow editing statistics as done in Seesoft [ESS92], or showing rep-etitions of substring sequences as done with arc diagrams [Wat02].Overviews can also be semantic, revealing the hierarchy of con-cepts in a document as in the case of Docuburst [CCP09]. Otheroverview representations can show thematic views that range frombasic word frequency representations such as word clouds, orrepresentations that reveal context, such as keyword in context(KWIC) views [MS99] More sophisticated aggregate representa-tions include Word Tree [WV08], which aggregates concordantterms to form a tree of phrases spanning from a single word, ormetadata representations such as Parallel Tag Clouds [CVW09]and ThemeDelta [GJG∗15] that combine word clouds on parallelaxes revealing thematic relationships between multiple documents.Serendip [AKV∗14] combines thematic topic model views, coordi-nated with word rankings and text views to allow users to explorea text corpus at multiple levels of abstraction.
In the next section, we identify requirements for the groundedtheory method, focusing on the data exploration component that isinherent to open coding. We then use existing text visualization andvisual analytics techniques to address these requirements, design aprototype, and evaluate it with open coding tasks.
3. Requirements and Design
In this section, we define five key requirements for exploring andcoding text data using grounded theory. We explore visual analyticsapproaches that meet these requirements, and select techniques tocreate a prototype that integrates the above approaches.
S. Chandrasegaran, S. K. Badam, L. Kisselburgh, K. Ramani, & N.Elmqvist / Supporting Grounded Theory Practice with Visual Analytics
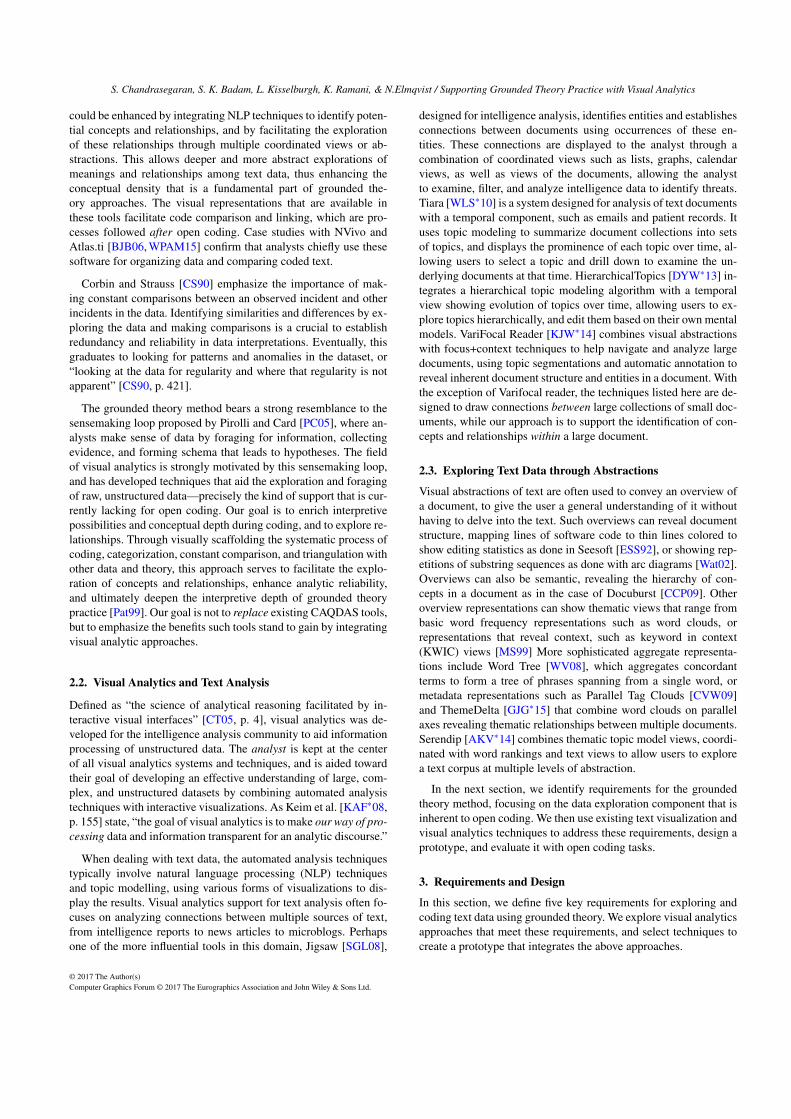
Figure 3: Options for highlighting concepts and attributes. Multi-ple checkboxes control the display of named entities and parts ofspeech in the text view. The checkboxes also function as scentedwidgets [WHA07], showing the number of occurrences of potentialconcepts (nouns/verbs) and their attributes (adjectives/adverbs).
3.1. Requirements
We focus our requirements on open coding—the identification andcategorization of concepts—as it stands to benefit the most from avisual analytics approach. These requirements are based on litera-ture on the grounded theory method and information visualization.
R1 Provide multiple data abstractions: When analyzing unstruc-tured text data, it helps to examine and compare multiple per-spectives or views of the same data to infer structure and re-lationships with it. Presenting these data with multiple per-spectives, e.g. a combination of word clouds, normal text, andgraphical line representations can help the user identify patternsand relationships in the text.
R2 Support concept identification: The identification of conceptsis key to grounded theory, and is a labor-intensive process.Computational support can help identify and tag concepts, suchas nouns and verbs [Bor03], and their properties, such as adjec-tives and adverbs. However, the decision to incorporate thesesuggestions is to be left to the analyst.
R3 Help infer relationships: Relationships between concepts arecontext-specific and are informed by the knowledge, training,and experience of the researcher. However, inferring relation-ships based on established semantic metrics such as hypernymyor synonymy can assist interpretive processes. For instance,the WordNet taxonomy can be used to highlight relationshipsbetween .“sadness” and “happiness” through their hypernym,“emotion”.
R4 Facilitate comparisons: Recall Corbin’s tenet of constantcomparison [CS90]: once a concept is identified, the analystshould be able to look for related concepts, and make compar-isons based on context, e.g. viewing multiple occurrences of aword to understand how meaning is contextualized.
R5 Support memoing: Note-taking or memoing is an essentialprocess in grounded theory research to document interpretiveinsights. Effective support for memoing should preserve the re-lationship between the memos and text, as well as support theanalysis of the memos to suggest labels or infer relationships.
3.2. Exploring The Design Space
Visual analytics facilitates analytical reasoning through interactivevisual interfaces designed to maximize the human capacity to per-ceive, understand, and reason about data [CT05]. Our explorationof the design space will thus look at text analytic techniques andinteractive text visualizations to address the above requirements.
Linguistic Processing: Concepts in grounded theory could beentities, phenomena, actions, or events. In other words, concepts
PO
S
HIG
HL
IGH
TIN
G
SK
IM
FO
RM
AT
TIN
G
PL
AIN
TE
XT
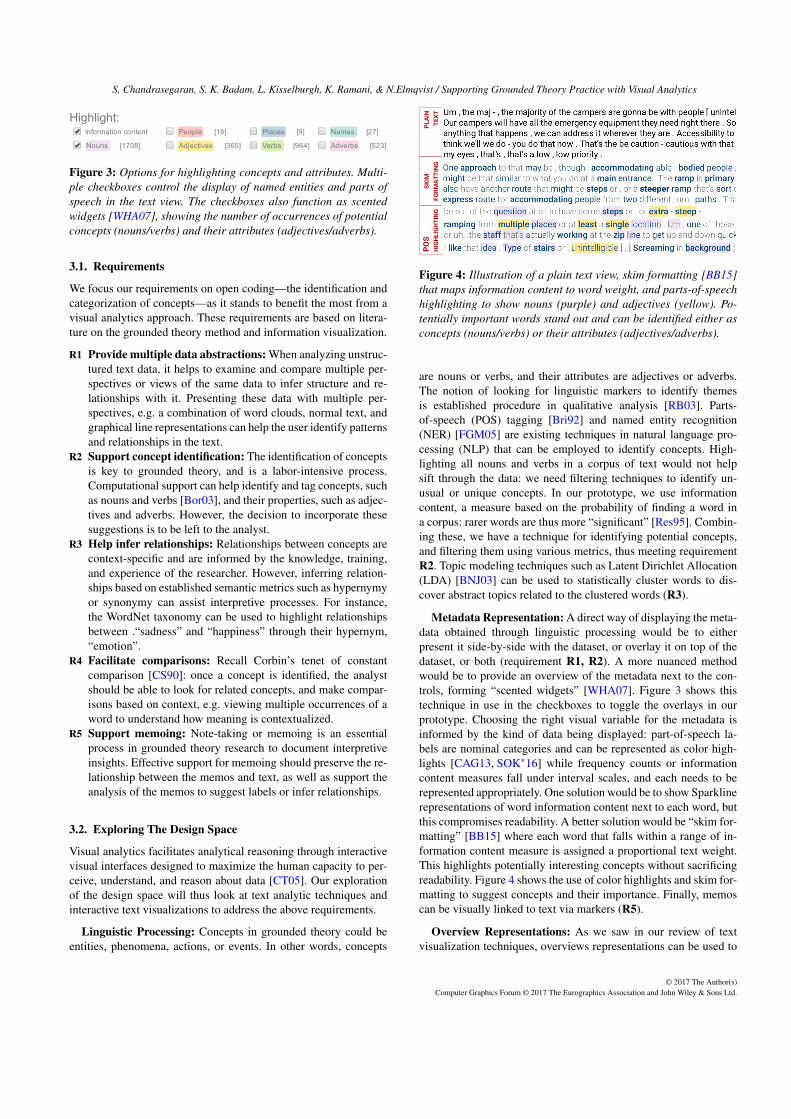
Figure 4: Illustration of a plain text view, skim formatting [BB15]that maps information content to word weight, and parts-of-speechhighlighting to show nouns (purple) and adjectives (yellow). Po-tentially important words stand out and can be identified either asconcepts (nouns/verbs) or their attributes (adjectives/adverbs).
are nouns or verbs, and their attributes are adjectives or adverbs.The notion of looking for linguistic markers to identify themesis established procedure in qualitative analysis [RB03]. Parts-of-speech (POS) tagging [Bri92] and named entity recognition(NER) [FGM05] are existing techniques in natural language pro-cessing (NLP) that can be employed to identify concepts. High-lighting all nouns and verbs in a corpus of text would not helpsift through the data: we need filtering techniques to identify un-usual or unique concepts. In our prototype, we use informationcontent, a measure based on the probability of finding a word ina corpus: rarer words are thus more “significant” [Res95]. Combin-ing these, we have a technique for identifying potential concepts,and filtering them using various metrics, thus meeting requirementR2. Topic modeling techniques such as Latent Dirichlet Allocation(LDA) [BNJ03] can be used to statistically cluster words to dis-cover abstract topics related to the clustered words (R3).
Metadata Representation: A direct way of displaying the meta-data obtained through linguistic processing would be to eitherpresent it side-by-side with the dataset, or overlay it on top of thedataset, or both (requirement R1, R2). A more nuanced methodwould be to provide an overview of the metadata next to the con-trols, forming “scented widgets” [WHA07]. Figure 3 shows thistechnique in use in the checkboxes to toggle the overlays in ourprototype. Choosing the right visual variable for the metadata isinformed by the kind of data being displayed: part-of-speech la-bels are nominal categories and can be represented as color high-lights [CAG13, SOK∗16] while frequency counts or informationcontent measures fall under interval scales, and each needs to berepresented appropriately. One solution would be to show Sparklinerepresentations of word information content next to each word, butthis compromises readability. A better solution would be “skim for-matting” [BB15] where each word that falls within a range of in-formation content measure is assigned a proportional text weight.This highlights potentially interesting concepts without sacrificingreadability. Figure 4 shows the use of color highlights and skim for-matting to suggest concepts and their importance. Finally, memoscan be visually linked to text via markers (R5).
Overview Representations: As we saw in our review of textvisualization techniques, overviews representations can be used to
S. Chandrasegaran, S. K. Badam, L. Kisselburgh, K. Ramani, & N.Elmqvist / Supporting Grounded Theory Practice with Visual Analyticstr
an
sc
rip
t o
verv
iew
info
rma
tio
n c
on
ten
t o
verv
iew
pa
rt-o
f-s
pe
ec
h o
verv
iew
(n
ou
n)
co
de
ove
rvie
w
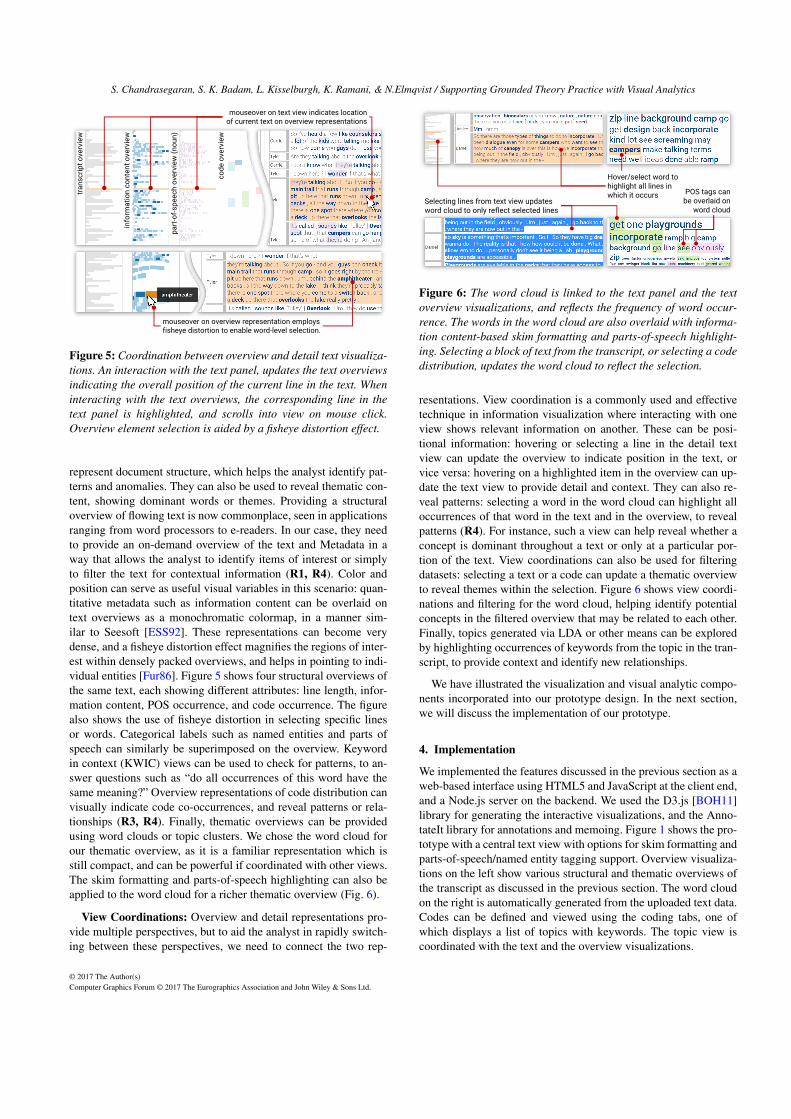
mouseover on text view indicates location of current text on overview representations
mouseover on overview representation employs fisheye distortion to enable word-level selection.
Figure 5: Coordination between overview and detail text visualiza-tions. An interaction with the text panel, updates the text overviewsindicating the overall position of the current line in the text. Wheninteracting with the text overviews, the corresponding line in thetext panel is highlighted, and scrolls into view on mouse click.Overview element selection is aided by a fisheye distortion effect.
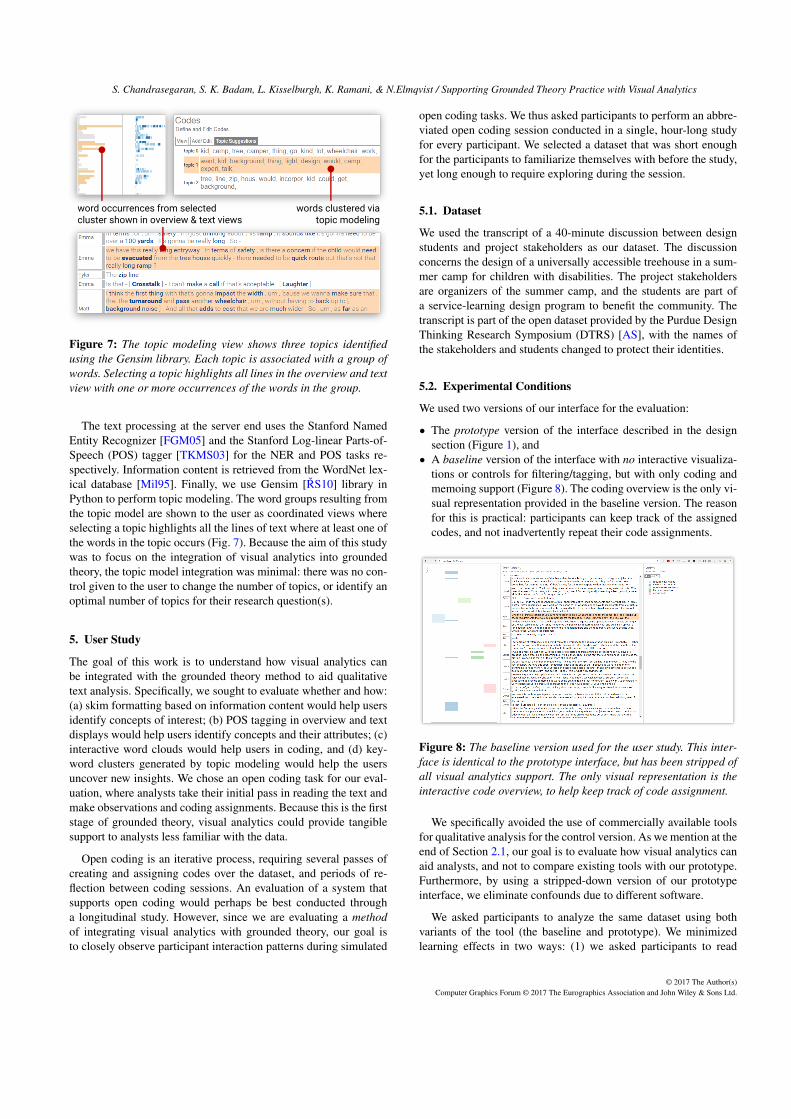
represent document structure, which helps the analyst identify pat-terns and anomalies. They can also be used to reveal thematic con-tent, showing dominant words or themes. Providing a structuraloverview of flowing text is now commonplace, seen in applicationsranging from word processors to e-readers. In our case, they needto provide an on-demand overview of the text and Metadata in away that allows the analyst to identify items of interest or simplyto filter the text for contextual information (R1, R4). Color andposition can serve as useful visual variables in this scenario: quan-titative metadata such as information content can be overlaid ontext overviews as a monochromatic colormap, in a manner sim-ilar to Seesoft [ESS92]. These representations can become verydense, and a fisheye distortion effect magnifies the regions of inter-est within densely packed overviews, and helps in pointing to indi-vidual entities [Fur86]. Figure 5 shows four structural overviews ofthe same text, each showing different attributes: line length, infor-mation content, POS occurrence, and code occurrence. The figurealso shows the use of fisheye distortion in selecting specific linesor words. Categorical labels such as named entities and parts ofspeech can similarly be superimposed on the overview. Keywordin context (KWIC) views can be used to check for patterns, to an-swer questions such as “do all occurrences of this word have thesame meaning?” Overview representations of code distribution canvisually indicate code co-occurrences, and reveal patterns or rela-tionships (R3, R4). Finally, thematic overviews can be providedusing word clouds or topic clusters. We chose the word cloud forour thematic overview, as it is a familiar representation which isstill compact, and can be powerful if coordinated with other views.The skim formatting and parts-of-speech highlighting can also beapplied to the word cloud for a richer thematic overview (Fig. 6).
View Coordinations: Overview and detail representations pro-vide multiple perspectives, but to aid the analyst in rapidly switch-ing between these perspectives, we need to connect the two rep-
Hover/select word to highlight all lines in which it occurs
Selecting lines from text view updates word cloud to only reflect selected lines
POS tags can be overlaid on
word cloud
Figure 6: The word cloud is linked to the text panel and the textoverview visualizations, and reflects the frequency of word occur-rence. The words in the word cloud are also overlaid with informa-tion content-based skim formatting and parts-of-speech highlight-ing. Selecting a block of text from the transcript, or selecting a codedistribution, updates the word cloud to reflect the selection.
resentations. View coordination is a commonly used and effectivetechnique in information visualization where interacting with oneview shows relevant information on another. These can be posi-tional information: hovering or selecting a line in the detail textview can update the overview to indicate position in the text, orvice versa: hovering on a highlighted item in the overview can up-date the text view to provide detail and context. They can also re-veal patterns: selecting a word in the word cloud can highlight alloccurrences of that word in the text and in the overview, to revealpatterns (R4). For instance, such a view can help reveal whether aconcept is dominant throughout a text or only at a particular por-tion of the text. View coordinations can also be used for filteringdatasets: selecting a text or a code can update a thematic overviewto reveal themes within the selection. Figure 6 shows view coordi-nations and filtering for the word cloud, helping identify potentialconcepts in the filtered overview that may be related to each other.Finally, topics generated via LDA or other means can be exploredby highlighting occurrences of keywords from the topic in the tran-script, to provide context and identify new relationships.
We have illustrated the visualization and visual analytic compo-nents incorporated into our prototype design. In the next section,we will discuss the implementation of our prototype.
4. Implementation
We implemented the features discussed in the previous section as aweb-based interface using HTML5 and JavaScript at the client end,and a Node.js server on the backend. We used the D3.js [BOH11]library for generating the interactive visualizations, and the Anno-tateIt library for annotations and memoing. Figure 1 shows the pro-totype with a central text view with options for skim formatting andparts-of-speech/named entity tagging support. Overview visualiza-tions on the left show various structural and thematic overviews ofthe transcript as discussed in the previous section. The word cloudon the right is automatically generated from the uploaded text data.Codes can be defined and viewed using the coding tabs, one ofwhich displays a list of topics with keywords. The topic view iscoordinated with the text and the overview visualizations.
S. Chandrasegaran, S. K. Badam, L. Kisselburgh, K. Ramani, & N.Elmqvist / Supporting Grounded Theory Practice with Visual Analytics
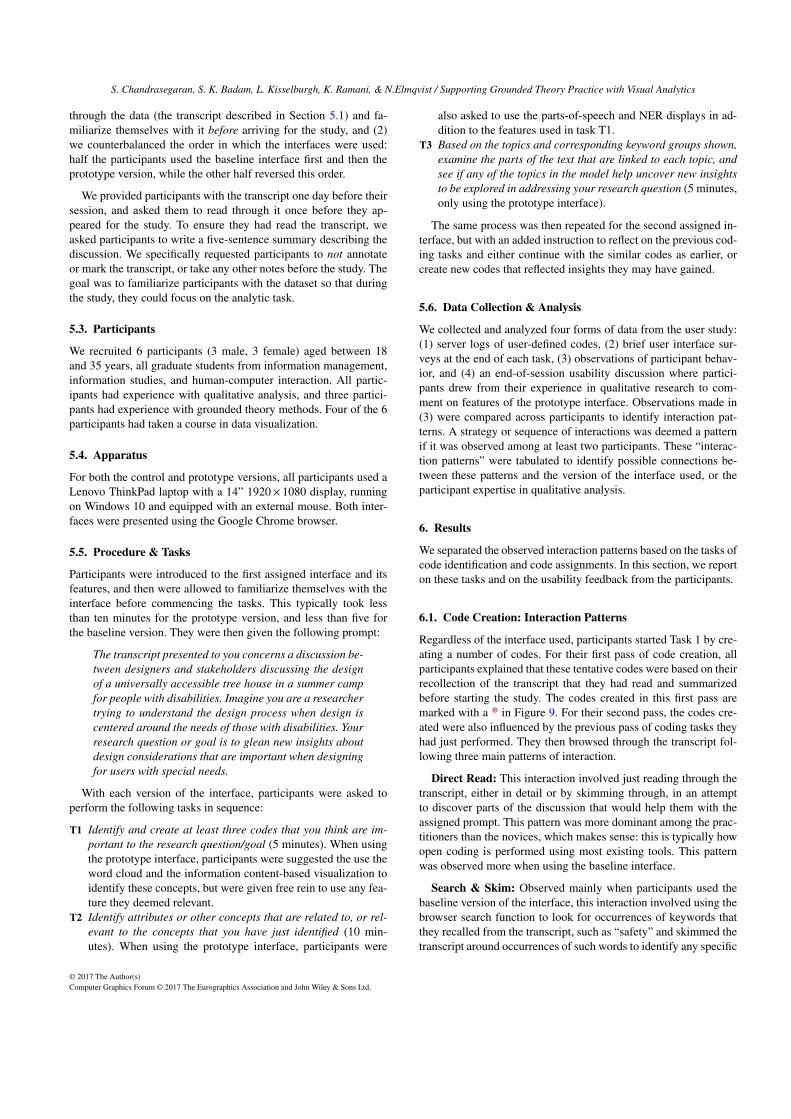
words clustered via topic modeling
word occurrences from selected cluster shown in overview & text views
Figure 7: The topic modeling view shows three topics identifiedusing the Gensim library. Each topic is associated with a group ofwords. Selecting a topic highlights all lines in the overview and textview with one or more occurrences of the words in the group.
The text processing at the server end uses the Stanford NamedEntity Recognizer [FGM05] and the Stanford Log-linear Parts-of-Speech (POS) tagger [TKMS03] for the NER and POS tasks re-spectively. Information content is retrieved from the WordNet lex-ical database [Mil95]. Finally, we use Gensim [RS10] library inPython to perform topic modeling. The word groups resulting fromthe topic model are shown to the user as coordinated views whereselecting a topic highlights all the lines of text where at least one ofthe words in the topic occurs (Fig. 7). Because the aim of this studywas to focus on the integration of visual analytics into groundedtheory, the topic model integration was minimal: there was no con-trol given to the user to change the number of topics, or identify anoptimal number of topics for their research question(s).
5. User Study
The goal of this work is to understand how visual analytics canbe integrated with the grounded theory method to aid qualitativetext analysis. Specifically, we sought to evaluate whether and how:(a) skim formatting based on information content would help usersidentify concepts of interest; (b) POS tagging in overview and textdisplays would help users identify concepts and their attributes; (c)interactive word clouds would help users in coding, and (d) key-word clusters generated by topic modeling would help the usersuncover new insights. We chose an open coding task for our eval-uation, where analysts take their initial pass in reading the text andmake observations and coding assignments. Because this is the firststage of grounded theory, visual analytics could provide tangiblesupport to analysts less familiar with the data.
Open coding is an iterative process, requiring several passes ofcreating and assigning codes over the dataset, and periods of re-flection between coding sessions. An evaluation of a system thatsupports open coding would perhaps be best conducted througha longitudinal study. However, since we are evaluating a methodof integrating visual analytics with grounded theory, our goal isto closely observe participant interaction patterns during simulated
open coding tasks. We thus asked participants to perform an abbre-viated open coding session conducted in a single, hour-long studyfor every participant. We selected a dataset that was short enoughfor the participants to familiarize themselves with before the study,yet long enough to require exploring during the session.
5.1. Dataset
We used the transcript of a 40-minute discussion between designstudents and project stakeholders as our dataset. The discussionconcerns the design of a universally accessible treehouse in a sum-mer camp for children with disabilities. The project stakeholdersare organizers of the summer camp, and the students are part ofa service-learning design program to benefit the community. Thetranscript is part of the open dataset provided by the Purdue DesignThinking Research Symposium (DTRS) [AS], with the names ofthe stakeholders and students changed to protect their identities.
5.2. Experimental Conditions
We used two versions of our interface for the evaluation:
• The prototype version of the interface described in the designsection (Figure 1), and
• A baseline version of the interface with no interactive visualiza-tions or controls for filtering/tagging, but with only coding andmemoing support (Figure 8). The coding overview is the only vi-sual representation provided in the baseline version. The reasonfor this is practical: participants can keep track of the assignedcodes, and not inadvertently repeat their code assignments.
Figure 8: The baseline version used for the user study. This inter-face is identical to the prototype interface, but has been stripped ofall visual analytics support. The only visual representation is theinteractive code overview, to help keep track of code assignment.
We specifically avoided the use of commercially available toolsfor qualitative analysis for the control version. As we mention at theend of Section 2.1, our goal is to evaluate how visual analytics canaid analysts, and not to compare existing tools with our prototype.Furthermore, by using a stripped-down version of our prototypeinterface, we eliminate confounds due to different software.
We asked participants to analyze the same dataset using bothvariants of the tool (the baseline and prototype). We minimizedlearning effects in two ways: (1) we asked participants to read
S. Chandrasegaran, S. K. Badam, L. Kisselburgh, K. Ramani, & N.Elmqvist / Supporting Grounded Theory Practice with Visual Analytics
through the data (the transcript described in Section 5.1) and fa-miliarize themselves with it before arriving for the study, and (2)we counterbalanced the order in which the interfaces were used:half the participants used the baseline interface first and then theprototype version, while the other half reversed this order.
We provided participants with the transcript one day before theirsession, and asked them to read through it once before they ap-peared for the study. To ensure they had read the transcript, weasked participants to write a five-sentence summary describing thediscussion. We specifically requested participants to not annotateor mark the transcript, or take any other notes before the study. Thegoal was to familiarize participants with the dataset so that duringthe study, they could focus on the analytic task.
5.3. Participants
We recruited 6 participants (3 male, 3 female) aged between 18and 35 years, all graduate students from information management,information studies, and human-computer interaction. All partic-ipants had experience with qualitative analysis, and three partici-pants had experience with grounded theory methods. Four of the 6participants had taken a course in data visualization.
5.4. Apparatus
For both the control and prototype versions, all participants used aLenovo ThinkPad laptop with a 14” 1920× 1080 display, runningon Windows 10 and equipped with an external mouse. Both inter-faces were presented using the Google Chrome browser.
5.5. Procedure & Tasks
Participants were introduced to the first assigned interface and itsfeatures, and then were allowed to familiarize themselves with theinterface before commencing the tasks. This typically took lessthan ten minutes for the prototype version, and less than five forthe baseline version. They were then given the following prompt:
The transcript presented to you concerns a discussion be-tween designers and stakeholders discussing the designof a universally accessible tree house in a summer campfor people with disabilities. Imagine you are a researchertrying to understand the design process when design iscentered around the needs of those with disabilities. Yourresearch question or goal is to glean new insights aboutdesign considerations that are important when designingfor users with special needs.
With each version of the interface, participants were asked toperform the following tasks in sequence:
T1 Identify and create at least three codes that you think are im-portant to the research question/goal (5 minutes). When usingthe prototype interface, participants were suggested the use theword cloud and the information content-based visualization toidentify these concepts, but were given free rein to use any fea-ture they deemed relevant.
T2 Identify attributes or other concepts that are related to, or rel-evant to the concepts that you have just identified (10 min-utes). When using the prototype interface, participants were
also asked to use the parts-of-speech and NER displays in ad-dition to the features used in task T1.
T3 Based on the topics and corresponding keyword groups shown,examine the parts of the text that are linked to each topic, andsee if any of the topics in the model help uncover new insightsto be explored in addressing your research question (5 minutes,only using the prototype interface).
The same process was then repeated for the second assigned in-terface, but with an added instruction to reflect on the previous cod-ing tasks and either continue with the similar codes as earlier, orcreate new codes that reflected insights they may have gained.
5.6. Data Collection & Analysis
We collected and analyzed four forms of data from the user study:(1) server logs of user-defined codes, (2) brief user interface sur-veys at the end of each task, (3) observations of participant behav-ior, and (4) an end-of-session usability discussion where partici-pants drew from their experience in qualitative research to com-ment on features of the prototype interface. Observations made in(3) were compared across participants to identify interaction pat-terns. A strategy or sequence of interactions was deemed a patternif it was observed among at least two participants. These “interac-tion patterns” were tabulated to identify possible connections be-tween these patterns and the version of the interface used, or theparticipant expertise in qualitative analysis.
6. Results
We separated the observed interaction patterns based on the tasks ofcode identification and code assignments. In this section, we reporton these tasks and on the usability feedback from the participants.
6.1. Code Creation: Interaction Patterns
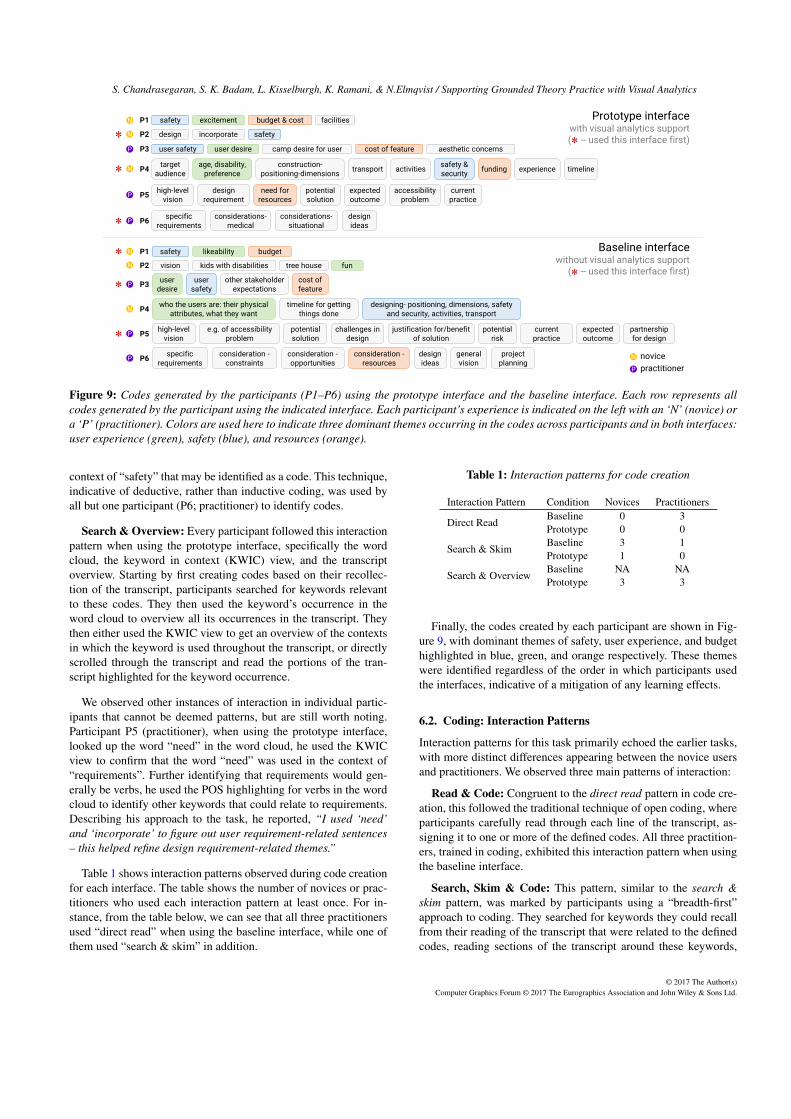
Regardless of the interface used, participants started Task 1 by cre-ating a number of codes. For their first pass of code creation, allparticipants explained that these tentative codes were based on theirrecollection of the transcript that they had read and summarizedbefore starting the study. The codes created in this first pass aremarked with a * in Figure 9. For their second pass, the codes cre-ated were also influenced by the previous pass of coding tasks theyhad just performed. They then browsed through the transcript fol-lowing three main patterns of interaction.
Direct Read: This interaction involved just reading through thetranscript, either in detail or by skimming through, in an attemptto discover parts of the discussion that would help them with theassigned prompt. This pattern was more dominant among the prac-titioners than the novices, which makes sense: this is typically howopen coding is performed using most existing tools. This patternwas observed more when using the baseline interface.
Search & Skim: Observed mainly when participants used thebaseline version of the interface, this interaction involved using thebrowser search function to look for occurrences of keywords thatthey recalled from the transcript, such as “safety” and skimmed thetranscript around occurrences of such words to identify any specific
S. Chandrasegaran, S. K. Badam, L. Kisselburgh, K. Ramani, & N.Elmqvist / Supporting Grounded Theory Practice with Visual Analytics
safety excitement budget & cost facilitiesP1
design incorporate safetyP2
user safety user desire camp desire for user cost of feature aesthetic concernsP3
target audience
age, disability, preference
construction-positioning-dimensions
transport activitiessafety & security
funding experience timelineP4
high-level vision
design requirement
need for resources
potential solution
expected outcome
accessibility problem
current practice
P5
specific requirements
considerations-medical
considerations-situational
design ideas
P6
safety likeability budgetP1
vision kids with disabilities tree houseP2 fun
user desire
user safety
other stakeholder expectations
P3cost of feature
who the users are: their physical attributes, what they want
timeline for getting things done
designing- positioning, dimensions, safety and security, activities, transport
P4
high-level vision
e.g. of accessibility problem
potential solution
P5challenges in
designjustification for/benefit
of solutionpotential
riskcurrent practice
expected outcome
partnership for design
specific requirements
consideration -constraints
consideration -opportunities
P6consideration -
resourcesdesign ideas
general vision
project planning
Prototype interfacewith visual analytics support( -- used this interface first)
Baseline interfacewithout visual analytics support
( -- used this interface first)
N
N
N
N
N
N
P
P
P
P
P
P N
P
novice
practitioner
*
*
*
*
*
*
*
*
Figure 9: Codes generated by the participants (P1–P6) using the prototype interface and the baseline interface. Each row represents allcodes generated by the participant using the indicated interface. Each participant’s experience is indicated on the left with an ‘N’ (novice) ora ‘P’ (practitioner). Colors are used here to indicate three dominant themes occurring in the codes across participants and in both interfaces:user experience (green), safety (blue), and resources (orange).
context of “safety” that may be identified as a code. This technique,indicative of deductive, rather than inductive coding, was used byall but one participant (P6; practitioner) to identify codes.
Search & Overview: Every participant followed this interactionpattern when using the prototype interface, specifically the wordcloud, the keyword in context (KWIC) view, and the transcriptoverview. Starting by first creating codes based on their recollec-tion of the transcript, participants searched for keywords relevantto these codes. They then used the keyword’s occurrence in theword cloud to overview all its occurrences in the transcript. Theythen either used the KWIC view to get an overview of the contextsin which the keyword is used throughout the transcript, or directlyscrolled through the transcript and read the portions of the tran-script highlighted for the keyword occurrence.
We observed other instances of interaction in individual partic-ipants that cannot be deemed patterns, but are still worth noting.Participant P5 (practitioner), when using the prototype interface,looked up the word “need” in the word cloud, he used the KWICview to confirm that the word “need” was used in the context of“requirements”. Further identifying that requirements would gen-erally be verbs, he used the POS highlighting for verbs in the wordcloud to identify other keywords that could relate to requirements.Describing his approach to the task, he reported, “I used ‘need’and ‘incorporate’ to figure out user requirement-related sentences– this helped refine design requirement-related themes.”
Table 1 shows interaction patterns observed during code creationfor each interface. The table shows the number of novices or prac-titioners who used each interaction pattern at least once. For in-stance, from the table below, we can see that all three practitionersused “direct read” when using the baseline interface, while one ofthem used “search & skim” in addition.
Finally, the codes created by each participant are shown in Fig-ure 9, with dominant themes of safety, user experience, and budgethighlighted in blue, green, and orange respectively. These themeswere identified regardless of the order in which participants usedthe interfaces, indicative of a mitigation of any learning effects.
6.2. Coding: Interaction Patterns
Interaction patterns for this task primarily echoed the earlier tasks,with more distinct differences appearing between the novice usersand practitioners. We observed three main patterns of interaction:
Read & Code: Congruent to the direct read pattern in code cre-ation, this followed the traditional technique of open coding, whereparticipants carefully read through each line of the transcript, as-signing it to one or more of the defined codes. All three practition-ers, trained in coding, exhibited this interaction pattern when usingthe baseline interface.
Search, Skim & Code: This pattern, similar to the search &skim pattern, was marked by participants using a “breadth-first”approach to coding. They searched for keywords they could recallfrom their reading of the transcript that were related to the definedcodes, reading sections of the transcript around these keywords,
S. Chandrasegaran, S. K. Badam, L. Kisselburgh, K. Ramani, & N.Elmqvist / Supporting Grounded Theory Practice with Visual Analytics
and coding the sections relevant to the codes. All three novice par-ticipants exhibited this pattern when using the baseline interface.
Search, Explore & Code: Following the search & overviewpattern from code creation, participants searched for keywords re-lated to the defined codes, and used the word cloud and transcriptoverview and/or KWIC views to determine the context in whichthese keywords were used. They then coded these sections of thetranscript based on the identified contexts. All of the novice partic-ipants used this technique almost exclusively, and one of the threeexperienced practitioners used it sparingly when working with theprototype interface.
Read, Code & Explore: When using the prototype interface,experienced practitioners exhibited a variant of the read & codepattern they followed for the baseline version. However, if they no-ticed words in their selection that caught their attention, they woulduse the word cloud to look for other occurrences of that word, tosee if the same code could be assigned to those sections. While allthree practitioners used this pattern of interaction, the mechanicsvaried between them. Participant 5 used the KWIC view to checkthe keyword for context, using this view to decide whether to ex-plore further. P6 used the dynamic update feature of the word cloud:when selecting a section of the transcript to assign a code, the wordcloud updates to reflect only the selected text. The words that showup in the word cloud are presumably related to the code being as-signed. Using this updated view, she found it easier to explore dif-ferent words related to the current code, and coded those sections ofthe transcript accordingly. Similarly, selecting a code in the codedtimeline updates the word cloud to reflect only the lines of text towhich that code is assigned. However, this feature was not used bythe participants. This interaction pattern lies at the crux of the visualanalytics approach: using the visualizations to make observations,confirm patterns, and delving into the data to identify anomalies.Table 2 shows the occurrences of interaction patterns during codeassignment among the two versions of the interface, and among thenovices and practitioners.
Participants reported that code creation and code assignment taskswere both easier in the prototype interface. On a 5-point Likertscale, ratings of the prototype interface averaged 4 (s.d = 0) com-pared to the baseline’s 3.6 (s.d = 0.4). This difference was morepronounced in the coding task, where the prototype interface rat-ings averaged 3.83 (s.d = 0.85) compared to the baseline version’s2.83 (s.d = 0.9). Overall, participants found the coordinated viewsof the word cloud, the transcript overview, and the transcript itself
very helpful. While the KWIC view was used by 2 of the 6 partici-pants, both found it useful.
Recall that Task 3 was intended to test the relevance of the key-word clusters generated by the topic model, based on the linkshighlighted between the keywords in the topics and their occur-rences in the transcript. Most of the participants did not find thisuseful, stating that the occurrences were so high as to render anysense-making a difficult assignment. This was not surprising: ourimplementation of topic modeling was minimal, and participantshad no control over the document resolution or the number of top-ics identified. Topic interpretability by humans has its limits: themore topics in a complex document, the more difficult it is for hu-mans to successfully interpret it [CBGG∗09]. Interactive tools suchas LDAvis [SS14] are rapidly gaining popularity to help humansinterpret topic modeling results. We plan to integrate similar inter-active tools to help refine any topic modeling results, in order tomake the underlying data transparent, and reduce bias. This wasreflected in the suggestions by two of the practitioners who rec-ommended providing control over pruning keywords and iteratingover the topic modeling computation, towards a human-in-the-loopapproach to improve the relevance of the feature.
The parts-of-speech highlighting was used by one participant,while the information content overview not used at all: experiencedparticipants suggested that such views would be more useful for di-rected explorations, when they were more familiar with the dataset.They also suggested adding boolean operations to identify wordco-occurrences and reveal semantic relationships.
7. Discussion
Our results indicate that the integration of visual analytics withthe grounded theory method holds promise for qualitative research.We saw that novices use a breadth-first approach, i.e. search-skimfor code creation and search-skim-code for code assignment. Theysearch for concepts that they feel are relevant to the research goal,rather than use the “close reading” approach followed by experi-enced practitioners. We posit that the exploratory interactions usedin our visual analytics approach eases the transition to better cod-ing behavior because it allows participants to look for patterns andverify their assumptions. In contrast, experienced practitioners usea more focused, depth-first approach of reading through the mate-rial, continuously asking themselves the question “is this relevant?”The visual analytics integration helped them answer this questionthrough the read, code, and explore pattern, where they could ex-plore the rest of the dataset while keeping this question in mind.They used filtered overviews to help this process: selecting a textfor coding updated the word cloud and exposing the relevant con-cepts to the coder helped them explore the question of “is there apattern to be found here?”
Reinforcing good coding practices, we observed that experi-enced practitioners were able to deepen their analysis using theprototype interface without compromising coding rigor. While theyused search & overview for code creation, they primarily usedthe close reading approach to assign codes. This was not true fornovices, whose practice tended toward the convenient rather thanthe rigorous. It has to be mentioned that as with most specialized
S. Chandrasegaran, S. K. Badam, L. Kisselburgh, K. Ramani, & N.Elmqvist / Supporting Grounded Theory Practice with Visual Analytics
tools, the functions are not a substitute for rigorous training, andour study shows that trained practitioners indeed find the visual an-alytics integration useful. This reinforces the importance of trainingin the method before using tool support.
In terms of visualizations, our observations demonstrate that theintegration of overview and contextual visualizations makes sense:these visualizations are driven entirely from the dataset being an-alyzed, and provides multiple data-driven perspectives to the ana-lyst, which eases their process and also adds depth and robustnessto their exploration. Finally, the interaction patterns with the pro-totype interface indicate that visual analytics is successful in re-centering the analyst in the grounded theory methodology.
When examining the visualizations and data representations thatthe participants did not find useful, we see a common attributeamong them: visual overload. Overview visualizations of parts ofspeech are dense representations, given the high incidence of, say,nouns and verbs in an English-language dataset. Highlighting allthe nouns in a transcript creates a considerable number of elementsin the overview that the analyst has no direct way of filtering toidentify, say, “concepts of interest”. While the information con-tent overview offers a parallel (and coordinated) visualization thatmay potentially show concepts of interest, participant feedback in-dicated that this was not very helpful. This is mainly due to thelimits of our ability in keeping track of too many visual parame-ters: research has shown that filtered views are easier to visuallyparse than combined views [HEH09].
The two overviews that the participants found useful were thetranscript overview, and the word cloud. The word cloud repre-sentation is directly actionable because each element is a wordthat holds inherent meaning to the analyst, as opposed to a graph-ical abstraction common in overview representations. Also, theword cloud and transcript overviews were the only representa-tions that could be filtered: the word cloud could be filtered byselecting a block of text or a particular code, while the transcriptoverview could be filtered by selecting a word from the word cloud.The parts-of-speech/named-entity highlighting and the informationcontent overviews did not have an additional filter that participantscould use to prune the number of visual elements.
In fact, both these overview representations use metrics thatcould be perceived as either too generic or too extraneous to thedata to be used by themselves. For instance, the corpus used tocalculate information content may be too generic to be useful inanalyzing text that is domain-specific. On the other hand, whilegrammatical constructs such as parts of speech focus more on syn-tactic structures, grounded theory can be said to focus on semanticsand pragmatics. Participant P5, a practitioner, had this to say in ex-plaining the difficulty he had with the information content overviewvisualizations: “I think rather than the frequency or scarceness ofwords, it’s more important to navigate some keywords that are re-lated to research questions.” Once again, this feedback is true forboth grounded theory and visual analytics: keep all representationstrue to the data being analyzed. Based on these observations, wepropose the following general guidelines for integrating visual an-alytics with grounded theory to support qualitative analysis:
Suggest connections based on contextual and semantic relation-ships: Coordination between multiple views of the dataset is a key
element of interactive visualization. In qualitative analysis, how-ever, the breadth-first search of the novice and the detail-orientedscrutiny of the expert can both be tempered by suggesting explo-rations. This can include a list of words that occur significantlywithin a code, words common to two selected codes, or even wordsthat exhibit synonymy or hypernymy. The goal is to suggest se-mantic and conceptual relationships, giving the analyst the controlto accept or dismiss them.
Support querying of causal and semantic relationships: Text datais inherently unstructured, and thus difficult to abstract into visual-izations that illustrate relationships. However, providing multiplefilters to the analyst can help them identify causal and semanticrelationships. Boolean operations between filters would be highlybeneficial, for instance “all verbs related to a particular require-ment”, or “all adjectives that describe a particular concept” are fil-ters that use the syntactic structure of the text to expose concepts.Filtering for phrases that imply causal connections, such as “be-cause of”, “due to”, “and therefore” etc. are part of existing meth-ods used in qualitative coding to identify themes [RB03].
Overlay metadata based on domain-specific rather than extrin-sic measures: As seen in the case of our information content viewsand participant feedback, it is better to represent metadata that is in-herent to the given text data, rather than calculated from an externalcorpus. This guideline needs further exploration, however, to ver-ify if a domain-specific metric, while still extraneous, could still beuseful in exploring measures of “interestingness” and “connected-ness”. For instance, when exploring a dataset of a technical designdiscussion, engineering ontologies could be used to get a sense ofspecificity of the discussion.
Informed by visual analytics practices, our design introduces aprototype and set of guidelines to aid grounded theory using visualanalytics. Our findings with interaction patterns using this proto-type serves as a starting point for future research and design.
8. Conclusion
In this work, we reviewed the grounded theory method and identi-fied requirements to aid the exploration of text data to identify andcode concepts. Drawing from the field of visual analytics, we ad-dressed these requirements through the use of computational toolsand visualization techniques. We implemented these techniques inthe form of a prototype and evaluated it with a series of open codingtasks using novice and experienced practitioners of qualitative anal-ysis. Our findings suggest that the integration of visual analyticswith grounded theory re-centers the analyst in the process, and thusholds promise for qualitative data analysis. We then suggest guide-lines for designing visual analytics tools to support the groundedtheory method. In future work, we propose further evaluation withlongitudinal studies using expert participants. We also plan to eval-uate domain-specific metrics that are intrinsic to the dataset to filterand explore the data, using more sophisticated filtering techniques.
9. Acknowledgments
This work is supported by the U.S. National Science Foundationunder grant IIS-1422341. Any opinions, findings, and conclusionsexpressed in this material are those of the authors and do not nec-essarily reflect the views of the sponsors.
S. Chandrasegaran, S. K. Badam, L. Kisselburgh, K. Ramani, & N.Elmqvist / Supporting Grounded Theory Practice with Visual Analytics
References[AKV∗14] ALEXANDER E., KOHLMANN J., VALENZA R., WITMORE
M., GLEICHER M.: Serendip: Topic model-driven visual exploration oftext corpora. In Proceedings of the IEEE Conference on Visual AnalyticsScience and Technology (2014), pp. 173–182. 3
[AS] ADAMS R. S., SIDDIQUI J.: Purdue DTRS – Design ReviewConversations Database XRoads. Tech. rep., Purdue University, WestLafayette, IN. 6
[BB15] BRATH R., BANISSI E.: Using text in visualizations for mi-cro/macro readings. In Proceedings of the ACM Intelligent User Inter-faces Workshop on Visual Text Analytics (2015). 4
[BJB06] BRINGER J. D., JOHNSTON L. H., BRACKENRIDGE C. H.:Using computer-assisted qualitative data analysis software to develop agrounded theory project. Field methods 18, 3 (2006), 245–266. 3
[BNJ03] BLEI D. M., NG A. Y., JORDAN M. I.: Latent dirichlet allo-cation. Journal of machine Learning research 3, Jan (2003), 993–1022.4
[BOH11] BOSTOCK M., OGIEVETSKY V., HEER J.: D3: Data-drivendocuments. IEEE Transactions on Visualization and Computer Graphics17, 12 (2011), 2301–2309. 5
[Bor03] BORGATTI S.: Introduction to grounded theory. www.analytictech.com/mb870/introtoGT.htm, 2003. updatedDec 2003; accessed June 22 2016. 4
[Bri92] BRILL E.: A simple rule-based part of speech tagger. In Proceed-ings of the Workshop on Speech and Natural Language (1992), pp. 112–116. 4
[CAG13] CORRELL M. A., ALEXANDER E. C., GLEICHER M.: Quan-tity estimation in visualizations of tagged text. In Proceedings of theACM Conference on Human Factors in Computing Systems (2013),pp. 2697–2706. 4
[CBGG∗09] CHANG J., BOYD-GRABER J. L., GERRISH S., WANG C.,BLEI D. M.: Reading tea leaves: How humans interpret topic models.In Proceedings of the International Conference on Neural InformationProcessing Systems (2009), vol. 31, pp. 1–9. 9
[CCP09] COLLINS C., CARPENDALE S., PENN G.: DocuBurst: Visu-alizing document content using language structure. Computer GraphicsForum 28, 3 (2009), 1039–1046. 3
[Cha06] CHARMAZ K.: Constructing Grounded Theory: A PracticalGuide through Qualitative Analysis. Sage, 2006. 2
[CS90] CORBIN J. M., STRAUSS A.: Grounded theory research: Proce-dures, canons, and evaluative criteria. Qualitative sociology 13, 1 (1990),3–21. 2, 3, 4
[CT05] COOK K. A., THOMAS J. J.: Illuminating the Path: The Re-search and Development Agenda for Visual Analytics. IEEE Press, 2005.2, 3, 4
[CVW09] COLLINS C., VIEGAS F. B., WATTENBERG M.: Parallel tagclouds to explore and analyze faceted text corpora. In IEEE Symposiumon Visual Analytics Science and Technology (2009), pp. 91–98. 3
[Dey05] DEY I.: Qualitative Data Analysis: A User-Friendly Guide forSocial Scientists, 2 ed. Routledge, 2005. 2
[Dil12] DILLON D. R.: Grounded Theory and Qualitative Research.Blackwell Publishing Ltd, 2012. 2
[DYW∗13] DOU W., YU L., WANG X., MA Z., RIBARSKY W.: Hierar-chicaltopics: Visually exploring large text collections using topic hierar-chies. IEEE Transactions on Visualization and Computer Graphics 19,12 (2013), 2002–2011. 3
[ESS92] EICK S. G., STEFFEN J. L., SUMNER E. E.: Seesoft—a toolfor visualizing line oriented software statistics. IEEE Transactions onSoftware Engineering 18, 11 (1992), 957–968. 3, 5
[FGM05] FINKEL J. R., GRENAGER T., MANNING C.: Incorporatingnon-local information into information extraction systems by gibbs sam-pling. In Proceedings of the Annual Meeting of the Association for Com-putational Linguistics (2005), pp. 363–370. 4, 6
[GJG∗15] GAD S., JAVED W., GHANI S., ELMQVIST N., EWING T.,HAMPTON K. N., RAMAKRISHNAN N.: Themedelta: dynamic segmen-tations over temporal topic models. IEEE Transactions on Visualizationand Computer Graphics 21, 5 (2015), 672–685. 3
[HEH09] HUANG W., EADES P., HONG S.-H.: Measuring effectivenessof graph visualizations: A cognitive load perspective. Information Visu-alization 8, 3 (2009), 139–152. 10
[KAF∗08] KEIM D., ANDRIENKO G., FEKETE J.-D., GÖRG C.,KOHLHAMMER J., MELANÇON G.: Visual analytics: Definition, pro-cess, and challenges. In Information visualization. Springer, 2008,pp. 154–175. 3
[KJW∗14] KOCH S., JOHN M., WÖRNER M., MÜLLER A., ERTLT.: VarifocalreaderâATin-depth visual analysis of large text documents.IEEE Transactions on Visualization and Computer Graphics 20, 12(2014), 1723–1732. 3
[LT10] LINDLOF T. R., TAYLOR B. C.: Qualitative communication re-search methods. Sage, 2010. 1
[MH94] MILES M. B., HUBERMAN A. M.: Qualitative Data Analysis:An Expanded Sourcebook. Sage Publishers, 1994. 2
[Mil95] MILLER G. A.: Wordnet: A lexical database for english. Com-munications of the ACM 38, 11 (1995), 39–41. 6
[MS99] MANNING C., SCHÜTZE H.: Foundations of Statistical NaturalLanguage Processing. MIT Press, 1999. 3
[Pat99] PATTON M. Q.: Enhancing the quality and credibility of qualita-tive analysis. Health services research 34, 5 Pt 2 (1999), 1189. 3
[PC05] PIROLLI P., CARD S.: The sensemaking process and leveragepoints for analyst technology as identified through cognitive task analy-sis. In Proceedings of international conference on intelligence analysis(2005), vol. 5, pp. 2–4. 2, 3
[RB03] RYAN G. W., BERNARD H. R.: Techniques to identify themes.Field methods 15, 1 (2003), 85–109. 4, 10
[Res95] RESNIK P.: Using information content to evaluate semantic sim-ilarity in a taxonomy. In Proceedings of the International Joint Confer-ences on Artificial Intelligence (1995), pp. 448–453. 4
[RS10] REHUREK R., SOJKA P.: Software framework for topic mod-elling with large corpora. In Proceedings of the LREC Workshop on NewChallenges for NLP Frameworks (2010), pp. 45–50. 6
[SC] STRAUSS A., CORBIN J.: Grounded theory methodology: anoverview. In Handbook of Qualitative Research, Denzin N. K., LincolnY. S., (Eds.). 1, 2
[SGL08] STASKO J., GÖRG C., LIU Z.: Jigsaw: supporting investigativeanalysis through interactive visualization. Information visualization 7, 2(2008), 118–132. 3
[SOK∗16] STROBELT H., OELKE D., KWON B. C., SCHRECK T.,PFISTER H.: Guidelines for effective usage of text highlighting tech-niques. IEEE Transactions on Visualization and Computer Graphics 22,1 (2016), 489–498. 4
[SS14] SIEVERT C., SHIRLEY K. E.: Ldavis: A method for visualizingand interpreting topics. In Proceedings of the workshop on interactivelanguage learning, visualization, and interfaces (2014), pp. 63–70. 9
[TKMS03] TOUTANOVA K., KLEIN D., MANNING C. D., SINGER Y.:Feature-rich part-of-speech tagging with a cyclic dependency network.In Proceedings of the Conference of the North American Chapter of theAssociation for Computational Linguistics on Human Language Tech-nology (2003), pp. 173–180. 6
[Wat02] WATTENBERG M.: Arc diagrams: Visualizing structure instrings. In IEEE Symposium on Information Visualization (2002),pp. 110–116. 3
S. Chandrasegaran, S. K. Badam, L. Kisselburgh, K. Ramani, & N.Elmqvist / Supporting Grounded Theory Practice with Visual Analytics
[WHA07] WILLETT W., HEER J., AGRAWALA M.: Scented widgets:Improving navigation cues with embedded visualizations. IEEE Trans-actions on Visualization and Computer Graphics 13, 6 (2007), 1129–1136. 4
[WLS∗10] WEI F., LIU S., SONG Y., PAN S., ZHOU M. X., QIAN W.,SHI L., TAN L., ZHANG Q.: Tiara: a visual exploratory text analyticsystem. In Proceedings of the ACM International Conference on Knowl-edge Discovery and Data Mining (2010), pp. 153–162. 3
[WPAM15] WOODS M., PAULUS T., ATKINS D. P., MACKLIN R.:Advancing qualitative research using qualitative data analysis software(qdas)? reviewing potential versus practice in published studies using at-las. ti and nvivo, 1994–2013. Social Science Computer Review 34, 5(2015), 597–619. 3
[WV08] WATTENBERG M., VIÉGAS F. B.: The Word Tree, an interac-tive visual concordance. IEEE Transactions on Visualization and Com-puter Graphics 14, 6 (2008), 1221–1228. 3


![Integrating Visual Analytics Support for Grounded Theory ... · Figure 2: The stages in grounded theory, from Dillon [Dil12]. Computer-Aided Qualitative Data Analysis Software (CAQ-DAS)](https://static.documents.pub/doc/80x56/5fd726452498142a9f5cd3dc/integrating-visual-analytics-support-for-grounded-theory-figure-2-the-stages.jpg)


