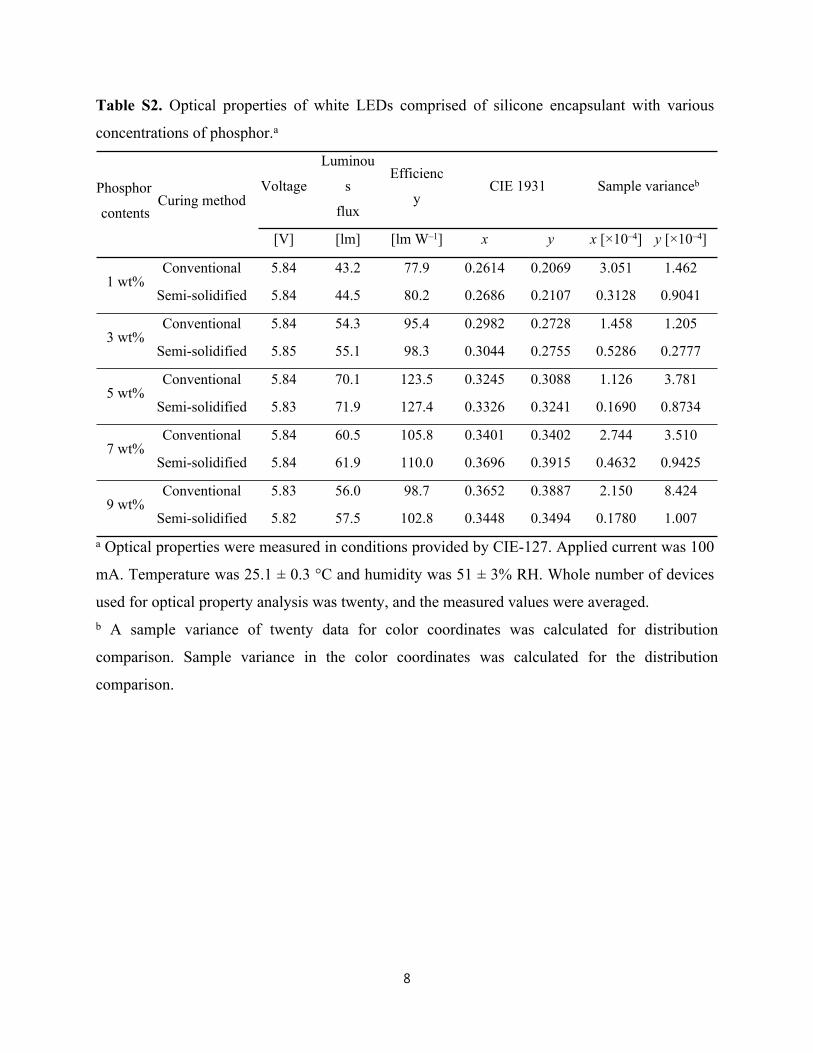
a Optical properties were measured in conditions provided by CIE-127. Applied current was 100
mA. Temperature was 25.1 ± 0.3 °C and humidity was 51 ± 3% RH. Whole number of devices
used for optical property analysis was twenty, and the measured values were averaged.b A sample variance of twenty data for color coordinates was calculated for distribution
comparison. Sample variance in the color coordinates was calculated for the distribution
comparison.
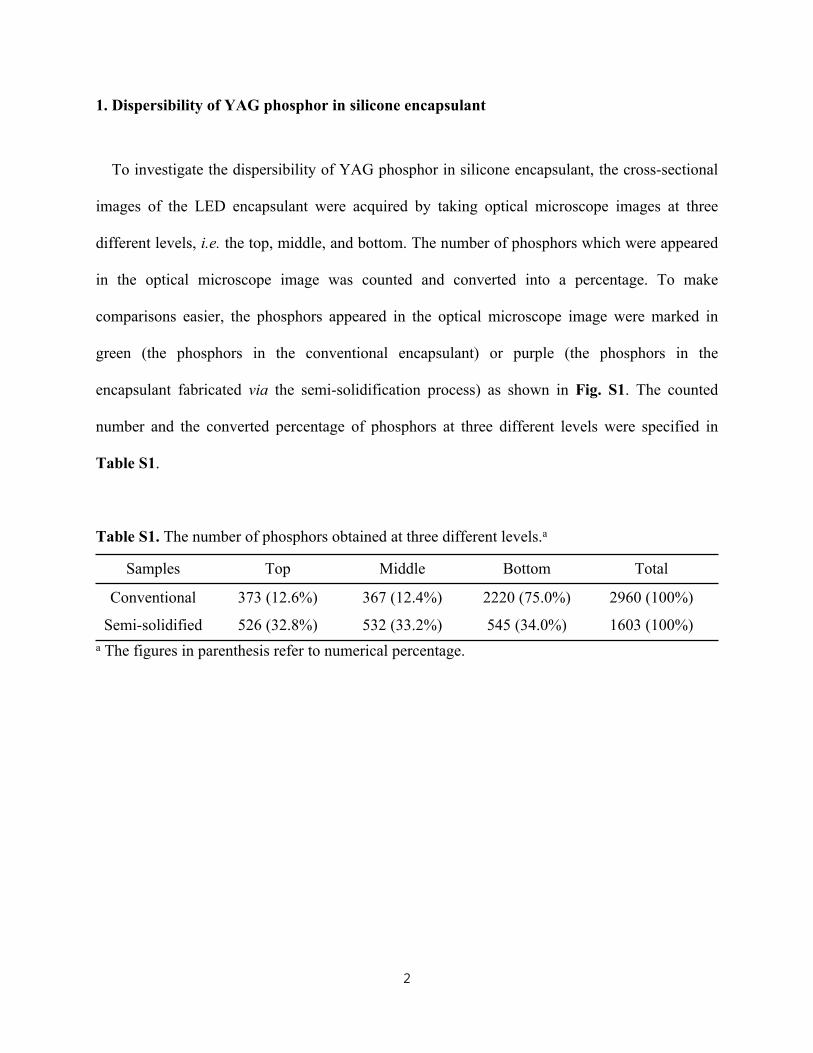
8
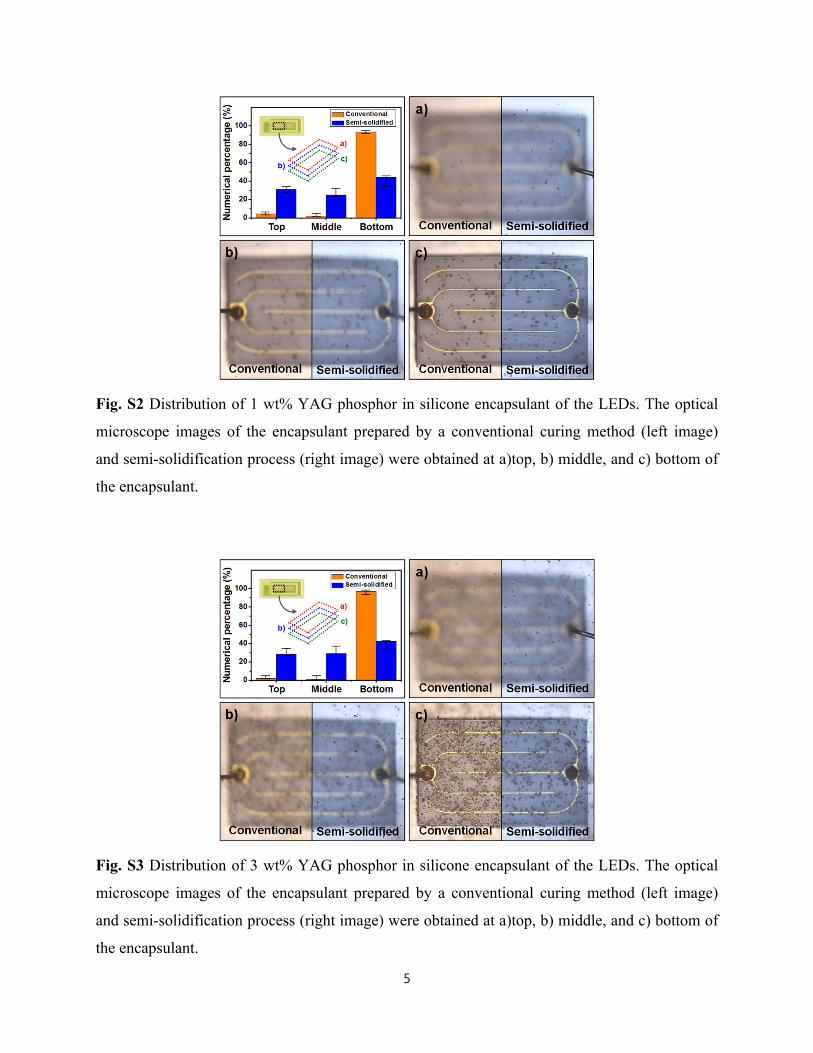
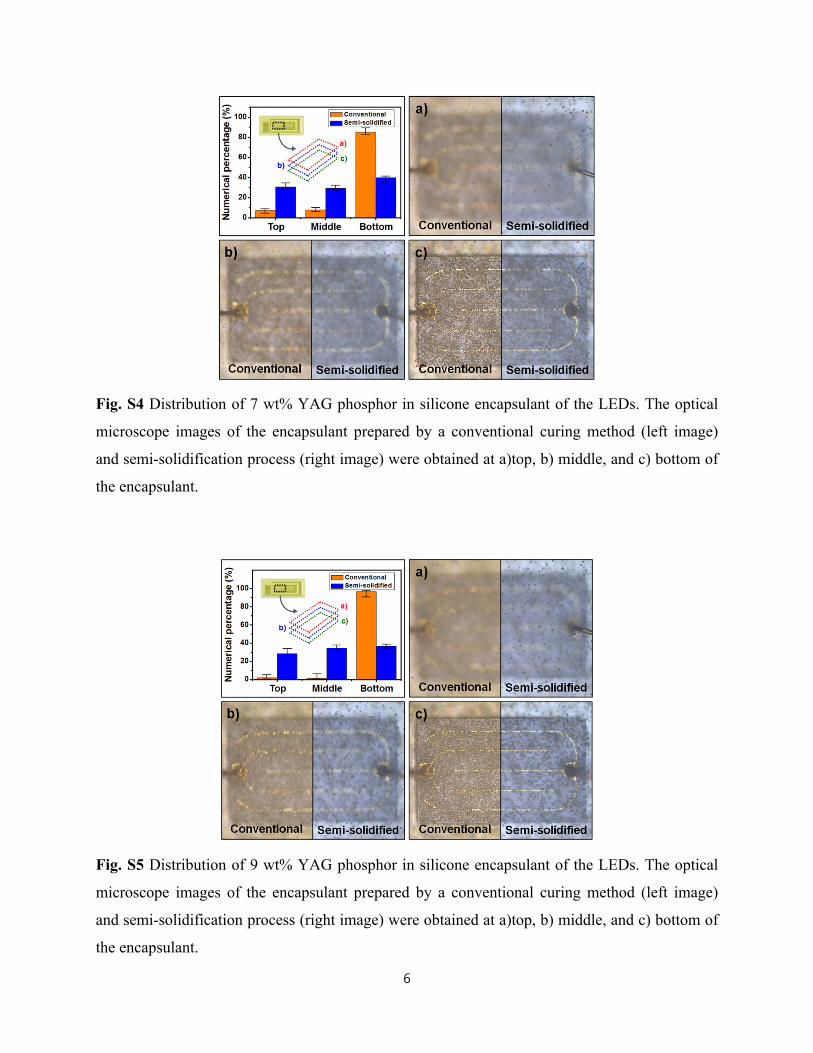
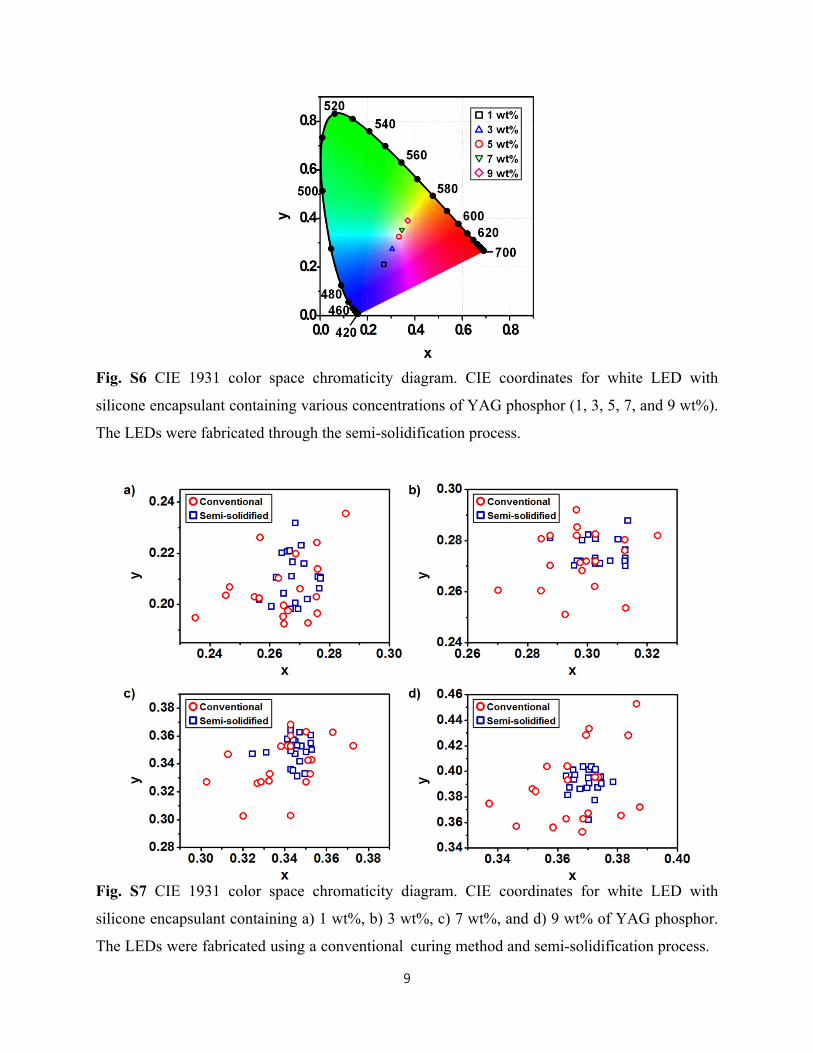
Fig. S6 CIE 1931 color space chromaticity diagram. CIE coordinates for white LED with
silicone encapsulant containing various concentrations of YAG phosphor (1, 3, 5, 7, and 9 wt%).
The LEDs were fabricated through the semi-solidification process.
Fig. S7 CIE 1931 color space chromaticity diagram. CIE coordinates for white LED with
silicone encapsulant containing a) 1 wt%, b) 3 wt%, c) 7 wt%, and d) 9 wt% of YAG phosphor.
The LEDs were fabricated using a conventional curing method and semi-solidification process.
9
3. Photographs of the LED
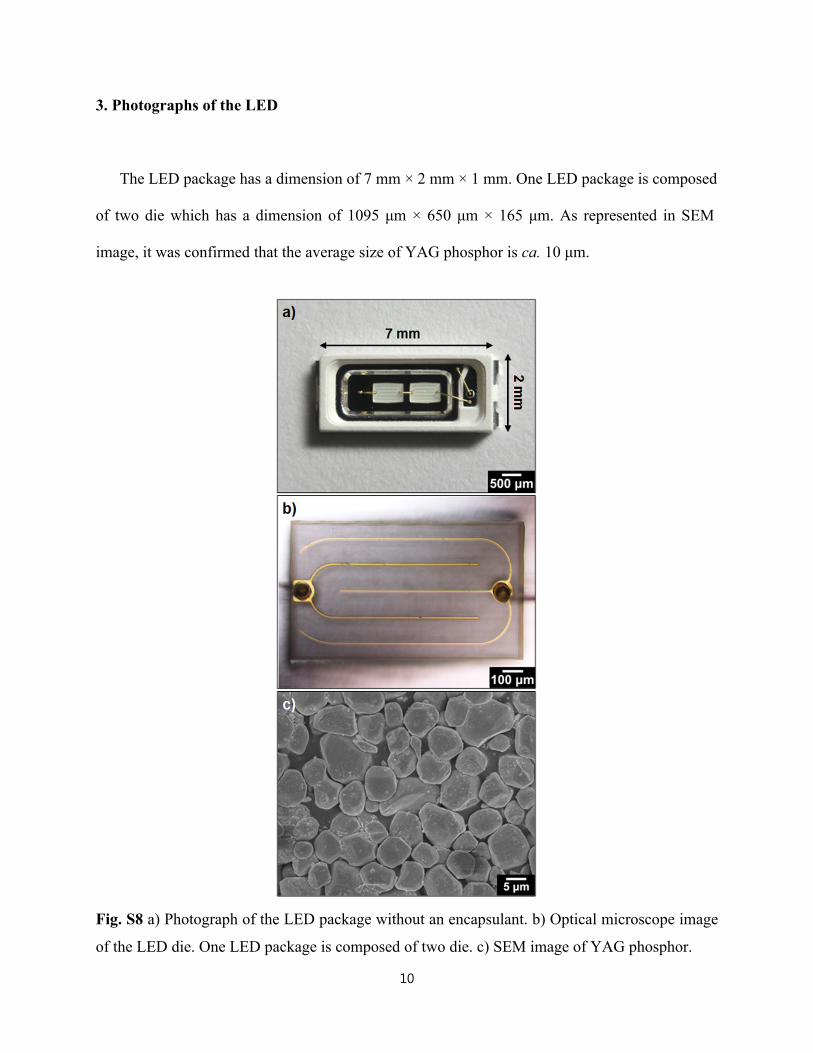
The LED package has a dimension of 7 mm × 2 mm × 1 mm. One LED package is composed
of two die which has a dimension of 1095 μm × 650 μm × 165 μm. As represented in SEM
image, it was confirmed that the average size of YAG phosphor is ca. 10 μm.
Fig. S8 a) Photograph of the LED package without an encapsulant. b) Optical microscope image
of the LED die. One LED package is composed of two die. c) SEM image of YAG phosphor.
10
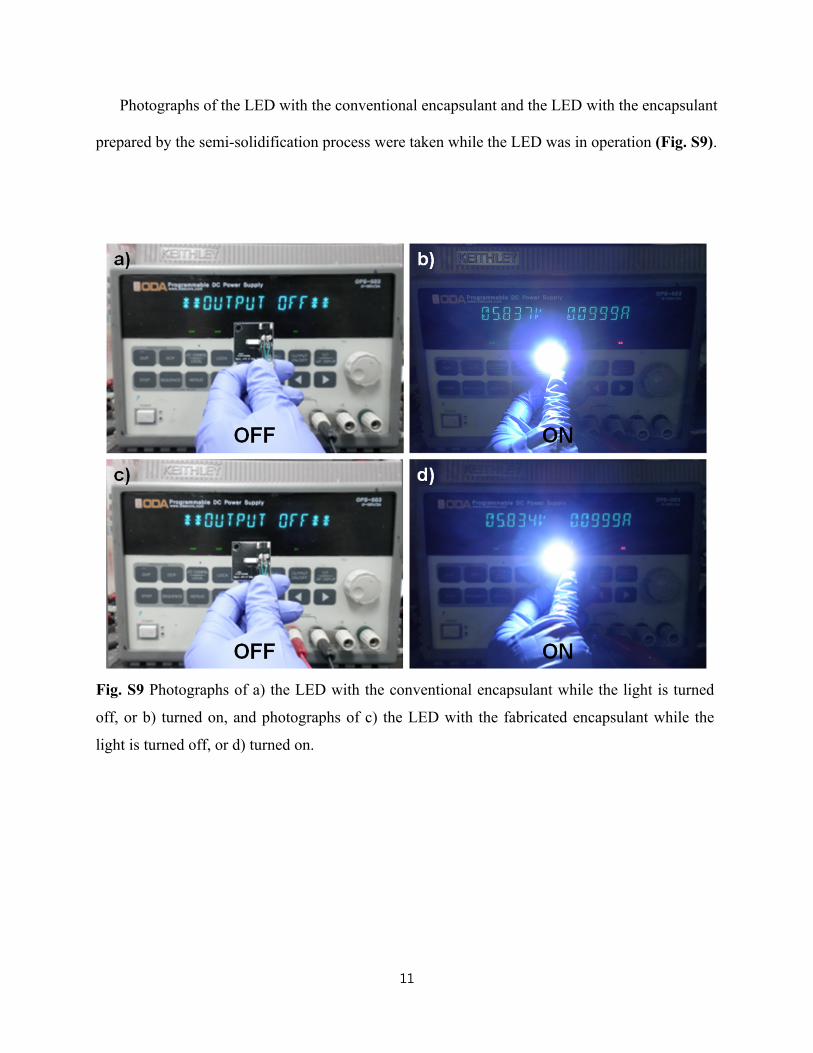
Photographs of the LED with the conventional encapsulant and the LED with the encapsulant
prepared by the semi-solidification process were taken while the LED was in operation (Fig. S9).
Fig. S9 Photographs of a) the LED with the conventional encapsulant while the light is turned
off, or b) turned on, and photographs of c) the LED with the fabricated encapsulant while the
light is turned off, or d) turned on.
11
4. Reliability test of white LEDs
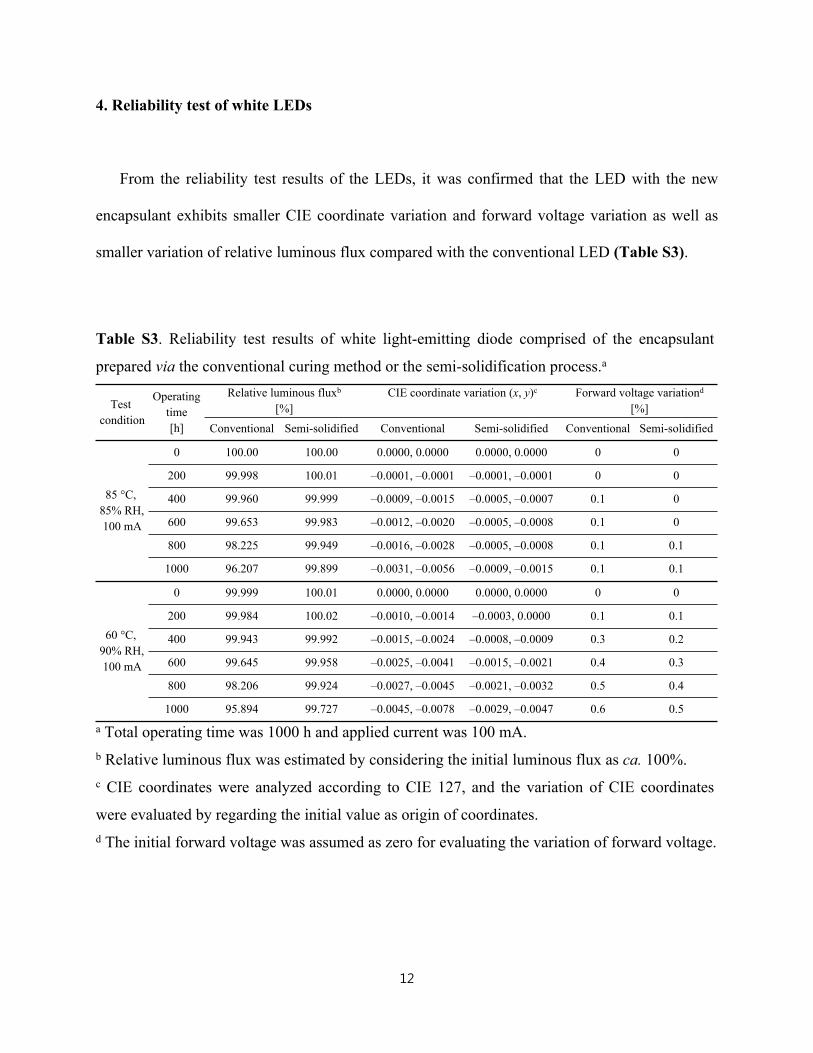
From the reliability test results of the LEDs, it was confirmed that the LED with the new
encapsulant exhibits smaller CIE coordinate variation and forward voltage variation as well as
smaller variation of relative luminous flux compared with the conventional LED (Table S3).
Table S3. Reliability test results of white light-emitting diode comprised of the encapsulant
prepared via the conventional curing method or the semi-solidification process.a
Relative luminous fluxb
[%]CIE coordinate variation (x, y)c Forward voltage variationd
1000 95.894 99.727 –0.0045, –0.0078 –0.0029, –0.0047 0.6 0.5a Total operating time was 1000 h and applied current was 100 mA.b Relative luminous flux was estimated by considering the initial luminous flux as ca. 100%.c CIE coordinates were analyzed according to CIE 127, and the variation of CIE coordinates
were evaluated by regarding the initial value as origin of coordinates.d The initial forward voltage was assumed as zero for evaluating the variation of forward voltage.