1
Supporting Information for
Metabolism, survival, and gene expression of Pseudomonas putida to hematite
nanoparticles mediated by surface-bound humic acid
Kai Ouyanga, Sharon L. Walkerb, Xiao-Ying Yuc, Chun-Hui Gaoa, Qiaoyun Huanga,
Peng Caia,*
aState Key Laboratory of Agricultural Microbiology, College of Resources and
Environment, Huazhong Agricultural University, Wuhan 430070, China
bDepartment of Chemical and Environmental Engineering, University of California,
Riverside, California 92521, USA
cEarth & Biological Sciences Directorate, Pacific Northwest National Laboratory,
Richland, WA 99354 USA
*Corresponding author: Peng Cai
State Key Laboratory of Agricultural Microbiology
Huazhong Agricultural University, Wuhan, China
Phone: +86 27 87671033; Fax: +86 27 87280670
E-mail address: [email protected]
Electronic Supplementary Material (ESI) for Environmental Science: Nano.This journal is © The Royal Society of Chemistry 2018
2
Additional Materials and Methods
Hematite Synthesis. The hematite nanoparticles were synthesized by slowly
dripping 80 mL of 1 M ferric nitrate solution at the speed of 0.5 mL min-1 into 1 L of
boiling distilled Milli-Q water while stirring vigorously. After the dripping was
finished, the resulting suspension was removed from the heat and cooled overnight.
The suspension was then dialyzed in standard grade Cellulose dialysis membranes
(1000 MWCO, Spectra Por) against MilliQ water until the conductivity remained
constant. The suspension was centrifuged (Eppendorf centrifuge 5430R, Germany) at
5000 g for 30 min, and the supernatant was discarded. Finally, the concentrated NPs
were vacuum freeze-dried and ground to uniformity, and then stored in suspensions at
4 ◦C in dark.
Method for Humic acid (HA) Purification1. HA of 100 g was dissolved into 1 L
of 0.1 M NaOH after mixing (180 rpm) for 12 h at room temperature (adjusting the
solution to pH 10 before stirring). Na2SO4·10H2O was added into the resultant
solution to remove the possible inorganic colloids overnight. The solution was then
centrifuged at 6000 g for 15 min and the supernatant was collected for acidification
(pH 1-1.5 with 3 M HCl) to obtain the HA fraction. The acidified solution was
centrifuged at 6000 g for 15 min and the precipitate was collected and mixed with 100
mL of mixed acid (0.5 mL concentrated HCl + 0.5 mL 48% HF + 99 mL H2O). The
mixed suspension was shaken for 5 h and followed by centrifugation at 6000 g for 15
min. The precipitate obtained was rinsed twice with ultrapure water from a Milli-Q
system, centrifuged, vacuum-dried at 40 °C, gently ground to pass through a 100-
mesh sieve, and stored for subsequent use.
The Composition of Modified Minimal Davis (MMD) Media. Basic
3
characterization and all toxicological assays of NPs were conducted on cultures
grown in an environmentally-relevant media, Modified Minimal Davis (MMD) media
[1 L of H2O containing 0.7 g of K2HPO4, 0.2 g of KH2PO4, 0.66 g of (NH4)2SO4, 0.5
g of sodium citrate, 0.1 g of MgSO4·7H2O, and 3.31 g of D-glucose at pH 6.9].2 The
MMD media was prepared and autoclaved. The D-glucose solution was autoclaved
separately.
ROS Measurement. The generation of intracellular ROS was determined using the
fluorescence probe 2’,7’-dichlorodihydrofluorescein diacetate (DCFH-DA, Sigma-
Aldrich, USA) and followed the procedure described by Saison et al.3 Briefly, 1.5 mL
of the treated (expose to NPs) or untreated (control, without NPs) cell suspensions
were collected after centrifugation (5000g, 10 min), washed twice with PBS buffer
solution, incubated with 10 mM DCFH-DA for 30 min in the dark, and washed with
PBS again. Since DCFH-DA could be transformed into 2’,7’-
dichlorodihydrofluorescein (H2DCF) by intracellular esterase if they enter cells.
When intracellular ROS generated, 2’,7’-dichlorofluorescein (DCF) would be
converted from H2DCF. Thus the fluorescence intensity (FI) of DCF was measured
with a fluorescence pate reader using an excitation of 480 nm and an emission of 520
nm, which indicated the extent of ROS generation. The formula to evaluate ROS
levels followed the method proposed by Hong et al.4 Changes in ROS levels as
compared to the control were evaluated using eq 1.
Relative ROS level (%) = (FINP / FIControl) × 100 (1)
4
where FINP and FIControl represent the mean fluorescence intensity of DCF from the
cell suspensions system treated with NPs and untreated system, respectively.
MDA Measurement. Malondialdehyde (MDA), a major end-product and an index
of lipid peroxidation, was measured using the thiobarbituric acid method.5,6 The
treated P. putida cells were collected and incubated with 2 ml of 10% (w/v)
trichloroacetic acid for 1 h at 25 °C, and then 1 ml of 0.6% (w/v) 2-thiobarbituric acid
(in 10% trichloroacetic acid) was added. The mixture was heated for 15 min at 100 °C
in a water bath and cooled quickly to stop the reaction. The mixture was centrifuged
at 5000 rpm for 15 min and the supernatant was collected. The absorbance was read at
532, 600 and 450 nm. MDA level was calculated by {6.45×(OD532-OD600)-
0.56×OD450} × 3 (reaction volume)/total cell number (108 cells). The relative MDA
rates were calculated by the relative MDA contents of the P. putida cells under the
different treatments (expose to hematite or hematite-HA complexes) compared to the
blank controls (without NP), respectively.
Quantitative real-time PCR analyses. The quantitative polymerase chain reaction
(qPCR) primers were designed by using online software tools Primer 3 and Beacon
Designer 7. The primer sequences with the product lengths are listed in Table S1. The
qPCR was performed in a real-time PCR system (ABI ViiATM 7 ). The reaction mix
was prepared with 5 μL iTaqTM Universal SYBR green supermix (BIO-RAD), 2μL
each of forward and reverse primers, 1μL cDNA, and 2μL of nuclease-free water. The
qPCR program for the reaction was 95 °C for 30 s, 40 cycles of 95 °C for 10 s, and 55
°C for 20 s, with a final temperature of 60 °C for 35 s. To confirm specific
5
amplification of the PCR product, melting curve analysis was carried out for 40min.
The experiment was carried out in 3 biological replicates, and each replicate was
analyzed in duplicate. Constitutively expressed gapA genes were used as an internal
control. A standard graph was plotted for each gene with gapA as the endogenous
control. Fold change in gene expression was calculated with respect to control, and
statistical significance was determined at p<0.05.
Additional Results and Discussion
Characterization of the Hematite Nanoparticles and Hematite Nanoparticles-HA
Complexes. The powder X-ray diffraction (XRD) pattern of the synthetic
nanoparticles (SI Figure SI-2) revealed that only hematite phase was present. As
expected, the crystal structure of hematite was not changed after modification with
HA. The average diameter of the individual uncoated hematite nanoparticles
measured by TEM was 10±5 nm (SI Figure SI-1). In contrast to the clear surfaces and
sharp edges of the uncoated hematite (SI Figure SI-1A), the edges of hematite-
10%HA were less well defined likely due to the form of HA-coating. More generally,
the NP-HA complex exhibited a greater degree of aggregation than the uncoated NPs
(SI Figure SI-1B).
FTIR spectra of the hematite-HA complexes are shown in SI Figure SI-3. The
absorption bands in the range 400-750 cm-1 represent Fe-O vibration mode of
Fe2O3.7,8 The vibrational bands at around 3420 cm-1 and 1620 cm-1 corresponds to the
flexural vibration of hydroxyl groups. The strong peaks at 1384 cm-1 indicated rich
hydroxyl groups on the surfaces of bare hematite, however, the peak significantly
6
decreased after HA-coating. And a new peak around 1390 cm-1 appeared and
increased with the HA-coating, suggesting the formation of ferri-acetate complexation
between -COOH of HA and Fe of hematite.
7
Table S1. Sequence of quantitative PCR primers.
Primer name Sequence
ddcA forward 5’- TTGATGATGGCGTGGT
ddcA reverse 5’-ATTTCCGTGACCCACA
ppuI forward 5’-ATGCATAAACTTCGGGCA
ppuI reverse 5’-CATTTTCTCGACCCCCAC
qseB forward 5’-ACGTGATGATCCTCGACCTC
qseB reverse 5’-GGCTTGAGCAGGTAATCGTC
qseC forward 5’-GACAATCGGCGTATCCTGTT
qseC reverse 5’-ATCTGCACCTCCAACTCCAC
hfQ forward 5’-AAAGGGCATTCGCTACAAGA
hfQ reverse 5’-TGTAGACCATCTGGCTGACG
pp0806 forward 5’-GTCCCTTACCAGACCAACGA
pp0806 reverse 5’-TGGCACCAGTGTTATTTGGA
wbpL forward 5’-GCCATCGGTTTGCTGTATTT
wbpL reverse 5’-GCATGACCAGTGAGCCAGTA
wbpY forward 5’-AGTTCCATCCTCGGACTCCT
wbpY reverse 5’-AGCCATGATACCCACTGAGG
wbpZ forward 5’-CCGACATTGTGCACTACCAC
wbpZ reverse 5’-CAACGGCTGATACAGCTTGA
OmlA forward 5’-CACCAATCGTTGGGATTACC
OmlA reverse 5’-CAGACAGGCTGACCAGTTGA
8
fepA forward 5’-GTGAGTGCCGGGTACAAGTT
fepA reverse 5’-GATATTCAGCGCAGCAAACA
murF forward 5’-AATGTGCTGGGTGAACACAA
murF reverse 5’-CGCACATAGAGGTGGGATTT
oprD forward 5’-GCTGAAAGTGGGTGACCAGT
oprD reverse 5’-CAGTCAGGCTGGTGAAGTGA
fpr forward 5’-AAACCTACGAGCGCTTTGAA
fpr reverse 5’-GGTCACGGTCGGGTAGTAGA
soxR forward 5’-TGTCTGCGCTGCACTTCTAC
soxR reverse 5’-TAACGGCTGAAGGCTTGTTT
sodA forward 5’-CAGCCTGTTCTGGACTGTCA
soda reverse 5’-CTTTGGTGAAAGCCTCCTTG
sodB forward 5’-GACCCTGGAAGAGATCGTCA
sodB reverse 5’-CTTGTCGAAGGAACCGAAAG
ahpC forward 5’-AGGCCAGATCAAGATTGTCG
ahpC reverse 5’-CTTCGCCTTCTTTCCACTTG
9
Table S2. The 24 h LC50 of test NPs to P. putida, the magnitude of interaction
energy barrier between hematite NPs and cell surface
Test substancesLC50
(mg L-1)
energy barrier
(kTa)
hematite 23.58 6.93
hematite-0.2%HA 197.29 7.26
hematite-1%HA 724.83 7.38
hematite-2%HA 987.59 7.65
hematite-10%HA 4774.23 8.91
10
Table S3. The peak time (PT), peak height (PH), growth rate constant (k) and
total heat output (Q) of Pseudomonas putida influenced by various nanoparticles
(The concentration of nanoparticles is 500 mg L-1.)
PT
(h)
PH
(µW)
Q
(J)
k
(min-1)R2
Control 9.8 372.2±1.7a 15.666±0.006a 0.452±0.005a 0.994
hematite-10%HA 10.4 361.4±0.8b 13.149±0.014b 0.437±0.001b 0.992
hematite-2%HA 11.3 357.8±0.7c 11.336±0.005c 0.440±0.006a 0.982
hematite-1%HA 11.8 355.2±0.2d 11.092±0.007d 0.387±0.005c 0.972
hematite-0.2%HA 12.9 348.7±0.5e 10.885±0.006e 0.376±0.006d 0.969
hematite 11.0 227.6±0.5f 10.438±0.006f 0.289±0.004e 0.941
11
Table S4. Statistical analysis of the relative ROS and MDA contents of the P.
putida cells under the different treatments (P<0.05).
Test substancesRelative ROS rate
(%)
Relative MDA rate
(%)
hematite 7622.2±715.5b 1122.9±10.3a
hematite-0.2%HA 9151.2±538.9a 953.5±15.9b
hematite-1%HA 7261.4±420.1b 905.8±28.5c
hematite-2%HA 5580.8±360.1c 706.8±4.1d
hematite-10%HA 1838.6±106.7d 488.7±9.3e
12
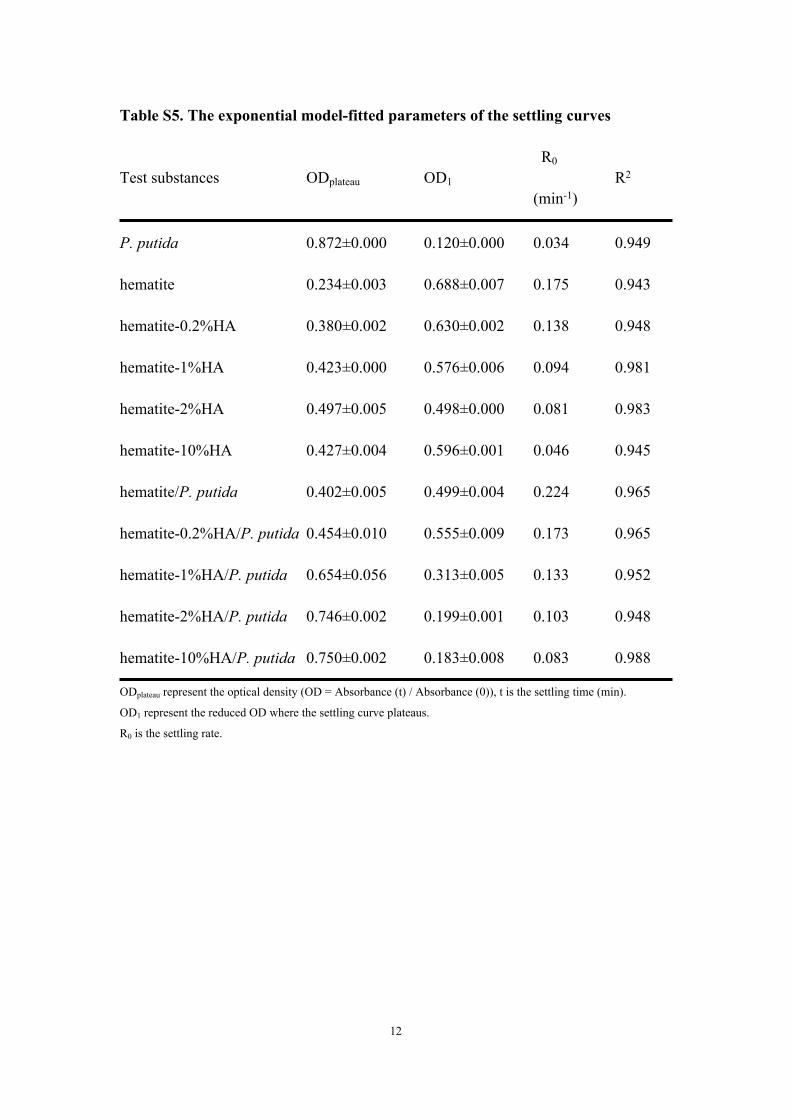
Table S5. The exponential model-fitted parameters of the settling curves
Test substances ODplateau OD1
R0
(min-1)R2
P. putida 0.872±0.000 0.120±0.000 0.034 0.949
hematite 0.234±0.003 0.688±0.007 0.175 0.943
hematite-0.2%HA 0.380±0.002 0.630±0.002 0.138 0.948
hematite-1%HA 0.423±0.000 0.576±0.006 0.094 0.981
hematite-2%HA 0.497±0.005 0.498±0.000 0.081 0.983
hematite-10%HA 0.427±0.004 0.596±0.001 0.046 0.945
hematite/P. putida 0.402±0.005 0.499±0.004 0.224 0.965
hematite-0.2%HA/P. putida 0.454±0.010 0.555±0.009 0.173 0.965
hematite-1%HA/P. putida 0.654±0.056 0.313±0.005 0.133 0.952
hematite-2%HA/P. putida 0.746±0.002 0.199±0.001 0.103 0.948
hematite-10%HA/P. putida 0.750±0.002 0.183±0.008 0.083 0.988
ODplateau represent the optical density (OD = Absorbance (t) / Absorbance (0)), t is the settling time (min).
OD1 represent the reduced OD where the settling curve plateaus.
R0 is the settling rate.
13
Figure S1 TEM images of (A) hematite, (B) hematite-HA complexes, and (C) P. putida.
(The scale bar for each image is 200 nm.)
B
C
A
14
20 30 40 50 60 700
500
1000
1500
2000
2500
3000
2 Theta (degree)
Inte
nsity
(cps
)
hematite-HA
hematite
Figure S2 XRD patterns of the hematite and hematite-HA complexes.
15
4000 3500 3000 2500 2000 1500 1000
a
b
c
d
10501384
1384
162023613420
Absorbance, cm-1
2920
e
Figure S3 FTIR spectra of (a) hematite-10%HA, (b) hematite-2%HA, (c) hematite-1%HA, (d)
hematite-0.2%HA, (e) hematite.
16
0
2
4
6
8
10
12
NP Concentration (mg L-1)5000200010005001005010510.5
Bi
ofilm
For
mat
ion,
OD 5
40 hematite - 10% HA hematite - 2% HA hematite - 1% HA hematite - 0.2% HA hematite
0
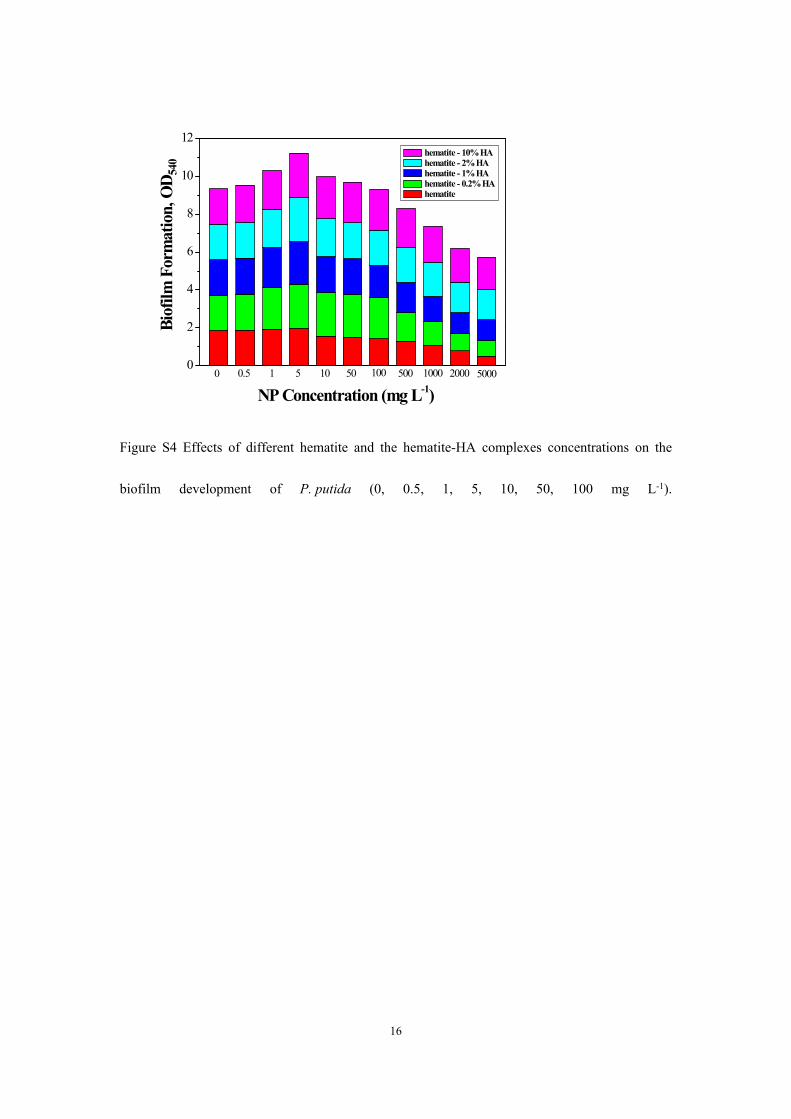
Figure S4 Effects of different hematite and the hematite-HA complexes concentrations on the
biofilm development of P. putida (0, 0.5, 1, 5, 10, 50, 100 mg L-1).
17
0 6 12 18 240
50
100
150
200
250
300
350
400
Hea
t flo
w (
W)
Time (h)
Control hematite - 10% HA hematite - 2% HA hematite - 1% HA hematite - 0.2% HA hematite
Reduced metabolic activity
Figure S5 The power-time curves of P. putida in the presence of hematite and the hematite-HA
complexes.
18
Figure S6 Fluorescent microscopy images of LIVE/DEAD stained P. putida grown for 24 h in the
(A) absence of hematite, presence of (B) hematite, (C) hematite-0.2%HA complexes, (D)
Live cells
A
P. putida
hematite
hematite-0.2%HA
hematite-1%HA
hematite-2%HA
hematite-10%HA
Live cells
Live cells
B
C
D
E
F
19
hematite-1%HA complexes, (E) hematite-2%HA complexes, (F) hematite-10%HA. (The scale bar
for each image is 20 µm; red-dead cells, green-live cells.)
20
0
2
4
6
Rel
ease
d ir
on io
n co
ncen
trat
ion
(mg
L-1
)
hematite - 1
0% HA
hematite - 2
% HA
hematite - 1
% HA
hematite
hematite - 0
.2% HA
A
2 3 4 50
15
30
45
60
75
90
B
Rel
ativ
e gr
owth
rat
e (%
)
Conc. of released Fe3+ (mg L-1)
Figure S7 (A) The dissolution of Fe3+ ions released from hematite and hematite-HA complex
systems in MMD medium. (B) The effect of released Fe3+ ions on the growth of P. putida KT2440.
Each data point is the average of three replicates, with error bars denoting the standard deviation.
The abscissa in (B) is the concentration of hematite-10%HA, hematite-2%HA, hematite-1%HA,
hematite-0.2%HA, and hematite, respectively, from left to right.
21
0 20 40 60 80 100 1200.2
0.4
0.6
0.8
1.0 A
Time (min)
A/A 0
hematite hematite - 0.2% HA hematite - 1% HA hematite - 2% HA hematite - 10% HA
0 20 40 60 80 100 1200.2
0.4
0.6
0.8
1.0
B
Time (min)
A/A 0
hematite/P. putida hematite - 0.2% HA/P. putida hematite -1% HA/P. putida hematite - 2% HA/P. putida hematite - 10% HA/P. putida
Figure S8 Settling curves of 50 mg L-1 of hematite and the hematite-HA complexes in the MMD
medium in the absence (A) or presence (B) of the P. putida cells. A/A0 is the ratio of absorbance
at 660 nm of the test suspension at a given settling time to its initial absorbance.
22
-4
0
4
8
25020050 100 150
Ne
t int
erac
tion
ener
gy (K
T)
Separation distance (nm)
hematite hematite - 0.2% HA hematite - 1% HA hematite - 2% HA hematite - 10% HA
0
Figure S9 Net interaction energy profiles between P. putida and hematite, hematite-HA complexes.
23
REFERENCES
(1) Lin, D. H.; Tian, X. L.; Li, T. T.; Zhang, Z. Y.; He, X.; Xing, B. S. Surface bound
humic acid increased Pb2+ sorption on carbon nanotubes. Environ. Pollut. 2012,
167, 138–47.
(2) Kaweeteerawat, C.; Ivask, A.; Liu, R.; Zhang, H. Y.; Chang, C. H.; Low-Kam, C.;
Fischer, H.; Ji, Z. X.; Pokhrel, S.; Cohen, Y.; Telesca, D.; Zink, J.; Madler, L.;
Holden, P. A.; Nel, A.; Godwin, H. Toxicity of metal oxide nanoparticles in
Escherichia coli correlates with conduction band and hydration energies. Environ.
Sci. Technol. 2015, 49, 1105−1112.
(3) Saison, C.; Perreault, F.; Daigle, J.; Fortin, C.; Claverie, J.; Morin, M.; Popovic, R.
Effect of core-shell copper oxide nanoparticles on cell culture morphology and
photosynthesis (photosystem II energy distribution) in the green alga,
Chlamydomonas reinhardtii. Aquat. Toxicol. 2010, 96, 109–114.
(4) Hong, Y.; Hu, H.; Xie, X.; Sakoda, A.; Sagehashi, M.; Li, F. Gramine-induced
growth inhibition, oxidative damage and antioxidant responses in freshwater
cyanobacterium Microcystis aeruginosa. Aquat. Toxicol. 2009, 91, 262–269.
(5) Gurr, J. R.; Wang, A. S. S.; Chen, C. H.; Jan, K. Y. Ultrafine titanium dioxide
particles in the absence of photoactivation can induce oxidative damage to
human bronchial epithelial cells. Toxicology 2005, 213, 66-73
(6) Kumari, S. S.; Varghese, A.; Muraleedharan, D.; Menon, V. P. Effect of vitamin E
on the severity of myocardial infarction induced by isoproterenol. Indian J. Med.
Res. 1989, 90, 468–471.
(7) Stuart, B. H. Infrared Spectroscopy: Fundamentals and Applications. (Wiley,
24
England, 2004), p. 143.
(8) Battisha, J. K.; Afify, H. H.; Ibrahim M. Synthesis of Fe2O3 concentrations and
sintering temperature on FTIR and magnetic susceptibility measured from 4 to
300 K of monolith silica gel prepared by sol–gel technique. J. Magn. Magn.
Mater. 2006, 306, 211-217.