S1 Supporting Information for Self-assembled Organic Nanocrystals with Strong Nonlinear Optical Response Shaked Rosenne, † Eran Grinvald, ‡ Elijah Shirman, † ⊥ Lior Neeman, ‡ Sounak Dutta, † Omri Bar-Elli, ‡ Regev Ben-Zvi, ║ Eitan Oksenberg, ║ Petr Milko, ± Vyacheslav Kalchenko, § Haim Weissman, † Dan Oron, ‡* and Boris Rybtchinski †* . Departments of † Organic Chemistry, ‡ Physics of Complex Systems, ║ Materials and Interfaces, ± Chemical Research Support and § Veterinary Resources, Weizmann Institute of Science, Rehovot, Israel ⊥ Current Address: School of Engineering and Applied Sciences, Harvard University, Cambridge, MA 02138, USA E-mail: [email protected]Materials and methods Solvents and reagents were purchased from commercial sources and used as received, unless otherwise specified. Organic solvents for spectroscopic studies were of spectroscopic or HPLC grade, dried over molecular sieves (3 Å), and filtered over 0.2 μm PTFE syringe filters prior to use. All procedures with air-sensitive compounds were performed under inert gas atmosphere (dried N 2 or Argon) using a glovebox (MBRAUN, Labmaster) or standard Schlenk techniques. Organic solvents used for these procedures were degassed with Argon and stored over molecular sieves (3 Å) in the glovebox. Water used for air-sensitive samples was degassed by the freeze-pump-thaw technique and kept in the glovebox as well. 1 H and 13 C NMR spectra were recorded at room temperature on 300MHz spectrometer (Bruker). 1 H and 13 C NMR chemical shifts (δ) are reported in parts per million (ppm) downfield from tetramethyl silane (TMS). 1 H NMR shifts are referenced to the residual hydrogen peak of CDCl3 (7.26 ppm). 13 C NMR shifts are referenced to the CDCl 3 peak (77.16 ppm). Coupling constants are reported in Hertz (Hz); splitting patterns are denoted s (singlet), t (triplet), q (quartet), m (multiplet) and br. (broad). Electrospray Ionization (ESI) Mass-Spectrometry was performed using Micromass Platform instrument. UV-vis absorption measurements were carried out on a Cary-5000 spectrometer (Varian).
Transcript
S1
Supporting Information for
Self-assembled Organic Nanocrystals with Strong Nonlinear Optical Response
Shaked Rosenne,† Eran Grinvald,‡ Elijah Shirman,†⊥ Lior Neeman,‡ Sounak Dutta,† Omri Bar-Elli,‡ Regev Ben-Zvi,║ Eitan Oksenberg,║ Petr Milko,± Vyacheslav Kalchenko,§
Haim Weissman,† Dan Oron,‡* and Boris Rybtchinski†*.
Departments of †Organic Chemistry, ‡Physics of Complex Systems, ║Materials and Interfaces, ±Chemical Research Support and §Veterinary Resources, Weizmann Institute of Science, Rehovot, Israel ⊥Current Address: School of Engineering and Applied Sciences, Harvard University, Cambridge, MA 02138, USA
Solvents and reagents were purchased from commercial sources and used as received, unless otherwise specified. Organic solvents for spectroscopic studies were of spectroscopic or HPLC grade, dried over molecular sieves (3 Å), and filtered over 0.2 µm PTFE syringe filters prior to use. All procedures with air-sensitive compounds were performed under inert gas atmosphere (dried N2 or Argon) using a glovebox (MBRAUN, Labmaster) or standard Schlenk techniques. Organic solvents used for these procedures were degassed with Argon and stored over molecular sieves (3 Å) in the glovebox. Water used for air-sensitive samples was degassed by the freeze-pump-thaw technique and kept in the glovebox as well.
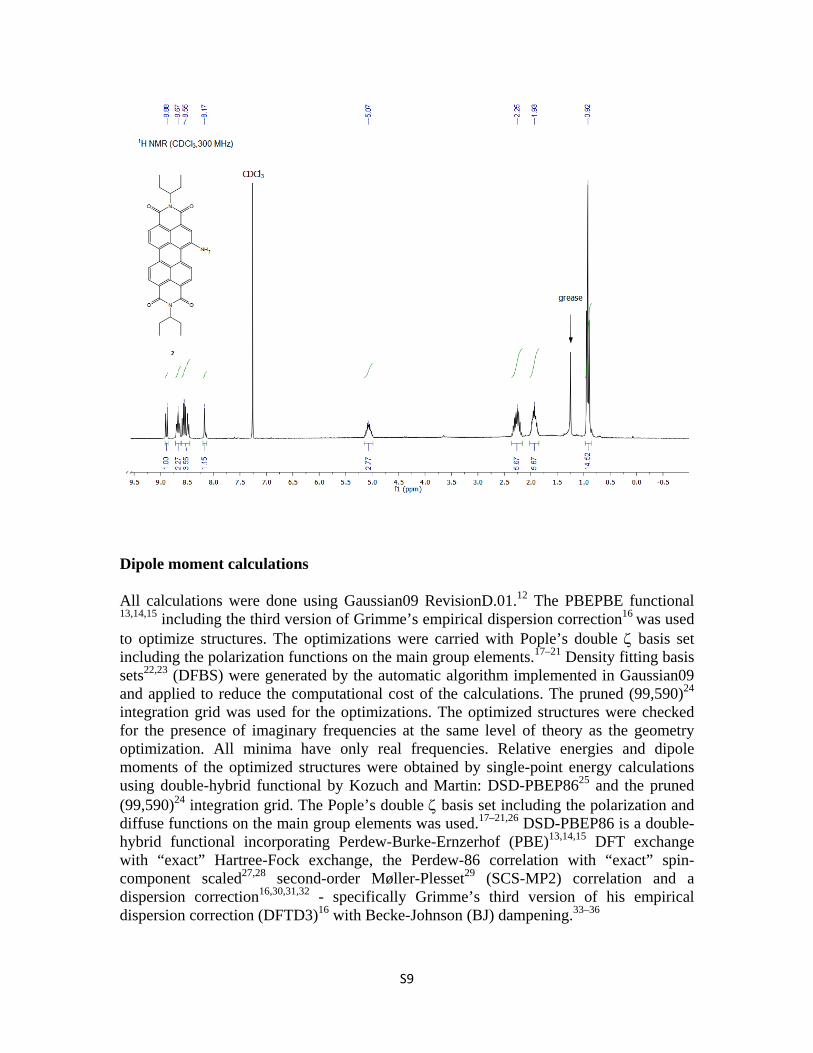
1H and 13C NMR spectra were recorded at room temperature on 300MHz spectrometer (Bruker). 1H and 13C NMR chemical shifts (δ) are reported in parts per million (ppm) downfield from tetramethyl silane (TMS). 1H NMR shifts are referenced to the residual hydrogen peak of CDCl3 (7.26 ppm). 13C NMR shifts are referenced to the CDCl3 peak (77.16 ppm). Coupling constants are reported in Hertz (Hz); splitting patterns are denoted s (singlet), t (triplet), q (quartet), m (multiplet) and br. (broad).
Electrospray Ionization (ESI) Mass-Spectrometry was performed using Micromass Platform instrument.
UV-vis absorption measurements were carried out on a Cary-5000 spectrometer (Varian).
THF/water and ethanol/water mixtures of several ratios were used as the solvents. The assembly pathway includes dissolving the solid compound in the organic solvent, then injecting the solution into double-distilled water (Barnstead NANOpure Diamond water system). The mass of the compound and solvent volume were measured to yield the compound’s desired concentration at the solvent’s desired composition. The sealed sample was aged for several days.
Compound 1 showed a general dependency of the crystals size upon the ratio of organic solvent to water, in both types of solvent mixtures examined. In the case of the ethanol solutions no significant precipitation was observed. The exception for this observation was the water/ethanol (65/35, v/v) solution which showed some precipitation after extended aging times of several months. For the THF solutions, water/THF (95/5, v/v) showed no participation. The water/THF (90/10, v/v) system showed minor precipitate after several months of aging. The water/THF (85/15, v/v) and water/THF (80/20, v/v) systems showed precipitate already after few days of aging.
Transmission electron microscopy (TEM)
Imaging was performed using Tecnai T12 transmission electron microscope operated at 120 kV. Sample-preparation: 2.4 µl of each sample was applied to 300-mesh copper grid coated with carbon (on nitrocellulose support) or to a 300-mesh copper grid coated with holey carbon (Pacific Grid-Tech supplies).
Cryo-transmission electron microscopy (cryo-TEM)
Imaging was performed using a Tecnai F20 transmission electron microscope operating at 200 kV, and using a Gatan 626 cooling holder and transfer station with a Gatan US4000 CCD digital camera, or a Tecnai T12 transmission electron microscope operated at 120 kV, using a Gatan 626 cooling holder and transfer station, with a TVIPS F244HD CCD digital camera. Sample-preparation: 2.4 μL of each sample was applied to a 300-mesh copper grid coated with holey carbon (Pacific Grid-Tech supplies). The samples were blotted at 25°C and 95% relative humidity, and plunged into liquid ethane using Leica EM-GP Automatic Grid Plunger. Specimens were equilibrated at -178°C in the microscope prior to the imaging.
SHG microscopy
Imaging was performed using 2PM; Zeiss LSM 510 META NLO; equipped with a broadband Mai Tai-HP-femtosecond single box tunable Ti-sapphire oscillator, with automated broadband wavelength tuning 700–1,020 nm from Spectraphysics. Images were acquired using laser wavelength of 800nm and detection through a filter of 394-405nm. Parallel detection was acquired using 415-426 filter to rule out two photon fluorescence contribution. All SHG microscopy images are false colored.
S3
Lab Powder XRD
The measurements were carried out in reflection mode using a TTRAX III (Rigaku) diffractometer equipped with a rotating anode Cu anode operating at 50 kV and 200 mA in Bragg-Brentano geometry. The measurements were carried out in the range 3°-30° of 2θ angles and collected by a scintillation detector.
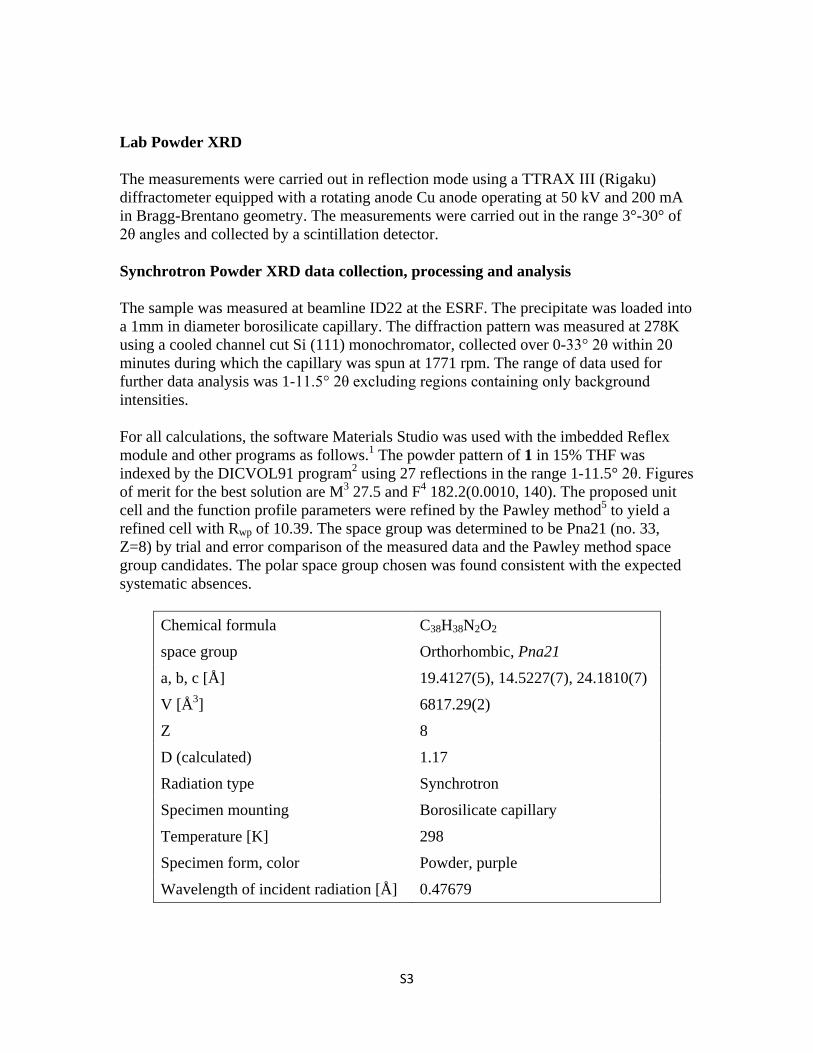
Synchrotron Powder XRD data collection, processing and analysis
The sample was measured at beamline ID22 at the ESRF. The precipitate was loaded into a 1mm in diameter borosilicate capillary. The diffraction pattern was measured at 278K using a cooled channel cut Si (111) monochromator, collected over 0-33° 2θ within 20 minutes during which the capillary was spun at 1771 rpm. The range of data used for further data analysis was 1-11.5° 2θ excluding regions containing only background intensities.
For all calculations, the software Materials Studio was used with the imbedded Reflex module and other programs as follows.1 The powder pattern of 1 in 15% THF was indexed by the DICVOL91 program2 using 27 reflections in the range 1-11.5° 2θ. Figures of merit for the best solution are M3 27.5 and F4 182.2(0.0010, 140). The proposed unit cell and the function profile parameters were refined by the Pawley method5 to yield a refined cell with Rwp of 10.39. The space group was determined to be Pna21 (no. 33, Z=8) by trial and error comparison of the measured data and the Pawley method space group candidates. The polar space group chosen was found consistent with the expected systematic absences.
HRS measurements were made using a 100fs pulsed Ti:Sapphire laser with 80MHz repetition rate (Coherent, Chameleon Ultra II) at 950 nm. The laser was focused using a standard 10X objective into a cuvette containing a solution of crystals. The collection was done at a 900 angle with respect to the exciting beam using another standard 10X objective. The signal was imaged into a monochromator (Princeton Instruments, SP2150i) and sent into a photomultiplier detector assembly (PicoQuant, PMA 175). The detector and the laser trigger output were connected to a time-correlated single-photon counting system (Picoquant HydraHarp 400).
Single crystal SHG Setup
Single crystal SHG measurements were made using a 100 fs pulsed Ti:Sapphire laser with 80 MHz repetition rate (Coherent, Chameleon Ultra II) at 950 nm. The laser was fed into a microscope (Zeiss Axiovert 200 inverted microscope) and focused using an oil immersion objective (Zeiss Plan Apochromat X63 NA 1.4) to a nearly diffraction limited spot. The excitation laser was reflected by a dichroic mirror (Thorlabs DMSP805). Circular polarization was created using a variable liquid crystal phase retarder (Thorlabs LCC1113). A thin-film polarizer (Thorlabs LPNIR100) was positioned after the retarder on a moving stage to enable switching to any desired linear polarization. A second variable liquid crystal phase retarder was used to correct for phase changes due to the dichroic mirror’s reflection. The linear polarization achieved in this setup, before the objective lens, was >1:500 (>99.8%). For the collection of the SHG signal, the same objective was used with a band-pass filter to spectrally eliminate photoluminescence from the collection channel. The signal was imaged onto a multimode fiber and coupled to a single-photon avalanche photodiode (Laser Components, Count Blue). The detector and the laser trigger output were connected to a time-correlated single-photon counting (TCSPC) system (Picoquant HydraHarp 400). In order to image the samples, the fitted halogen lamp of the microscope, a mirror in the collection path, and a CCD camera (Princeton Instruments, Photonmax 512) were used.
S5
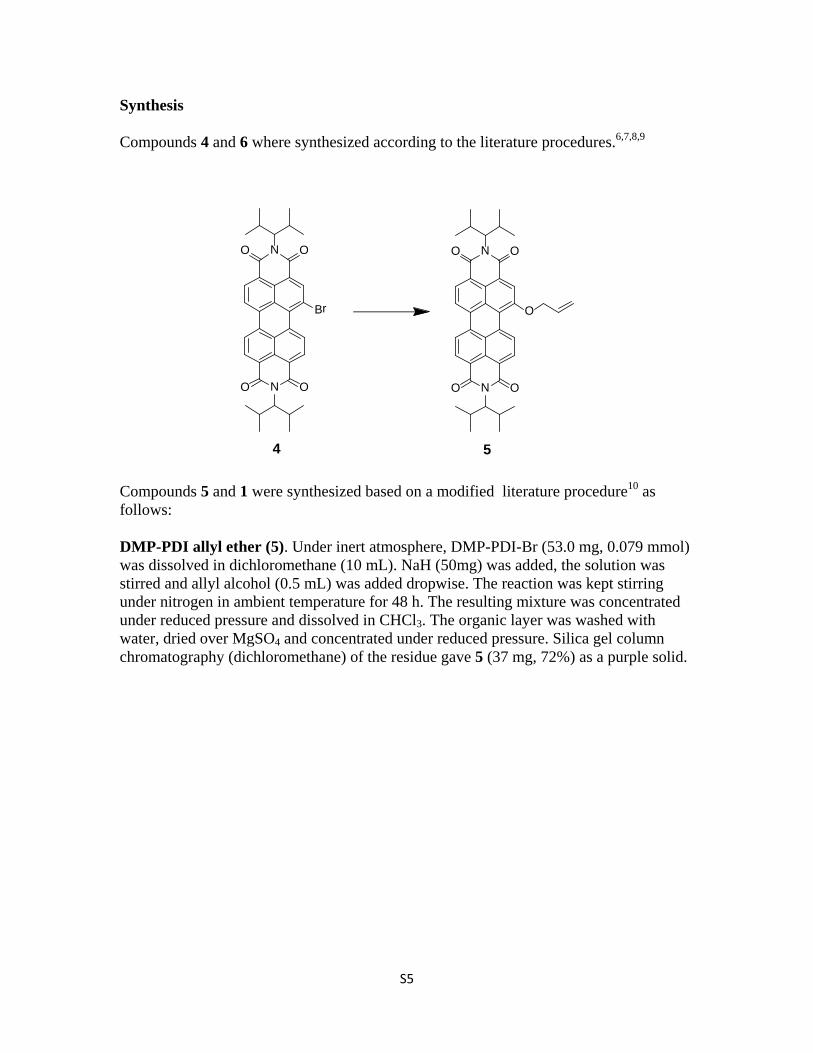
Synthesis
Compounds 4 and 6 where synthesized according to the literature procedures.6,7,8,9
N
N
O O
OO
Br
4
N
N
O O
OO
O
5
Compounds 5 and 1 were synthesized based on a modified literature procedure10 as follows:
DMP-PDI allyl ether (5). Under inert atmosphere, DMP-PDI-Br (53.0 mg, 0.079 mmol) was dissolved in dichloromethane (10 mL). NaH (50mg) was added, the solution was stirred and allyl alcohol (0.5 mL) was added dropwise. The reaction was kept stirring under nitrogen in ambient temperature for 48 h. The resulting mixture was concentrated under reduced pressure and dissolved in CHCl3. The organic layer was washed with water, dried over MgSO4 and concentrated under reduced pressure. Silica gel column chromatography (dichloromethane) of the residue gave 5 (37 mg, 72%) as a purple solid.
S6
N
N
O O
OO
N
N
O O
OO
O OH
15
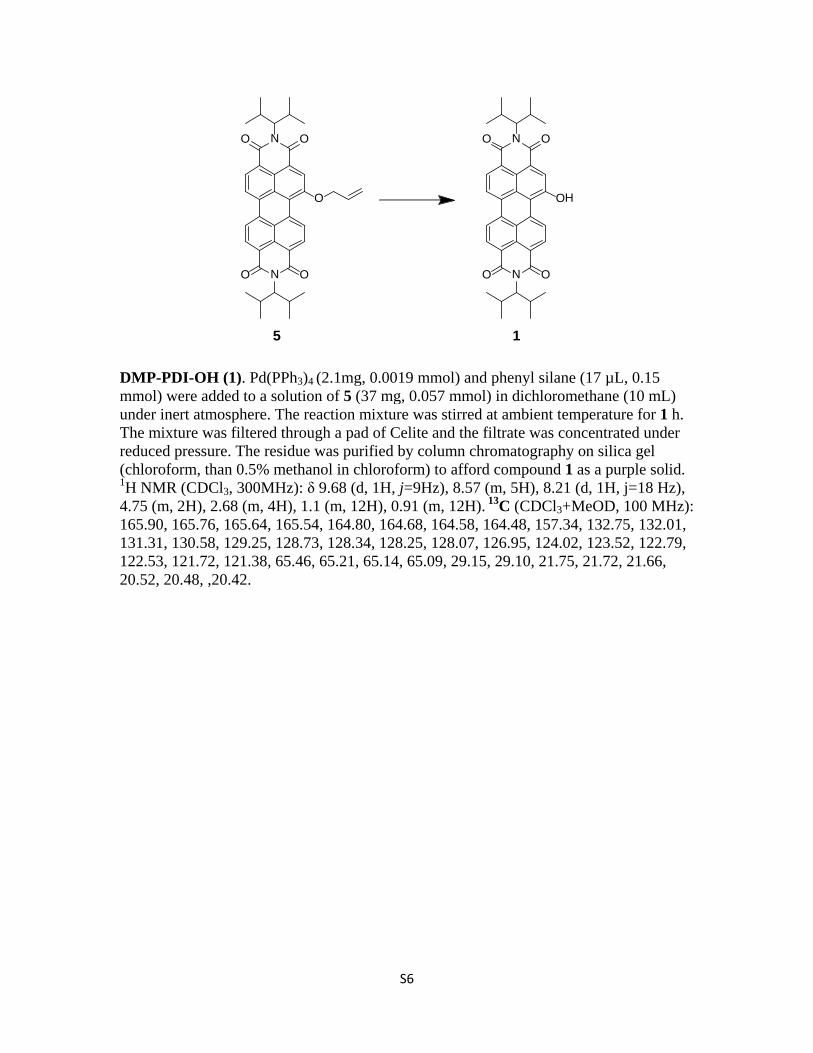
DMP-PDI-OH (1). Pd(PPh3)4 (2.1mg, 0.0019 mmol) and phenyl silane (17 µL, 0.15 mmol) were added to a solution of 5 (37 mg, 0.057 mmol) in dichloromethane (10 mL) under inert atmosphere. The reaction mixture was stirred at ambient temperature for 1 h. The mixture was filtered through a pad of Celite and the filtrate was concentrated under reduced pressure. The residue was purified by column chromatography on silica gel (chloroform, than 0.5% methanol in chloroform) to afford compound 1 as a purple solid. 1H NMR (CDCl3, 300MHz): δ 9.68 (d, 1H, j=9Hz), 8.57 (m, 5H), 8.21 (d, 1H, j=18 Hz), 4.75 (m, 2H), 2.68 (m, 4H), 1.1 (m, 12H), 0.91 (m, 12H). 13C (CDCl3+MeOD, 100 MHz): 165.90, 165.76, 165.64, 165.54, 164.80, 164.68, 164.58, 164.48, 157.34, 132.75, 132.01, 131.31, 130.58, 129.25, 128.73, 128.34, 128.25, 128.07, 126.95, 124.02, 123.52, 122.79, 122.53, 121.72, 121.38, 65.46, 65.21, 65.14, 65.09, 29.15, 29.10, 21.75, 21.72, 21.66, 20.52, 20.48, ,20.42.
S7
Compounds 2 and 3 were synthesized based on a literature procedure,11 which was modified as follows:
N
N
O O
OO
N
N
O O
OO
NO2
36
EP-PDI-NO2 (3). Cerium Ammonium Nitrate (CAN) (50.12 mg, 0.09 mmol) was added to a solution of EP-PDI (6) (50 mg, 0.08 mmol) in dichloromethane (20 mL) under inert atmosphere. The reaction mixture was taken outside the glovebox and stirred under nitrogen for 15 minutes. Concentrated HNO3 (58 µL) was added to the reaction mixture
S8
under nitrogen and stirred for 2 hours. The solution changed color from orange to red. The reaction mixture was neutralized using KOH. The organic layer was washed thrice with water, dried over MgSO4 and concentrated under reduced pressure. Silica gel column chromatography (dichloromethane) of the residue gave 3 (70% yield). 1H NMR (CDCl3): δ = 9.75 (m, 4H, overlapped perylene-H), 8.61 (d, 1H, 3JHH= 8.1 Hz, perylene-H), 8.26 (d, 1H, 3JHH= 8.1 Hz, perylene-H), 5.03 (m, 2H, N(CH(CH2CH3)2)), 2.24 (m, 4H, N(CH(CH2CH3)2)), 1.93 (m, 4H, N(CH(CH2CH3)2)), 0.91 (t, 12H, 3JHH= 7.5, N(CH(CH2CH3)2)). 13C NMR (75 MHz, CDCl3): δ 147.66, 135.46, 132.91, 129.48, 129.35, 129.10, 127.92, 127.49, 126.66, 126.47, 124.43, 124.01, 58.91, 57.90, 24.94, 24.86, 11.28, 11.25. ESI-MS (m/z) [M]+ calcd. for C45H41N3O8, 575.20; found, 575.21.
N
N
O O
OO
NH2
N
N
O O
OO
NO2
3 2
EP-PDI-NH2 (2). SnCl2·2H2O (174 mg, 0.77mmol) was added to a solution of 3 (40 mg, 0.06 mmol) in tetrahydrofuran (20mL) under inert atmosphere. The reaction mixture was fitted to a condenser and stirred for half an hour at ambient temperature. It was then heated to 80˚C and refluxed for 3 hours. The solution changed color from red to blue. The reaction was concentrated under reduced pressure. The residue was dissolved in ethyl acetate and washed with NaOH solution twice. The organic layer was dried over MgSO4 and concentrated under reduced pressure. Silica gel column chromatography (chloroform/methanol 95/5, v/v) of the residue gave 2 (79% yield) as a blue solid. 1H NMR (300 MHz, CDCl3): δ 8.90 (d, J = 8.4Hz, 1H), 8.67-8.49 (m, 5H), 8.17 (s, 1H), 5.09 (m, 2H), 2.25 (m, 4H), 1.93 (m, 4H), 1.73-1.66 (m, 4H), 1.38-1.25 (m, 12H ), 0.92 (t, J = 7.5Hz, 12H). 13C NMR (100 MHz, CDCl3): δ 145.88, 144.77, 141.77, 132.88, 131.63, 128.48, 127.50, 122.87, 119.61, 115.73, 57.69, 57.51, 29.68, 29.64, 25.01, 11.33, 11.30. HRMS (m/z): calculated for C34H31N3O4 545.23; found 545.29.
S9
Dipole moment calculations
All calculations were done using Gaussian09 RevisionD.01.12 The PBEPBE functional 13,14,15 including the third version of Grimme’s empirical dispersion correction16 was used to optimize structures. The optimizations were carried with Pople’s double ζ basis set including the polarization functions on the main group elements.17–21 Density fitting basis sets22,23 (DFBS) were generated by the automatic algorithm implemented in Gaussian09 and applied to reduce the computational cost of the calculations. The pruned (99,590)24 integration grid was used for the optimizations. The optimized structures were checked for the presence of imaginary frequencies at the same level of theory as the geometry optimization. All minima have only real frequencies. Relative energies and dipole moments of the optimized structures were obtained by single-point energy calculations using double-hybrid functional by Kozuch and Martin: DSD-PBEP8625 and the pruned (99,590)24 integration grid. The Pople’s double ζ basis set including the polarization and diffuse functions on the main group elements was used.17–21,26 DSD-PBEP86 is a double-hybrid functional incorporating Perdew-Burke-Ernzerhof (PBE)13,14,15 DFT exchange with “exact” Hartree-Fock exchange, the Perdew-86 correlation with “exact” spin-component scaled27,28 second-order Møller-Plesset29 (SCS-MP2) correlation and a dispersion correction16,30,31,32 - specifically Grimme’s third version of his empirical dispersion correction (DFTD3)16 with Becke-Johnson (BJ) dampening.33–36
S10
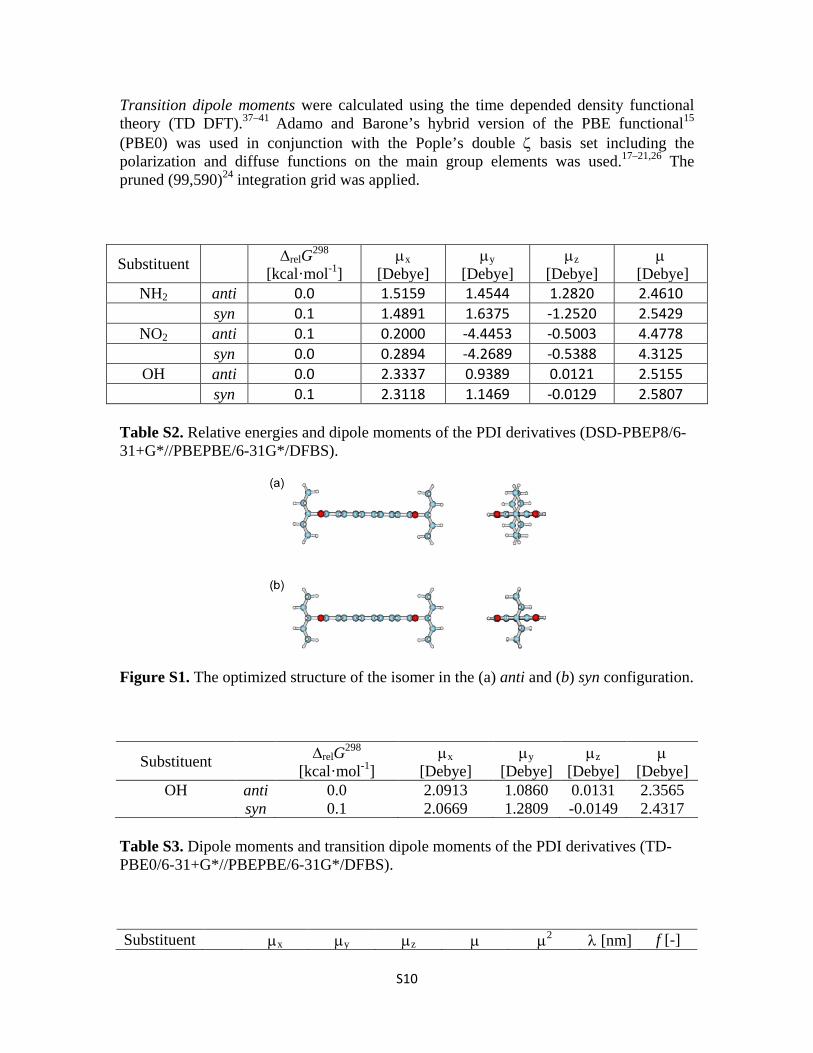
Transition dipole moments were calculated using the time depended density functional theory (TD DFT).37–41 Adamo and Barone’s hybrid version of the PBE functional15 (PBE0) was used in conjunction with the Pople’s double ζ basis set including the polarization and diffuse functions on the main group elements was used.17–21,26 The pruned (99,590)24 integration grid was applied.
Substituent ∆relG298 [kcal·mol-1]
µx [Debye]
µy [Debye]
µz [Debye]
µ [Debye]
NH2 anti 0.0 1.5159 1.4544 1.2820 2.4610 syn 0.1 1.4891 1.6375 -1.2520 2.5429
NO2 anti 0.1 0.2000 -4.4453 -0.5003 4.4778 syn 0.0 0.2894 -4.2689 -0.5388 4.3125
OH anti 0.0 2.3337 0.9389 0.0121 2.5155 syn 0.1 2.3118 1.1469 -0.0129 2.5807
Table S2. Relative energies and dipole moments of the PDI derivatives (DSD-PBEP8/6-31+G*//PBEPBE/6-31G*/DFBS).
Figure S1. The optimized structure of the isomer in the (a) anti and (b) syn configuration.
Substituent ∆relG298 [kcal·mol-1]
µx [Debye]
µy [Debye]
µz [Debye]
µ [Debye]
OH anti 0.0 2.0913 1.0860 0.0131 2.3565 syn 0.1 2.0669 1.2809 -0.0149 2.4317
Table S3. Dipole moments and transition dipole moments of the PDI derivatives (TD-PBE0/6-31+G*//PBEPBE/6-31G*/DFBS).
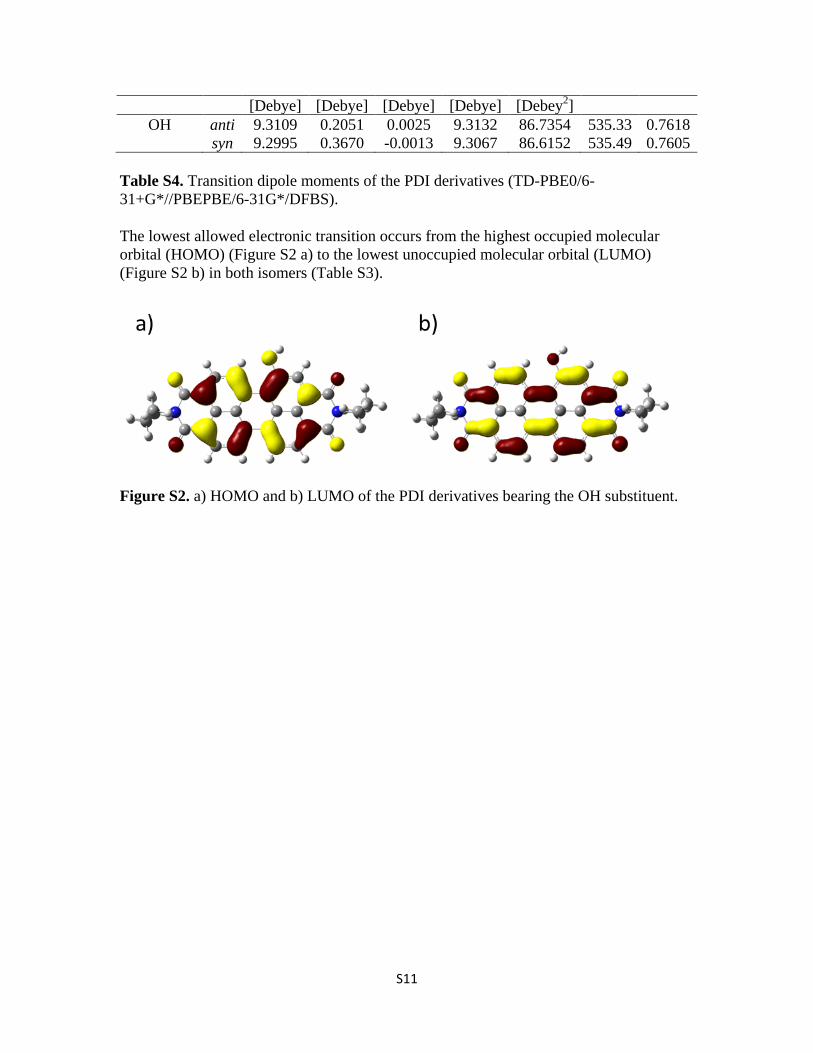
syn 9.2995 0.3670 -0.0013 9.3067 86.6152 535.49 0.7605
Table S4. Transition dipole moments of the PDI derivatives (TD-PBE0/6-31+G*//PBEPBE/6-31G*/DFBS).
The lowest allowed electronic transition occurs from the highest occupied molecular orbital (HOMO) (Figure S2 a) to the lowest unoccupied molecular orbital (LUMO) (Figure S2 b) in both isomers (Table S3).
Figure S2. a) HOMO and b) LUMO of the PDI derivatives bearing the OH substituent.
S12
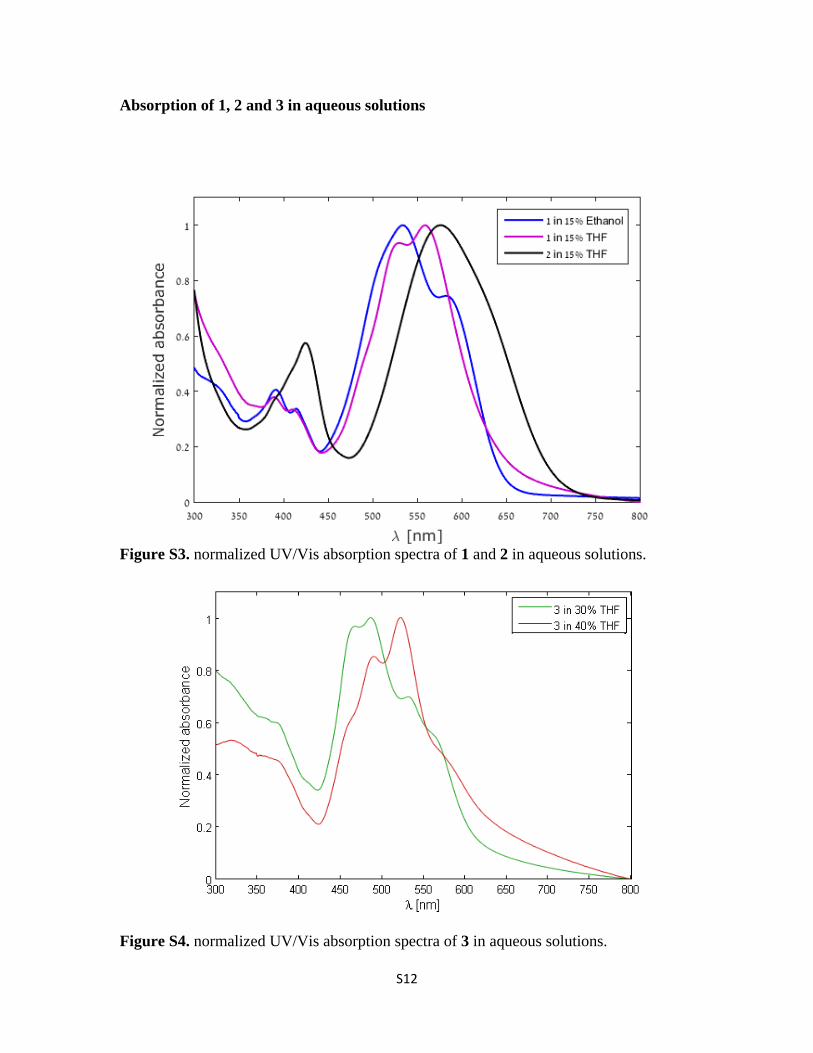
Absorption of 1, 2 and 3 in aqueous solutions
Figure S3. normalized UV/Vis absorption spectra of 1 and 2 in aqueous solutions.
Figure S4. normalized UV/Vis absorption spectra of 3 in aqueous solutions.
S13
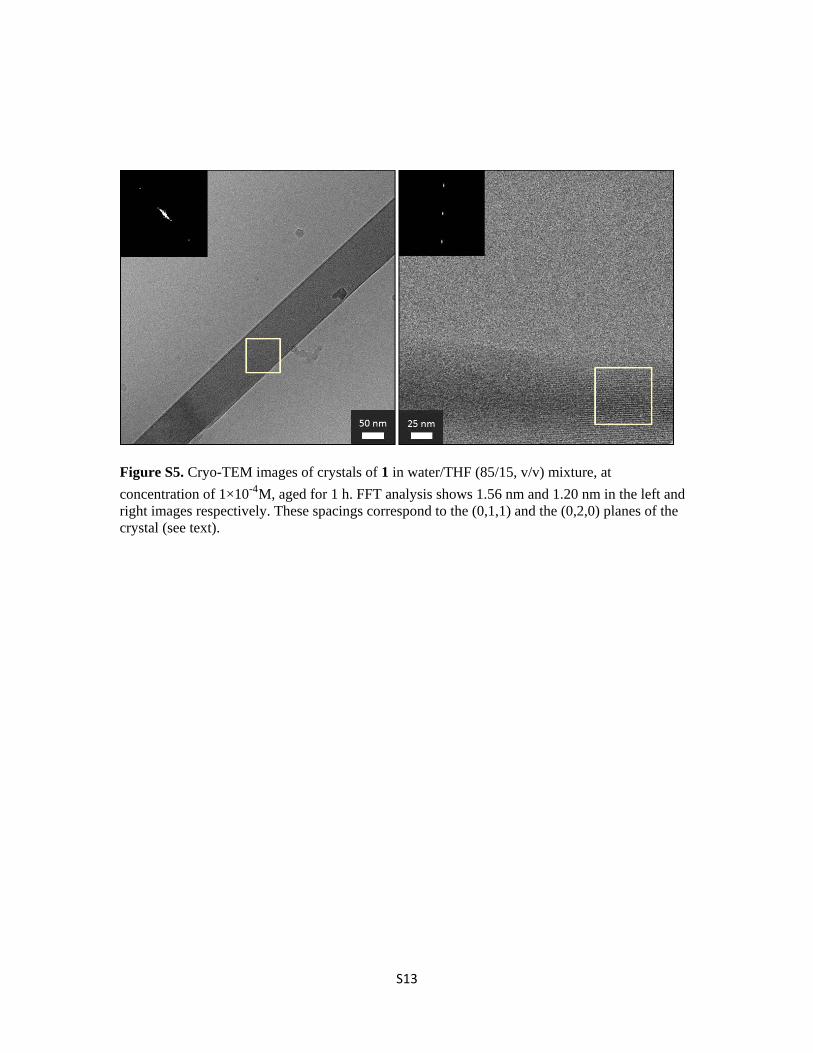
Figure S5. Cryo-TEM images of crystals of 1 in water/THF (85/15, v/v) mixture, at concentration of 1×10⁻⁴M, aged for 1 h. FFT analysis shows 1.56 nm and 1.20 nm in the left and right images respectively. These spacings correspond to the (0,1,1) and the (0,2,0) planes of the crystal (see text).
S14
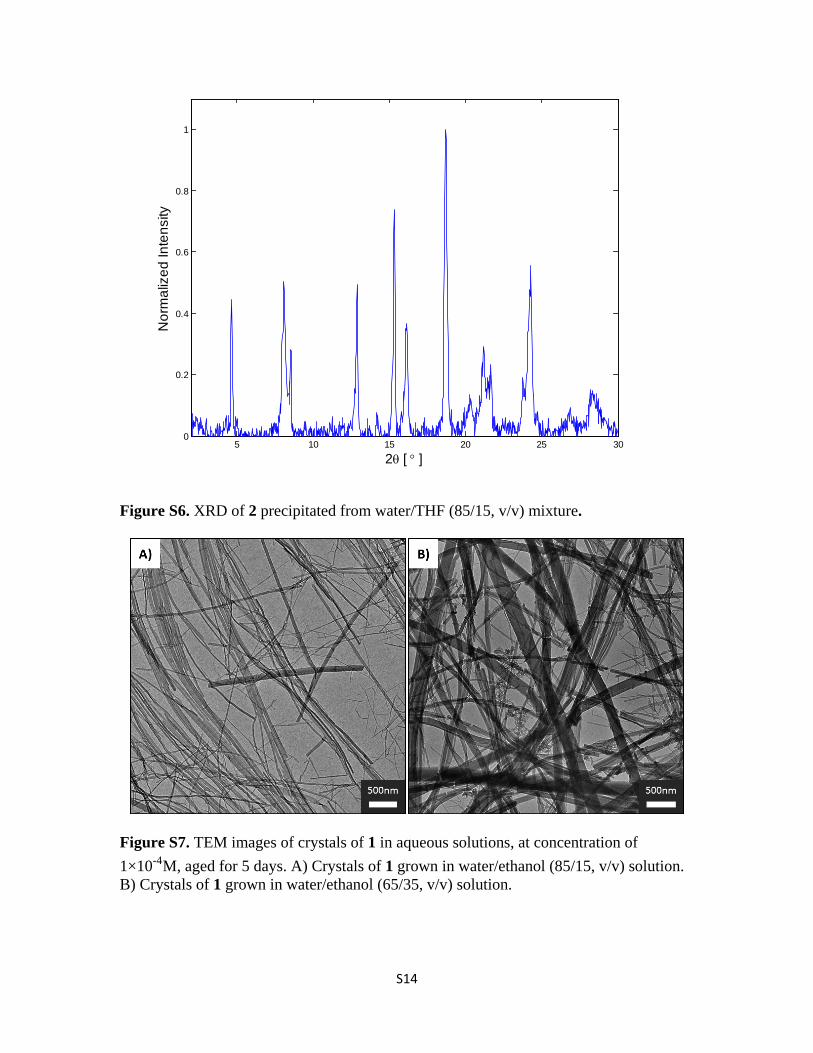
Figure S6. XRD of 2 precipitated from water/THF (85/15, v/v) mixture.
Figure S7. TEM images of crystals of 1 in aqueous solutions, at concentration of 1×10⁻⁴M, aged for 5 days. A) Crystals of 1 grown in water/ethanol (85/15, v/v) solution. B) Crystals of 1 grown in water/ethanol (65/35, v/v) solution.
5 10 15 20 25 300
0.2
0.4
0.6
0.8
1
2θ [ ° ]
Nor
mal
ized
Inte
nsity
S15
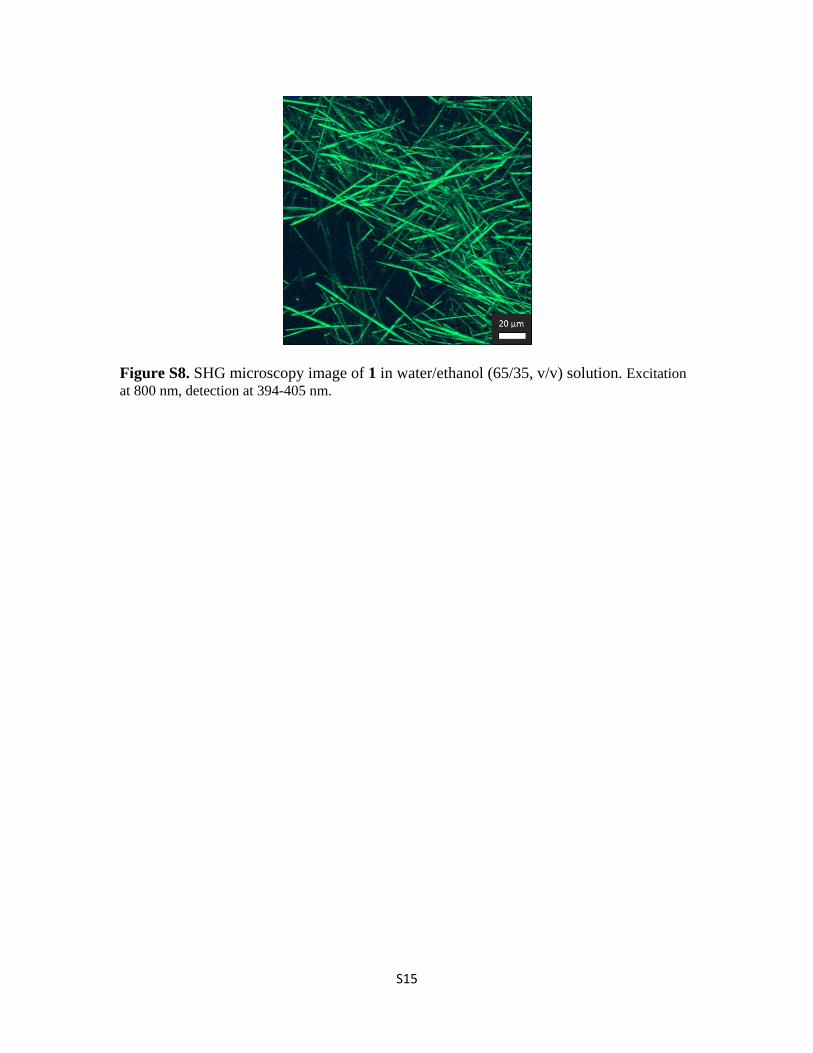
Figure S8. SHG microscopy image of 1 in water/ethanol (65/35, v/v) solution. Excitation at 800 nm, detection at 394-405 nm.
S16
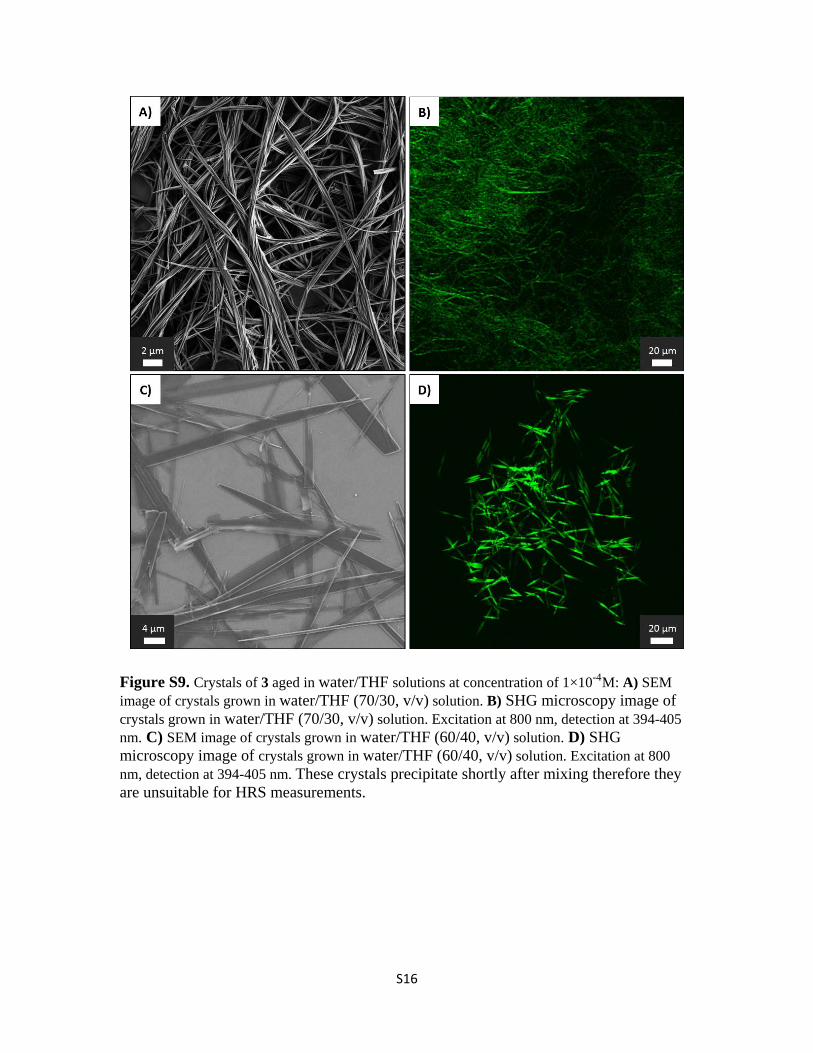
Figure S9. Crystals of 3 aged in water/THF solutions at concentration of 1×10⁻⁴M: A) SEM image of crystals grown in water/THF (70/30, v/v) solution. B) SHG microscopy image of crystals grown in water/THF (70/30, v/v) solution. Excitation at 800 nm, detection at 394-405 nm. C) SEM image of crystals grown in water/THF (60/40, v/v) solution. D) SHG microscopy image of crystals grown in water/THF (60/40, v/v) solution. Excitation at 800 nm, detection at 394-405 nm. These crystals precipitate shortly after mixing therefore they are unsuitable for HRS measurements.
S17
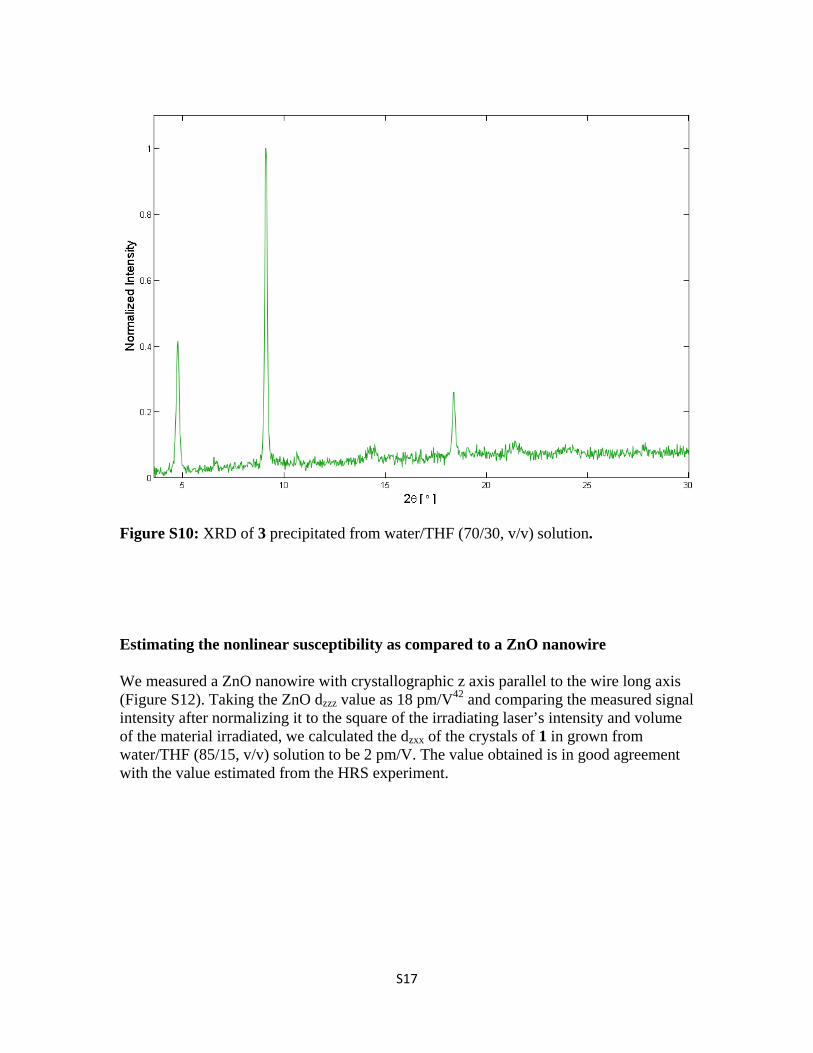
Figure S10: XRD of 3 precipitated from water/THF (70/30, v/v) solution.
Estimating the nonlinear susceptibility as compared to a ZnO nanowire
We measured a ZnO nanowire with crystallographic z axis parallel to the wire long axis (Figure S12). Taking the ZnO dzzz value as 18 pm/V42 and comparing the measured signal intensity after normalizing it to the square of the irradiating laser’s intensity and volume of the material irradiated, we calculated the dzxx of the crystals of 1 in grown from water/THF (85/15, v/v) solution to be 2 pm/V. The value obtained is in good agreement with the value estimated from the HRS experiment.
S18
Figure S11: A) Raster scan of the SHG signal from a single ZnO nanowire (λex = 950 nm, intensity in a.u.). The wire is around 80 nm wide and tenths of micron long with its crystallographic z axis is in the direction of the long axis. B) Polarization dependent measurements on the ZnO wire (λex = 950 nm, intensity in a.u.). The red and blue curves are the intensity of the signal polarized in the lab vertical and horizontal polarizations respectively as indicated by the red and blue axes. The wire was measured at intensity 4.38 higher than the crystals of 1 to ensure measurement of the weak dzxx and dxxz signals while avoiding saturation of the detector from the dzzz signal. C) Zoomed-in view on the central region of the polar plot in B.
Nonlinear susceptibility calculation from HRS measurements
In general, the measured HRS intensity at a certain wavelength is given by:43
𝑆(2𝜔) =< 𝛽2 >∙ 𝑃(𝜔)2 ∙ 𝑁 (eq. 1)
Where S is the measured signal for the sample, < 𝛽 > is the average molecular susceptibility in esu, 𝑃(𝜔) is the incident radiation power and 𝑁 is the number density of the solute.
In accordance with the experimental geometry used, in which the incident radiation is polarized in the Z axis of the lab and the detection is situated at the lab X axis, the average beta measured is smaller than the actual beta by a factor f, which in turn can be calculated by rotating the irradiating laser’s polarization to the molecular frame of reference and rotating the signal polarization back to the lab frame of reference where it is detected.
< 𝛽𝑠𝑠𝑠𝑠𝑠𝑠𝑠2 >= 𝑓 ∙ 𝛽𝑖𝑖𝑖2
In cases where the dominant d element is either dzzz or dzxx, the integrated orientational averaging factor f is 6
35 or 4
35 respectively. For the crystals of 1 grown in water/THF
(85/15, v/v) mixture, the dominant d element was taken as dzxx in accordance with the observation that the dominant signal arises from incident polarization parallel to the crystal long axis and emitted at a polarization perpendicular to it (Figure 4). For crystal class mm2, dzxx and/or dzyy elements would give rise to such tendency.
S19
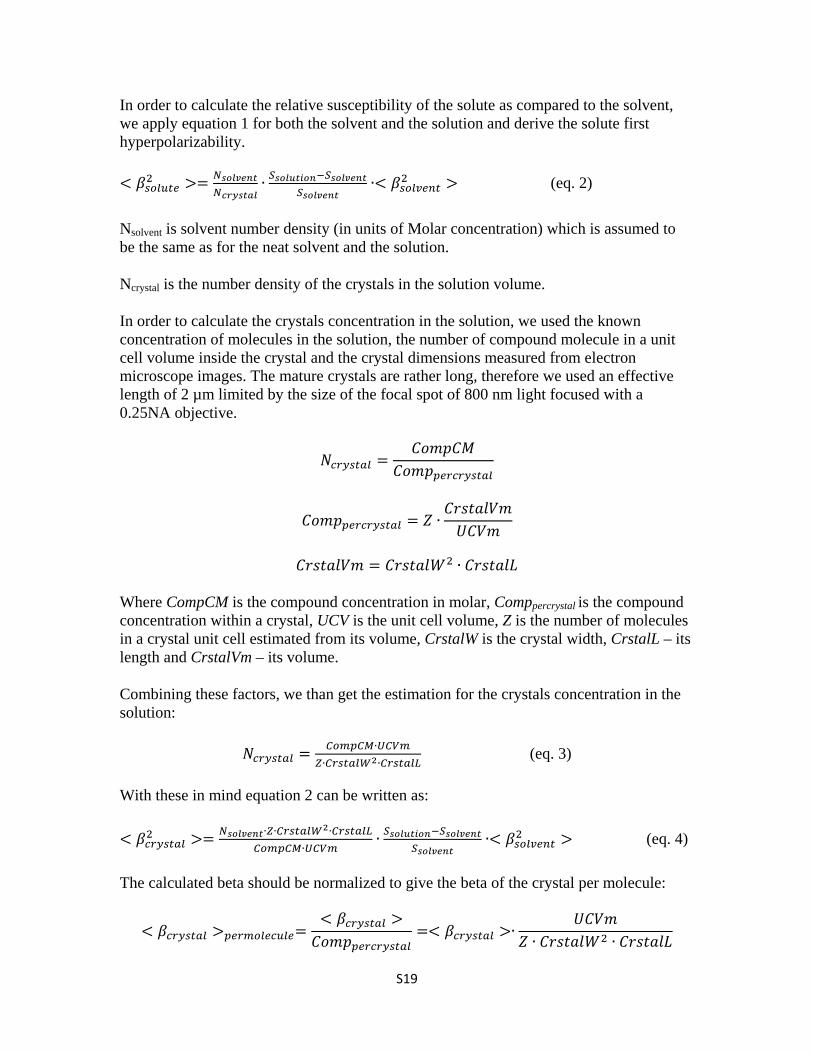
In order to calculate the relative susceptibility of the solute as compared to the solvent, we apply equation 1 for both the solvent and the solution and derive the solute first hyperpolarizability.
< 𝛽𝑠𝑠𝑠𝑠𝑠𝑠2 >= 𝑁𝑠𝑠𝑠𝑠𝑠𝑠𝑠𝑁𝑐𝑐𝑐𝑠𝑠𝑐𝑠
∙ 𝑆𝑠𝑠𝑠𝑠𝑠𝑠𝑠𝑠−𝑆𝑠𝑠𝑠𝑠𝑠𝑠𝑠𝑆𝑠𝑠𝑠𝑠𝑠𝑠𝑠
∙< 𝛽𝑠𝑠𝑠𝑠𝑠𝑠𝑠2 > (eq. 2)
Nsolvent is solvent number density (in units of Molar concentration) which is assumed to be the same as for the neat solvent and the solution.
Ncrystal is the number density of the crystals in the solution volume.
In order to calculate the crystals concentration in the solution, we used the known concentration of molecules in the solution, the number of compound molecule in a unit cell volume inside the crystal and the crystal dimensions measured from electron microscope images. The mature crystals are rather long, therefore we used an effective length of 2 µm limited by the size of the focal spot of 800 nm light focused with a 0.25NA objective.
𝑁𝑐𝑐𝑐𝑠𝑠𝑐𝑠 =𝐶𝐶𝐶𝐶𝐶𝐶
𝐶𝐶𝐶𝐶𝑝𝑠𝑐𝑐𝑐𝑐𝑠𝑠𝑐𝑠
𝐶𝐶𝐶𝐶𝑝𝑠𝑐𝑐𝑐𝑐𝑠𝑠𝑐𝑠 = 𝑍 ∙𝐶𝐶𝐶𝐶𝐶𝐶𝐶𝐶𝑈𝐶𝐶𝐶
𝐶𝐶𝐶𝐶𝐶𝐶𝐶𝐶 = 𝐶𝐶𝐶𝐶𝐶𝐶𝑊2 ∙ 𝐶𝐶𝐶𝐶𝐶𝐶𝐶
Where CompCM is the compound concentration in molar, Comppercrystal is the compound concentration within a crystal, UCV is the unit cell volume, Z is the number of molecules in a crystal unit cell estimated from its volume, CrstalW is the crystal width, CrstalL – its length and CrstalVm – its volume.
Combining these factors, we than get the estimation for the crystals concentration in the solution:
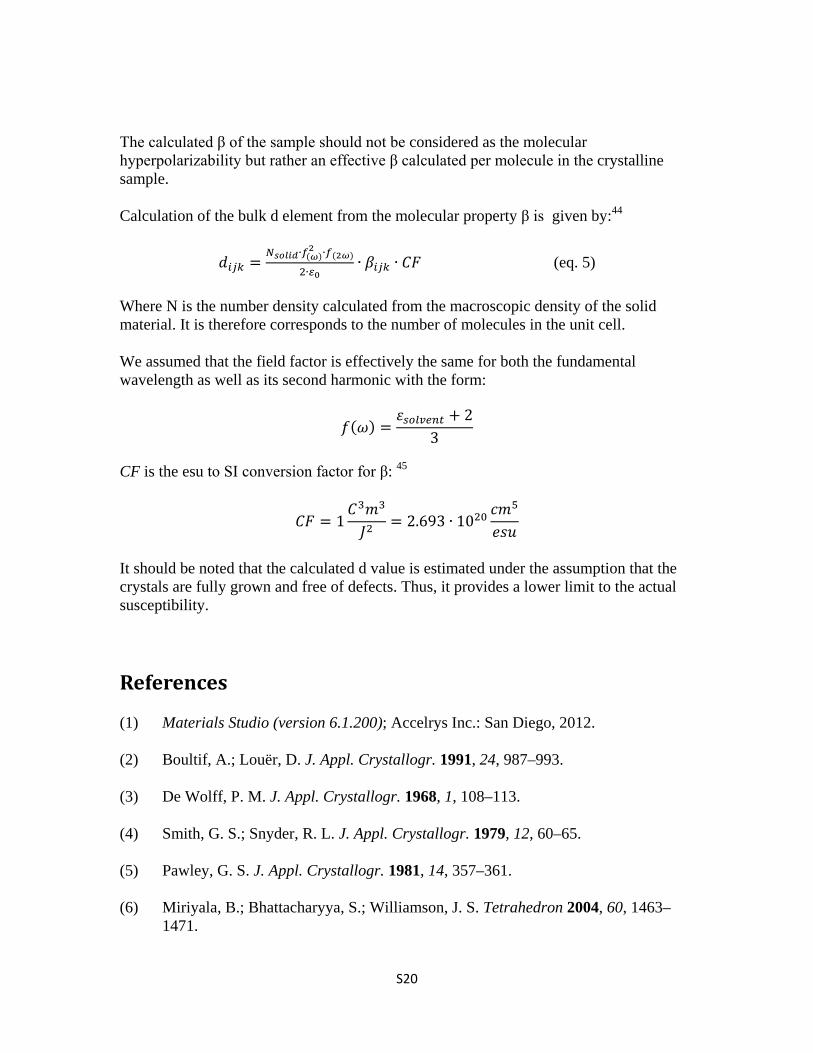
The calculated β of the sample should not be considered as the molecular hyperpolarizability but rather an effective β calculated per molecule in the crystalline sample.
Calculation of the bulk d element from the molecular property β is given by:44
𝑑𝑖𝑖𝑖 =𝑁𝑠𝑠𝑠𝑠𝑠∙𝑓(𝜔)
2 ∙𝑓(2𝜔)
2∙𝜀0∙ 𝛽𝑖𝑖𝑖 ∙ 𝐶𝐶 (eq. 5)
Where N is the number density calculated from the macroscopic density of the solid material. It is therefore corresponds to the number of molecules in the unit cell.
We assumed that the field factor is effectively the same for both the fundamental wavelength as well as its second harmonic with the form:
𝑓(𝜔) =𝜀𝑠𝑠𝑠𝑠𝑠𝑠𝑠 + 2
3
CF is the esu to SI conversion factor for β: 45
𝐶𝐶 = 1𝐶3𝐶3
𝐽2= 2.693 ∙ 1020
𝑐𝐶5
𝑒𝐶𝑒
It should be noted that the calculated d value is estimated under the assumption that the crystals are fully grown and free of defects. Thus, it provides a lower limit to the actual susceptibility.
References
(1) Materials Studio (version 6.1.200); Accelrys Inc.: San Diego, 2012.
(2) Boultif, A.; Louër, D. J. Appl. Crystallogr. 1991, 24, 987–993.
(3) De Wolff, P. M. J. Appl. Crystallogr. 1968, 1, 108–113.
(4) Smith, G. S.; Snyder, R. L. J. Appl. Crystallogr. 1979, 12, 60–65.
(5) Pawley, G. S. J. Appl. Crystallogr. 1981, 14, 357–361.
(6) Miriyala, B.; Bhattacharyya, S.; Williamson, J. S. Tetrahedron 2004, 60, 1463–1471.
S21
(7) Demmig, S.; Langhals, H. Chem. Ber. 1988, 121, 225–230.
(9) Rajasingh, P.; Cohen, R.; Shirman, E.; Shimon, L. J. W.; Rybtchinski, B. J. Org. Chem. 2007, 72, 5973–5979.
(10) Fin, A.; Petkova, I.; Doval, D. A.; Sakai, N.; Vauthey, E.; Matile, S. Org. Biomol. Chem. 2011, 9, 8246–8252.
(11) Chen, K. Y.; Fang, T. C.; Chang, M. J. Dye. Pigment. 2012, 92, 517–523.
(12) Frisch, M. J.; Trucks, G. W.; Schlegel, H. B.; Scuseria, G. E.; Robb, M. A.; Cheeseman, J. R.; Scalmani, G.; Barone, V.; Mennucci, B.; Petersson, G. A.; Nakatsuji, H.; Caricato, M.; Li, X.; Hratchian, H. P.; Izmaylov, A. F.; Bloino, J.; Zheng, G.; Sonnenberg, J. L.; Hada, M.; Ehara, M.; Toyota, K.; Fukuda, R.; Hasegawa, J.; Ishida, M.; Nakajima, T.; Honda, Y.; Kitao, O.; Nakai, H.; Vreven, T.; J. A., J. M.; Peralta, J. E.; Ogliaro, F.; Bearpark, M.; Heyd, J. J.; Brothers, E.; Kudin, K. N.; Staroverov, V. N.; Kobayashi, R.; Normand, J.; Raghavachari, K.; Rendell, A.; Burant, J. C.; Iyengar, S. S.; Tomasi, J.; Cossi, M.; Rega, N.; Millam, N. J.; Klene, M.; Knox, J. E.; Cross, J. B.; Bakken, V.; Adamo, C.; Jaramillo, J.; Gomperts, R.; Stratmann, R. E.; Yazyev, O.; Austin, A. J.; Cammi, R.; Pomelli, C.; Ochterski, J. W.; Martin, R. L.; Morokuma, K.; Zakrzewski, V. G.; Voth, G. A.; Salvador, P.; Dannenberg, J. J.; Dapprich, S.; Daniels, A. D.; Farkas, Ö.; Foresman, J. B.; Ortiz, J. V.; Cioslowski, J.; Fox, D. J. Gaussian 09, Revision D.01; Gaussian, Inc.: Wallingford CT, 2009.
(13) Perdew, J. P.; Burke, K.; Ernzerhof, M. Phys. Rev. Lett. 1996, 77, 3865–3868.
(14) Perdew, J. P.; Burke, K.; Ernzerhof, M. Phys. Rev. Lett. 1997, 78, 1396–1396.
(15) Adamo, C.; Barone, V. J. Chem. Phys. 1999, 110, 6158–6170.
(16) Grimme, S.; Antony, J.; Ehrlich, S.; Krieg, H. J. Chem. Phys. 2010, 132, 154104.
(17) Ditchfield, R.; Hehre, W. J.; Pople, J. A. J. Chem. Phys. 1971, 54, 724–728.
(18) Hehre, W. J.; Ditchfield, R.; Pople, J. A. J. Chem. Phys. 1972, 56, 2257–2261.
(19) Hariharan, P. C.; Pople, J. A. Theor. Chim. Acta 1973, 28, 213–222.
(20) Binning, R. C.; Curtiss, L. A. J. Comput. Chem. 1990, 11, 1206–1216.
(21) Rassolov, V. a. J. Comput. Chem. 2001, 22, 976–984.
S22
(22) Dunlap, B. I. J. Chem. Phys. 1983, 78, 3140–3142.
(23) Dunlap, B. I. J. Mol. Struct. THEOCHEM 2000, 529, 37–40.
(24) Lebedev, V. I.; Skorokhodov, A. L. Russ. Acad. Sci. Dokl. Math. 1992, 45, 587–592.
(25) Kozuch, S.; Martin, J. M. L. Phys. Chem. Chem. Phys. 2011, 13, 20104–20107.
(26) Frisch, M. J.; Pople, J. A.; Binkley, J. S. J. Chem. Phys. 1984, 80, 3265–3269.
(27) Grimme, S. J. Chem. Phys. 2003, 118, 9095–9102.
(28) Szabados, Á. J. Chem. Phys. 2006, 125, 214105.
(29) Møller, C.; Plesset, M. S. Phys. Rev. 1934, 46, 618–622.
(30) Grimme, S. J. Comput. Chem. 2006, 27, 1787–1799.


![[Supporting Information]: Covalent Organic Frameworks as ...S1 [Supporting Information]: One-Pot Cascade Syntheses of Microporous and Mesoporous Pyrazine-Linked Covalent Organic Frameworks](https://static.documents.pub/doc/80x56/601332f2168bba2f896e2f4c/supporting-information-covalent-organic-frameworks-as-s1-supporting-information.jpg)