Conjugated hybrid films based on a new polyoxotitanate monomer
Gang Liu,a Xing Yang,a Antoine Bonnefont,d Yaokang Lv,a, d* Jun Chen,a Wenyan Dan,b Zuofeng Chen,b
Laurent Ruhlmann,d Dominic S. Wright,c Cheng Zhang, a,*
a. College of Chemical Engineering and Materials Science, Zhejiang University of Technology, Hangzhou, 310014, China. E-mail: [email protected]; [email protected].
b. Department of Chemistry, Tongji University, Shanghai 200092, China. c. Department of Chemistry, University of Cambridge, Lensfield Road, Cambridge CB2 1EW, UK. d. Institut de Chimie (UMR au CNRS n°7177), Université de Strasbourg, 4, rue Blaise Pascal CS 90032, F-67081
Strasbourg Cedex, France
Materials and Instrumentation
Infrared (IR) spectra were adopted using a Nicolet 6700 spectrometer (Thermo Fisher Nicolet, USA) with
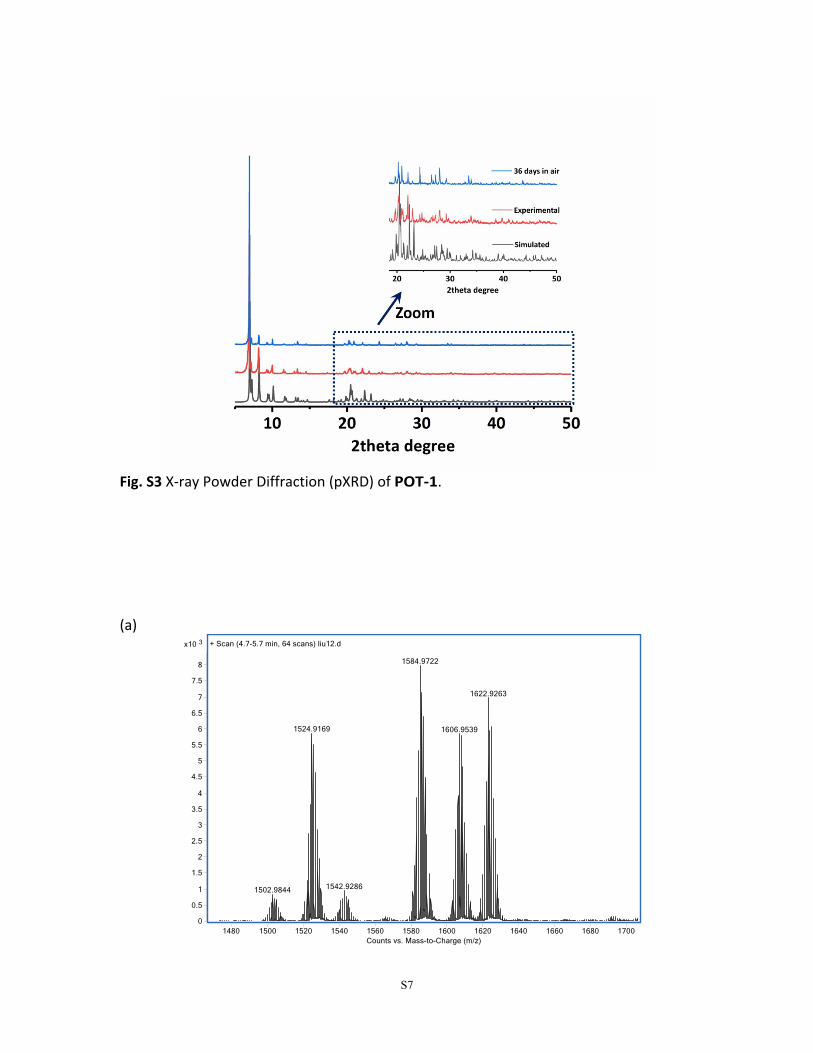
KBr pellets. Powder X-ray diffraction (PXRD) experiments were performed using a X’Pert Pro
diffractometer with Cu-Kα radiation (λ= 1.5418Å) operating at 40 kV and 40 mA and the scanning angle
ranged from 5° to 50° of 2θ. Scanning electron microscopy (SEM) images were collected using a field
emission scanning electron microscope (Nano nova 450). The surface compositions of the samples were
determined by energy dispersive spectroscopy (EDS). EDS data were collected using a X-MaxN energy
dispersive X-ray spectroscopy system attached to a Hitachi S-4800 SEM. X-ray photoelectron spectra (XPS)
were operated on a spectrometer (Kratos AXIS Ultra DLD, Shimadzu, Japan). Thermogravimetric analyses
(TGA) were performed on Mettler Toledo TGA/DSC 1 equipment in nitrogen atmosphere with a heating
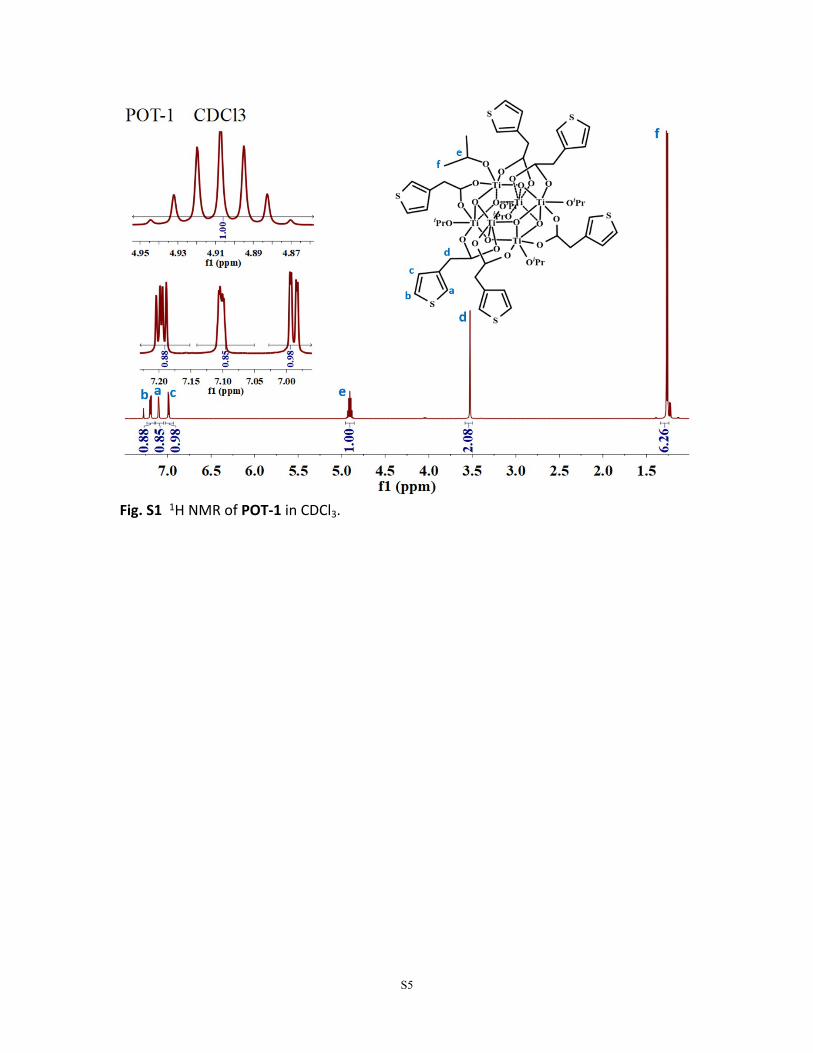
rate of 5 °C/min from 30 °C to 800 °C. Proton (1H) nuclear magnetic resonance (NMR) spectra were
measured in chloroform-d (CDCl3) using Bruker AVANCE Ⅲ 500 MHz spectrometers. ESI-MS was carried
out on ThermoFisher LCQTM Deca XP plus. X-ray photoelectron spectra (XPS) were operated on a
spectrometer (Kratos AXIS Ultra DLD, Shimadzu, Japan). UV-vis spectra were obtained using a UV-1800
spectrophotometer (SHIMADZU), and visible and NIR transmission spectra was performed in 0.1 mol/L
TBAPF6/DCM solution. Thicknesses measurement of polymer films was performed by the DEKTAK-XK
profile-system. The CV, galvanostatic charge/discharge and electrochemical impedance spectroscopy (EIS)
were carried out on electrochemistry workstation of CHI660E in a three-electrode system with the
reference electrode of Ag/AgCl and the counter electrode of the platinum sheet, and the electrolyte was
selected as 0.1M LiClO4/ACN for the test of energy storage.
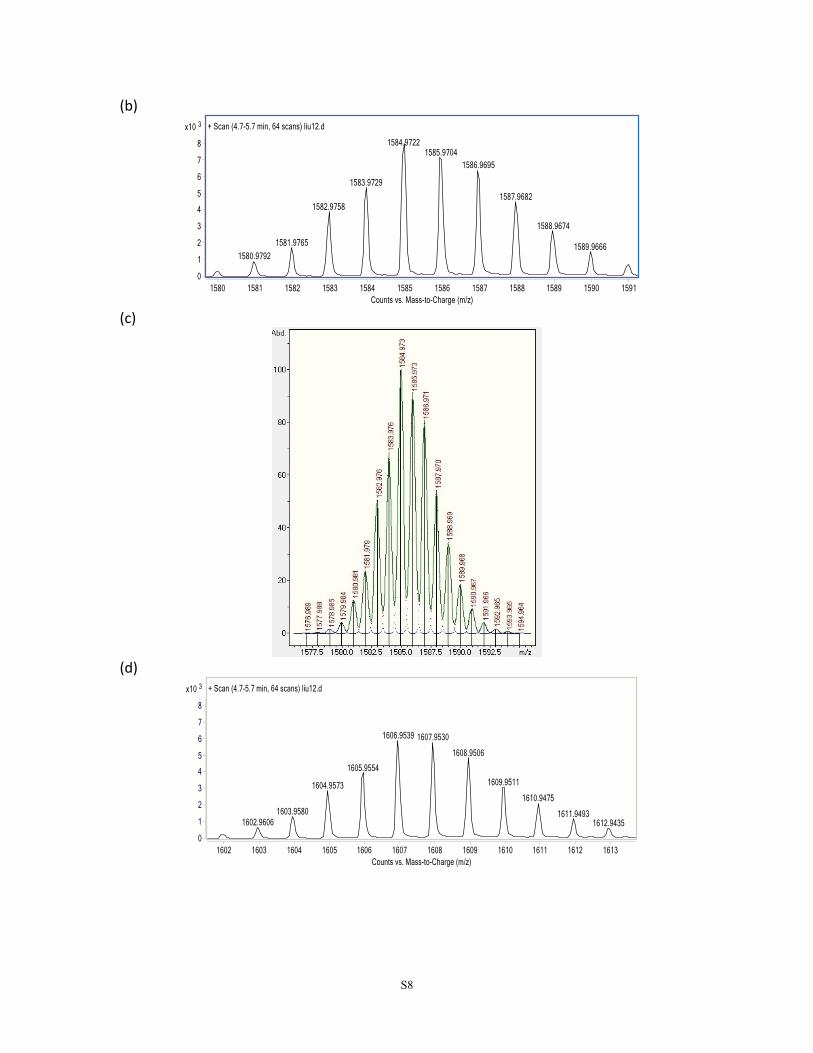
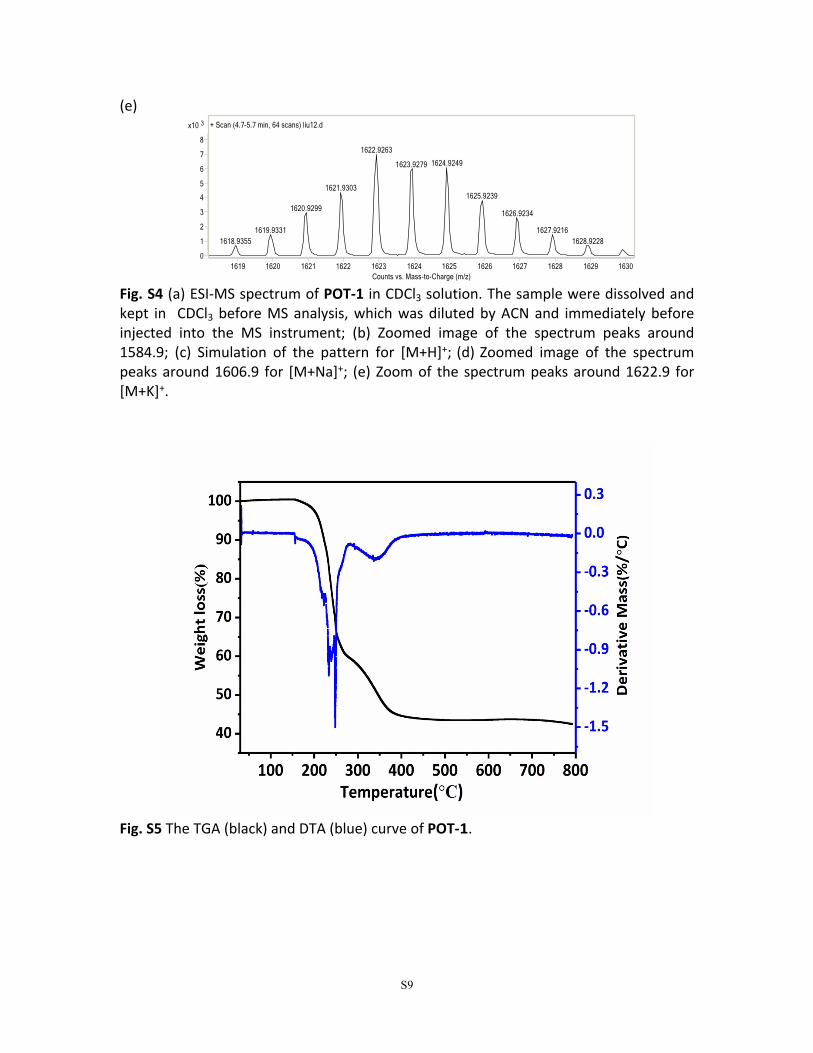
Fig. S4 (a) ESI-MS spectrum of POT-1 in CDCl3 solution. The sample were dissolved and kept in CDCl3 before MS analysis, which was diluted by ACN and immediately before injected into the MS instrument; (b) Zoomed image of the spectrum peaks around 1584.9; (c) Simulation of the pattern for [M+H]+; (d) Zoomed image of the spectrum peaks around 1606.9 for [M+Na]+; (e) Zoom of the spectrum peaks around 1622.9 for [M+K]+.
Fig. S5 The TGA (black) and DTA (blue) curve of POT-1.
S10
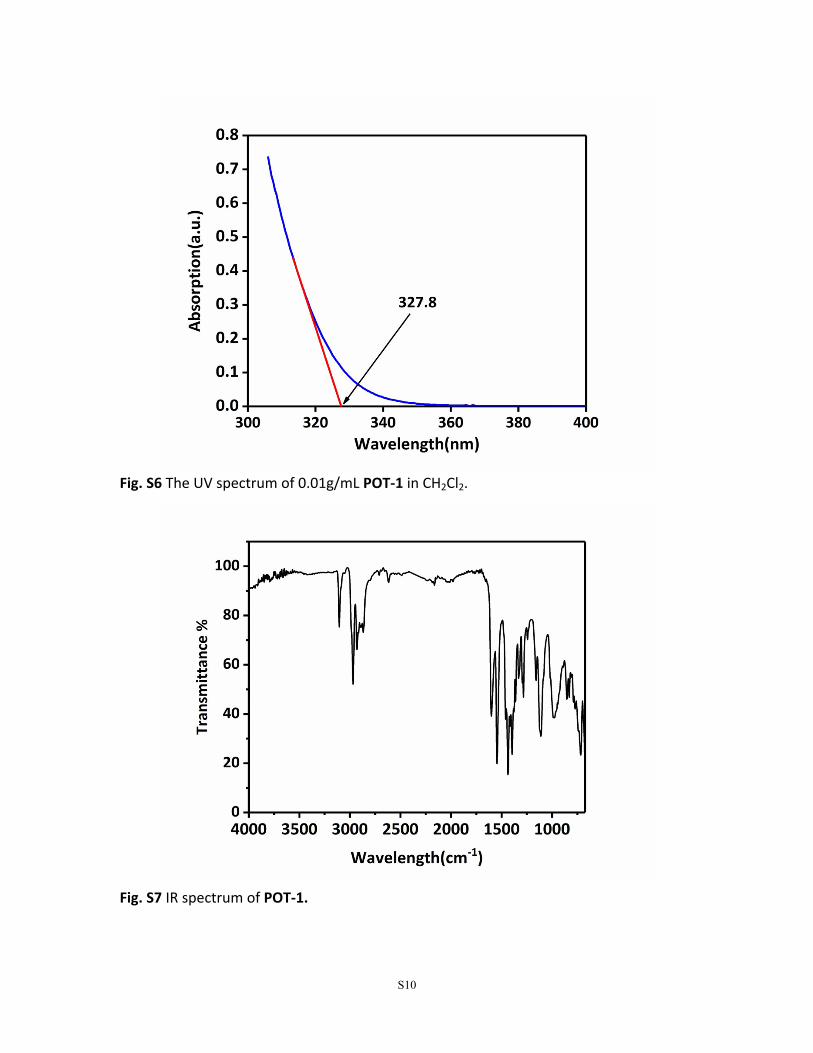
Fig. S6 The UV spectrum of 0.01g/mL POT-1 in CH2Cl2.
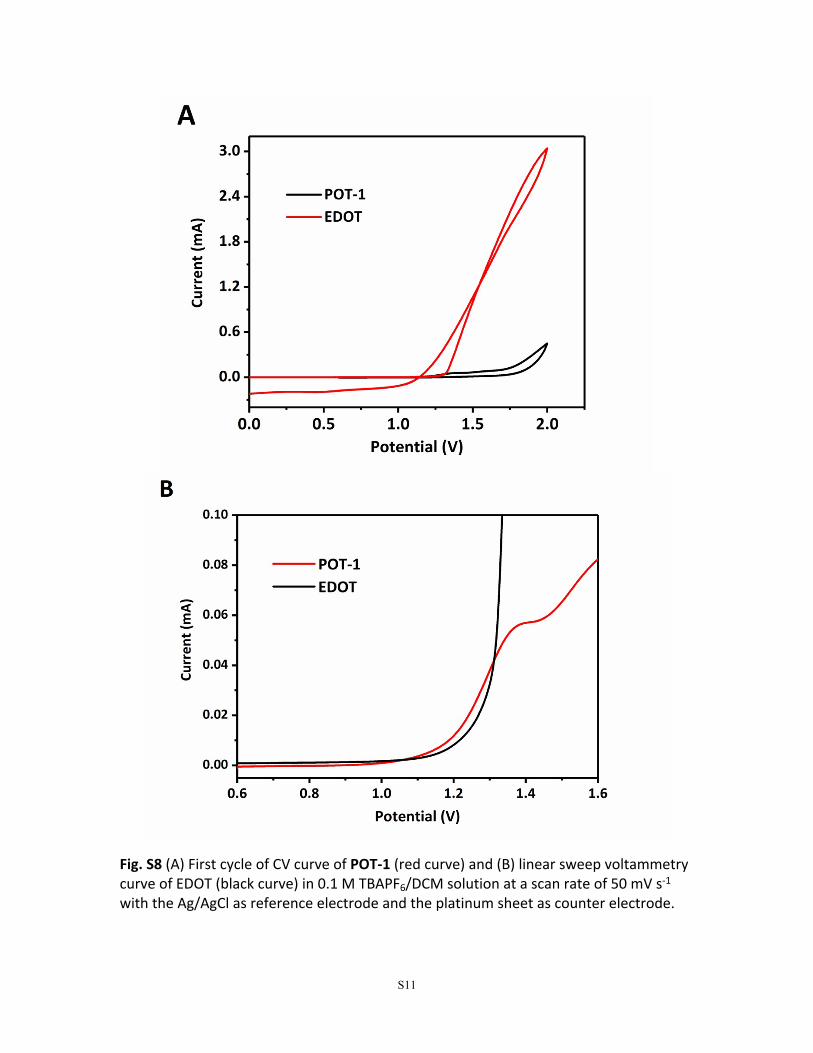
Fig. S7 IR spectrum of POT-1.
S11
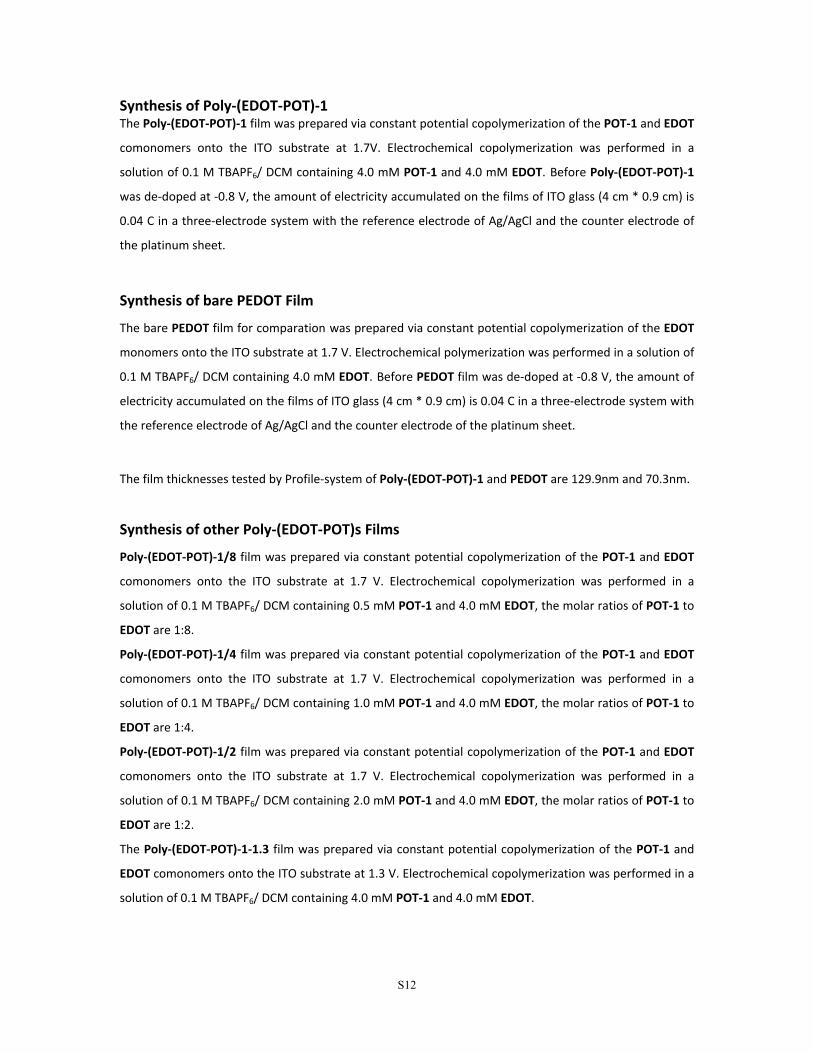
Fig. S8 (A) First cycle of CV curve of POT-1 (red curve) and (B) linear sweep voltammetry curve of EDOT (black curve) in 0.1 M TBAPF6/DCM solution at a scan rate of 50 mV s-1 with the Ag/AgCl as reference electrode and the platinum sheet as counter electrode.
S12
Synthesis of Poly-(EDOT-POT)-1The Poly-(EDOT-POT)-1 film was prepared via constant potential copolymerization of the POT-1 and EDOT
comonomers onto the ITO substrate at 1.7V. Electrochemical copolymerization was performed in a
solution of 0.1 M TBAPF6/ DCM containing 4.0 mM POT-1 and 4.0 mM EDOT. Before Poly-(EDOT-POT)-1
was de-doped at -0.8 V, the amount of electricity accumulated on the films of ITO glass (4 cm * 0.9 cm) is
0.04 C in a three-electrode system with the reference electrode of Ag/AgCl and the counter electrode of
the platinum sheet.
Synthesis of bare PEDOT Film
The bare PEDOT film for comparation was prepared via constant potential copolymerization of the EDOT
monomers onto the ITO substrate at 1.7 V. Electrochemical polymerization was performed in a solution of
0.1 M TBAPF6/ DCM containing 4.0 mM EDOT. Before PEDOT film was de-doped at -0.8 V, the amount of
electricity accumulated on the films of ITO glass (4 cm * 0.9 cm) is 0.04 C in a three-electrode system with
the reference electrode of Ag/AgCl and the counter electrode of the platinum sheet.
The film thicknesses tested by Profile-system of Poly-(EDOT-POT)-1 and PEDOT are 129.9nm and 70.3nm.
Synthesis of other Poly-(EDOT-POT)s Films
Poly-(EDOT-POT)-1/8 film was prepared via constant potential copolymerization of the POT-1 and EDOT
comonomers onto the ITO substrate at 1.7 V. Electrochemical copolymerization was performed in a
solution of 0.1 M TBAPF6/ DCM containing 0.5 mM POT-1 and 4.0 mM EDOT, the molar ratios of POT-1 to
EDOT are 1:8.
Poly-(EDOT-POT)-1/4 film was prepared via constant potential copolymerization of the POT-1 and EDOT
comonomers onto the ITO substrate at 1.7 V. Electrochemical copolymerization was performed in a
solution of 0.1 M TBAPF6/ DCM containing 1.0 mM POT-1 and 4.0 mM EDOT, the molar ratios of POT-1 to
EDOT are 1:4.
Poly-(EDOT-POT)-1/2 film was prepared via constant potential copolymerization of the POT-1 and EDOT
comonomers onto the ITO substrate at 1.7 V. Electrochemical copolymerization was performed in a
solution of 0.1 M TBAPF6/ DCM containing 2.0 mM POT-1 and 4.0 mM EDOT, the molar ratios of POT-1 to
EDOT are 1:2.
The Poly-(EDOT-POT)-1-1.3 film was prepared via constant potential copolymerization of the POT-1 and
EDOT comonomers onto the ITO substrate at 1.3 V. Electrochemical copolymerization was performed in a
solution of 0.1 M TBAPF6/ DCM containing 4.0 mM POT-1 and 4.0 mM EDOT.
S13
The Poly-(EDOT-POT)-1-1.4 film was prepared via constant potential copolymerization of the POT-1 and
EDOT comonomers onto the ITO substrate at 1.4 V. Electrochemical copolymerization was performed in a
solution of 0.1 M TBAPF6/ DCM containing 4.0 mM POT-1 and 4.0 mM EDOT.
The Poly-(EDOT-POT)-1-1.5 film was prepared via constant potential copolymerization of the POT-1 and
EDOT comonomers onto the ITO substrate at 1.5 V. Electrochemical copolymerization was performed in a
solution of 0.1 M TBAPF6/ DCM containing 4.0 mM POT-1 and 4.0 mM EDOT.
The Poly-(EDOT-POT)-1-1.6 film was prepared via constant potential copolymerization of the POT-1 and
EDOT comonomers onto the ITO substrate at 1.6 V. Electrochemical copolymerization was performed in a
solution of 0.1 M TBAPF6/ DCM containing 4.0 mM POT-1 and 4.0 mM EDOT.
The Poly-(EDOT-POT)-1-1.8 film was prepared via constant potential copolymerization of the POT-1 and
EDOT comonomers onto the ITO substrate at 1.8 V. Electrochemical copolymerization was performed in a
solution of 0.1 M TBAPF6/ DCM containing 4.0 mM POT-1 and 4.0 mM EDOT.
The Poly-(EDOT-POT)-1-1.9 film was prepared via constant potential copolymerization of the POT-1 and
EDOT comonomers onto the ITO substrate at 1.9 V. Electrochemical copolymerization was performed in a
solution of 0.1 M TBAPF6/ DCM containing 4.0 mM POT-1 and 4.0 mM EDOT.
The Poly-(EDOT-POT)-1-2.0 film was prepared via constant potential copolymerization of the POT-1 and
EDOT comonomers onto the ITO substrate at 2.0 V. Electrochemical copolymerization was performed in a
solution of 0.1 M TBAPF6/ DCM containing 4.0 mM POT-1 and 4.0 mM EDOT.
Before Poly-(EDOT-POT)s was de-doped at -0.8 V, the amount of electricity accumulated on the films of
ITO glass (4 cm * 0.9 cm) are around 0.04 C in a three-electrode system with the reference electrode of
Ag/AgCl and the counter electrode of the platinum sheet.
S14
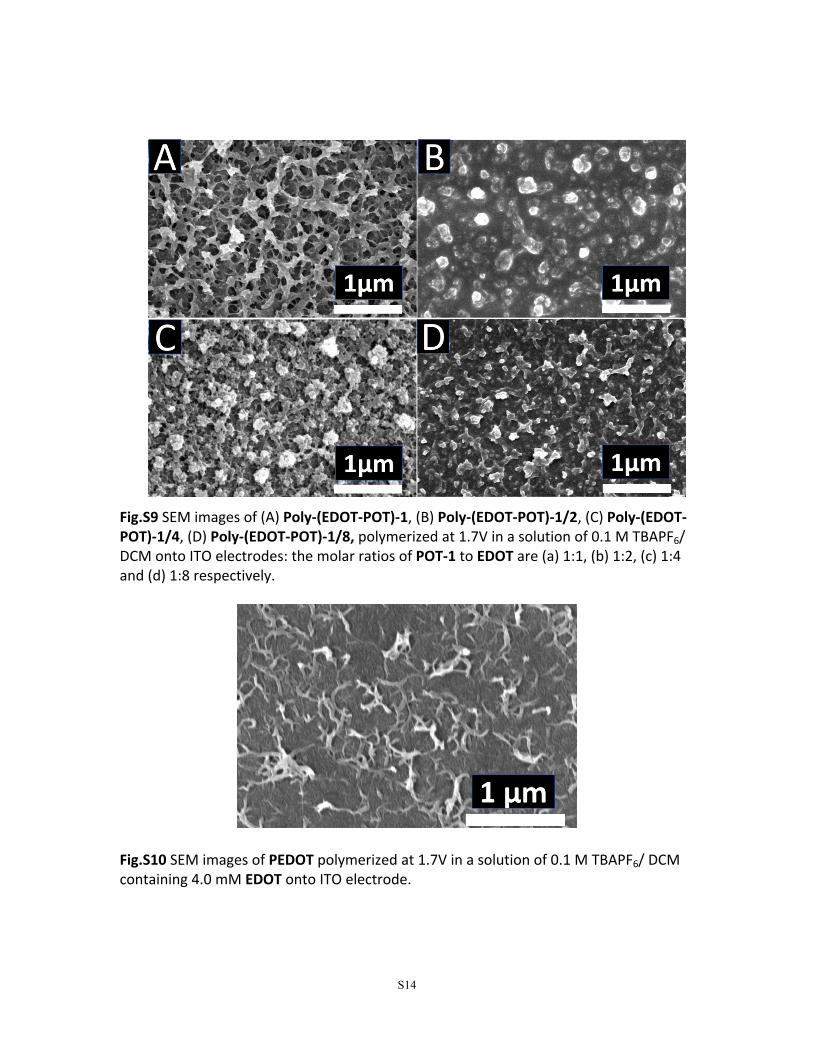
Fig.S9 SEM images of (A) Poly-(EDOT-POT)-1, (B) Poly-(EDOT-POT)-1/2, (C) Poly-(EDOT-POT)-1/4, (D) Poly-(EDOT-POT)-1/8, polymerized at 1.7V in a solution of 0.1 M TBAPF6/ DCM onto ITO electrodes: the molar ratios of POT-1 to EDOT are (a) 1:1, (b) 1:2, (c) 1:4 and (d) 1:8 respectively.
Fig.S10 SEM images of PEDOT polymerized at 1.7V in a solution of 0.1 M TBAPF6/ DCM containing 4.0 mM EDOT onto ITO electrode.
S15
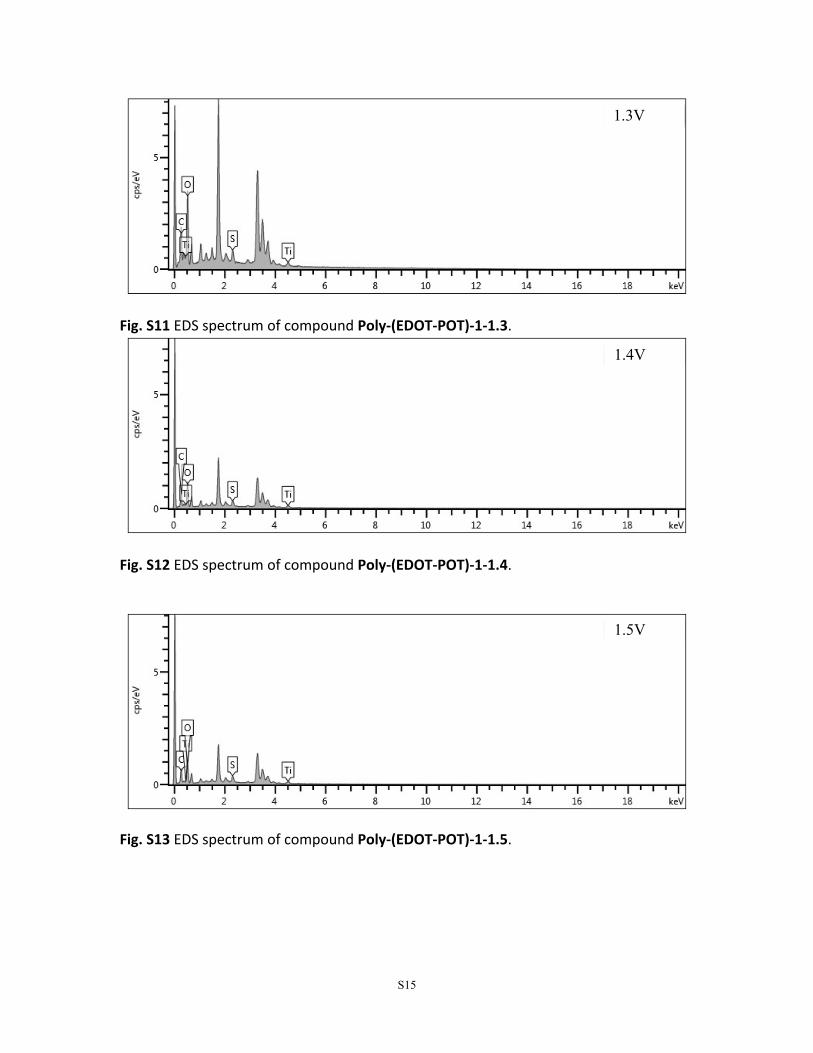
Fig. S11 EDS spectrum of compound Poly-(EDOT-POT)-1-1.3.
Fig. S12 EDS spectrum of compound Poly-(EDOT-POT)-1-1.4.
Fig. S13 EDS spectrum of compound Poly-(EDOT-POT)-1-1.5.
1.3V
1.4V
1.5V
S16
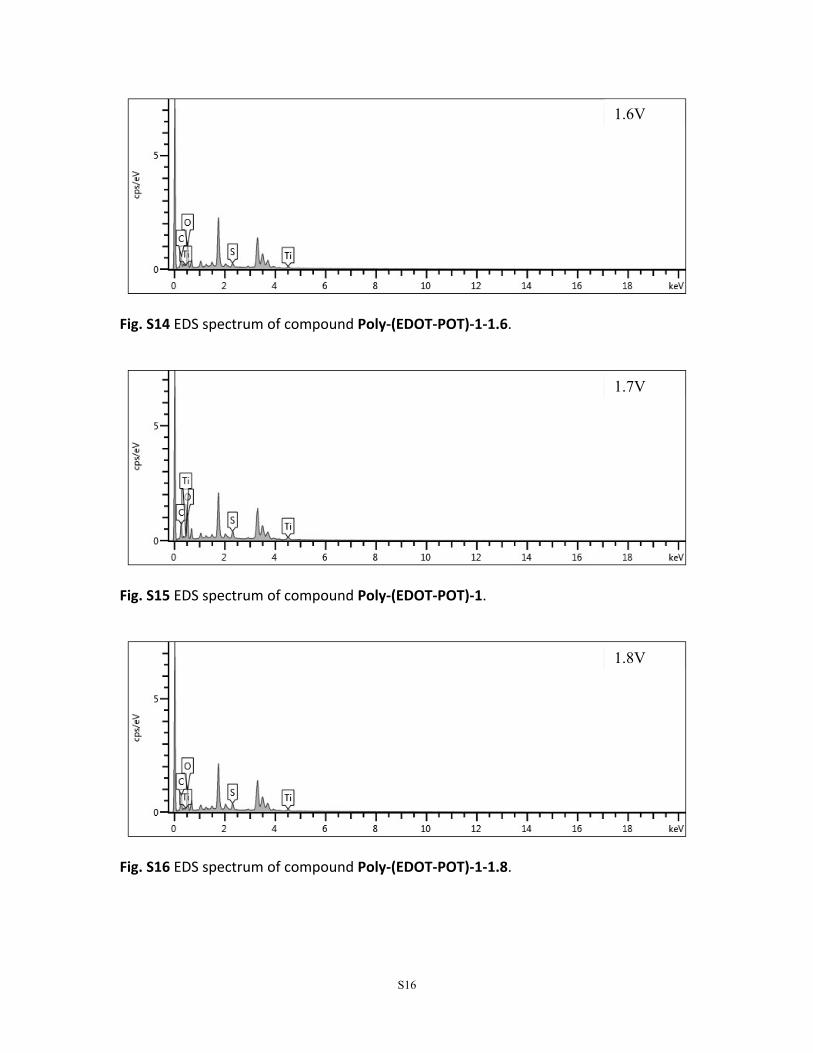
Fig. S14 EDS spectrum of compound Poly-(EDOT-POT)-1-1.6.
Fig. S15 EDS spectrum of compound Poly-(EDOT-POT)-1.
Fig. S16 EDS spectrum of compound Poly-(EDOT-POT)-1-1.8.
1.6V
1.7V
1.8V
S17
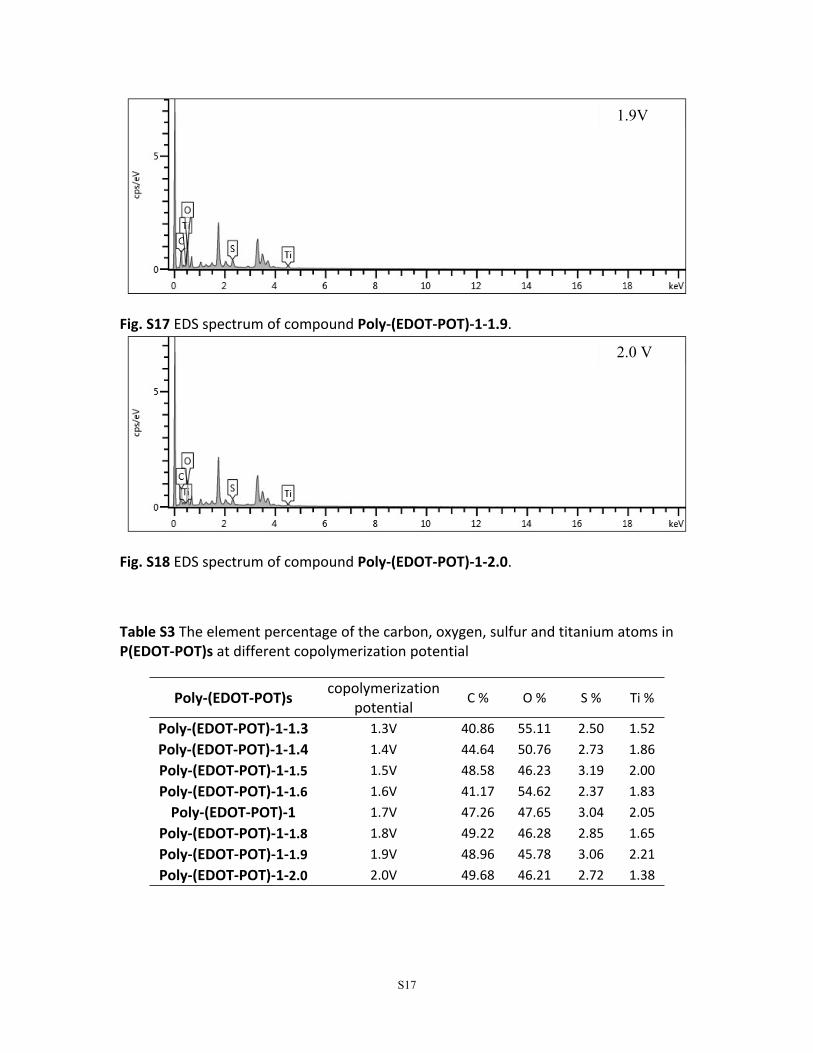
Fig. S17 EDS spectrum of compound Poly-(EDOT-POT)-1-1.9.
Fig. S18 EDS spectrum of compound Poly-(EDOT-POT)-1-2.0.
Table S3 The element percentage of the carbon, oxygen, sulfur and titanium atoms in P(EDOT-POT)s at different copolymerization potential
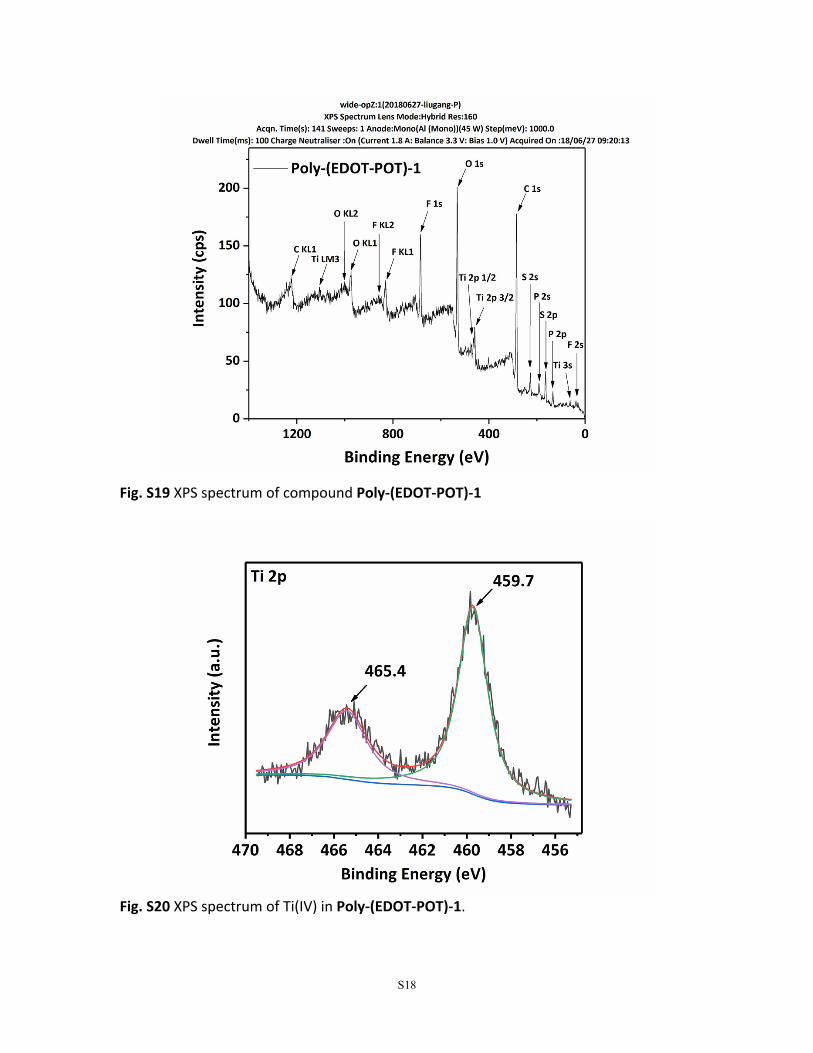
Fig. S19 XPS spectrum of compound Poly-(EDOT-POT)-1
Fig. S20 XPS spectrum of Ti(IV) in Poly-(EDOT-POT)-1.
S19
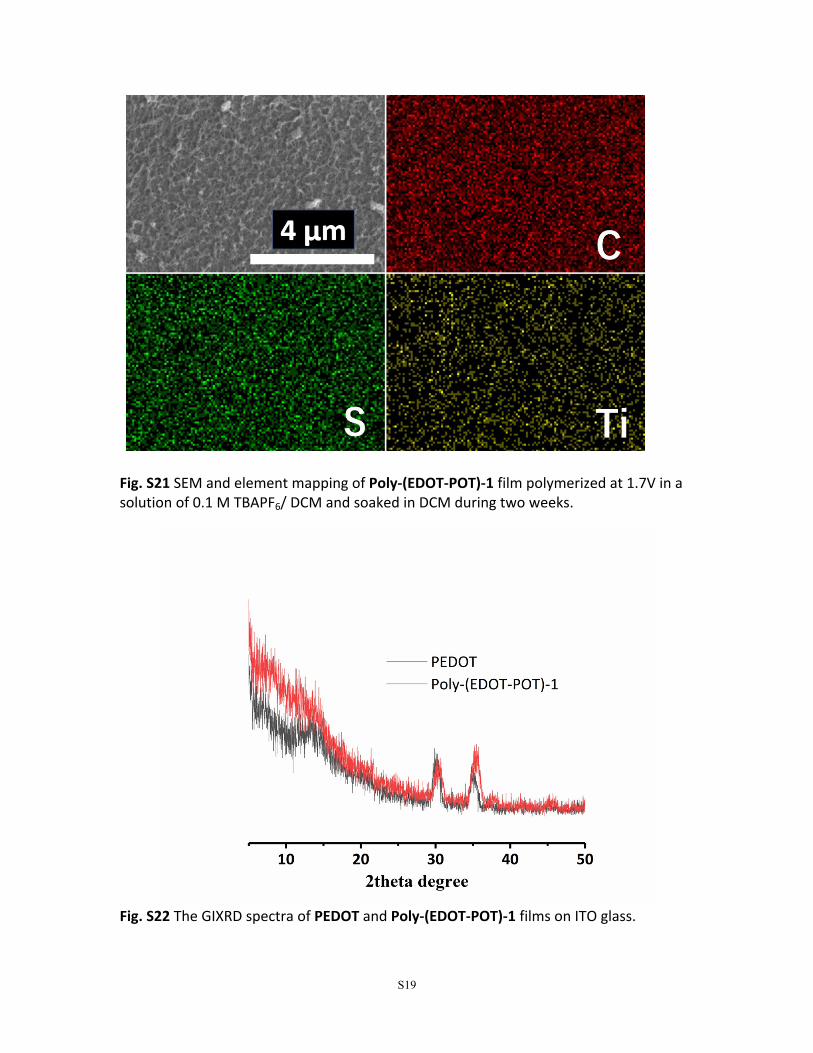
Fig. S21 SEM and element mapping of Poly-(EDOT-POT)-1 film polymerized at 1.7V in a solution of 0.1 M TBAPF6/ DCM and soaked in DCM during two weeks.
Fig. S22 The GIXRD spectra of PEDOT and Poly-(EDOT-POT)-1 films on ITO glass.
S20
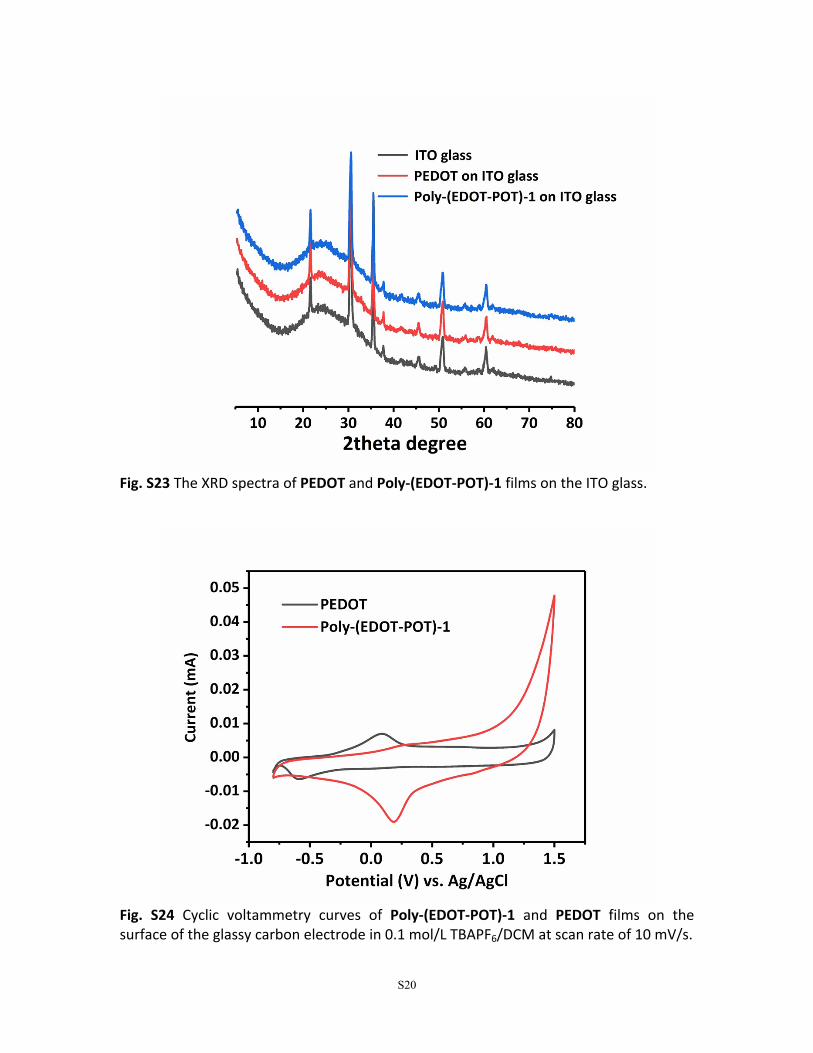
Fig. S23 The XRD spectra of PEDOT and Poly-(EDOT-POT)-1 films on the ITO glass.
Fig. S24 Cyclic voltammetry curves of Poly-(EDOT-POT)-1 and PEDOT films on the surface of the glassy carbon electrode in 0.1 mol/L TBAPF6/DCM at scan rate of 10 mV/s.
S21
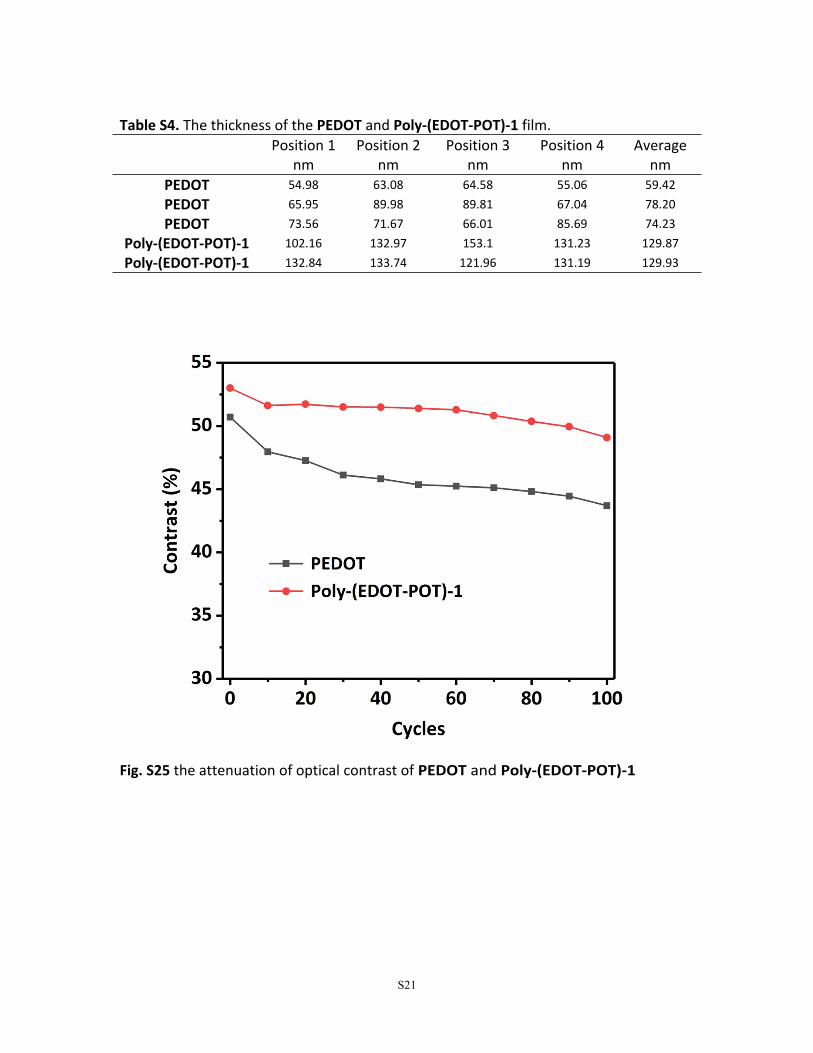
Table S4. The thickness of the PEDOT and Poly-(EDOT-POT)-1 film.Position 1
Fig. S25 the attenuation of optical contrast of PEDOT and Poly-(EDOT-POT)-1
S22
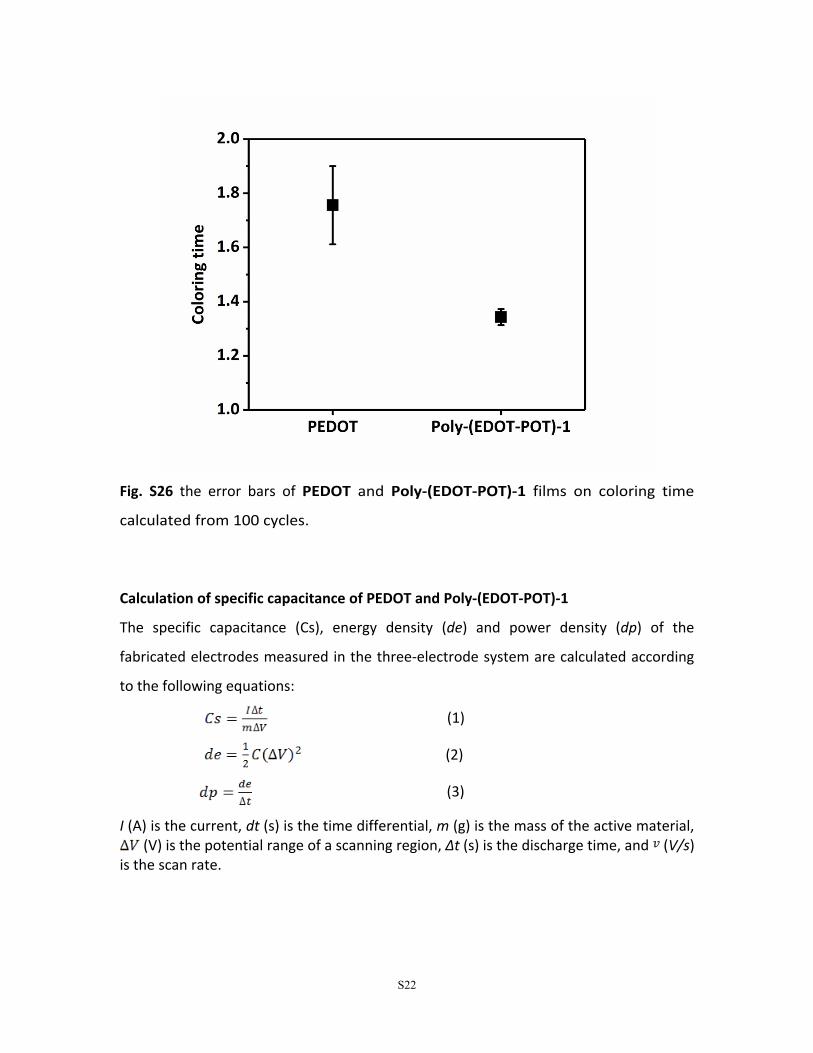
Fig. S26 the error bars of PEDOT and Poly-(EDOT-POT)-1 films on coloring time
calculated from 100 cycles.
Calculation of specific capacitance of PEDOT and Poly-(EDOT-POT)-1
The specific capacitance (Cs), energy density (de) and power density (dp) of the
fabricated electrodes measured in the three-electrode system are calculated according
to the following equations:
(1)
(2)
(3)
I (A) is the current, dt (s) is the time differential, m (g) is the mass of the active material, (V) is the potential range of a scanning region, Δt (s) is the discharge time, and (V/s) 𝑣
is the scan rate.
S23
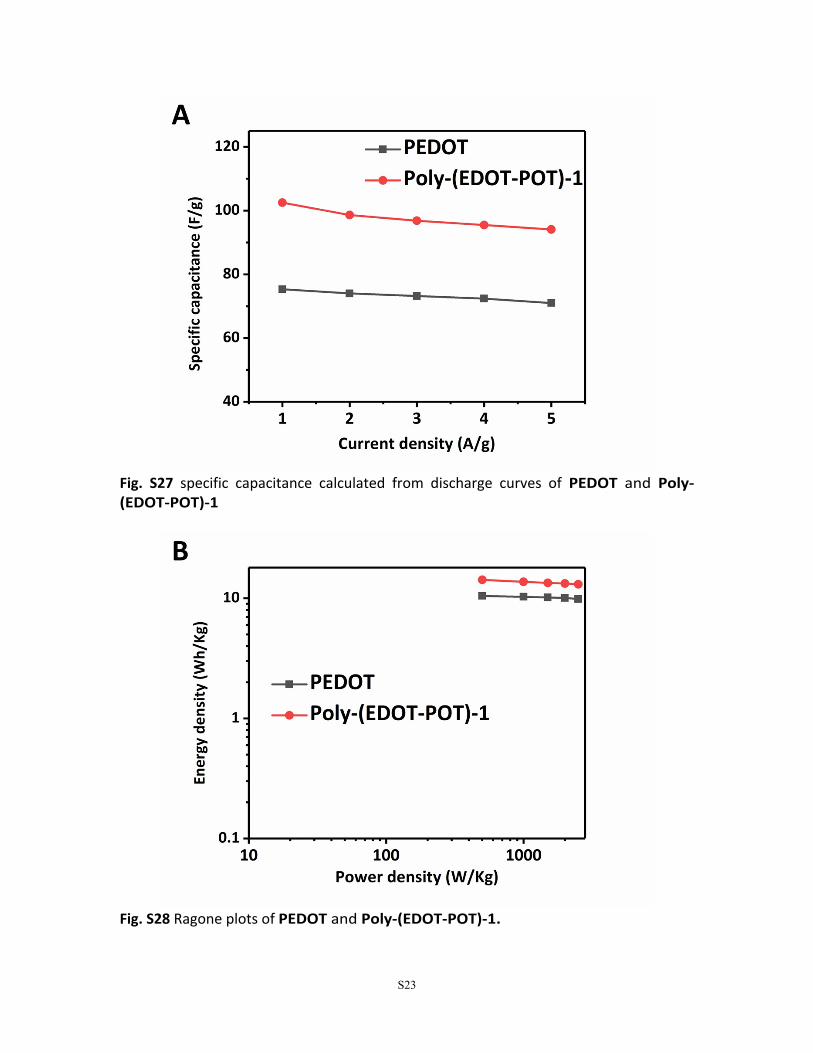
Fig. S27 specific capacitance calculated from discharge curves of PEDOT and Poly-(EDOT-POT)-1
Fig. S28 Ragone plots of PEDOT and Poly-(EDOT-POT)-1.
S24
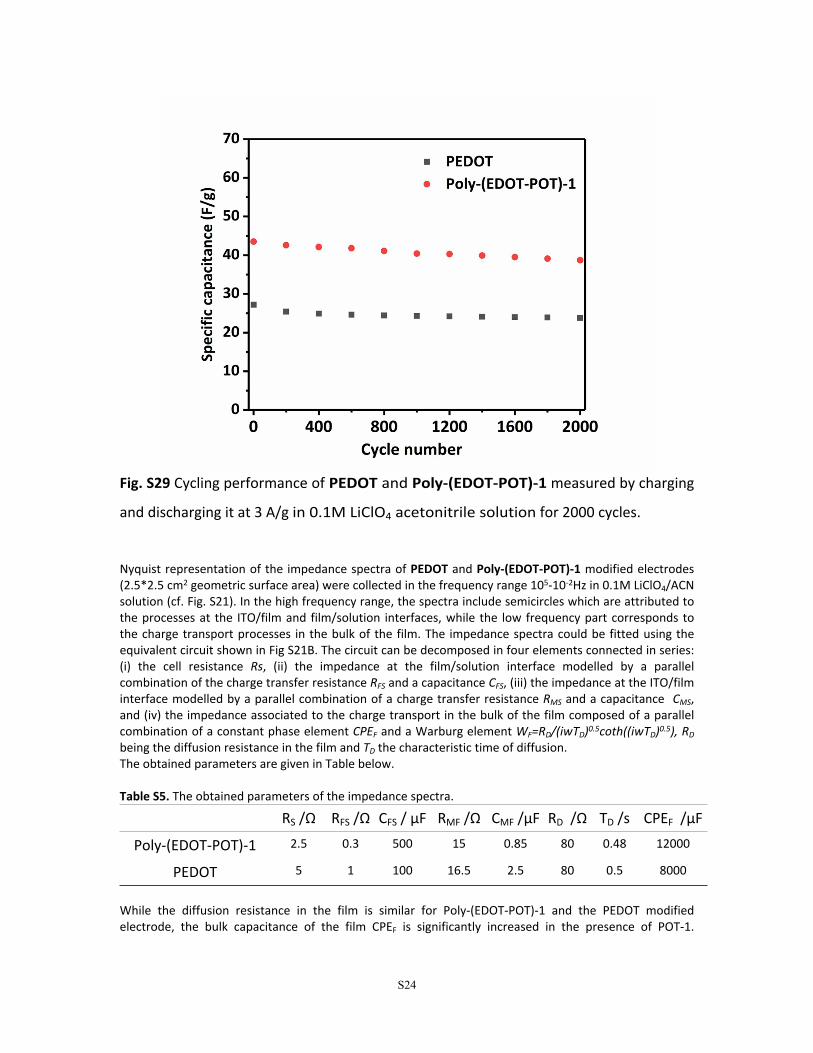
Fig. S29 Cycling performance of PEDOT and Poly-(EDOT-POT)-1 measured by charging
and discharging it at 3 A/g in 0.1M LiClO4 acetonitrile solution for 2000 cycles.
Nyquist representation of the impedance spectra of PEDOT and Poly-(EDOT-POT)-1 modified electrodes (2.5*2.5 cm2 geometric surface area) were collected in the frequency range 105-10-2Hz in 0.1M LiClO4/ACN solution (cf. Fig. S21). In the high frequency range, the spectra include semicircles which are attributed to the processes at the ITO/film and film/solution interfaces, while the low frequency part corresponds to the charge transport processes in the bulk of the film. The impedance spectra could be fitted using the equivalent circuit shown in Fig S21B. The circuit can be decomposed in four elements connected in series: (i) the cell resistance Rs, (ii) the impedance at the film/solution interface modelled by a parallel combination of the charge transfer resistance RFS and a capacitance CFS, (iii) the impedance at the ITO/film interface modelled by a parallel combination of a charge transfer resistance RMS and a capacitance CMS, and (iv) the impedance associated to the charge transport in the bulk of the film composed of a parallel combination of a constant phase element CPEF and a Warburg element WF=RD/(iwTD)0.5coth((iwTD)0.5), RD being the diffusion resistance in the film and TD the characteristic time of diffusion.The obtained parameters are given in Table below.
Table S5. The obtained parameters of the impedance spectra.
While the diffusion resistance in the film is similar for Poly-(EDOT-POT)-1 and the PEDOT modified electrode, the bulk capacitance of the film CPEF is significantly increased in the presence of POT-1.
S25
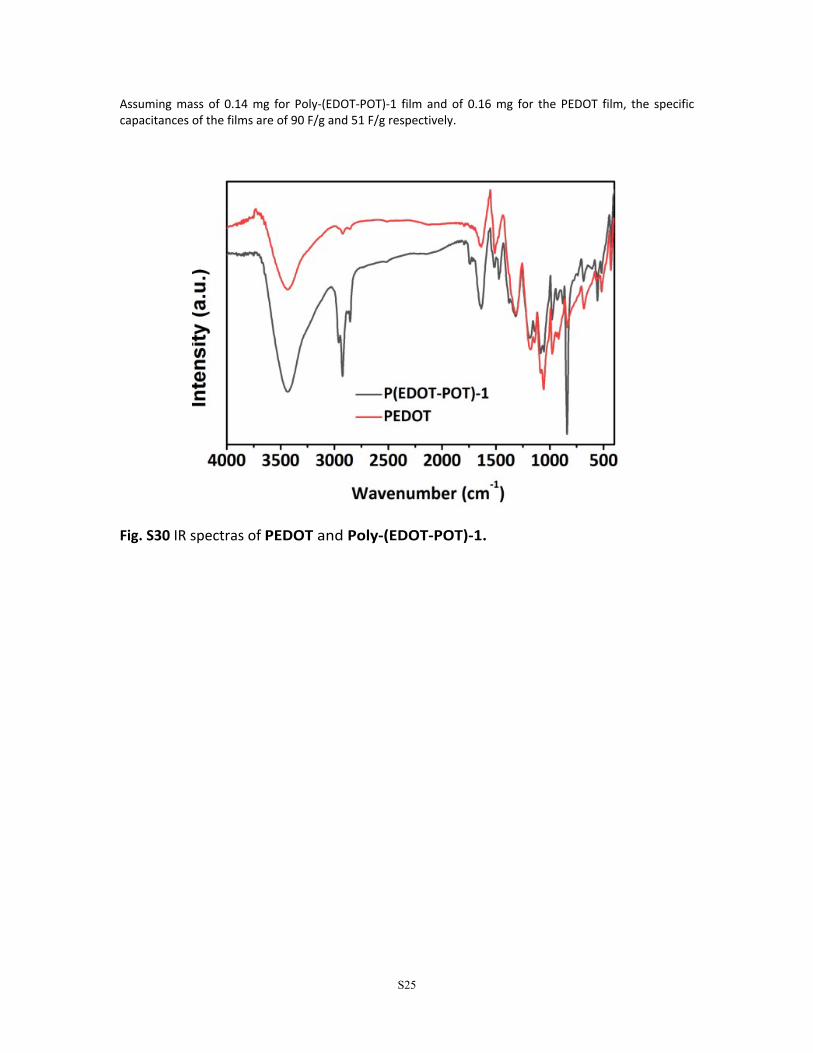
Assuming mass of 0.14 mg for Poly-(EDOT-POT)-1 film and of 0.16 mg for the PEDOT film, the specific capacitances of the films are of 90 F/g and 51 F/g respectively.
Fig. S30 IR spectras of PEDOT and Poly-(EDOT-POT)-1.