Supporting Information Tsui et al. 10.1073/pnas.1114026108 SI Materials and Methods Mouse Model of Hemodilutional Anemia. All animal protocols were approved by the Animal Care and Use Committee at St. Michael’s Hospital in accordance with the requirements of Canadian Council on Animal Care. Spontaneously breathing male mice (nNOS −/− , eNOS −/− , iNOS −/− , GSNOR −/− , and C57BL6/J; The Jackson Laboratory) were anesthetized by 1.5% isoflurane in 21% O 2 . Hemodilution was performed in steps of 200 μL by exchanging equal volume of blood with pentastarch (Bristol- Myers Squibb) via the tail vein. Blood samples were collected from a tail nick. Hemoglobin concentration (Hb; CO-oximeter) and blood gases were measured (Radiometer). For acute ex- periments, mice were hemodiluted until mortality. For recovery studies, hemodilution was performed to a target Hb near 50 g/L and mice were then recovered for up to 24 h for tissue harvesting. Mouse Model of Acute Systemic Hypoxia. For acute survival studies, mice anesthetized with 1.5% isoflurane were exposed to gradual reduction of inspired oxygen concentration (F I O 2 ) from 21% to 5% oxygen in ≈5% increments, with each step lasting for 15 min. The final F I O 2 was kept at 5% O 2 during which the time of mortality was assessed. For recovery experiments, conscious mice were placed in a sealed hypoxic chamber supplied with 6% oxygen for 6 h. Inspired oxygen concentration was continuously monitored by gas analyzer (Ohmeda). Tissues were harvested for RNA and protein measurements. Measurement of Cardiovascular Parameters. Cardiac outputs (CO) were measured in separate groups of spontaneously breathing anemic or hypoxic mice under isoflurane anesthesia. Anemic mice were hemodiluted until a Hb of 50 g/L was achieved. These mice underwent serial CO measurements by ultrasound biomicroscopy (Vevo 770). After hair removal, long axis ultrasound images of the heart were obtained. The end-systolic and end-diastolic areas were traced and converted to volumes. Stroke volume was computed by the difference between end-systolic and end-di- astolic volumes. The product of stroke volume and heart rate (EKG) yielded CO. CO was also measured during normoxia (21% O 2 ) and hypoxia (15% O 2 ) in separate mice. Additional meas- urements of CO in anemic and hypoxic mice were performed by using pressure volume loop analysis as described (1). Mean ar- terial blood pressure (MAP) was measured directly by femoral artery catheter. Physiological data were continuously acquired by PowerLab system (ADInstrument). Vascular Reactivity. Myogenic tone and phenylephrine-stimulated vasomotor responses were assessed in isolated murine mesenteric resistance arteries, as described (2). Mice were fully anesthetized and then euthanized by cervical dislocation. The mesentery was removed and placed in ice-cold Mops buffer containing 145 mmol/L NaCl, 4.7 mmol/L KCl, 3.0 mmol/L CaCl 2 , 1.17 mmol/L MgSO 4 ·7H 2 O, 1.2 mmol/L NaH 2 PO 4 ·2H 2 O, 2.0 mmol/L pyru- vate, 0.02 mmol/L EDTA, 3.0 mmol/L Mops (3-morpholino- propanesulfonic acid), and 5.0 mmol/L glucose. Mesenteric resistance arteries were carefully dissected away from the mes- entery, cannulated onto glass micropipettes, stretched to their in vivo lengths, and pressurized to 45 mmHg. The vessels were then warmed to 37 °C; transmural pressure was then increased to 60 mmHg. All functional experiments were conducted in Mops- buffered saline at 37 °C with no perfusion. To measure myogenic tone, vessels were subjected to step-wise increases in transmural pressure (20-mmHg increments) from 20 to 100 mmHg. At each pressure step, vessel diameter (dia active ) was measured once a steady state was reached (3–5 min). Myogenic tone was calculated as the percent constriction in re- lation to the maximal diameter at each respective transmural pressure: tone (% of dia max ) = [(dia max − dia active )/dia max ] × 100, where dia active is the vessel diameter in Mops containing Ca 2+ and dia max is the maximal diameter in Ca 2+ -free Mops. Vasomotor responses to increasing concentrations of phenyl- ephrine (10 −9 to 10 −5 mol/L) used the tone same calculation, only in this case, dia active represents the vessel diameter at steady state after application of the given concentration of phenyleph- rine and dia max represents the maximal diameter (measured under Ca 2+ -free conditions) at 60 mmHg. Measurement of Microvascular Brain PO 2 . Oxygen tension in the blood within the microvasculature of the brain was measured during hemodilution by using Oxyphor G2 phosphorescence methodology as described (3, 4). Anesthetized (1.5% isoflurane) spontaneously breathing animals were placed in a stereotaxic frame, and two burr holes were performed over the parieto- temporal cerebral cortex, lateral to the sagital sinus. Excitation and receiving light guides (2-mm core diameter) were positioned such that the light passed through the cerebral cortex and deeper brain structures. Mice were injected i.v. with Oxyphor G2 (0.1 mg in 20 μL, second generation glutamate dendrimer of Pd-tetra- [4-carboxyphenyl] tetrabenzoporphyrin) and the oxygen pres- sure (by phosphorescence lifetime) measured by a PMOD 5000 (Oxygen Enterprises). Protein Measurement by Western Blotting. Brains were excised from control and anemic (1, 6, and 24 h) mice. Tissues were homog- enized by using a polytron (Beckman) in buffer A (20 mM Hepes at pH 7.5, 1.5 mM MgCl 2 , 0.2 mM EDTA, 100 mM NaCl, 0.5 mM PMSF, 1 μg/mL Leupeptin, and 0.2 mM DTT), and centrifuged at 10,000 × g for 30 min in 4 °C. Total protein lysate was obtained by mixing the supernatant with buffer B (buffer A + 40% vol/vol Glycerol). Protein samples were quantified by Lowry assay (Bio- Rad), aliquoted, and stored at −80 C. Aliqiuots (20 μg) of pro- tein from mouse brain were separated on a 7.5% SDS-poly- acrylamide gel, transferred onto nitrocellulose membrane, and transfer efficiency was verified by Ponceau red-stained mem- branes. Membranes were blocked with 5% milk and probed with monoclonal nNOS (BD Biosciences), polyclonal HIF-1α (R&D Systems), HIF-2α (Novus Biologicals), and GSNOR (Protein- Tech Group) antibodies. Immunoblots were probed with ap- propriate secondary antibodies. Immunoreactive bands were detected by enhanced chemiluminescence (Sigma) and quanti- fied by densitometry using ImageJ software. α-Tubulin (Sigma) was used as loading control. Immunofluorescence Staining. After 24 h of anemia (Hb ∼ 50g/L) or hypoxia (6% O 2 ), animals were anesthetized and gravity was perfused via cardiac puncture with 4% formaldehyde. Tissues were extracted and placed in 4% formaldehyde for blocking. Immunofluroescence was performed on 10-μm fixed tissue sec- tions (4% paraformaldehyde) by incubating slides overnight at 4 °C with diluents of specific primary monoclonal antibodies for neuronal nitric oxide synthase (nNOS) (BD Biosciences), and HIF-1α (Novus Biologicals) and specific binding were detected with an appropriately labeled secondary antibody. Microscopy was performed by using fluorescent and confocal microscopes (Nikon ECLIPSE 90i, Bio-Rad Radiance 2100). Tsui et al. www.pnas.org/cgi/content/short/1114026108 1 of 10
Transcript
Supporting InformationTsui et al. 10.1073/pnas.1114026108SI Materials and MethodsMouse Model of Hemodilutional Anemia. All animal protocols wereapproved by the Animal Care andUse Committee at St. Michael’sHospital in accordance with the requirements of CanadianCouncil on Animal Care. Spontaneously breathing male mice(nNOS−/−, eNOS−/−, iNOS−/−, GSNOR−/−, and C57BL6/J; TheJackson Laboratory) were anesthetized by 1.5% isoflurane in21% O2. Hemodilution was performed in steps of 200 μL byexchanging equal volume of blood with pentastarch (Bristol-Myers Squibb) via the tail vein. Blood samples were collectedfrom a tail nick. Hemoglobin concentration (Hb; CO-oximeter)and blood gases were measured (Radiometer). For acute ex-periments, mice were hemodiluted until mortality. For recoverystudies, hemodilution was performed to a target Hb near 50 g/Land mice were then recovered for up to 24 h for tissue harvesting.
Mouse Model of Acute Systemic Hypoxia. For acute survival studies,mice anesthetized with 1.5% isoflurane were exposed to gradualreduction of inspired oxygen concentration (FIO2) from 21% to5% oxygen in ≈5% increments, with each step lasting for 15 min.The final FIO2 was kept at 5% O2 during which the time ofmortality was assessed. For recovery experiments, consciousmice were placed in a sealed hypoxic chamber supplied with 6%oxygen for 6 h. Inspired oxygen concentration was continuouslymonitored by gas analyzer (Ohmeda). Tissues were harvested forRNA and protein measurements.
Measurement of Cardiovascular Parameters. Cardiac outputs (CO)were measured in separate groups of spontaneously breathinganemic or hypoxic mice under isoflurane anesthesia. Anemic micewere hemodiluted until a Hb of 50 g/L was achieved. These miceunderwent serial CO measurements by ultrasound biomicroscopy(Vevo 770). After hair removal, long axis ultrasound images of theheart were obtained. The end-systolic and end-diastolic areaswere traced and converted to volumes. Stroke volume wascomputed by the difference between end-systolic and end-di-astolic volumes. The product of stroke volume and heart rate(EKG) yielded CO. COwas alsomeasured during normoxia (21%O2) and hypoxia (15% O2) in separate mice. Additional meas-urements of CO in anemic and hypoxic mice were performed byusing pressure volume loop analysis as described (1). Mean ar-terial blood pressure (MAP) was measured directly by femoralartery catheter. Physiological data were continuously acquired byPowerLab system (ADInstrument).
Vascular Reactivity. Myogenic tone and phenylephrine-stimulatedvasomotor responses were assessed in isolated murine mesentericresistance arteries, as described (2). Mice were fully anesthetizedand then euthanized by cervical dislocation. The mesentery wasremoved and placed in ice-cold Mops buffer containing 145mmol/L NaCl, 4.7 mmol/L KCl, 3.0 mmol/L CaCl2, 1.17 mmol/LMgSO4·7H2O, 1.2 mmol/L NaH2PO4·2H2O, 2.0 mmol/L pyru-vate, 0.02 mmol/L EDTA, 3.0 mmol/L Mops (3-morpholino-propanesulfonic acid), and 5.0 mmol/L glucose. Mesentericresistance arteries were carefully dissected away from the mes-entery, cannulated onto glass micropipettes, stretched to their invivo lengths, and pressurized to 45 mmHg. The vessels were thenwarmed to 37 °C; transmural pressure was then increased to 60mmHg. All functional experiments were conducted in Mops-buffered saline at 37 °C with no perfusion.To measure myogenic tone, vessels were subjected to step-wise
increases in transmural pressure (20-mmHg increments) from 20
to 100 mmHg. At each pressure step, vessel diameter (diaactive)was measured once a steady state was reached (3–5 min).Myogenic tone was calculated as the percent constriction in re-lation to the maximal diameter at each respective transmuralpressure: tone (% of diamax) = [(diamax − diaactive)/diamax] × 100,where diaactive is the vessel diameter in Mops containing Ca2+
and diamax is the maximal diameter in Ca2+-free Mops.Vasomotor responses to increasing concentrations of phenyl-
ephrine (10−9 to 10−5 mol/L) used the tone same calculation,only in this case, diaactive represents the vessel diameter at steadystate after application of the given concentration of phenyleph-rine and diamax represents the maximal diameter (measuredunder Ca2+-free conditions) at 60 mmHg.
Measurement of Microvascular Brain PO2. Oxygen tension in theblood within the microvasculature of the brain was measuredduring hemodilution by using Oxyphor G2 phosphorescencemethodology as described (3, 4). Anesthetized (1.5% isoflurane)spontaneously breathing animals were placed in a stereotaxicframe, and two burr holes were performed over the parieto-temporal cerebral cortex, lateral to the sagital sinus. Excitationand receiving light guides (2-mm core diameter) were positionedsuch that the light passed through the cerebral cortex and deeperbrain structures. Mice were injected i.v. with Oxyphor G2 (0.1 mgin 20 μL, second generation glutamate dendrimer of Pd-tetra-[4-carboxyphenyl] tetrabenzoporphyrin) and the oxygen pres-sure (by phosphorescence lifetime) measured by a PMOD 5000(Oxygen Enterprises).
Protein Measurement by Western Blotting.Brains were excised fromcontrol and anemic (1, 6, and 24 h) mice. Tissues were homog-enized by using a polytron (Beckman) in buffer A (20 mM Hepesat pH 7.5, 1.5 mMMgCl2, 0.2 mMEDTA, 100 mMNaCl, 0.5 mMPMSF, 1 μg/mL Leupeptin, and 0.2 mM DTT), and centrifugedat 10,000 × g for 30 min in 4 °C. Total protein lysate was obtainedby mixing the supernatant with buffer B (buffer A + 40% vol/volGlycerol). Protein samples were quantified by Lowry assay (Bio-Rad), aliquoted, and stored at −80 C. Aliqiuots (20 μg) of pro-tein from mouse brain were separated on a 7.5% SDS-poly-acrylamide gel, transferred onto nitrocellulose membrane, andtransfer efficiency was verified by Ponceau red-stained mem-branes. Membranes were blocked with 5% milk and probed withmonoclonal nNOS (BD Biosciences), polyclonal HIF-1α (R&DSystems), HIF-2α (Novus Biologicals), and GSNOR (Protein-Tech Group) antibodies. Immunoblots were probed with ap-propriate secondary antibodies. Immunoreactive bands weredetected by enhanced chemiluminescence (Sigma) and quanti-fied by densitometry using ImageJ software. α-Tubulin (Sigma)was used as loading control.
Immunofluorescence Staining. After 24 h of anemia (Hb ∼ 50g/L)or hypoxia (6% O2), animals were anesthetized and gravity wasperfused via cardiac puncture with 4% formaldehyde. Tissueswere extracted and placed in 4% formaldehyde for blocking.Immunofluroescence was performed on 10-μm fixed tissue sec-tions (4% paraformaldehyde) by incubating slides overnight at4 °C with diluents of specific primary monoclonal antibodies forneuronal nitric oxide synthase (nNOS) (BD Biosciences), andHIF-1α (Novus Biologicals) and specific binding were detectedwith an appropriately labeled secondary antibody. Microscopywas performed by using fluorescent and confocal microscopes(Nikon ECLIPSE 90i, Bio-Rad Radiance 2100).
Tsui et al. www.pnas.org/cgi/content/short/1114026108 1 of 10
Quantitative Real-Time RT-PCR. Total cellular RNA was extractedfrom tissue samples by homogenizer using the guandidium thi-ocynaide/phenol chloroform methodology as described (5). First-strand cDNA was synthesized from 1 μg of RNA by using randomprimers and SuperScript III Reverse Transcriptase (Invitrogen).Exogenously synthesized capped polyadenylated luciferase RNAwas added to the sample to control for RNA extraction and first-strand cDNA synthesis efficiency. Real-time PCR was performedby using an ABI PRISM 7900HT (Applied Biosystems) usinga SYBR green detection system. Reactions were performed intriplicate. To quantitate copy number, serial dilution of plas-mids was used corresponding to the target gene to constructstandard curve. Target genes were corrected for efficiencies ofRNA extraction and first-strand cDNA synthesis, as indicated byluciferase RNA measurement. Data are normalized to baselineand corrected for luciferase efficiency. Primers used for EPO,VEGFA, PDK1, and GLUT1 are indicated in Table S2.
HIF-α(ODD)-Luciferase Mouse Study. Male heterozygous ODD-luciferase mice were interbred with female nNOS−/− mice (TheJackson Laboratory) to produce WT (nNOS+/+) and nNOS−/−
mice with the HIF-α(ODD)-luciferase construct. To genotypeHIF-α(ODD)-luciferase construct, mouse tail tissue was digestedin Proteinase K, and DNA was extracted by phenol/chloroformmethodology. PCR was performed as described (6). Two sets ofprimers were used to identify the WT Rosa26 and HIF-α(ODD)-luciferase allele (Table S2). The WT allele has a PCR product at410 bp. The HIF-α(ODD)-luciferase allele has a PCR product at420 bp. To assess nNOS genotype, multiplex primers were usedwith a sense primer located at intron 1 of nNOS. Two antisenseprimers were located at nNOS intron 1 and PGK-neo. PCRproducts of 211 bp corresponded to nNOS+/+, 258 bp corre-sponds to nNOS−/−, whereas combined band at 211 bp and 258bp corresponded to nNOS+/−. To detect luciferase expression inHIF-α(ODD)-luciferase mice, D-luciferin (50 mg/kg; i.p.) wasinjected into male hemizygous mice. Ten minutes later, micewere anethetized in 1.5% isoflurane with 21% oxygen and placedin a light-tight chamber equipped with IVIS imaging camera(Xenogen 300). Dorsal and ventral images of the mouse weretaken separately. Photons were collected for 10 s, and imageswere obtained by using LIVING IMAGE software (Xenogen)and IGOR image analysis software. Images were standardizedwith the same color range bar for each image position.
In Vitro Luciferase Assay.Hemizygous HIF-α(ODD)-luciferase micewere hemodiluted to 50 g/L and recovered for 6 h. Organs wereharvested and immediately snap-frozen in liquid nitrogen. Tissueswere ground with a mortar and pestle and then underwent repeatfreeze-thaw cycles in 400 μL of lysis buffer (Promega). Protein
concentrations were determined by using Lowry Assay (Bio-Rad).Triplicate 10-μL samples were mixed with 100 μL of LucifearseAssay Reagent (Promega) in 96-well plate. Luciferase activity wasmeasured by FLUORstar Optima (BMG LABTECH).
Biotin Switch Assay. S-nitrosylation of pVHL was assessed onmouse brain samples by using biotin switch assay as described (7,8). Briefly, brain samples were homogenized in HEN buffer (250mM Hepes at pH 7.7, 1 mM EDTA, and 0.1 mM Neocuproine).After centrifugation, supernatant was extracted and 0.4%CHAPS was added to the sample. Brain extract was diluted toconcentration of 0.8 mg/mL with HEN buffer and incubated withblocking buffer (HEN buffer: 1% SDS and 20 mM MMTS) at50 °C with frequent vortexing. Excess MMTS was precipitated byacetone, and samples were resuspended in HENS buffer. Sam-ples were then incubated with 5 mM ascorbate and 0.4 mMbiotin-HPDP (Pierce) for 1 h at room temperature protectedagainst light. After the samples were washed with acetone andresuspended in HENS buffer, neutralization buffer (20 mMHepes at pH 7.7, 100 mM NaCl, 1 mM EDTA, and 0.5% TritonX-100) was then added. Strepavidin-agraose beads were thenadded to the samples and incubated for 1 h. The beads werewashed with washing buffer (neutralization buffer plus 600 mMNaCl), and eluded with elution buffer (20 mM Hepes at pH 7.7,100 mM NaCl, 1 mM EDTA, 0.5% 100 mM 2-Mercaptoetha-nol), and SDS sample buffer was added. After boiling the sam-ples, SDS/PAGE was performed, and S-nitrosylated pVHL wasdetected by Western blot using anti-pVHL antibody (Cell Sig-naling). In vitro S-nitrosylation was performed on WT mousebrain to generate positive and negative controls. WT brain lysatewas treated with 40 mM GSNO (positive control) or GSH andincubated for 20 min at room temperature. GSNO or GSH wasremoved by using Micro Bio-Spin P6 column (Bio-Rad). Biotinswitch assay was performed in the same manner as described.
Hypoxic Treatment in Human Endothelial Cells. Human umbilicalvascular endothelial cells (HUVEC) isolated from multiple in-dependent donors were cultured as described (9). Cells weregrown at 37 °C and 5% CO2 in a humidified Steri-Cycle in-cubator (ThermoForma; Model 370). Early passage HUVECs(passage 3–4) were used in these studies. Cells were subjected to<1% O2 in a temperature- and humidity-controlled incubatorwithin a sealed anaerobic system (ThermoForma; Model 1025).Hypoxic environment was achieved and maintained by usinga high purity anaerobic gas mixture (5% CO2, 10% H2, 85% N2).GSNOR mRNA was assessed by real-time PCR with forwardprimers: 5′-CCG ATG GAG GAG TGG ACT AT-3′, and re-verse primers: 5′-AAT GGA CGA GTG GCA ATT TC-3′.
1. Yuen DA, et al. (2010) Culture-modified bone marrow cells attenuate cardiac and renalinjury in a chronic kidney disease rat model via a novel antifibrotic mechanism. PLoSONE 5:e9543.
2. Hoefer J, et al. (2010) Sphingosine-1-phosphate-dependent activation of p38 MAPKmaintains elevated peripheral resistance in heart failure through increased myogenicvasoconstriction. Circ Res 107:923e933.
3. Vinogradov SA, Lo LW, Wilson DF (1999) Dendritic polyglutamic porphoryns: Probingporphyrin protection by oxygen-dependent quenching of phosphoresence. Chemistry5:1338e1347.
4. Lecoq J, et al. (2011) Simultaneous two-photon imaging of oxygen and blood flow indeep cerebral vessels. Nat Med 17:893e898.
5. Ward ME, et al. (2005) Hypoxia induces a functionally significant and translationallyefficient neuronal NO synthase mRNA variant. J Clin Invest 115:3128e3139.
6. Safran M, et al. (2006) Mouse model for noninvasive imaging of HIF prolyl hydroxylaseactivity: Assessment of an oral agent that stimulates erythropoietin production. ProcNatl Acad Sci USA 103:105e110.
7. Jaffrey SR, Erdjument-Bromage H, Ferris CD, Tempst P, Snyder SH (2001) Protein S-nitrosylation: A physiological signal for neuronal nitric oxide. Nat Cell Biol 3:193e197.
8. Jaffrey SR, Snyder SH (2001) The biotin switch method for the detection of S-nitrosylated proteins. Sci STKE, p l1.
9. Fish JE, et al. (2007) Hypoxia-inducible expression of a natural cis-antisense transcriptinhibits endothelial nitric-oxide synthase. J Biol Chem 282:15652e15666.
Tsui et al. www.pnas.org/cgi/content/short/1114026108 2 of 10
Fig. S2. Shown are phenylephrine responses (Upper) and myogenic tone assessments (Lower) under control and anemia conditions for WT (Left) and nNOS−/−
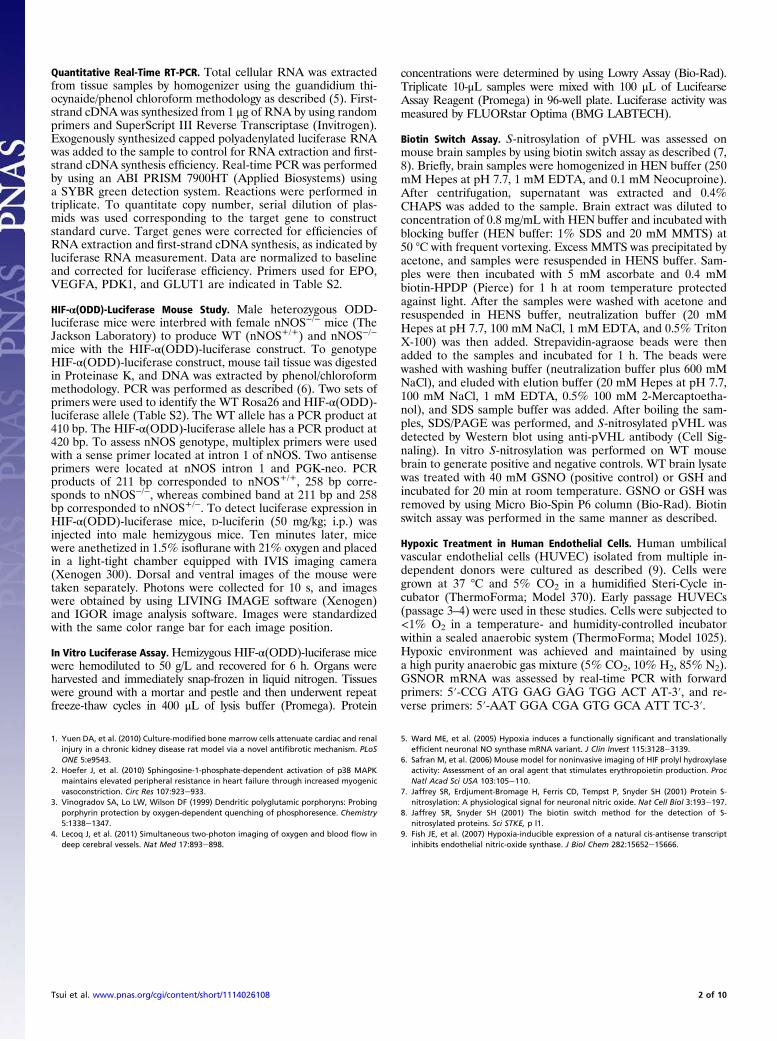
mice (Right). No significant differences in phenylephrine responsiveness (EC50 values WTcon = 5.2 ± 1.4 × 10⁻⁷ mol/L, n = 5; WTanemia = 2.3 ± 4.3 × 10⁻⁷ mol/L,n = 6; nNOS−/− (KO) control = 4.7 ± 0.8 × 10⁻⁷ mol/L, n = 6; nNOS KO Anemia = 4.1 ± 1.3 × 10⁻⁷ mol/L, n = 5; N.S., not statistically significant) or myogenic tonewere observed across the genotypes or in comparing anemia to control conditions. All respective groups were compared using an ANOVA statistical test.
Tsui et al. www.pnas.org/cgi/content/short/1114026108 4 of 10
Fig. S3. Basal HIF-α levels in WT and nNOS−/− mice. (A) Basal nNOS, HIF-1α, and HIF-2α protein expression in the brain of WT and nNOS−/− mice (n = 6). (B)Bioluminescent imaging of baseline whole body HIF-α(ODD) luciferase expression in WT and nNOS−/− mice (n = 6).
Tsui et al. www.pnas.org/cgi/content/short/1114026108 5 of 10
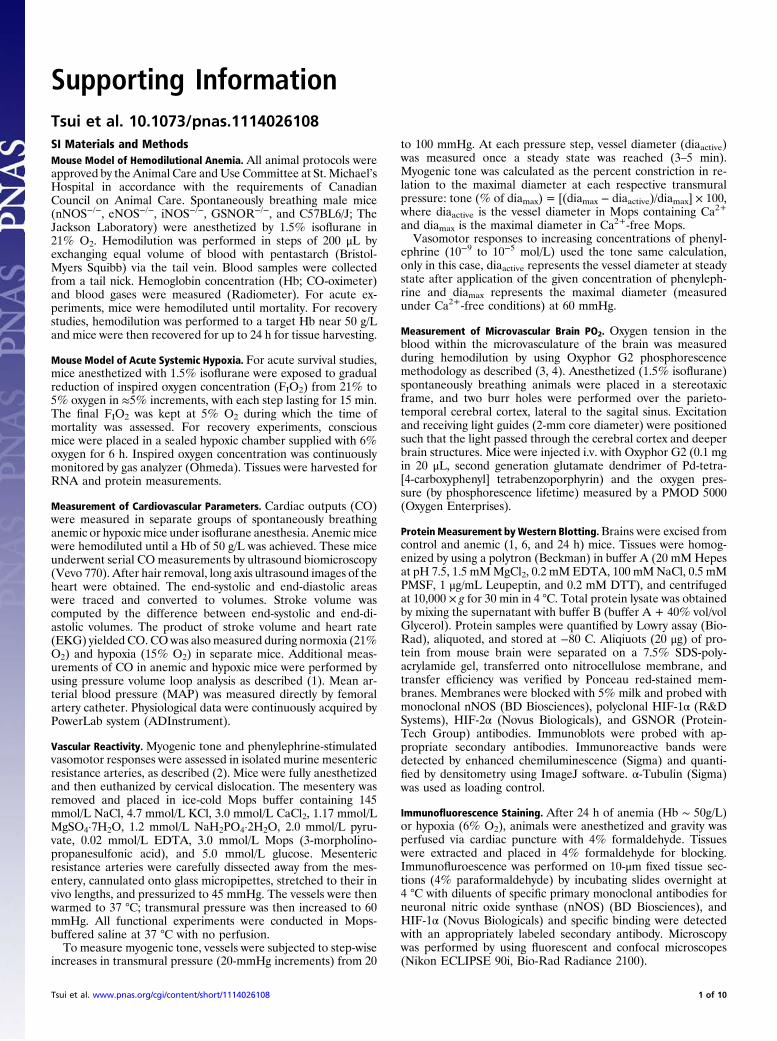
Fig. S4. nNOS regulates increased perivascular HIF-1α staining in anemia. Immunofluroescent staining of WT and nNOS−/− brain section 24 h after acuteanemia (Hb ∼ 50 g/L) demonstrated (i) an increase nNOS specific cells after anemia and hypoxia exposure (A Upper); (ii) Anemia increases HIF-1α in a peri-vascular pattern (white arrows), whereas hypoxia causes a generalized cellular increase in HIF-1α expression (A Lower); (iii) Perivascular HIF-1α staining inanemic WT mouse brain (white arrow) was not observed in anemic nNOS−/− mice (B). (Scale bar: 25 μm.)
Tsui et al. www.pnas.org/cgi/content/short/1114026108 6 of 10
Fig. S5. Anemia leads to increase in HIF-1α expression in HIF-α(ODD)-luciferase mice. (A) Representative dorsal and ventral images of anemic mice. The colorbar indicates photons (cm2 × s × steradian) with minimum and maximum threshold values. (B) Profile of total body radiance in dorsal images (n = 6) andhemoglobin levels at baseline and up to 7 d after acute anemia. (C) Extracted brain, kidney, liver, and heart tissue was assessed for luciferase activity in vitro atnonanemic and after 6 h of anemic mice *P < 0.05 vs. baseline; #P < 0.05 vs. control.
Tsui et al. www.pnas.org/cgi/content/short/1114026108 7 of 10
Fig. S6. Hypoxia causes increase HIF-1α levels in hypoxic WT (open bars) and nNOS−/− (gray bars) HIF-α(ODD)-luciferase mice. Representative dorsal (A) andventral (B) images of WT and nNOS−/− mice were obtained in response to hypoxia (n = 6). Total body radiance was normalized to each animal’s baseline. Colorbar indicates photons (cm2 × s × steradian) with minimum and maximum threshold values. (C) Extracted brain tissue was assessed for luciferase activity in vitroat normoxia and after 6 h of hypoxia (n = 6). *P < 0.05 vs. baseline. #P < 0.05 vs. WT.
Fig. S7. Other S-nitrosylated (SNO) proteins in anemia. SNO creatine phosphokinase (CPK) (A) and glyceraldehydes 3-phosphate dehydrogenase (GAPDH) (B)levels were assessed in WT anemic mouse brain at 1, 6, and 24 h anemia relative to nonanemic control (n = 4). (C) Brain SNO-HIF-1α levels was measured at 6 hanemia (n = 5).
Tsui et al. www.pnas.org/cgi/content/short/1114026108 8 of 10
Fig. S8. Reduced GSNOR protein levels in anemia and hypoxia. (A) GSNOR mRNA and protein levels were assessed in human endothelial cells after 24 hhypoxia (n = 3). (B) GSNOR protein levels in anemic and hypoxic mouse brain (n = 6). (C) Mortality curve for WT (black; n = 24) and GSNOR−/− (purple; n = 11)mice in acute anemia. *P < 0.05 vs. baseline or 0 h.
Tsui et al. www.pnas.org/cgi/content/short/1114026108 9 of 10