Supporting Information Kim et al. 10.1073/pnas.1010153107 SI Materials and Methods Protein Expression and Purification. The ctkA ( cell translocating kinase A) gene (jhp940) was cloned from the genomic DNA of Helicobacter pylori J99 strain (ATCC 700824D) into the expres- sion vector pET-21b(+) (Novagen), adding a hexa-histidine- containing eight-residue tag to the C terminus of CtkA. The re- combinant protein was overexpressed in Escherichia coli Rosetta2 (DE3)pLysS cells using Terrific-Broth culture medium. Protein expression was induced by 0.5 mM isopropyl 1-thio-β-D-galacto- pyranoside, and the cells were incubated for additional 18 h at 15 °C following growth to mid-log phase at 37 °C. The cells were lysed by sonication in a lysis buffer [50 mM Tris-HCl at pH 7.9, 500 mM NaCl, and 10% (vol∕vol) glycerol] containing 50 mM imidazole followed by centrifugation to remove cellular debris. The supernatant was applied to an affinity chromatography col- umn of nickel-nitrilotriacetic acid-agrose (Qiagen). The protein was eluted with the lysis buffer containing 500 mM imidazole, and the eluted sample was further purified by ion exchange and size-exclusion chromatography using HiTrap-Q ion exchange and HiLoad 16∕60 Superdex-200 columns (GE Healthcare Bio-Sciences), respectively. The mutant variants of CtkA were expressed and purified as the wild type as described above. Crystallization, X-ray Data Collection, and Structure Determination. Because the full-length CtkA fused with a C-terminal fusion tag did not produce crystals, we grew the crystals of CtkAΔC fused with a C-terminal fusion tag. The crystals were grown by the sitting-drop vapor diffusion method at 22 °C by mixing equal volumes (2 μL each) of the protein solution (at 8 mg mL −1 con- centration in 20 mM Hepes at pH 7.5 and 200 mM NaCl) and the reservoir solution. The apo crystals were grown using a reservoir solution consisting of 100 mM Tris-HCl at pH 8.5, 1.5 M ammo- nium sulfate (Sigma), and 15% (vol∕vol) glycerol. A mercury-substituted crystal was frozen in the cold nitrogen gas stream at 100 K using a cryoprotectant solution consisting of 100 mM Tris-HCl at pH 8.5, 1.5 M ammonium sulfate, and 20% (vol∕vol) glycerol. X-ray diffraction data were collected at 100 K on an Area Detector Systems Corporation Quantum 315 CCD area detector system at the BL-4A experimental station of Pohang Light Source. The raw data were processed using the program suit HKL2000 (1). Table S1 summarizes the data collec- tion statistics. We solved the crystal structure of CtkA by mercury multi- wavelength anomalous diffraction (MAD) phasing at 2.70-Å resolution (Table S1). Ten mercury sites were located with the program SOLVE (2) and were used to calculate the phases with RESOLVE (3). Subsequent manual model building was done using the program COOT (4). The model was refined with the program REFMAC (5) and PHENIX (6) including the bulk sol- vent correction. Ten percent of the data were randomly set aside as the test data for the calculation of R free (7). The crystals of ADP-bound CtkA were grown using a reservoir solution consisting of 100 mM sodium acetate at pH 5.5, 0.2 M sodium thiocyanate, and 20% (vol∕vol) PEG 3350, while supple- menting the protein solution with 2 mM MgCl 2 and 10 mM of ADP. ADP-bound CtkA crystals were cryoprotected using the reservoir solution containing 10% (vol∕vol) glycerol. The ADP- bound structure was solved by molecular replacement using the apo model of CtkA with the program PHASER (8). We failed to cocrystallize CtkA with AMP-PNP. Therefore, we soaked the ADP-bound crystals in the cryoprotectant solution used for cryo- protection of the ADP-complex crystals after supplementing it with 2 mM MgCl 2 and 10 mM of AMP-PNP. Table S1 summarizes the refinement statistics. In Vitro Kinase Assay. In vitro kinase labeling reactions were carried out in 20 μL reaction buffer consisting of 20 mM Hepes, pH 7.4, 2 mM dithiothreitol, 1 mM Na 3 VO 4 , 0.5 mM phenylmethylsulfo- nyl fluoride, 10 mM MgCl 2 , 0.20 μM ATP, and 0.033 μM ½γ − 32 PATP (5 μCi∕μl). Purified CtkA or its mutant variants were added to start the reaction, which lasted for 10 min at 30 °C and was stopped by the addition of sodium dodecyl sulfate loading solu- tion. The products were analyzed by electrophoresis in 15% denaturing polyacrylamide gels, and the dried gels were exposed to X-ray films (Agfa) for 24 h. Cell Culture, Transfection, and Western Blotting. Human gastric epithelial cancer cell (AGS cell) (ATCC CRL 1739), HeLa cells, and Thp1 cells were grown in RPMI medium 1640 (Hyclone) sup- plemented with 10% fetal bovine serum (Hyclone), 1 mmol∕L sodium pyruvate (Gibco), and 100 units∕mL penicillin-strepto- mycin (Gibco). Transfection of the cells with the plasmid p3XFLAG-CMV-10 containing CtkA or its mutants was per- formed using the LipofectAMINE 2000 (Invitrogen). The protein levels were analyzed by Western blotting. The primary antibodies used for Western blotting were anti-FLAG (Cell Signaling Technologies), anti-phospho-Ser276 p65 (Cell Signaling Technologies), anti-p65 (Cell Signaling Technologies), antitopoisomerase I (Cell Signaling Technologies), and anti-β- actin (Abcam). Cellular Translocation Analysis. To monitor intracellular transloca- tion of CtkA, we treated HeLa cells with EGFP-full-length CtkA and EGFP-CtkAΔC (5 and 10 μM) for 2 h at 37 °C. After incuba- tion, cells were washed three times with PBS, and EGFP fluor- escence was detected by FACS analysis (FACS Calibur, BD Biosciences). For confocal microscopy, HeLa cells were treated with 10 μM of EGFP-CtkA proteins for 2 h at 37 °C and then washed with PBS. The cells were fixed with 4% paraformalde- hyde containing 0.2% Triton X-100. The cellular translocation of the EGFP-fused CtkA proteins was visualized using a confocal laser scanning microscope (LSM 510 META, Carl Zeiss). Electrophoretic Mobility Shift Assay. The double-stranded NF-κB consensus oligonucleotide probe (5′-AGT TGA GGG GAC TTT CCC AGG C-3′) was labeled with the Redivue adenosine 5 0 -½γ- 32 Ptriphosphate triethylammonium salt (GE Healthcare). Nuclear extracts (10 μg total protein) of the AGS cells, in which the full-length wild-type and D155Q/D179Q double mutant CtkA were expressed, were incubated with 1 × Tris buffered saline and 32 P-labeled NF-κB probe for 20 min at 37 °C and then DNA– protein complexes were resolved on a 6% nondenaturing polya- crylamide gel at 100 V in 0.5 × Tris∕Borate∕EDTA buffer. The gel was exposed to a BAS-MS2040 plate (Fujifilm) for 30 min, and signals were detected using a BAS-2500 Phosphor Imager (Fujifilm). Secreted Alkaline Phosphatase (SEAP) Reporter Assay. For the SEAP assay, a reporter plasmid carrying the NF-κB promoter (pNF-κB- SEAP; 1.0 μg; Clontech), the pGAL plasmid (1.0 μg), and the p3XFLAG-CMV-10 vector containing the full-length wild-type CtkA or its mutants (CtkAΔC, D155Q, D179Q, or D155Q/ D179Q; 1.0 μg) were cotransfected to AGS cells. After 48 h of cotransfection, the culture medium was collected for the SEAP Kim et al. www.pnas.org/cgi/doi/10.1073/pnas.1010153107 1 of 5
Transcript
Supporting InformationKim et al. 10.1073/pnas.1010153107SI Materials and MethodsProtein Expression and Purification. The ctkA (cell translocatingkinase A) gene (jhp940) was cloned from the genomic DNA ofHelicobacter pylori J99 strain (ATCC 700824D) into the expres-sion vector pET-21b(+) (Novagen), adding a hexa-histidine-containing eight-residue tag to the C terminus of CtkA. The re-combinant protein was overexpressed in Escherichia coliRosetta2(DE3)pLysS cells using Terrific-Broth culture medium. Proteinexpression was induced by 0.5 mM isopropyl 1-thio-β-D-galacto-pyranoside, and the cells were incubated for additional 18 h at15 °C following growth to mid-log phase at 37 °C. The cells werelysed by sonication in a lysis buffer [50 mM Tris-HCl at pH 7.9,500 mM NaCl, and 10% (vol∕vol) glycerol] containing 50 mMimidazole followed by centrifugation to remove cellular debris.The supernatant was applied to an affinity chromatography col-umn of nickel-nitrilotriacetic acid-agrose (Qiagen). The proteinwas eluted with the lysis buffer containing 500 mM imidazole,and the eluted sample was further purified by ion exchangeand size-exclusion chromatography using HiTrap-Q ion exchangeand HiLoad 16∕60 Superdex-200 columns (GE HealthcareBio-Sciences), respectively. The mutant variants of CtkA wereexpressed and purified as the wild type as described above.
Crystallization, X-ray Data Collection, and Structure Determination.Because the full-length CtkA fused with a C-terminal fusiontag did not produce crystals, we grew the crystals of CtkAΔCfused with a C-terminal fusion tag. The crystals were grown bythe sitting-drop vapor diffusion method at 22 °C by mixing equalvolumes (2 μL each) of the protein solution (at 8 mgmL−1 con-centration in 20 mMHepes at pH 7.5 and 200 mMNaCl) and thereservoir solution. The apo crystals were grown using a reservoirsolution consisting of 100 mM Tris-HCl at pH 8.5, 1.5 M ammo-nium sulfate (Sigma), and 15% (vol∕vol) glycerol.
A mercury-substituted crystal was frozen in the cold nitrogengas stream at 100 K using a cryoprotectant solution consistingof 100 mM Tris-HCl at pH 8.5, 1.5 M ammonium sulfate, and20% (vol∕vol) glycerol. X-ray diffraction data were collectedat 100 K on an Area Detector Systems Corporation Quantum315 CCD area detector system at the BL-4A experimental stationof Pohang Light Source. The raw data were processed using theprogram suit HKL2000 (1). Table S1 summarizes the data collec-tion statistics.
We solved the crystal structure of CtkA by mercury multi-wavelength anomalous diffraction (MAD) phasing at 2.70-Åresolution (Table S1). Ten mercury sites were located with theprogram SOLVE (2) and were used to calculate the phases withRESOLVE (3). Subsequent manual model building was doneusing the program COOT (4). The model was refined with theprogram REFMAC (5) and PHENIX (6) including the bulk sol-vent correction. Ten percent of the data were randomly set asideas the test data for the calculation of Rfree (7).
The crystals of ADP-bound CtkA were grown using a reservoirsolution consisting of 100 mM sodium acetate at pH 5.5, 0.2 Msodium thiocyanate, and 20% (vol∕vol) PEG 3350, while supple-menting the protein solution with 2 mM MgCl2 and 10 mMof ADP. ADP-bound CtkA crystals were cryoprotected using thereservoir solution containing 10% (vol∕vol) glycerol. The ADP-bound structure was solved by molecular replacement using theapo model of CtkA with the program PHASER (8). We failed tococrystallize CtkA with AMP-PNP. Therefore, we soaked theADP-bound crystals in the cryoprotectant solution used for cryo-protection of the ADP-complex crystals after supplementing it
with 2 mMMgCl2 and 10 mM of AMP-PNP. Table S1 summarizesthe refinement statistics.
In Vitro Kinase Assay. In vitro kinase labeling reactions were carriedout in 20 μL reaction buffer consisting of 20 mM Hepes, pH 7.4,2 mM dithiothreitol, 1 mM Na3VO4, 0.5 mM phenylmethylsulfo-nyl fluoride, 10 mMMgCl2, 0.20 μMATP, and 0.033 μM ½γ − 32P�ATP (5 μCi∕μl). Purified CtkA or its mutant variants were addedto start the reaction, which lasted for 10 min at 30 °C and wasstopped by the addition of sodium dodecyl sulfate loading solu-tion. The products were analyzed by electrophoresis in 15%denaturing polyacrylamide gels, and the dried gels were exposedto X-ray films (Agfa) for 24 h.
Cell Culture, Transfection, and Western Blotting. Human gastricepithelial cancer cell (AGS cell) (ATCC CRL 1739), HeLa cells,and Thp1 cells were grown in RPMImedium 1640 (Hyclone) sup-plemented with 10% fetal bovine serum (Hyclone), 1 mmol∕Lsodium pyruvate (Gibco), and 100 units∕mL penicillin-strepto-mycin (Gibco). Transfection of the cells with the plasmidp3XFLAG-CMV-10 containing CtkA or its mutants was per-formed using the LipofectAMINE 2000 (Invitrogen).
The protein levels were analyzed by Western blotting. Theprimary antibodies used for Western blotting were anti-FLAG(Cell Signaling Technologies), anti-phospho-Ser276 p65 (CellSignaling Technologies), anti-p65 (Cell Signaling Technologies),antitopoisomerase I (Cell Signaling Technologies), and anti-β-actin (Abcam).
Cellular Translocation Analysis. To monitor intracellular transloca-tion of CtkA, we treated HeLa cells with EGFP-full-length CtkAand EGFP-CtkAΔC (5 and 10 μM) for 2 h at 37 °C. After incuba-tion, cells were washed three times with PBS, and EGFP fluor-escence was detected by FACS analysis (FACS Calibur, BDBiosciences). For confocal microscopy, HeLa cells were treatedwith 10 μM of EGFP-CtkA proteins for 2 h at 37 °C and thenwashed with PBS. The cells were fixed with 4% paraformalde-hyde containing 0.2% Triton X-100. The cellular translocationof the EGFP-fused CtkA proteins was visualized using a confocallaser scanning microscope (LSM 510 META, Carl Zeiss).
Electrophoretic Mobility Shift Assay. The double-stranded NF-κBconsensus oligonucleotide probe (5′-AGT TGA GGG GACTTT CCC AGG C-3′) was labeled with the Redivue adenosine50-½γ-32P� triphosphate triethylammonium salt (GE Healthcare).Nuclear extracts (10 μg total protein) of the AGS cells, in whichthe full-length wild-type and D155Q/D179Q double mutant CtkAwere expressed, were incubated with 1 × Tris buffered saline and32P-labeled NF-κB probe for 20 min at 37 °C and then DNA–
protein complexes were resolved on a 6% nondenaturing polya-crylamide gel at 100 V in 0.5 × Tris∕Borate∕EDTA buffer. Thegel was exposed to a BAS-MS2040 plate (Fujifilm) for 30 min,and signals were detected using a BAS-2500 Phosphor Imager(Fujifilm).
Secreted Alkaline Phosphatase (SEAP) Reporter Assay. For the SEAPassay, a reporter plasmid carrying the NF-κB promoter (pNF-κB-SEAP; 1.0 μg; Clontech), the pGAL plasmid (1.0 μg), and thep3XFLAG-CMV-10 vector containing the full-length wild-typeCtkA or its mutants (CtkAΔC, D155Q, D179Q, or D155Q/D179Q; 1.0 μg) were cotransfected to AGS cells. After 48 h ofcotransfection, the culture medium was collected for the SEAP
Kim et al. www.pnas.org/cgi/doi/10.1073/pnas.1010153107 1 of 5
assay, which was performed using the Great EscAPe SEAPFluorescence Detection Kit (Clontech).
Enzyme-Linked Immunosorbent Assay. Thp1 cells were seeded in six-well tissue culture plates at a density of approximately1 million∕mL. To differentiate them into the adherent macro-phage-like cell state, Thp1 cells were treated with 5 ng∕mL ofphorbol 12-myristate 13-acetate (PMA; Sigma). After 48 h ofPMA treatment, the PMA-containing medium was aspirated,and differentiated cells were washed with RPMI medium 1640.These cells were later treated with full-length CtkA, CtkAΔC,
and full-length D155Q/D179Q double mutant, respectively,at 0.1, 0.5, and 1.0 μg∕mL concentrations. The proteins weretreated with 20 μg∕mL of polymyxin B (Sigma) to circumventthe effects of any possible endotoxin contamination. After treat-ment, cells were kept in RPMI medium 1640 supplemented with100 units∕mL penicillin-streptomycin at 37 °C in a humidifiedatmosphere containing 5% CO2. Culture supernatants were col-lected after 48 h and stored at−80 °C until analyzed. The inductionof TNF-α was assessed using human TNF-α colorimetric ELISAKit (Thermo Scientific).
1. Otwinowski Z, Minor W (1997) Processing of X-ray diffraction data collected in oscilla-tion mode. Methods Enzymol 276:307–326.
2. Terwilliger TC, Berendzen J (1999) Automated MAD and MIR structure solution. ActaCrystallogr D 55:849–861.
3. Terwilliger TC (2000) Maximum-likelihood density modification. Acta Crystallogr D66:213–221.
4. Emsley P, Cowtan K (2004) Coot: Model-building tools for molecular graphics. ActaCrystallogr D 60:2126–2132.
5. Murshudov GN, Vagin AA, Dodson EJ (1997) Refinement of macromolecular structuresby the maximum-likelihood method. Acta Crystallogr D 53:240–255.
6. Adams PD, et al. (2010) PHENIX: A comprehensive Python-based system for macromo-lecular structure solution. Acta Crystallogr D 66:849–861.
7. Brünger AT (1992) The free R-value: A novel statistical quantity for assessing theaccuracy of crystal structures. Nature 355:472–474.
Fig. S1. Ligand binding in the active site of CtkA. (A) Superposition of apo (green), ADP-bound (cyan), and AMP-PNP-bound (pink) structures of CtkA. Thebound ADP and AMP-PNP molecules are shown in sticks. (B) Binding modes of the bound ligands [ADP (Left) and AMP-PNP (Right)]. Invariantly conservedresidues are boxed in red, and Fo–Fc electron density maps of the bound ligands are contoured at 2.5σ. (C) Catalytically important residues of CtkA and PKA areshown in sticks, and αC helix is colored in red for both proteins.
Kim et al. www.pnas.org/cgi/doi/10.1073/pnas.1010153107 2 of 5
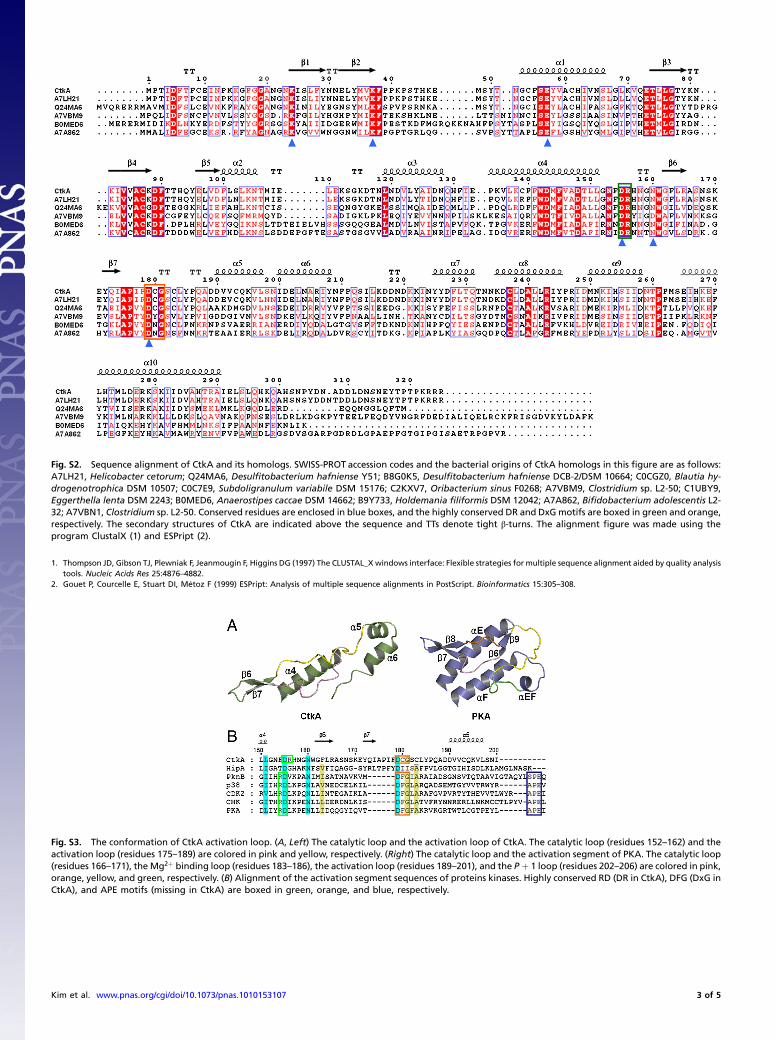
Fig. S2. Sequence alignment of CtkA and its homologs. SWISS-PROT accession codes and the bacterial origins of CtkA homologs in this figure are as follows:A7LH21, Helicobacter cetorum; Q24MA6, Desulfitobacterium hafniense Y51; B8G0K5, Desulfitobacterium hafniense DCB-2/DSM 10664; C0CGZ0, Blautia hy-drogenotrophica DSM 10507; C0C7E9, Subdoligranulum variabile DSM 15176; C2KXV7, Oribacterium sinus F0268; A7VBM9, Clostridium sp. L2-50; C1UBY9,Eggerthella lenta DSM 2243; B0MED6, Anaerostipes caccae DSM 14662; B9Y733, Holdemania filiformis DSM 12042; A7A862, Bifidobacterium adolescentis L2-32; A7VBN1, Clostridium sp. L2-50. Conserved residues are enclosed in blue boxes, and the highly conserved DR and DxGmotifs are boxed in green and orange,respectively. The secondary structures of CtkA are indicated above the sequence and TTs denote tight β-turns. The alignment figure was made using theprogram ClustalX (1) and ESPript (2).
1. Thompson JD, Gibson TJ, Plewniak F, Jeanmougin F, Higgins DG (1997) The CLUSTAL_X windows interface: Flexible strategies for multiple sequence alignment aided by quality analysistools. Nucleic Acids Res 25:4876–4882.
2. Gouet P, Courcelle E, Stuart DI, Métoz F (1999) ESPript: Analysis of multiple sequence alignments in PostScript. Bioinformatics 15:305–308.
Fig. S3. The conformation of CtkA activation loop. (A, Left) The catalytic loop and the activation loop of CtkA. The catalytic loop (residues 152–162) and theactivation loop (residues 175–189) are colored in pink and yellow, respectively. (Right) The catalytic loop and the activation segment of PKA. The catalytic loop(residues 166–171), the Mg2þ binding loop (residues 183–186), the activation loop (residues 189–201), and the P þ 1 loop (residues 202–206) are colored in pink,orange, yellow, and green, respectively. (B) Alignment of the activation segment sequences of proteins kinases. Highly conserved RD (DR in CtkA), DFG (DxG inCtkA), and APE motifs (missing in CtkA) are boxed in green, orange, and blue, respectively.
Kim et al. www.pnas.org/cgi/doi/10.1073/pnas.1010153107 3 of 5
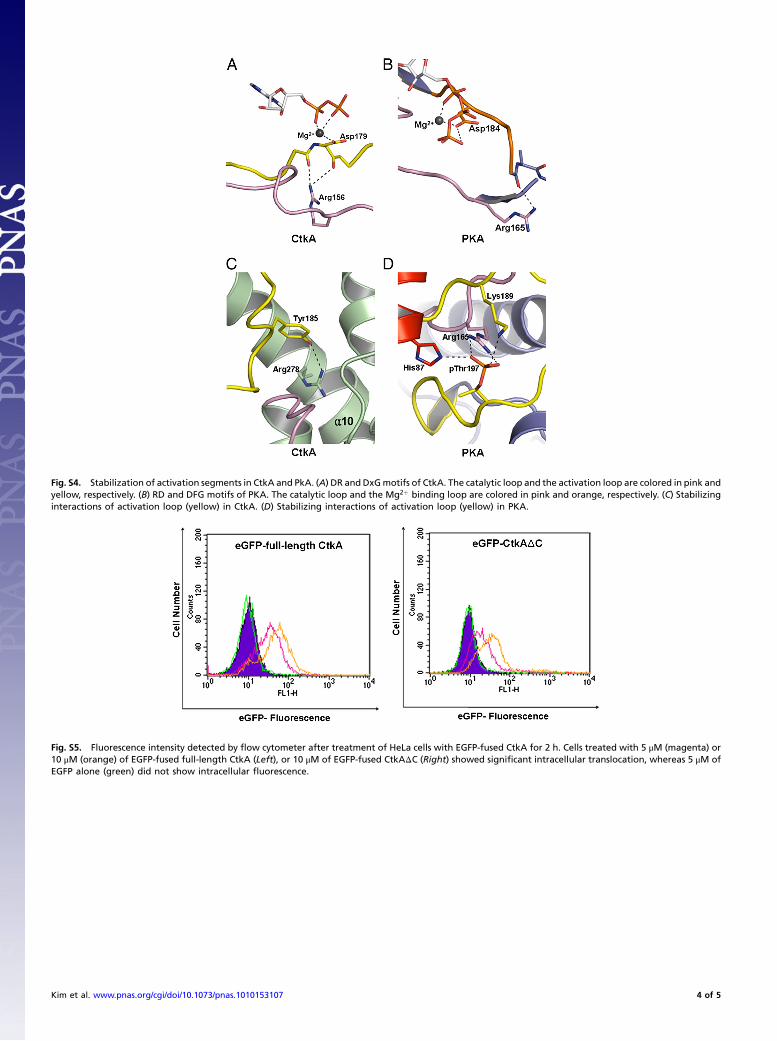
Fig. S4. Stabilization of activation segments in CtkA and PkA. (A) DR and DxGmotifs of CtkA. The catalytic loop and the activation loop are colored in pink andyellow, respectively. (B) RD and DFG motifs of PKA. The catalytic loop and the Mg2þ binding loop are colored in pink and orange, respectively. (C) Stabilizinginteractions of activation loop (yellow) in CtkA. (D) Stabilizing interactions of activation loop (yellow) in PKA.
Fig. S5. Fluorescence intensity detected by flow cytometer after treatment of HeLa cells with EGFP-fused CtkA for 2 h. Cells treated with 5 μM (magenta) or10 μM (orange) of EGFP-fused full-length CtkA (Left), or 10 μM of EGFP-fused CtkAΔC (Right) showed significant intracellular translocation, whereas 5 μM ofEGFP alone (green) did not show intracellular fluorescence.
Kim et al. www.pnas.org/cgi/doi/10.1073/pnas.1010153107 4 of 5
Fig. S6. Nuclear translocation of transiently expressed CtkA. Lanes correspond to the Western blot results of the cytosolic (Upper) and nuclear (Lower) frac-tions of the AGS cells transfected with the plasmid p3XFLAG-CMV-10 containing the full-length wild-type ctkA gene, after 0, 12, 24, and 48 h of transfection,respectively.
Table S1. Data collection, phasing, and refinement statistics
f 0∕f 00 (e-) −13.57∕10.07 −16.66∕10.10 −16.94∕10.12 −10.00∕9.81Figure of merit§ for MAD phasing: 0.43∕0.73 for 20–2.70 Å data (before/after density modification)
No. of protein atoms/mean B-factor (Å2) 4;490∕42.6 9;390∕35.6 9;090∕62.9No. of solvent atoms/mean B-factor (Å2) 326∕43.0 309∕28.8 59∕58.4No. of ligand atoms/mean B-factor (Å2) - 112∕27.4 127∕50.5rms deviation from ideal geometryBond lengths (Å) 0.007 0.008 0.009Bond angles (°) 0.99 1.21 1.27Ramachandran plotFavored region (%) 97.4 95.5 92.8Allowed region (%) 2.6 4.5 7.2Outlier region (%) 0.0 0.0 0.0
*Completeness for I∕σðIÞ > 0, with the numbers in parentheses for the high-resolution shell (2.75–2.70 Å).†Rmerge ¼ ∑h ∑i jIðhÞi − hIðhÞij∕∑h ∑i IðhÞi , where IðhÞ is the intensity of reflection h, ∑h is the sum over all reflections, and ∑i is the sum over imeasurements of reflection h. Numbers in parentheses reflect statistics for the last shell (2.75–2.70 Å).
‡Riso ¼ ∑ jjFPHj − jFPjj∕∑ jFPj, where FPH and FP are the derivative (λ2, λ3 or λ4) and native (λ1) structure factors, respectively. Numbers inparentheses are for the last shell (2.75–2.70 Å).
§Figure of merit ¼ hj∑ PðαÞeiα∕∑ PðαÞji, where α is the phase angle and PðαÞ is the phase probability distribution.¶Values in parentheses refer to the highest resolution shells (2.07–2.00 Å, 2.54–2.50 Å, 2.95–2.90 Å for apo, ADP complex, and AMP-PNPcomplex, respectively).
∥R ¼ ∑ jjFobsj − jFcalcjj∕∑ jFobsj, where Rfree is calculated for a randomly chosen 10% of reflections, which were not used for structurerefinement, and Rwork is calculated for the remaining reflections.
Kim et al. www.pnas.org/cgi/doi/10.1073/pnas.1010153107 5 of 5