Page 1
1
Supporting Information
Probing the importance of -stacking interactions in DNA-templated
self-assembly of bisfunctionalized guanidinium compounds
Delphine Paolantoni, a
Jenifer Rubio-Magnieto, b
Sonia Cantel,a Jean Martinez,
a Pascal Dumy,
a
Mathieu Surin,b* and Sébastien Ulrich
a*
aInstitut des Biomolécules Max Mousseron (IBMM), UMR 5247, Ecole Nationale Supérieure de Chimie de Montpellier
8 Rue de l’Ecole Normale, 34296 Montpellier cedex 5, France; Fax: (+) 33467144353; E-mail: [email protected] bLaboratory for Chemistry of Novel Materials, University of Mons–UMONS–, 20, Place du Parc B-7000 Mons, Belgium; E-mail:
[email protected]
These authors contributed equally to this work
Table of contents:
General methods and materials P. 3
Synthesis and characterization of guanidinium compounds P. 4
Preparation of the oligonucleotides and mixtures P. 6
1H NMR and
13C NMR spectra of 2 P. 7
1H NMR and
13C NMR spectra of GuaBiNaph P. 8
HPLC chromatogram and MS spectrum of GuaBiNaph P. 9
IR spectra of GuaBiNaph P. 10
1H NMR of 3 P. 10
1H NMR and
13C NMR spectra of GuaBiPy P. 11
HPLC chromatogram and MS spectrum of GuaBiPy P. 12
IR spectra of GuaBiPy P. 13
1H NMR,
13C NMR and IR spectra of GuaBiPhe P. 13
CD spectra of dT40:GuaBiPy and GuaBiPy in TE buffer P. 15
CD Titration experiments of dTn:GuaBiPy in TE buffer P. 15
Electronic Supplementary Material (ESI) for ChemComm.This journal is © The Royal Society of Chemistry 2014
Page 2
2
Emission spectra of dT40:GuaBiPy 1:30 in TE and phosphate buffer P. 16
Plots of the E/M ratio of dT40:GuaBiPy 1:30 in TE and phosphate buffer P. 16
CD spectra of dTn:GuaBiPy in TE buffer P. 16
UV-Vis spectra of dTn:GuaBiPy in TE buffer P. 17
Fluorescence spectra of dTn:GuaBiPy in TE buffer P. 17
Plots of the E/M ratio of dTn:GuaBiPy 1:X in TE buffer P. 17
Studies of xdR43:GuaBiPy in TE buffer using CD, UV-Vis and Fluorescence P. 18
UV-Vis spectra of dT40:GuaBiNaph in TE buffer P. 18
Spectroscopic titration of dT40:GuaBiNaph in TE buffer P. 19
Fluorescence experiments of dT40:GuaBiNaph 1:30 in TE buffer P. 19
MALDI-ToF MS detection of complexes with dT10 as template P. 20
Competition experiments analysed by MALDI-ToF MS P. 20
Page 3
3
General methods and materials
All reagents were purchased from commercial sources (Sigma-Aldrich, Alpha Aesar or Fisher
Scientific) and used as received. Dry solvents were purchased in anhydrous quality from
Sigma-Aldrich. For dichloromethane, amylene was the stabiliser.
TLC were performed on silica gel 60 F254 plates purchased from Merck. Flash column
chromatography was performed on silica gel 60 (40 – 63 µm) purchased from Merck. NMR
spectra were recorded on Bruker Avance 400 or 250 MHz instruments and were referenced
with respect to the residual solvent peak for the deuterated solvent. Data are reported as
follows: chemical shift (δ in ppm), multiplicity (s for singlet, d for doublet, m for multiplet),
coupling constant (J in Hertz) and integration. High resolution mass spectrometry analyses
were carried out at the Laboratoire de Mesures Physiques, IBMM – Université Montpellier 2,
and were obtained on a Waters Micromass QTof mass spectrometer (positive mode). LC-MS
analyses were performed on a Waters 2695 HPLC separation module equipped with a C18
column (Macherey-Nagel EC Nucleosil 300-5 125 mm x 3 mm), connected to Waters 996
photodiode array detector and Waters micromass ZQ mass spectrometer. Eluent A: H2O/TFA
99.9%/0.1%; eluent B: CH3CN/H2O/TFA 90%/9.9%/0.1%. Linear gradient: 5% eluent B
100% eluent B in 5 minutes. Flow: 1 mL/min. IR spectra were measured on a Perkin Elmer
Spectrum 100 FT-IR spectrometer equipped with an universal ATR sampling accessory.
Wavenumbers are indicated in cm-1
and band intensities are reported in brackets as weak
(w), medium (m) or strong (s).
UV-Vis absorption, circular dichroism, and fluorescence measurements were recorded using a
ChirascanPlus CD Spectrophotometer from Applied Photophysics (UK). The measurements
were carried out using 2 mm Suprasil quartz cells from Hellma Analytics. The spectra were
recorded between 240 and 500 nm, with a bandwidth of 1 nm and time per point 1 s.
Fluorescence measurements were carried out at different temperatures by using a 10 mm
quartz cells (1 mL) from Lightpath Optical. The excitation wavelength was set at 348 nm. The
spectra were recorded between 355 and 650 nm, with a bandwidth of 10 nm and time per
point 0.5 s.The buffered water solvent reference spectra were used as baselines and were
automatically subtracted from the CD spectra of the samples.
The variable temperature spectroscopic experiments were performed using a TC125
Temperature Controller from Quantum Northwestern running on the ChirascanPlus
Spectrophotometer. The temperatures were varied from -5 ºC to 80 ºC at rate of 0.5 ºC/min.
The temperature within the quartz cells was determined using a temperature probe. The rate
for decreasing the temperature from 80 ºC to -5 ºC was of 0.5 ºC/min in order to allow
equilibration. For the heating/cooling cycles, the temperatures were varied from -5 ºC to 80 ºC
using the following conditions:
- First Heating Cycle (H-C): From -5 ºC to 80 ºC at a rate of 10 ºC/min.
- 10 minutes of stabilization at 80 ºC.
- First Cooling Cycle (C-C): From 80 ºC to -5 ºC at a rate of 0.5 ºC/min.
- Second Heating Cycle (H-C): From -5 ºC to 80 ºC at a rate of 0.5 ºC/min.
- Second Cooling Cycle (C-C): From 80 ºC to -5 ºC at a rate of 0.5 ºC/min.
- After about 14 hours, the solution was stirred.
- Third Heating Cycle (H-C): From -5 ºC to 80 ºC at a rate of 0.5 ºC/min.
- Third Cooling Cycle (C-C): From 80 ºC to -5 ºC at a rate of 0.5 ºC/min.
MALDI-ToF mass spectrometry. Sample preparation: Stock solutions of guanidinium were
prepared in DMSO at a concentration of 10 mM (GuaBiPy) or 100 mM (GuaBiPhe and
GuaBiNaph). A dT10 (Eurogentec, RP-Cartridge purification) stock solution was prepared by
dilution with MilliQ water to a concentration of 10 mM. Samples were then prepared by
dilution of stock solutions to final concentrations of 1 mM in guanidinium and 0.1 mM in
Page 4
4
dT10 in a mixture of MilliQ water and DMSO (final proportion of DMSO: 1% with
GuaBiPhe, 40% with GuaBiNaph and 80% with GuaBiPy). Samples were further diluted 4
times in MilliQ water prior to analyses. According to the dried droplet procedure, 0.5 l of a
solution of the 4-NA matrix in ethanol (0,1M) was deposited on the MALDI target
(AnchorChip™
, Bruker), then mixed with the sample in equal amount. Sample spots were
dried at room temperature. Mass spectrometric analysis: MALDI mass spectra were
performed on an Ultraflex III TOF/TOF instrument (Bruker Daltonics, Wissembourg, France)
equiped with LIFT capability. A pulsed Nd:YAG laser at a wavelength of 355 nm was
operated at a frequency of 100 Hz. MS analyses were conducted in positive reflectron ion
mode with a pulse ion extraction delay of 30ns. An acceleration voltage of 25.0 kV (IS1) was
applied for a final acceleration of 21.95 kV (IS2). Mass spectra were acquired from at least
150 laser shots, over a mass range from m/z 500 to 5000. A deflection at 2000 Da could be
applied. The laser fluence was adjusted for each studied sample above the threshold for
generation of molecular ions. Data were acquired with the Flex Control software and
processed with the Flex Analysis software. External calibration was systematically performed
with commercial peptide mixture (Calibration peptide standard II) in a linear correction
calibration.
Synthesis and characterization of guanidinium compounds:
1. Bis-N,N-benzylguanidinium bromide (GuaBiPhe)
The synthetic procedure was adapted from a previous report.1
A solution of cyanogen bromide (103 mg, 0.96 mmol) in anhydrous acetonitrile (1 mL) was
added dropwise to a solution of benzylamine (0.21 mL, 1.92
mmol) in anhydrous acetonitrile (2.5 mL) cooled at 0°C. The
reaction mixture was then refluxed for 14 hours.
The suspension was then filtrated and the white solid was
washed with acetonitrile and diethyl ether. The filtrate was
concentrated in vacuo and the resulting oil was crystallized in
dichloromethane at -20°C. The solid was filtered, washed with the minimum volume of
dichloromethane and dried in vacuo, yielding GuaBiPhe as white crystals (165 mg, 54%
yield). 1H NMR (CD3OD, 400 MHz): δ 7.39-7.27 (m, 5H, CH(aro)), 4.46 (s, 2H, CH2NH);
13C
NMR (CD3OD, 63 MHz): δ 157.4, 137.6, 129.8, 128.8, 127.7, 45.9; HR-ESI-MS: m/z calcd
for C15H18N3+ ([M+H]
+): 240.1501, found: 240.1500. IR (ATR): = 3323 (w), 3157 (m),
3025 (w), 2876 (w), 1644 (m), 1623 (s), 1595 (m), 1496 (m), 1469 (m), 1441 (m), 1358 (m),
1325 (w), 1245 (w), 1206 (w), 1136 (w), 1103 (w), 1057 (w), 1029 (w), 989 (w), 1029 (w),
989 (w), 961 (w), 903 (w), 875 (w), 750 (m), 740 (m), 720 (m), 702 (s), 673 (m), 621 (w).
2. Di(1H-imidazol-1-yl)methanamine (2)
This compound was prepared as previously described and the characterization were
conformed to the literature data.2
To a solution of imidazole (5.52 g, 84.9 mmol) in dry dichloromethane (408 mL) under argon
was added a 3M solution of cyanogen bromide in dichloromethane (9.44
mL, 28.3 mmol). The reaction mixture was refluxed for 35 minutes and the
formation of a white precipitate was observed. The suspension was then
filtrated. The filtrate was concentrated in vacuo to 10% of its initial volume
and crystallized at -20°C. The resulting suspension was filtrated, washed with cold
dichloromethane and dried in vacuo, yielding compound 2 as white crystals (3.32 g, 73%
1 Lovick, H. M.; Michael, F. E. Tetrahedron Lett. 2009, 50, 1016–1019.
Page 5
5
yield). 1H NMR (DMSO-d6, 400 MHz): δ 10.19 (s, 1H, NH), 8.08 (d, J = 20.8 Hz, 2H,
CNCHCHN), 7.56 (d, J = 29.3 Hz, 2H, CNCHCHN), 7.11 (s, 2H, NCHN); 13
C NMR
(DMSO-d6, 100 MHz): δ 140.9, 137.4, 129.6, 118.9.
3. Bis-N,N-(naphtalen-1-ylmethyl)guanidinium chloride (GuaBiNaph)
The procedure was adapted from a previous report.2
A mixture of di(1H-imidazol-1-yl)methanamine (2) (203 mg, 1.26 mmol), 1-
naphtylmethylamine (0.36 mL, 2.52 mmol) and TFA (74.5 µL, 0.98 mmol) in a screwed-cap
tube was stirred at 105°C for 4 hours. Once cooled to room
temperature, the obtained yellow-brownish oil was
dissolved in dichloromethane (20 mL). The organic solution
was washed with saturated ammonium chloride solution (20
mL). The aqueous phase was extracted with
dichloromethane (3 x 10 mL). The organic phases were
combined and washed with a saturated aqueous ammonium chloride solution, dried over
sodium sulfate and concentrated in vacuo. The residue was purified by flash chromatography
on silica gel (dichloromethane/methanol: 100/0→90/10). Further recrystallization in
chloroform/acetonitrile yielded the desired GuaBiNaph as a white solid (145 mg, 31% yield).
LC-MS: tR 4.30 minutes; extracted m/z calcd for C23H22N3+ ([M+H]
+): 340.18, found: 340.62;
1H NMR (CD3OD, 400 MHz): δ 7.99-7.87 (m, 6H, CH(aro)), 7.59-7.44 (m, 8H, CH(aro)), 4.95
(s, 4H, CH2NH); 13
C NMR (CD3OD, 63 MHz): δ 157.7, 135.4, 132.7, 132.4, 130.0, 130.0,
127.8, 127.2, 126.5, 126.4, 123.9, 44.6; HR-ESI-MS: m/z calcd for C23H22N3+ ([M+H]
+):
340.1814, found: 340.1815. IR (ATR): = 3290 (m), 3146 (m), 3055 (m), 3014 (m), 1679
(m), 1660 (s), 1639 (s), 1623 (s), 1600 (s), 1513 (m), 1451 (w), 1399 (w), 1362 (w), 1324 (w),
1264 (w), 1216 (w), 1166 (w), 1110 (m), 1030 (w), 1005 (w), 883 (w), 853 (w), 786 (s), 765
(s), 731 (m), 645 (m).
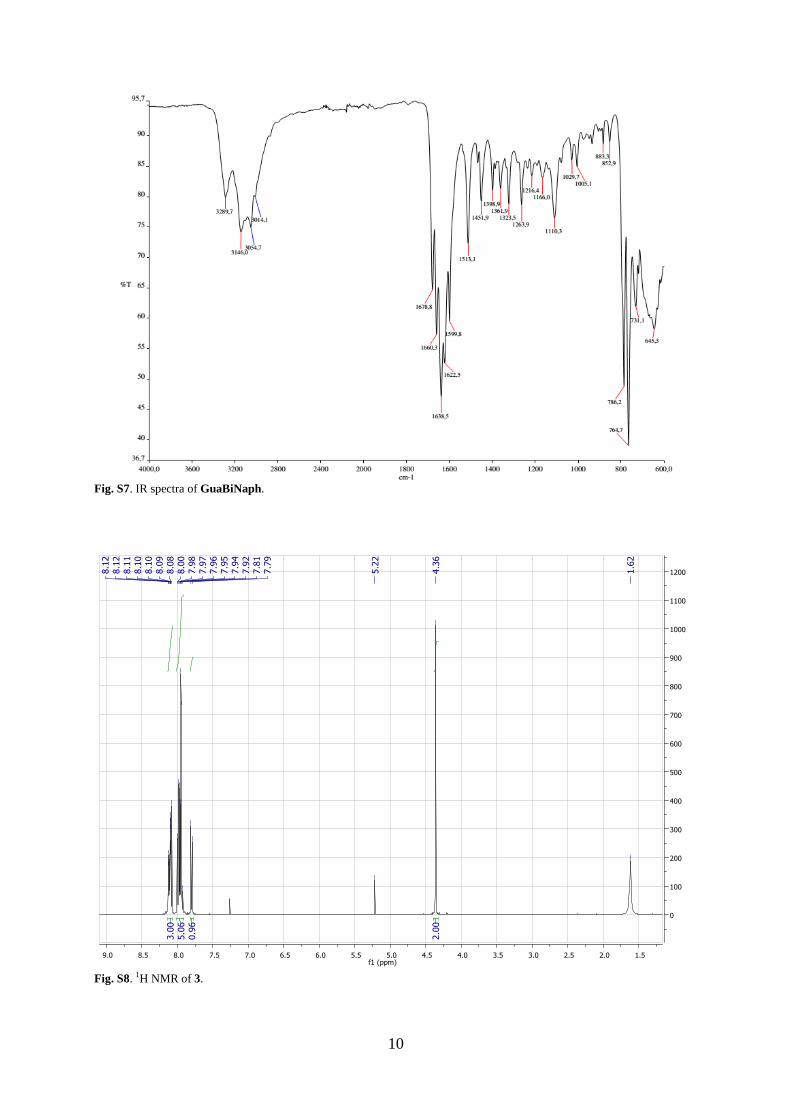
4. 1-pyrenemethylamine (3)
1-pyrenemethylamine was prepared from 1-pyrenemethylammonium chloride as follows:
1-pyrenemethylammonium chloride (500 mg, 1.86 mmol) was suspended in an aqueous 10%
sodium hydroxide solution (10 mL). Extraction with dichloromethane (10 mL), drying over
sodium sulfate and concentration in vacuo afforded the desired compound as a pale yellow
solid (431 mg, 99% yield). 1H NMR (CDCl3, 400 MHz): 8.12-8.08 (m, 3H, CH(aro)), 8.00-7.92
(m, 5H, CH(aro)), 7.90 (d, J = 7.8 Hz, 1H, CH(aro)), 4.36 (s, 2H, CH2NH).
5. Bis-N,N-(pyren-1-ylmethyl)guanidinium trifluoroacetate (GuaBiPy)
The procedure was adapted from a previous report.2
A mixture of di(1H-imidazol-1-yl)methanamine (2) (87.8 mg, 0.54 mmol), 1-
pyrenemethylamine (3) (241.5 mg, 1.13 mmol) and TFA (32.7 µL, 0.42 mmol) in a screwed-
cap tube was stirred at 105°C for 4 hours. Once
cooled to room temperature, the solidified orange
- brown oil was re-suspended in dichloromethane.
The solid was filtrated, further washed with
dichloromethane and diethyl ether, and dried in
vacuo to obtain GuaBiPy as a powder (19.7 mg,
24% yield). LC-MS: tR 5.34 minutes, 97.8% peak area at 254 nm; extracted m/z calcd for
C35H26N3+ ([M+H]
+): 488.21, found: 488.67;
1H NMR (DMSO-d6, 400 MHz): δ 8.34-8.06
(m, 20H, CH(aro) and NH/NH2+), 7.90 (broad s, 2H, NH/NH2
+), 5.25 (d, J = 4.7 Hz, 4H,
2 Jadhav, V. D.; Schmidtchen, F. P. J. Org. Chem. 2007, 73, 1077–1087.
Page 6
6
CH2NH); 13
C NMR (DMSO-d6, 63 MHz): δ 156.1, 130.8, 130.5, 130.3, 130.2, 128.0, 127.9,
127.5, 127.4, 126.5, 125.6, 125.5 (2C), 124.8, 124.1, 123.8, 122.8, 43.0; HR-ESI-MS: m/z
calcd for C35H26N3+ ([M+H]
+): 488.2127, found: 488.2130. IR (ATR): = 3310 (m), 3129
(m), 3041 (m), 1663 (s), 1632 (s), 1489 (w), 1459 (w), 1433 (w), 1416 (w), 1392 (w), 1370
(w), 1341 (w), 1298 (w), 1207 (s), 1172 (s), 1132 (s), 958 (w), 888 (w), 834 (s), 801 (m), 752
(w), 724 (m), 702 (m), 678 (w), 656 (w).
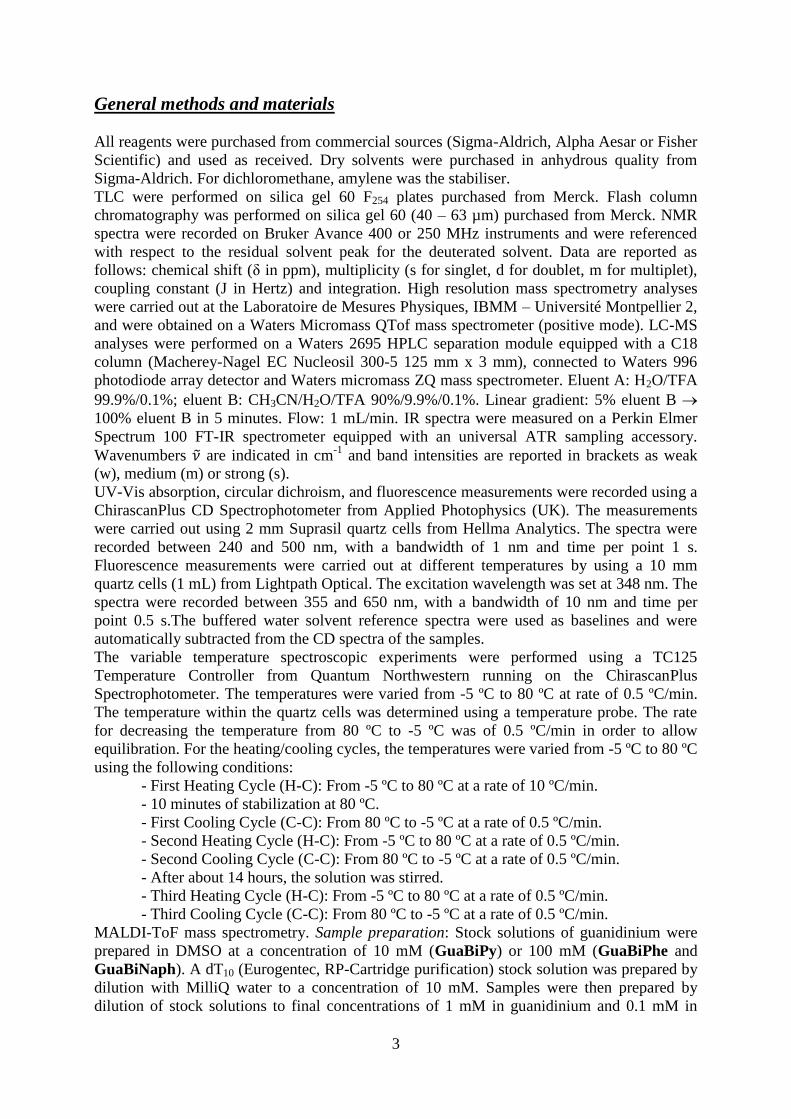
Preparation of the oligonucleotides (ODN). The buffer was prepared by using tris(hydroxymethyl)aminomethane ((HOCH2)3CNH2),
EDTA (Aldrich, HPLC grade) in Milli-Q water. The oligonucleotides (ODN) were purchased
from Eurogentec (Belgium) as HPLC-RP purification (Ultrapure Gold, >95% purity) in dried
format, and the purity of the ODN sequences was checked with MALDI-ToF. The
oligonucleotides were dissolved in a volume of Tris-EDTA (TE) buffer at a concentration of
100 μM. The solution obtained was centrifuged during 2 minutes at 2000 rpm. 20 μL of this
solution were used in order to prepare different aliquots. A solution of 280 μL of MQ water
was added to each aliquot in order to obtain a final volume of 300 μL (1.33 mM Tris buffer
and 67 M EDTA) and the final diluted solution was mixed using a vortex.
Preparation of the DNAGuanidinium solutions. The concentration of the aliquot of DNA in TE buffer solution (1.33 mM Tris buffer and 67
M EDTA) was determined by UV-Vis at 25 ºC using the specific extinction coefficients
(ε260) of each DNA, which are 81600 L.mol-1
.cm-1
, 162600 L.mol-1
.cm-1
, and 324600 L.mol-
1.cm
-1, 412900 L.mol
-1.cm
-1 and 675815 L.mol
-1.cm
-1 for ssDNAd(T)10, ssDNAd(T)20,
ssDNAd(T)40, ssDNAd(R)43 and dsDNAd(R)43, respectively. The structure of these DNA
ODNs is described in the Chart 1 below. The guanidinium compounds were dissolved in
DMSO with a 10 mM concentration (stock solution). The stock solution of Guanidinium was
added to the DNA solution and the molar ratio between guanidinium compounds and DNA
was adjusted to the DNA concentration. Both compounds were stirred using the vortex at
vigorous speed during 2 minutes.
Chart S1. Oligonucleotide sequences.
Page 7
7
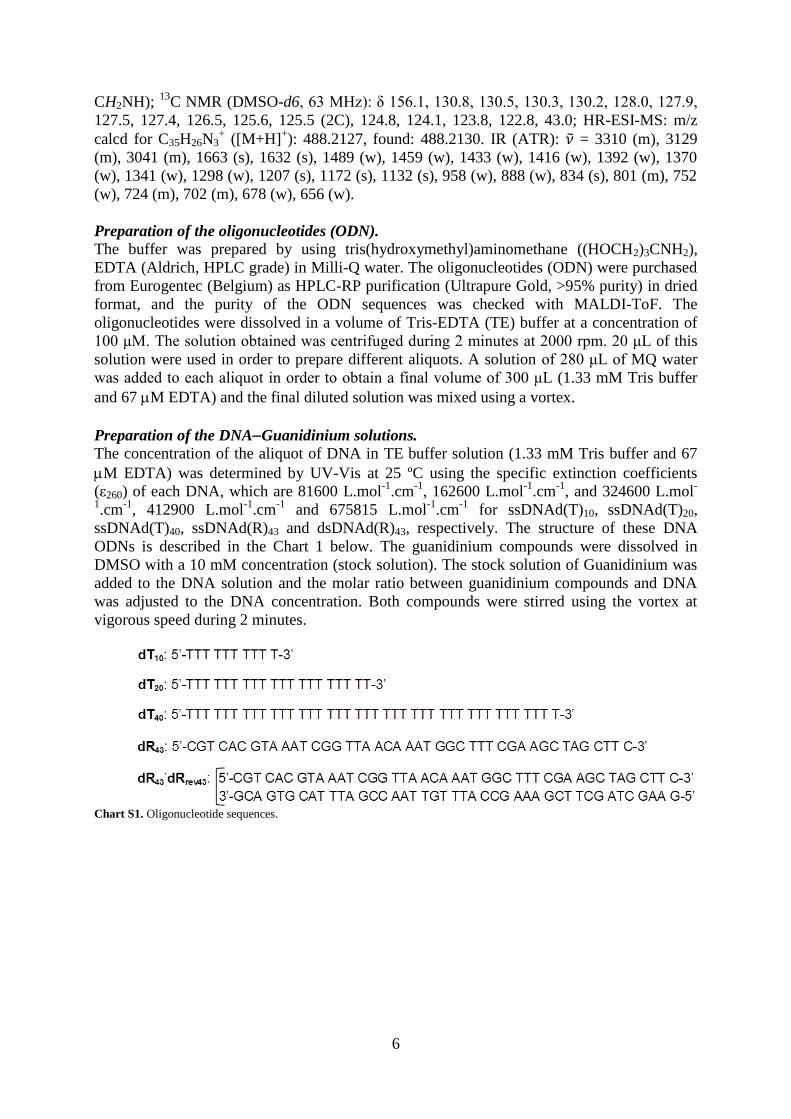
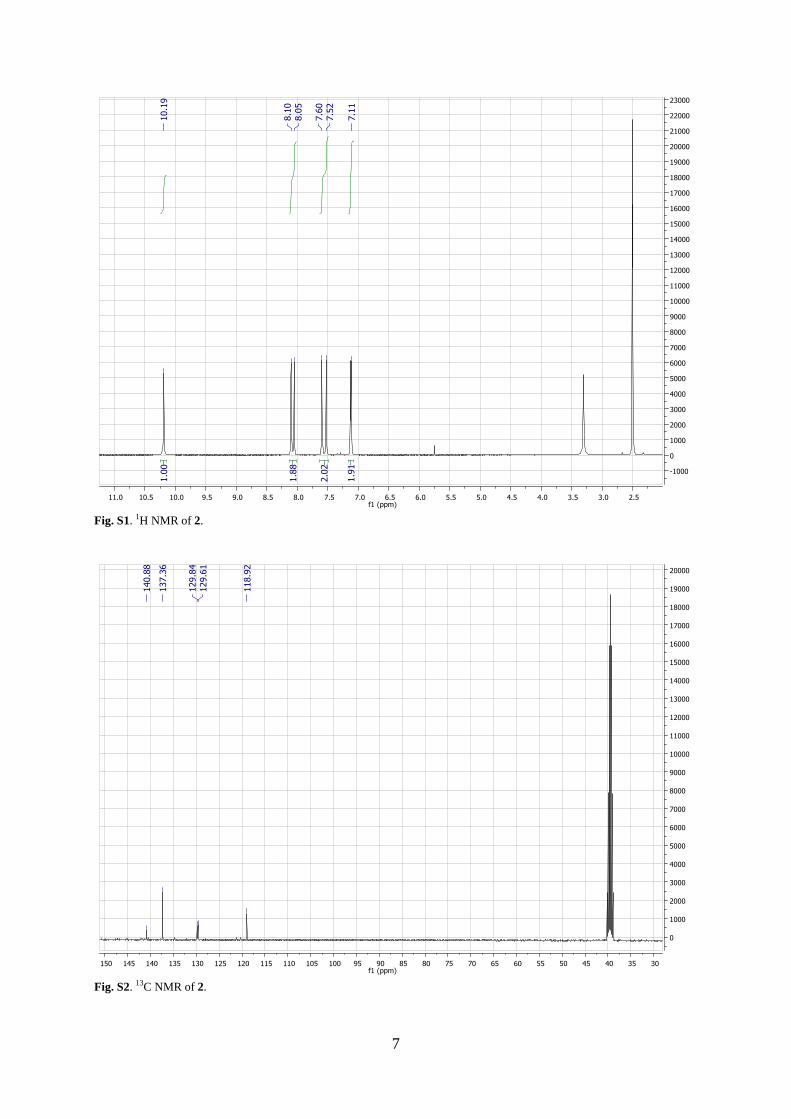
Fig. S1. 1H NMR of 2.
Fig. S2. 13C NMR of 2.
Page 8
8
Fig. S3. 1H NMR of GuaBiNaph.
Fig. S4. 13C NMR of GuaBiNaph.
Page 9
9
Fig. S5. HPLC chromatogram of GuaBiNaph (detection at 254 nm).
Fig. S6. Extracted mass spectrum of peak at 4.30 minutes from LC-MS.
Page 10
10
Fig. S7. IR spectra of GuaBiNaph.
Fig. S8. 1H NMR of 3.
Page 11
11
Fig. S9. 1H NMR of GuaBiPy.
Fig. S10. 13C NMR of GuaBiPy.
Page 12
12
Fig. S11. HPLC chromatogram of GuaBiPy (detection at 254 nm).
Fig. S12. Extracted mass spectrum of peak at 5.34 minutes from LC-MS.
Page 13
13
Fig. S13. IR spectra of GuaBiPy.
Fig. S14. 1H NMR of GuaBiPhe.
Page 14
14
Fig. S15. 13C NMR of GuaBiPhe.
Fig. S16. IR spectra of GuaBiPhe.
Page 15
15
Fig. S17. Circular dichroism spectra of pure GuaBiPy and dT40:GuaBiPy at different molar ratio.
Fig. S18. Titration experiments of a) dT40, b) dT20, and c) and d) dT10 by GuaBiPy in TE buffer at -5 ºC, monitored by
circular dichroism spectroscopy. N/P is the number GuaBiPy molecules per phosphate group (or nucleobase) in DNA. [dTn]
~ 5.7 µM.
Page 16
16
Fig. S19. Emission spectra (at exc = 348 nm) of a mixture of dT40:GuaBiPy 1:30 ratio in TE buffer (black line) and in
phosphate buffer (red line) at -5 ºC in the second heating cycle (H-C). [dT40] ~ 5.7 µM.
Fig. S20. Plots of the Excimer to Monomer (E/M) ratio of dT40:GuaBiPy 1:30 and pure GuaBiPy in TE buffer and
phosphate buffer. a) First cooling cycle (C-C) and second heating cycle (H-C); and b) third heating cycle (H-C) and third
cooling cycle (C-C). [dT40] ~ 5.7 µM.
Fig. S21. Circular Dichroism (CD) spectra of dT40:GuaBiPy and dT20:GuaBiPy at different molar ratio N/P = 0.5 and 2.0 in
TE buffer at -5 ºC. [dTn] ~ 5.7 μM.
Page 17
17
Fig. S22. UV-Vis spectra of a) dT20 and b) dT10 by GuaBiPy in TE buffer at -5 ºC. [dT20] ~ 7.4 µM and [dT10] ~ 7.5 µM.
Fig. S23. Fluorescence spectra of mixtures of a) dT20:GuaBiPy and b) dT10:GuaBiPy at various molar ratio in TE buffer at -
5 ºC. [dT20] ~ 7.4 µM and [dT10] ~ 7.5 µM. [GuaBiPy] ~ 111 µM.
Fig. S24. Plots of the Excimer to Monomer ratio of dTn:GuaBiPy 1:X in TE buffer. a) First cooling cycle (C-C) and second
heating cycle (H-C); and b) third heating cycle (H-C) and third cooling cycle (C-C). [dTn] ~ 4.6 µM.
Page 18
18
Fig. S25. a) Spectroscopic titration of dR43 by GuaBiPy in TE buffer at -5 ºC. [dR43]
~ 7.1 µM. [GuaBiPy] ~ 612 µM; b)
titration of dR43·dRrev43 by GuaBiPy in TE buffer at -5 ºC. [dR43
·dRrev43] ~ 7.1 µM. [GuaBiPy] ~ 614 µM; c) titration of
GuaBiPy in TE buffer at -5 ºC.; d) normalized UV-Vis titration monitored at 349 nm of xDNAd(X)n by GuaBiPy; e) circular
dichroism (CD) spectra of dT40, dT20, dT10, dR43 and dR43·dRrev43 in the presence of GuaBiPy at N/P ratios of 0.5; f) plot of
the excimer emission (472 nm)/monomer emission (396 nm) ratio of different xDNAd(X)n mixtures.
Fig. S26. UV-Vis spectra of dT40:GuaBiNaph solutions in TE buffer at -5 ºC. [dT40] ~ 7.5 µM.
Page 19
19
Fig. S27. a) UV-Vis spectra; b) Circular Dichrosim (CD) spectra; c) Fluorescence spectra of mixtures of dT40:GuaBiNaph;
and d) Emission spectra (at exc = 292 nm) of dT40 into a solution of GuaBiNaph at various molar ratio in TE buffer at -5 ºC.
[GuaBiNaph] = 12 µM. [GuaBiNaph] stock= 10 mM in DMSO.
Fig. S28. Plots of intensity ratios in fluorescence spectra of dT40:GuaBiNaph 1:30 and pure GuaBiNaph in TE buffer. a)
First cooling cycle (C-C); b) Second heating cycle (H-C); c) Third heating cycle (H-C); and d) Third cooling cycle (C-C).
[dT40] ~ 4.6 µM.
Page 20
20
Fig. S29. MALDI-ToF detection of complexes between dT10 and GuaBiPhe (top), GuaBiNaph (middle), and GuaBiPy
(bottom).
Fig. S30. Competition experiments analysed by MALDI-ToF MS. GuaBiPhe vs. GuaBiNaph (top), GuaBiPhe vs.
GuaBiPy (middle), and GuaBiNaph vs. GuaBiPy (bottom). Complexes of dT10 with GuaBiPhe are marked with a circle
(●), complexes of dT10 with GuaBiNaph are marked with a lozenge () and complexes of dT10 with GuaBiPy are marked
with a square (▪).