aOrganic & Medicinal Chemistry Division, CSIR-Indian Institute of Chemical Biology, 4, Raja S. C. Mullick Road, Jadavpur, Kolkata-700032, West Bengal, India.
bAcademy of Scientific and Innovative Research (AcSIR), CSIR-Indian Institute of Chemical Biology Campus, 4 Raja S. C. Mullick Road, Kolkata 700032, India.
Chemicals: All Fmoc protected amino acids and rink amide AM resin both were purchased from Novabiochem (Merck). N, N′-dimethylformamide (DMF), Dichloromethane (DCM), Trifluoroacetic acid (TFA), pipyridine, O-(Benzotriazol-1-yl)-N, N, N′, N′-tetramethyluronium hexafluorophosphate (HBTU), Diisopropylethylamine (DIEA) and methanol were purchased from Spectrochem. Ethanedithiol (EDT) and phenol were bought from Merck. 5(6)-Carboxyfluorescein (FITC), Guanosine-5´-triphosphate sodium salt hydrate (GTP), β-casein, catalase, glucose oxidase, 3-(4, 5-dimethylthiazol-2-yl)-2, 5-diphenyltetrazolium bromide (MTT), Dulbecco’s Modified Eagle’s Medium (DMEM), Kanamycin sulfate, trypsin-EDTA solution, colchicine, dimethyl sulfoxide for cell culture, formaldehyde solution for molecular biology, 3-glycidoxypropyltrimethoxysilane, N, N′- Diisopropylcarbodiimide (DIC) and Nickel(II) chloride hexahydrate were purchased from Sigma Aldrich. Diamino-polyethylene glycol with MW 2000 Da (PEG2000) and mono BOC-amino-polyethylene glycol with MW 3000 Da were purchased from Rapp Polymer. E, Z-Link Biotin-NHS was purchased from Pierce. OtBu protected Tris-(nitrilo Tris-acetic acid) [(OtBu)Tris-NTA], Kin612His10 plasmid were received as gift from Dr. Thomas Surrey's lab at EMBL, Heidelberg (Currently at London Cancer Research Institute, UK). Biotin was purchased from Thermo scientific. Penicillin-Streptomycin, neutravidin and fetal bovine serum (FBS) were purchased from Invitrogen. Polyclonal anti-Mad2 antibody, rabbit monoclonal anti-alpha Tubulin (EP1332Y) antibody, Goat polyclonal anti-Rabbit IgG were purchased from Abcam. Annexin V apoptosis detection kit was purchased from Santa Cruz Biotechnology. Bisbenzimide H 33258 (Hoechst) was purchased from Calbiochem. Cover glass bottom dishes were purchased from SPL. Agarose was purchased from Fisher scientific. These compounds were used without further purification. For peptide
purification, we used Shimadzu HPLC system with C-18 semi preparative reverse phase column. Experimental water was used of milli Q grade. HPLC grade acetonitrile was purchased from J.T. Baker. Nikon Ti-U eclipse inverted microscope was used for cell imaging. Synthesized peptides were characterized by MALDI-TOF.
Cell culture:We have purchased five different cell lines such as, MCF7, B16F10, A549, MDAMB-231 and HeLa from National Centre for Cell Science (NCCS) Pune, India. Cells were cultured in our lab in 5% CO2 incubator at 37 oC using DMEM containing fetal bovine serum (10%), kanamycin sulfate (110 mg/L), penicillin (50 units/mL) and streptomycin (50 µg/mL).
Protein biochemistry: Tubulin was isolated from goat brain. The purification of tubulin from goat brain and its` labelling with Alexa Fluor 568 carboxylic acid succinimidyl ester to obtain the Alexa-568-labelled tubulin were done as described in the literature.1a Kinesin612His10 was expressed and purified in our lab as described before.1b
Docking study of PP1, PP2, PP3, PP4 and PP5 with tubulin: Autodock-Vina software version 1.1.2 was used for blind docking.2 A 43x40x41 affinity grid box was centered on the receptor (1Z2B).3 Here, we have found that PP2 and its’ analogues bind with exchangeable GTP/GDP site of tubulin.
Peptide synthesis: About 300 mg rink amide resin was taken in a peptide vessel and swelled for overnight in DMF-DCM (1:1) solvent. Five equivalents of excess fmoc protected amino acids (threonine, asparagine, alanine, histidine, serine, again alanine, arginine and proline) were coupled successively depending on sequences followed by fmoc deprotection by CEM microwave peptide synthesizer (Liberty 1) for PP1-PP5 preparation. Coupling and deprotection steps was maintained for eight and five minutes respectively and microwave power was maintained 35 watt. N,N-Diisopropylethylamine (DIPEA) and HBTU were used as an activator base and activator respectively. DMF was used as solvent. After that, peptides attached with resin were washed by DMF, DCM and again DMF solvent successively. Prepared peptides were cleaved by standard resin cleavage cocktail solution containing 92.5% TFA, 2.5% milli Q water, 2.5% EDT and 2.5% phenol. Resin attached peptides were kept for three hours containing peptide cleavage solution on rocker 25 (Labnet international). Then, filtrate containing trifluoroacetic acid was removed by nitrogen gas flow. Cold diethyl ether solvent was added on remaining portion of the filtrate in ice cold atmosphere for precipitation. Different Peptide precipitations were observed in diethyl ether solvent, which were separated out through centrifugation about six thousand rpm for five minutes. Finally, peptide precipitations were dissolved in milli Q water and lyophilized to get the desired peptides. FITC, biotin were covalently coupled with PP2 at its N terminal to prepare FPP2 and BPP2. FPP3 was also synthesized similarly. All the prepared peptides were purified through C-18 reverse phase HPLC column at 210 nm and mass were confirmed by MALDI-TOF in acetonitrile and water (1:1) mixture. Water and acetonitrile (solvent A: solvent B = 1:1) with 0.1% TFA is used as mobile phase. Solvent polarity changes accordingly. Solvent B is 20% at 5 min, 80% at 20 min, 100%
becomes at 25 min and again becomes 0% at 35 minutes. Total retention time is used for 40 min. Expected mass of PP1, PP2 and PP5 are 852 Da. Expected mass of PP3 and PP4 are 753 and 666 Da respectively. Expected mass of BPP2, FPP2 and FPP3 are 1078, 1211 and 1111 Da respectively. All the expected mass of the peptides are corroborated exactly with the observed mass.
Cell viability study: PP1-PP5 peptides were treated on MCF7 cells. Cell viability has been checked by MTT assay as mentioned before.4 MTT is a colorimetric assay technique where a yellow tetrazole compound was reduced into purple formazan by cellular reductase enzyme of live cells whereas; dead cells are unable to develop the purple colour. Therefore, we have used this method to estimate the cell viability after the treatment of PP2 for twenty four hours against untreated cells (control). The live cells are mentioned as viable cells and indicated as % of viability along Y-axis and peptide concentration plotted along X axis. We have checked cell viability of MCF7 cells treated with various concentrations of peptides starting from 0.5 µM to 40 µM. Then, purple colored formazan was dissolved in 1:1 (v/v) DMSO/MeOH and absorbance of each well were measured at 550 nm by micro-plate ELISA reader. Percent of viability was measured from this absorbance values. Percentage viability has been calculated as [(A550 Treated Cells - A550 Backgrounds)/ (A550Untreated Cells - A550 Backgrounds) X 100. Similarly, we have also evaluated the cytotoxic effect of 40 µM of PP2 on B16F10, MDAMB-231, HeLa and A549 cell lines following above mentioned method.
Turbidity assay: Tubulin polymerization analysis using turbidity assay was performed based on the standard protocol as described earlier.4 Briefly, 20 µM of tubulin, 4 mM of GTP and 10 μL of DMSO were mixed in BRB80 buffer (80 mM PIPES, 1 mM EGTA, 1 mM MgCl2, pH 6.9). Prepared solution was placed in a quartz cuvette. Turbidity of the solutions was measured as change in the absorbance at 350 nm for 40 minutes at 37 oC by UV-Vis Spectrophotometer (G6860A Cary 60 UV-Vis Spectrophotometer, Agilent Technologies). Tubulin was incubated with 40 µM PP1-PP5 and various concentrations of PP2 (40 µM, 30 µM and 20 µM) peptide followed by recording of tubulin turbidity.
Microtubule assembly assay: DAPI, a fluorescent probe binds with microtubule, used for the determination of microtubule formation.5 It does not interfere with microtubule polymerization. Here, we have prepared a solution of tubulin (10 μL from 200 μM stock concentration) containing GTP (1 μL from 200 mM), DAPI (1 μL from 100 μM) in BRB80 buffer. Tubulin forms microtubule in presence of GTP and DAPI binds with it gradually. We take fluorescence emission spectra at different time interval. Time dependent fluorescence study also performed at two different concentrations (40 and 20 µM) of PP2 to observe changes of spectra in presence of peptide. Experiment performed by Quanta Master Spectrofluorometer (QM-40) having peltier for temperature control (at 37 oC).
Tubulin binding experiment on biotin micropatterned surface: Biotin micropatterned glass surfaces and then flow chambers containing these micropatterned glasses were prepared
according to our previous procedure.6 Flow chamber was equilibrated with 20 mM HEPES buffer (pH 7.5) followed by β-casein (1 mg/mL). Next, flow chamber was incubated with 0.3 μM solution of neutravidin in HEPES buffer for 7 minutes at 4 oC. Flow chamber was washed with HEPES buffer to remove excess neutravidin and then incubated with 40 μM solution of BPP2 for 10 minutes on ice. After that, we have washed the flow chamber with HEPES buffer (2 times) followed by 3 times with BRB80 buffer (pH 6.9). Pre-cooled flow chamber at 4 ᴏC was loaded with 20 μL solution of BRB80 buffer containing 20 μM tubulin, 3.75 μM alexa fluor-568-labeled tubulin, 4 mM GTP, 25 mM MgCl2, 1 mg/mL glucose oxidase, 0.5 mg/mL catalase and 1 mM glucose. Then, it was sealed and incubated at 37 oC for 20 minutes. Flow chamber was placed on a TIRF microscope and images were captured at 561 nm through 60X objective (Olympus) and an Andor iXon3 897 EMCCD camera. Control experiment was performed using similar method as described above in absence of BPP2.
FRET experiment: By FRET study, it has been observed whether PP2 binds with tubulin and its exact binding site at microtubule can be measured if they have a significant spectral overlap region with colchicines.7 Colchicine’s weak fluorescence in aq. medium (λex = 350 nm, λem = 427 nm) becomes much stronger upon binding with tubulin.8 It has been measured the spectral overlap between tubulin bound colchicine and FITC (ex-480 nm em= 520 nm) attached PP2 and found that they have a significance overlap region. Here in this study colchicine is used as FRET donor and FITC is used as FRET acceptor. The OD (optical density) value must be same for both the donor (colchicine) & acceptor attached peptide (FPP2).
Efficiency of FRET, εFRET =
In our FRET studies,
As obtained from figure 2f, ID=1, IA=2.114 and thus εFRET = 0.678.
From the spectral overlap graph, the Forster distance (Ro) between Tub-COL (Donor) and FPP2 (Acceptor) was calculated to be ~ 29.5 Å. Now the distance (RDA) between Tub-COL (D)-FPP2 (A) was calculated by the following equation.
RDA is calculated to be ~ 26.05 Å.
Again, docking is a computational based method which tells us about the orientation of one molecule (ligand) when bound to another molecule (receptor). In this manuscript, we have done the docking study of PP2 with tubulin (PDB ID 1Z2B) heterodimer.3 By docking study, we have seen that PP2 binds close to the GTP/GDP exchangeable site of tubulin and measured the distance from colchicine’s site of tubulin which is ~26.6 Å and it is close to our experimental distance that we have measured by FRET experiment.
AD
A
II I+γ
61
FRET
FRETDA
1R
−=
εε
oR
For scrambled FPP3, we have also determined FRET study similarly and calculated the binding distance from colchicine site of tubulin.
As obtained from figure S14, ID =1, IA=0.8 and thus εFRET = 0.44.
From the spectral overlap graph the Forster distance between tubulin bound colchicine and FITC-PP3 was calculated to be ~ 29.5 ±1 Å. Now the distance (R1DA) between tubulin bound colchicine (D) – FITC PP3 (A) was calculated and R1DA was calculated to be ~ 30.68 ±1 Å which is higher than the distance between FPP2 and tubulin colchicine complex.
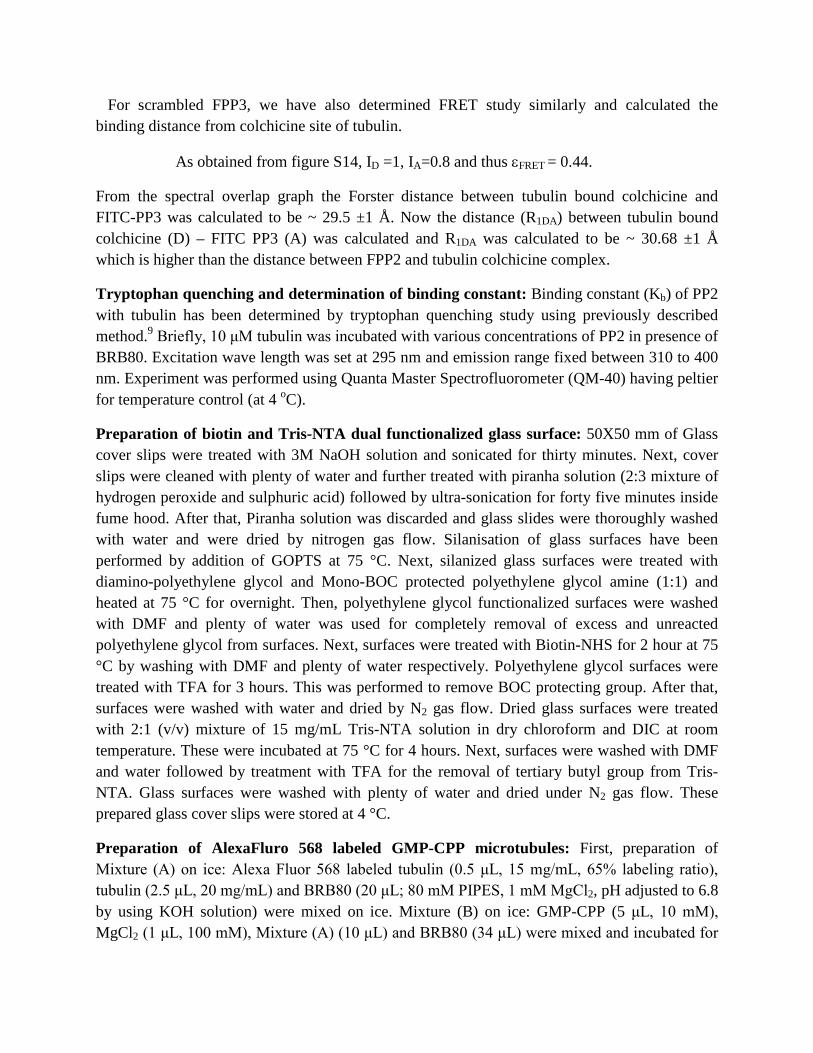
Tryptophan quenching and determination of binding constant: Binding constant (Kb) of PP2 with tubulin has been determined by tryptophan quenching study using previously described method.9 Briefly, 10 μM tubulin was incubated with various concentrations of PP2 in presence of BRB80. Excitation wave length was set at 295 nm and emission range fixed between 310 to 400 nm. Experiment was performed using Quanta Master Spectrofluorometer (QM-40) having peltier for temperature control (at 4 oC).
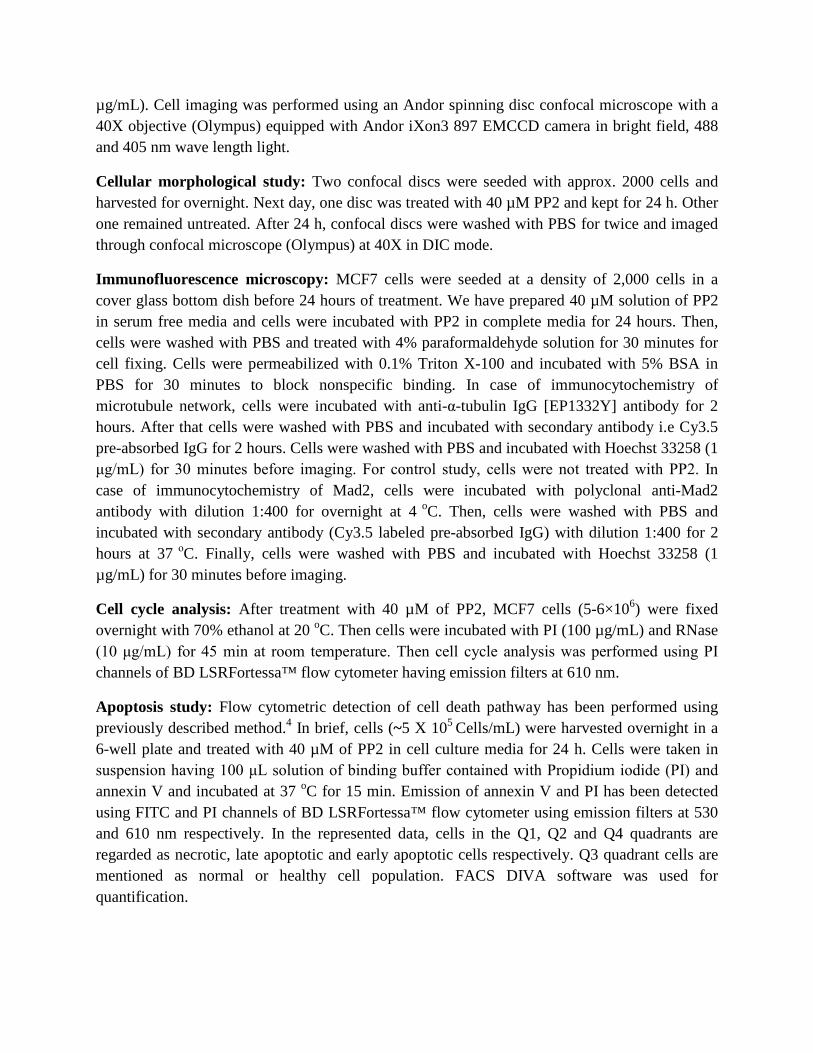
Preparation of biotin and Tris-NTA dual functionalized glass surface: 50X50 mm of Glass cover slips were treated with 3M NaOH solution and sonicated for thirty minutes. Next, cover slips were cleaned with plenty of water and further treated with piranha solution (2:3 mixture of hydrogen peroxide and sulphuric acid) followed by ultra-sonication for forty five minutes inside fume hood. After that, Piranha solution was discarded and glass slides were thoroughly washed with water and were dried by nitrogen gas flow. Silanisation of glass surfaces have been performed by addition of GOPTS at 75 °C. Next, silanized glass surfaces were treated with diamino-polyethylene glycol and Mono-BOC protected polyethylene glycol amine (1:1) and heated at 75 °C for overnight. Then, polyethylene glycol functionalized surfaces were washed with DMF and plenty of water was used for completely removal of excess and unreacted polyethylene glycol from surfaces. Next, surfaces were treated with Biotin-NHS for 2 hour at 75 °C by washing with DMF and plenty of water respectively. Polyethylene glycol surfaces were treated with TFA for 3 hours. This was performed to remove BOC protecting group. After that, surfaces were washed with water and dried by N2 gas flow. Dried glass surfaces were treated with 2:1 (v/v) mixture of 15 mg/mL Tris-NTA solution in dry chloroform and DIC at room temperature. These were incubated at 75 °C for 4 hours. Next, surfaces were washed with DMF and water followed by treatment with TFA for the removal of tertiary butyl group from Tris-NTA. Glass surfaces were washed with plenty of water and dried under N2 gas flow. These prepared glass cover slips were stored at 4 °C.
Preparation of AlexaFluro 568 labeled GMP-CPP microtubules: First, preparation of Mixture (A) on ice: Alexa Fluor 568 labeled tubulin (0.5 μL, 15 mg/mL, 65% labeling ratio), tubulin (2.5 μL, 20 mg/mL) and BRB80 (20 μL; 80 mM PIPES, 1 mM MgCl2, pH adjusted to 6.8 by using KOH solution) were mixed on ice. Mixture (B) on ice: GMP-CPP (5 μL, 10 mM), MgCl2 (1 μL, 100 mM), Mixture (A) (10 μL) and BRB80 (34 μL) were mixed and incubated for
2 hour at 37 °C. Next, mixture (B) was centrifuged for 7 min at 14,000 rpm in a tabletop centrifuge and a colored pallet was obtained. It was resuspended in 20 μL warm BRB80 at 37 °C. Microtubules were stored at room temperature.
Microtubule gliding on kinesin and BPP2 immobilized dual functionalized glass surface: This assay was performed as described in our earlier report.1b In brief, a flow chamber (around 5 µL) was built from dual functionalized Ni-loaded un-patterned Tris-NTA-PEG, neutravidin loaded biotin glass and one poly-L-lysine (PLL)-PEG passivated counter glass, separated by two strips of double sticky tape (Tesa). The flow chamber was equilibrated with BRB80 and then it was incubated with β-casein for 5 min. Excess β-casein was removed by washing with BRB80. Next, 1 mM Biotin-tagged PP2 in BRB80 was flowed into the flow chamber and incubated for 10 min. After 10 min, excess unbound peptides were removed by 20 µL BRB80. Next, 50 nM kinesin612-His10 in 20 µL BRB80 was flowed into the chamber and incubation maintained for 10 min. After 10 min, unbound motor proteins were washed out with 20 µL BRB80. Now, the flow chamber was allowed to warm upto room temperature. GMP-CPP stabilized Alexa568 labeled microtubules in motility buffer (BRB80 containing 3 mM Mg-ATP and an oxygen scavenger system (50 mM glucose, 1 mg/mL glucose oxidase and 0.5 mg/mL catalase) were flowed into the chamber. Gliding of microtubules were observed by time-lapse TIRF microscopy (Olympus) with a 60x/1.45 NA TIRF objective (Olympus) and an Andor iXon3 897 camera at 37 °C. Control experiment was performed following similar experimental procedure as described before without addition of biotinylated PP2.
Data analysis of gliding assay: Mean gliding speed of GMP-CPP stabilized microtubules on surfaces with immobilized kinesin in presence and absence of PP2 were measured from kymographs using Image J software.
Cellular internalization pathway: Mechanism of cellular internalization of FPP2 has been analyzed using previously described method with some modifications.10 Briefly, exponentially growing MCF7 cells (1×10⁶) were detached and collected in a suspension containing serum free DMEM (colourless) culture medium. Then cells were either incubated at 37 oC or 4 oC for 40 min. Next, these cell suspensions were treated with FPP2 of final concentration at about 5 µM and incubated at 37 oC or 4 oC for 2 h. Then the cell suspension was centrifuged at 800Xg to remove excess FPP2 from the solution and resuspended in DMEM culture medium containing trypsin (1 mg/mL) and incubated for 15 min. Cells were washed with serum free DMEM (colorless) culture medium and fluorescent signal was analyzed using 488 nm channels of BD LSRFortessa™ flow cytometer using emission filters at 530 nm.
Cellular uptake study: About 2,000 cells of MCF7 were seeded in a cover glass bottom dish and harvested overnight. We have prepared 5 µM solution of 5(6)-carboxy fluorescein labeled PP2 (FPP2) in serum free media and incubated for 4 h. Then, cells were washed twice with PBS (Phosphate Buffer Saline; pH 7.4) followed by fixed with 4% formaldehyde. Next, formaldehyde solution was removed and washed with PBS buffer. Nucleus was stained with Hoechst 33258 (1
µg/mL). Cell imaging was performed using an Andor spinning disc confocal microscope with a 40X objective (Olympus) equipped with Andor iXon3 897 EMCCD camera in bright field, 488 and 405 nm wave length light.
Cellular morphological study: Two confocal discs were seeded with approx. 2000 cells and harvested for overnight. Next day, one disc was treated with 40 µM PP2 and kept for 24 h. Other one remained untreated. After 24 h, confocal discs were washed with PBS for twice and imaged through confocal microscope (Olympus) at 40X in DIC mode.
Immunofluorescence microscopy: MCF7 cells were seeded at a density of 2,000 cells in a cover glass bottom dish before 24 hours of treatment. We have prepared 40 µM solution of PP2 in serum free media and cells were incubated with PP2 in complete media for 24 hours. Then, cells were washed with PBS and treated with 4% paraformaldehyde solution for 30 minutes for cell fixing. Cells were permeabilized with 0.1% Triton X-100 and incubated with 5% BSA in PBS for 30 minutes to block nonspecific binding. In case of immunocytochemistry of microtubule network, cells were incubated with anti-α-tubulin IgG [EP1332Y] antibody for 2 hours. After that cells were washed with PBS and incubated with secondary antibody i.e Cy3.5 pre-absorbed IgG for 2 hours. Cells were washed with PBS and incubated with Hoechst 33258 (1 μg/mL) for 30 minutes before imaging. For control study, cells were not treated with PP2. In case of immunocytochemistry of Mad2, cells were incubated with polyclonal anti-Mad2 antibody with dilution 1:400 for overnight at 4 oC. Then, cells were washed with PBS and incubated with secondary antibody (Cy3.5 labeled pre-absorbed IgG) with dilution 1:400 for 2 hours at 37 ᴏC. Finally, cells were washed with PBS and incubated with Hoechst 33258 (1 µg/mL) for 30 minutes before imaging.
Cell cycle analysis: After treatment with 40 µM of PP2, MCF7 cells (5-6×10⁶) were fixed overnight with 70% ethanol at 20 oC. Then cells were incubated with PI (100 µg/mL) and RNase (10 μg/mL) for 45 min at room temperature. Then cell cycle analysis was performed using PI channels of BD LSRFortessa™ flow cytometer having emission filters at 610 nm.
Apoptosis study: Flow cytometric detection of cell death pathway has been performed using previously described method.4 In brief, cells (~5 X 10⁵ Cells/mL) were harvested overnight in a 6-well plate and treated with 40 µM of PP2 in cell culture media for 24 h. Cells were taken in suspension having 100 μL solution of binding buffer contained with Propidium iodide (PI) and annexin V and incubated at 37 oC for 15 min. Emission of annexin V and PI has been detected using FITC and PI channels of BD LSRFortessa™ flow cytometer using emission filters at 530 and 610 nm respectively. In the represented data, cells in the Q1, Q2 and Q4 quadrants are regarded as necrotic, late apoptotic and early apoptotic cells respectively. Q3 quadrant cells are mentioned as normal or healthy cell population. FACS DIVA software was used for quantification.
Immunoblotting: MCF7 cells (5-6×10⁶) were harvested overnight followed by treated with 40 µM of PP2 for 24 h. Cells were lysed and total protein concentration has been evaluated using Bradford assay. Protein has been separated using SDS-PAGE and transferred to PVDF membrane. PVDF (Immobilon-P Polyvinylidene fluoride membranes; Millipore Corporation, Bedford, MA, USA) membrane was blocked for nonspecific interaction using skimmed milk solution followed by incubated overnight with primary monoclonal antibodies such as anti-p53 (Sigma), anti-p21 (Santa Cruz Biotechnology, Heidelberg, Germany) and anti-α-tubulin (Merck Millipore, Darmstadt, Germany). Then membrane was incubated with secondary antibody conjugated with peroxidase. Protein expression has been analyzed using HRP substrate (Luminata Forte Western HRP substrate, Merck Millipore, Darmstadt, Germany) and chemiluminescence detection system. To evaluate relative expression of p53 or p21 to that of control, protein band intensity has been normalized with loading control.
Spheroid co-localization study: We have generated the 3D spheroid of HeLa cell. Next, proper penetration of PP2 peptide was confirmed by co-localization of FPP2 with Hoechst 33258 has been observed in spheroid. First, we have incubated spheroid with FPP2 and then Hoechst 33258 for four and one hour respectively. Images were taken by 10X objective (Olympus IX83) and an Andor iXon3 897 EMCCD camera in 488 and 405 nm wavelength filter successively.
Generation and treatment of Multicellular Tumor Spheroidal (MCTS) culture: Multicellular Tumor Spheroidal generation of HeLa cell was performed using previously described non adhesive cell culture system.11 Briefly, the parental monolayer of HeLa cells were collected and seeded in 96 well plate coated with 1% agarose (w/v). The cell concentration was maintained 5×10³ cells/well. The HeLa cells were cultured in DMEM containing media and incubated in a humidified atmosphere with 5% CO2 for the days till size of the spheroid reached upto the 100 μm. Then spheroid morphologies were captured in DIC mode using inverted Nikon Ti-U eclipse microscope equipped with EMCCD camera and it was mentioned as day first. Then, the spheroids were divided in two groups- first, without treatment group as control and another, PP2 with concentration 40 µM. Size of the spheroids checked by above mentioned microscope for six days successively. Volume of the sphere were calculated and imaged taken by microscope each day. Formula used for volume calculation was mentioned below
V = 0.5 * Length * Width2
Data Analysis: Microscopic images were analysed by Image J and cellSens software. FACS data was analysed using FACS Diva software.
References:
1 (a) A. Hyman, D. Drechsel, D. Kellogg, S. Salser, K. Sawin, P. Steffen, L. Wordeman and T. Mitchison, Methods Enzymol. 1991, 196, 478. (b) A. Biswas, P. Kurkute, B. Jana, A. Laskar and S. Ghosh. Chem. Commun., 2014, 50, 2604.
2 O. Trott and A. J. Olson, J. Comput. Chem. 2010, 31, 455.
3 B.Gigant, C. Wang, R. B. Ravelli, F. Roussi, M. O. Steinmetz, P. A. Curmi, A. Sobel and M. Knossow, Nature 2005, 435, 519.
4 A. Saha, S. Mohapatra, P. Kurkute, B. Jana, P. Mondal, D. Bhunia, S. Ghosh and S. Ghosh, Chem. Commun. 2015, 51, 2249.
5 D. Bonnes, C. Heukle, C. Simon and D. Pantalo, J. Bio. Chem. 1985, 260, 2819. 6 A. Biswas, A. Saha, B. Jana, P. Kurkute, G. Mondal and S. Ghosh, ChemBioChem. 2013, 14,
689. 7 A. Adak, S. Mohapatra, P. Mondal, B. Jana, and S. Ghosh, Chem.Commun. 2016, 52,
7549. 8 S. Chakraborti, L. Das, N. Kapoor, A. Das, V. Dwivedi, A. Poddar, G. Chakraborti, M. Janik,
G. Basu, D. Panda, P. Chakrabarti, A. Surolia and B. Bhattacharyya, J Med Chem. 2011, 54, 6183.
9 B. Jana, J. Sarkar, P. Mondal, S. Barman, S. Mohapatra, D. Bhunia, K. Pradhan, A. Saha, A. Adak, S. Ghosh and S. Ghosh, Chem. Commun. 2015, 51, 12024.
10 J. Richard, K. Melikov, E. Vives, C. Ramos, B. Verbeure, M. Gait, L. Chernomordik and B. Lebleu, J. Biol. Chem. 2003, 278, 585.
11 J. Friedrich, C. Seidel, R. Ebner and L.A. Kunz-Schughart, Nature Protoc. 2009, 4, 309.
Supplementary Figures
Figure S1. The image showing specific interaction partners of polar and non-polar amino acids in the exchangable GTP/GDP binding site of tubulin.
Figure S2. Docking images at exchangeable GTP/GDP binding site of tubulin with PP2 reveals the amino acids residue of tubulin involved in the hydrogen bonding interaction with the peptide.
Figure S3. Docking images at exchangeable GTP/GDP binding site of tubulin with PP1 (a), PP3 (b), PP4 (c) and PP5 (d) reveals the amino acids residue of tubulin involved in the hydrogen bonding interaction with the peptide.
(a)
(b)
Figure S4. (a) HPLC and (b) Mass spectrum of PP2. Expected mass is 852 Da.
(a)
(b)
Figure S5. (a) HPLC and (b) Mass spectrum of PP1. Expected mass is 852 Da.
(a)
(b)
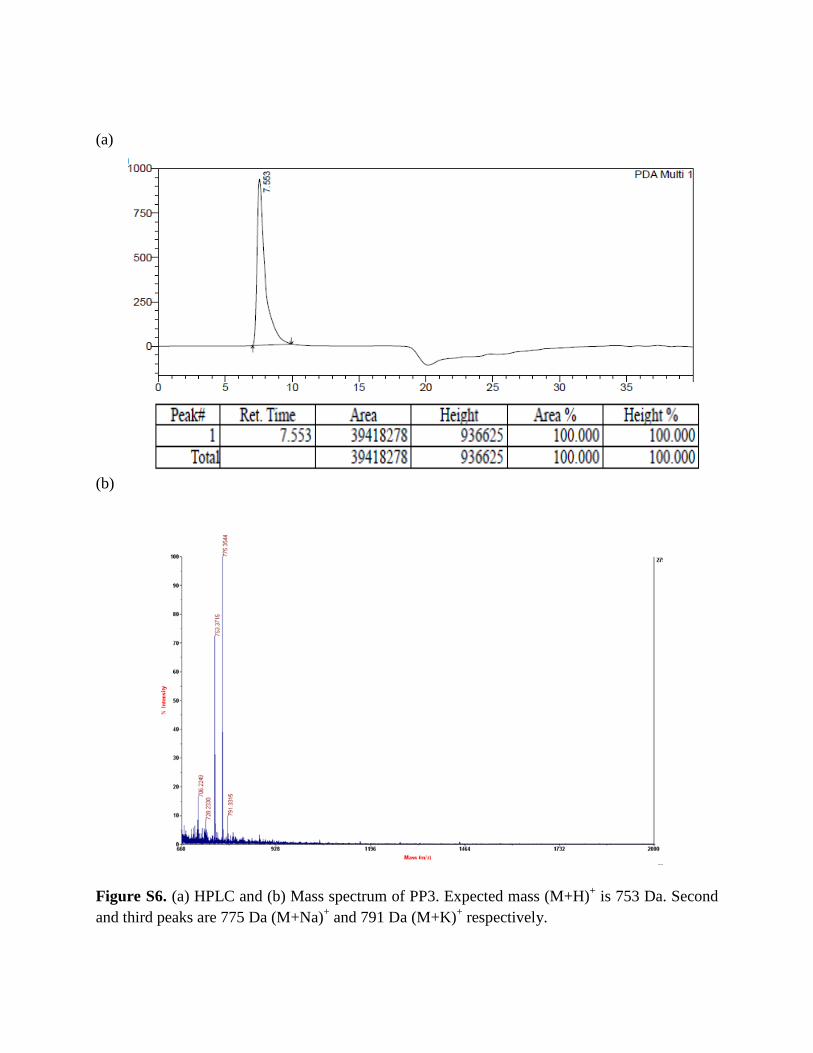
Figure S6. (a) HPLC and (b) Mass spectrum of PP3. Expected mass (M+H)+ is 753 Da. Second and third peaks are 775 Da (M+Na)+ and 791 Da (M+K)+ respectively.
(a)
(b)
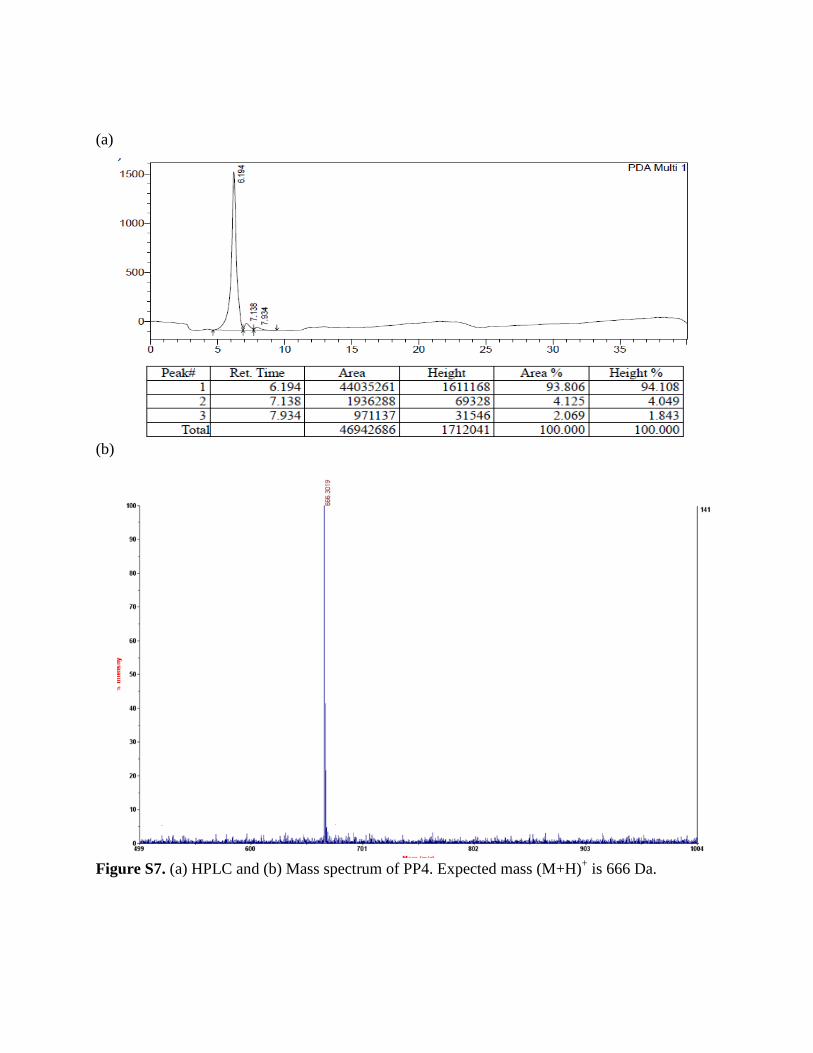
Figure S7. (a) HPLC and (b) Mass spectrum of PP4. Expected mass (M+H)+ is 666 Da.
(a)
(b)
Figure S8. (a) HPLC and (b) Mass spectrum of PP5. Expected mass is 852 Da.
Figure S9. Cytotoxicity study of PP1, PP2, PP3, PP4 and PP5 peptides in MCF7 cell line.
Figure S10. Cell viability study checked in MCF 7 cells after 2h of incubation with PP2.
(a)
(b)
Figure S11. (a) HPLC and (b) Mass spectrum of BPP2. Expected mass is 1078 Da.
Figure S12.TIRF microscopic image reveals binding of BPP2 on biotin micropattered surface and interaction with alexa568 labeled tubulin. Scale bar corresponds to 20 µm.
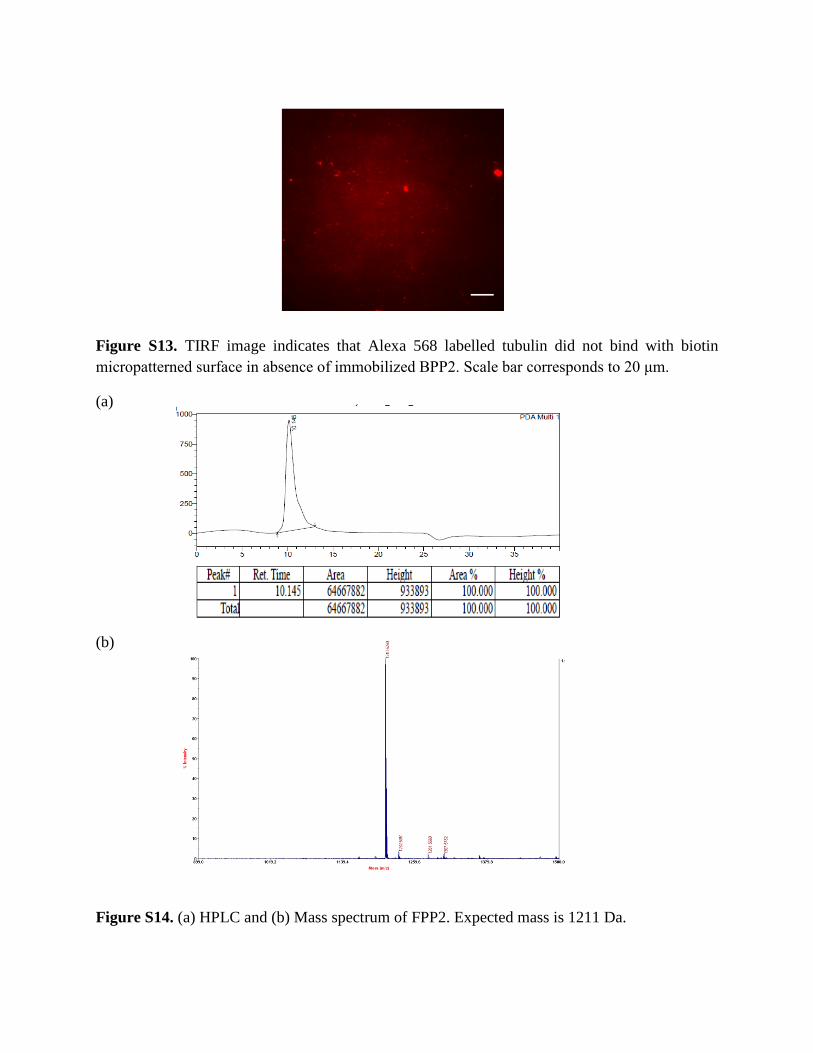
Figure S13. TIRF image indicates that Alexa 568 labelled tubulin did not bind with biotin micropatterned surface in absence of immobilized BPP2. Scale bar corresponds to 20 μm.
(a)
(b)
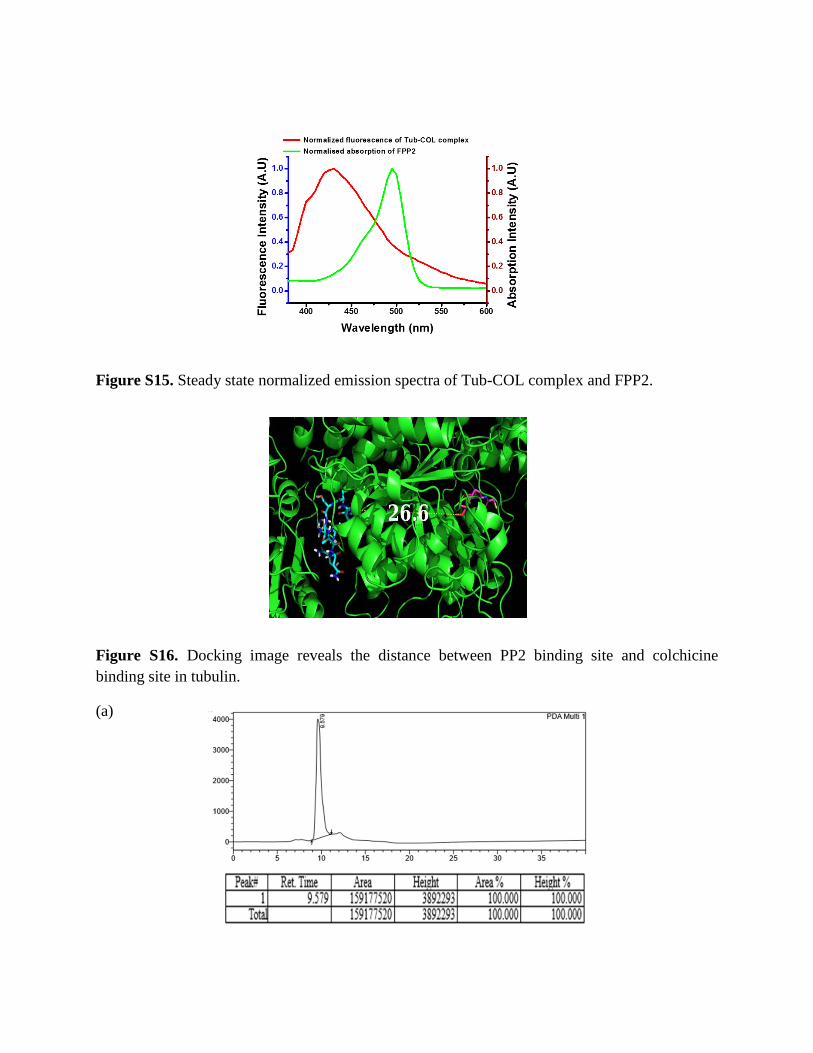
Figure S14. (a) HPLC and (b) Mass spectrum of FPP2. Expected mass is 1211 Da.
Figure S15. Steady state normalized emission spectra of Tub-COL complex and FPP2.
Figure S16. Docking image reveals the distance between PP2 binding site and colchicine binding site in tubulin.
(a)
(b)
Figure S17. (a) HPLC and (b) Mass spectrum of FPP3. Expected mass is 1112 Da. Second and third minor peaks are 1133 Da (M+Na)+ and 1149 Da (M+K)+.
Figure S18. Steady state emission spectra of Tub-COL, FPP3 and both (1:1).
400 450 500 550 600 6500
1
2
3
4
5
Norm
alize
d Fl
uore
scen
ce In
tens
ity
Wavelength (nm)
Only tubulin colchicine complex Only FPP3 peptide Both (1:1)
Figure S19. Tryptophan fluorescence quenching study observed at different concentrations of PP2.
Figure S20. Histogram of gliding speed of microtubules in presence of PP2.
Figure S21. Histogram of gliding speed of microtubules in absence of PP2.
Figure S22. Confocal images of cellular uptake of 5 µM FPP2 into the MCF7 cells. (a) In bright field, (b) 405 nm channel, (c) 488 nm channel and (d) 2D merged image. (e) 3D merged image of cellular uptake. Scale bars correspond to 20 μm.
Figure S23. Cellular uptake study of 5 µM FPP2 by flow cytometry indicating uptake follows endocytosis mechanism.
Figure S24. Comparative flow cytometric uptake study between FPP2 and FPP3 at 37 °C.
Figure S25. Comparative cell morphology study a) Control b) after treatment of PP2 at 40 µM concentration.
Figure 26. Confocal images show the shrinkage, aggregation and bundle formation of intracellular microtubules of MCF7 cells after 40 µM PP2 treatment (d-f) compared to control (a-c). Scale bars correspond to 20 µm.
Figure S27. MTT study after treatment of PP2 into the different cell lines (B16F10, MDAMB231, HeLa and A549). Here, X-axis indicates concentration (µM) and Y-axis as percent of cell viability.
Figure S28. Cell viability study checked in WI38 cells after 24h of incubation with PP2.
Figure S29. Activation of Mad2 protein after treatment with 40 µM of PP2 in MCF7 cells. Scale bars correspond to 20 μm.
Figure S30. Cell cycle arrest study of control (a) and PP2 treated (b). MCF7 cells reveal that cell cycle arrest occurs at G1 phase of MCF7 cells after PP2 treatment, which also induced in enhancement of cancer cell population at Sub Go phase.
Figure S31. Apoptosis study by flow cytometry unravels the early (11.6%) and late apoptosis (14.3%) of MCF7 cells occurs after treatment with PP2 (b) compared to control (a).
Figure S32. Quantitative analysis of p53 and P21 protein expression inside MCF7 cell after treatment with PP2 by immunoblotting (a). Histogram reveals enhancement of p53 (b) and p21 (c) protein expression after treatment with PP2 compared to control.
Figure S33. Comparative spheroid growth inhibition study after PP2 treatment upto 5 days (b) with respect to control (a). Scale bars corresponds to 100 μm.
Supplementary Movies
Supplementary Movie S1. Gliding assay of GMP-CPP Alexa568 microtubules (this microtubules are the mimic of intracellular microtubules) on Tris-NTA and biotin functionalized glass surface in presence of BPP2.
Supplementary Movie S2. Gliding assay of GMP-CPP Alexa568 microtubules on Tris-NTA and biotin functionalized glass surface in absence of BPP2.


![Supporting information 20170215 - rsc.org fileInjector temperature [°C] 100 100 100 100 Column ...](https://static.documents.pub/doc/80x56/5b946bf209d3f2df3f8cef83/supporting-information-20170215-rsc-temperature-c-100-100-100-100-column.jpg)
![SUPPORTING INFORMATION - rsc.org · Trihexyl(tetradecyl)phosphonium L-Lactate [P66614][L-Lactate] Prepared by QUILL Trihexyl(tetradecyl)phosphonium Trifluoromethanesulfonate [P66614][OTf]](https://static.documents.pub/doc/80x56/5c5dbe0d09d3f2ca618b4808/supporting-information-rsc-trihexyltetradecylphosphonium-l-lactate-p66614l-lactate.jpg)


