Supporting Information
Neuroprotective Activity of Cerebrosides from Typhonium giganteum by Regulating
Caspase-3 and Bax/Bcl-2 Signaling Pathways in PC12 Cells
Yang Jin,†,‡,⊥ Jun-Ting Fan,
†,⊥ Xiao-Ling Gu,† Li-Ying Zhang,
† Jing Han,
§ Shu-Hu Du,
*,†, ‡
and Ai-Xia Zhang*,†
†School of Pharmacy and
‡Key Laboratory of Cardiovascular and Cerebrovascular Drug
Research of Jiangsu Province, Nanjing Medical University, Nanjing 211166, People’s
Republic of China
§School of Pharmacy, Nanjing University of Chinese Medicine, Nanjing 210023, People’s
Republic of China
CONTENTS
Figure S1. UV spectrum of compound 1
Figure S2. IR spectrum of compound 1
Figure S3. 1H-NMR spectrum of compound 1 (600 MHz, C5D5N)
Figure S4. 13
C-NMR spectrum of compound 1 (150 MHz, C5D5N)
Figure S5. 1H-
1H COSY spectrum of compound 1
Figure S6. HSQC spectrum of compound 1
Figure S7. HMBC spectrum of compound 1
Figure S8. HR-ESI-MS of compound 1
Figure S9. ESI-MS/MS of compound 1
Figure S10. UV spectrum of compound 2
Figure S11. IR spectrum of compound 2
Figure S12. 1H-NMR spectrum of compound 2 (600 MHz, C5D5N)
Figure S13. 13
C-NMR spectrum of compound 2 (150 MHz, C5D5N)
Figure S14. 1H-
1H COSY spectrum of compound 2
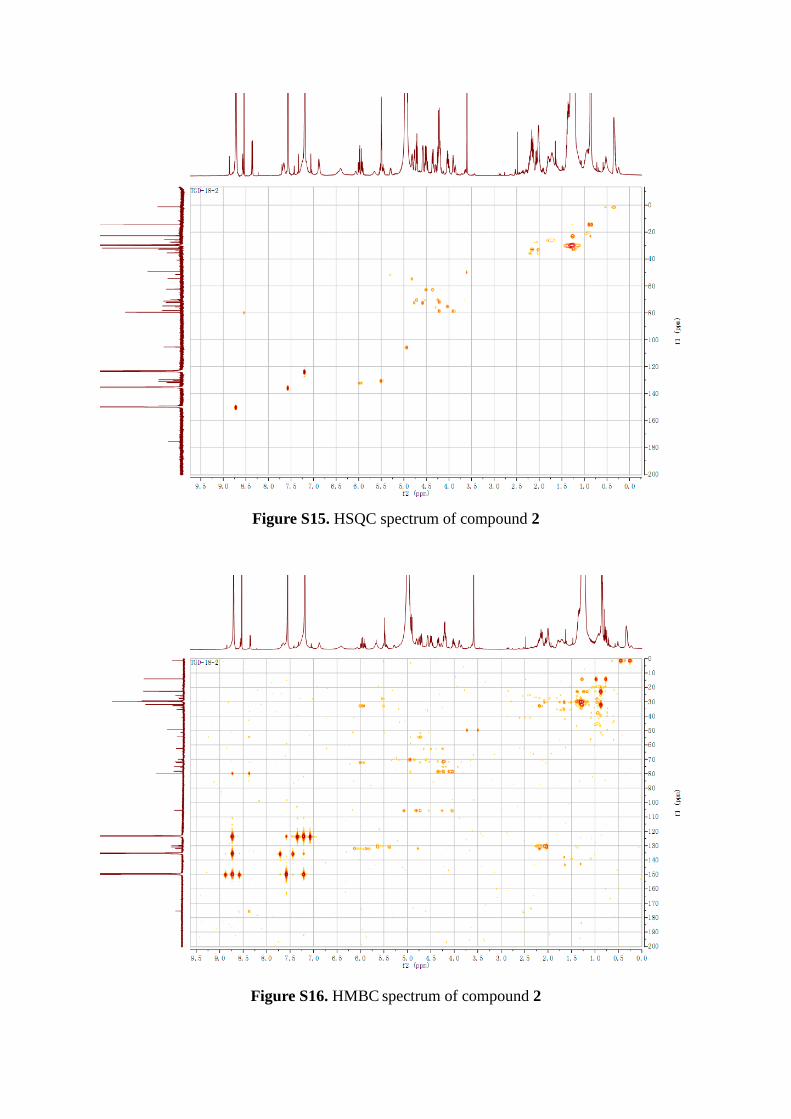
Figure S15. HSQC spectrum of compound 2
Figure S16. HMBC spectrum of compound 2
Figure S17. HR-ESI-MS of compound 2
Figure S18. ESI-MS/MS of compound 2
Figure S19. Effects of ethyl acetate extract from T. giganteum on glutamate-induced PC12
cell death
Figure S20. Effects of compounds 1−13 on PC12 cell viability
Figure S21. Effects of longan cerebroside II (11) on cell cycle of PC12 cells treated
with/without glutamate
Table S1. The information on antibodies used in the western blotting experiments
200.0 225.0 250.0 275.0 300.0 325.0 350.0 375.0 400.0 425.0 nm
0
5
10
15
20
25
30
35
mAU 23.03/ 1.00
198
282
203
Figure S1. UV spectrum of compound 1
E:\天然药化\金阳\TGD-18-1.0 Au GSH APS--00 29/10/2015
3363.2
7
2921.3
52851.6
4
1724.5
0
1644.6
9
1537.7
6
1465.3
1
1380.6
01348.7
91319.5
31260.9
4
1082.5
11046.8
5
962.2
7
900.3
7
800.6
7
721.3
4
653.7
3610.2
9
5001000150020002500300035004000
Wavenumber cm-1
020
40
60
80
100
120
140
Tra
nsm
itta
nce
[%
]
Figure S2. IR spectrum of compound 1
Figure S3.
1H-NMR spectrum of compound 1 (600 MHz, C5D5N)
Figure S4. 13
C-NMR spectrum of compound 1 (150 MHz, C5D5N)
620.40000
Figure S9. ESI-MS/MS of compound 1
200.0 225.0 250.0 275.0 300.0 325.0 350.0 375.0 400.0 425.0 nm
0
5
10
15
20
25
30
35
mAU 23.03/ 1.00
198
282
203
Figure S10. UV spectrum of compound 2
E:\天然药化\金阳\TGD-18-2.0 Au GSH APS--00 29/10/2015
3360.5
7
2921.0
02851.5
7
2031.2
2
1725.3
1
1644.8
11623.2
5
1537.5
8
1465.6
0
1380.7
11348.7
91319.9
41261.0
5
1156.1
9
1082.8
01046.1
1
961.9
2
900.4
0
800.6
5
721.3
4
653.2
3610.5
0
430.6
8
5001000150020002500300035004000
Wavenumber cm-1
020
40
60
80
100
120
140
Tra
nsm
itta
nce
[%
]
Figure S11. IR spectrum of compound 2
Figure S12. 1H-NMR spectrum of compound 2 (600 MHz, C5D5N)
Figure S13. 13
C-NMR spectrum of compound 2 (150MHz, C5D5N)
Figure S14. 1H-
1H COSY spectrum of compound 2
Figure S17. HR-ESI-MS of compound 2
620.40000
602.60000
341.00000
306.00000
279.20000
Figure S18. ESI-MS/MS of compound 2
0
20
40
60
80
100
120
C Glu 1 5 10 20 40
Glu (12.5 mM)
Su
rviv
al
rate
(%
)
##
**
**
**
EA
( µg/mL)
**
Figure S19. Effects of the ethyl acetate (EA) extract on glutamate-induced PC12 cell death.
PC12 cells were treated with 12.5 mM glutamate with EA (1, 5, 10, 20, 40 μg/mL) for 24 h.
Cell viability was measured by MTT assay. Each value represents the mean SD. n = 6, ##
p <
0.01 vs control group, **p < 0.01 vs model group.
0
20
40
60
80
100
120
C 1 2 3 4 5 6 7 8 9 10 11 12 13
20 μM
Su
rviv
al
rate
(%
) *
Figure S20. Effects of compounds 1−13 on PC12 cell viability. Cells were treated with
compounds 1−13 at 20 μM for 24 h. Cell viability was measured by MTT assay.
(A) (B) (C)
(D) (E) (F)
Figure S21. Effects of longan cerebroside II (11) on cell cycle of PC12 cells treated
with/without glutamate. PC12 cells were treated with/without 12.5 mM glutamate along with
low, medium, or high concentrations (0.1, 1, 10 μM) of longan cerebroside II (11) for 24 h.
The control group did not contain glutamate. (A) Control group, (B) glutamate model group,
(C) 0.1 µM longan cerebroside II (11) + glutamate, (D) 1 µM longan cerebroside II (11) +
glutamate, (E) 10 µM longan cerebroside II (11) + glutamate, (F) 10 µM longan cerebroside II
(11).
Table S1. Summary of Antibodies and Working Conditions Used in the Experiments
Antibody Species Source Dilution
Primary antibodies
Anti-caspase-9 Rabbit, polyclonal Cell Signaling Technology Inc., MA, USA 1:1000
Anti-caspase-3 Rabbit, polyclonal Bioworld Technology Inc., MN, USA 1:1000
Anti-cytochrome c Rabbit, monoclone Cell Signaling Technology Inc., MA, USA 1:1000
Anti-Bcl-2 Rabbit, polyclonal Bioworld Technology Inc., MN, USA 1:1000
Anti-Bax Rabbit, polyclonal Bioworld Technology Inc., MN, USA 1:1000
Tubulin Mouse, polyclonal Bioworld Technology Inc., MN, USA 1:5000
Secondary antibodies
Anti-rabbit IgG (HRP) Goat Bioworld Technology Inc., MN, USA 1:5000
Anti-mouse (HRP) Rabbit Bioworld Technology Inc., MN, USA 1:5000