Page 1
www.sciencemag.org/cgi/content/full/320/5872/100/DC1
Supporting Online Material for
Bacteria Subsisting on Antibiotics Gautam Dantas, Morten O. A. Sommer, Rantimi D. Oluwasegun, George M. Church*
*To whom correspondence should be addressed. E-mail: http://arep.med.harvard.edu/gmc/email.html
Published 4 April 2008, Science 320, 100 (2008)
DOI: 10.1126/science.1155157
This PDF file includes:
Materials and Methods Figs. S1 to S3 Tables S1 to S3 References
Page 2
Dantas and Sommer, et. al Supporting Materials Bacteria subsisting on antibiotics
Page S1 of S15
Bacteria Subsisting on Antibiotics
Supporting Online Material
Gautam Dantas*1, Morten O. A. Sommer*1,2, Rantimi D. Oluwasegun1, George M. Church1
1 Department of Genetics, Harvard Medical School, Boston, MA‐02115, USA.
2 Program of Biophysics, Harvard University, Cambridge, MA‐02138, USA.
* These authors contributed equally to this work.
Materials and Methods
Growth media
All liquid media used for isolating bacteria capable of subsisting on antibiotics was made by dissolving 1
g/L of the relevant antibiotics (Table S1) into Single Carbon Source (SCS) media containing 5 g (NH4)2SO4,
3 g KH2PO4, 0.5 g MgSO4∙7H2O, 15 mg EDTA, 4.5 mg ZnSO4∙7H2O, 4.5 mg CaCl2∙2H2O, 3 mg FeSO4∙7H2O, 1
mg MnCl2∙4H2O, 1 mg H3BO3, 0.4 mg Na2MoO4∙2H2O, 0.3 mg CuSO4∙5H2O, 0.3 mg CoCl2∙6H20 and 0.1 mg
KI per liter water. The pH was adjusted to 5.5 using HCl, and the media was sterilized through a 0.22 µm
filter. Solid medium was prepared by adding 15 g agar per liter of liquid SCS media followed by
autoclaving before adding antibiotics.
All liquid media used for resistance profiling was made by dissolving 20 mg/L or 1 g/L of the relevant
antibiotics into autoclaved Luria Broth containing 5 g Yeast Extract, 10 g NaCl and 10 g of Tryptone in 1
Page 3
Dantas and Sommer, et. al Supporting Materials Bacteria subsisting on antibiotics
Page S2 of S15
Liter of water. The pH was adjusted to 5.5 using HCl, and the media was sterilized through a 0.22 µm
filter.
Culturing of environmental bacteria capable of subsisting on antibiotics
Initial soil microbial inocula (soil description in table S2) were prepared in minimal medium containing
no carbon, and inoculated into SCS‐antibiotic media (corresponding to approximately 125 mg of
dissolved soil in 5mL of media). To significantly reduce the transfer of residual alternative carbon
sources present in original inocula, samples were passaged (2.5 uL) into fresh SCS‐antibiotic media (5
mL) two additional times after 7 days of growth, resulting in a 5x10⁴ dilution at each passage (resulting
in a final carryover of approximately 30 ng of soil in 5mL of media at the third passage). Clonal isolates
from the liquid cultures were obtained by plating cultures out on SCS‐antibiotic agar medium and
resulting single colonies were picked and restreaked on corresponding plates. Three colonies each were
then inoculated into fresh SCS‐antibiotic liquid media (5 mL) to confirm clonal phenotype. Final culture
growth was recorded after 1 month incubation without shaking at 22°C and cultures with at least 108
cells/mL were assayed as positive growth.
Since inoculation in media lacking a carbon source (no carbon control) did not show growth in any cases,
carbon source contamination of the source media or carbon fixation from the air were considered
insignificant to this experiment. The only other alternative carbon substrate for growth could be
impurities in the antibiotic stocks. All antibiotics used were purchased from Sigma‐Aldrich at the highest
purities available – lot purities of each compound used are listed in Table S1. Based on an average
carbon mass of 0.15x10‐12 g per bacterial cell, we estimate that at least 15 μg of carbon must be
incorporated into bacterial biomass to reach sufficient culture densities in 1 mL of culture to be rated as
Page 4
Dantas and Sommer, et. al Supporting Materials Bacteria subsisting on antibiotics
Page S3 of S15
successful growth. Assuming 50% carbon content of impurities, and under the most stringent
assumptions of (1) 100% incorporation of carbon impurities into biomass, and (2) no loss of carbon as
metabolic byproducts (such as CO2), antibiotics with greater than 97% purity would have insufficient
impurities to support sole carbon source growth. Of the antibiotic lots used in this experiment (Table
S1), twelve compound stocks are at least 99% pure, two compounds (ciprofloxacin and D‐cycloserine)
have between 98 and 98.5% purity, one compound (carbenicillin) is 92.9% pure, and no purity
information is available for three compounds (kanamycin, gentamicin, and vancomycin).
Phylogenetic profiling
The 16S ribosomal DNA (rDNA) of each of the clonal isolates identified in this study was amplified using
universal bacterial 16S primers:
>Bact_63f_62C
5’ – CAG GCC TAA CAC ATG CAA GTC – 3’
>Bact_1389r_63C
5’ – ACG GGC GGT GTG TAC AAG – 3’
Successful 16S rDNA amplicons were sequenced for phylogenetic profiling. High‐quality, non‐chimeric
sequences were classified using Greengenes (1, 2), with consensus annotations from RDP (3) and NCBI
taxonomies (4). Phylogenetic trees were constructed using the neighbor‐joining algorithm in ARB (5)
using the Greengenes aligned 16S rDNA database. Placement in the tree was confirmed by comparing
automated Greengenes taxonomy to the annotated taxonomies of nearest neighbours of each sequence
in the aligned database.
Page 5
Dantas and Sommer, et. al Supporting Materials Bacteria subsisting on antibiotics
Page S4 of S15
Resistance profiling of 75 representative isolates capable of subsisting on antibiotics
75 clonal isolates (Table S3) were selected to include multiple isolates capable of subsisting on each of
the 18 antibiotics and originating from each of the 11 soils (Table S2). Bacterial cultures were inoculated
into Luria Broth from frozen glycerol stocks and were incubated at 22°C for 3 days. 500 nL of this culture
was used to inoculate each of the clonal isolates into 200 uL of Luria Broth containing one of the
eighteen different antibiotics (See Table S1) at 20 mg/L and 1 g/L. Cultures were incubated without
shaking at 22°C for 4 days. Resistance of an isolate was determined by turbidity at 600 nm using a
Versamax microplate reader from Molecular Devices.
Analysis of antibiotic removal of penicillin and carbenicillin subsisting bacteria
Representative isolates capable of growth on penicillin and carbenicillin as sole carbon source were
selected for analysis of antibiotic removal from the growth media by High Performance Liquid
Chromatography (HPLC). 2 uL of these cultures were re‐inoculated into fresh SCS‐ antibiotic medium (5
mL) and allowed to grow for 28 days. Samples of the cultures and un‐inoculated media controls were
taken at regular intervals throughout the 28 day period and the catabolism of penicillin and carbenicillin
was monitored at 214 nm by HPLC of filtered media from samples using a Hewlett Packard 1090 Liquid
Chromatograph and a Vydac C‐18 column. HPLC was performed at a flow rate of 0.3 mL/min with an
acetonitrile gradient going from 5% to 65% in 30 minutes in the presence of 0.1 % trifluoroacetic acid.
The HPLC chromatogram of the penicillin catabolizing culture medium (Fig 1B) started out with a single
peak corresponding to the penicillin peak of the un‐inoculated control. This peak disappeared at day 4
with the appearance of multiple smaller peaks at lower elution times; by day 20 these peaks had also
disappeared in agreement with the complete catabolism of penicillin by the culture in 20 days. In
Page 6
Dantas and Sommer, et. al Supporting Materials Bacteria subsisting on antibiotics
Page S5 of S15
comparison, the single penicillin peak in the un‐inoculated control remained the dominant peak over the
same time course. The HPLC chromatogram of the medium from the carbenicillin catabolizing culture
(Fig 1B) started out with a bimodal peak corresponding to the un‐inoculated carbenicillin control, which
remained stable for 2 days. At day 4, corresponding to the appearance of visible turbidity in the
inoculated culture, the bimodal peak had almost disappeared and secondary peaks at lower elution
times were observed. These secondary peaks almost completely disappeared by the 28th day, suggesting
that carbenicillin was almost completely catabolized within 28 days. The bimodal carbenicillin peak
remained relatively unchanged in the un‐inoculated control over the same time course.
Samples from the penicillin subsisting culture from day 0 and day 4 were prepared for LC/MS using a
Waters Sep‐Pak Cartridge prior to mass spectrometry analysis using a LTQ‐FT from Thermo Electron.
Mass spectra were analyzed using XCalibur 2.0.5 and the empirically determined m/z values of all major
peaks were compared to predicted m/z values of putative penicillin degradation products calculated
using ChemDraw Ultra 9.0 (Fig S3).
Page 7
Dantas and Sommer, et. al Supporting Materials Bacteria subsisting on antibiotics
Page S6 of S15
Supporting Figures:
Figure S1:
Page 8
Dantas and Sommer, et. al Supporting Materials Bacteria subsisting on antibiotics
Page S7 of S15
Figure S1. Distribution of antibiotic catabolizing bacterial isolates with respect to antibiotics and soil.
(A) Number of antibiotic catabolizing bacteria isolated from 11 soils color‐coded by antibiotic class
catabolized. (B) Percentage of soils containing antibiotic catabolizing bacteria, color‐coded by chemical
origin of antibiotic.
Figure S2:
Figure S2. Phylogenetic distribution of bacterial isolates subsisting on antibiotics. Full set of bacteria
subsisting on antibiotics is displayed in the centre, with branches color‐coded by bacterial orders, and
clonal isolates represented as squares. Subsets comprising clonal isolates catabolizing each antibiotic
are represented as trees around the periphery, grouped by antibiotic class. 16S ribosomal DNA (rDNA)
Page 9
Dantas and Sommer, et. al Supporting Materials Bacteria subsisting on antibiotics
Page S8 of S15
was sequenced from antibiotic catabolizing clonal isolates using universal bacterial rDNA primers. High‐
quality, non‐chimeric sequences were classified using Greengenes (2), with consensus annotations from
RDP (3) and NCBI taxonomies (4). Phylogenetic trees were constructed using the neighbor‐joining
algorithm in ARB (5) using the Greengenes aligned 16S rDNA database. Placement in the tree was
confirmed by comparing automated Greengenes taxonomy to the annotated taxonomies of nearest
neighbors of each sequence in the aligned database. The phylogenetic distributions of species isolated
from different antibiotics as sole carbon source exhibit some interesting trends. For instance, the
fluoroquinolone antibiotics, ciprofloxacin and levofloxacin, have similar phylogenetic distributions, as do
the aminoglycoside antibiotics, gentamycin and amikacin, but the two sets are notably different from
each other. Interestingly, the orders of bacteria subsisting on amikacin appear more similar to
gentamycin than kanamycin despite amikacin being a semi synthetic kanamycin derivative.
Page 10
Dantas and Sommer, et. al Supporting Materials Bacteria subsisting on antibiotics
Page S9 of S15
Figure S3:
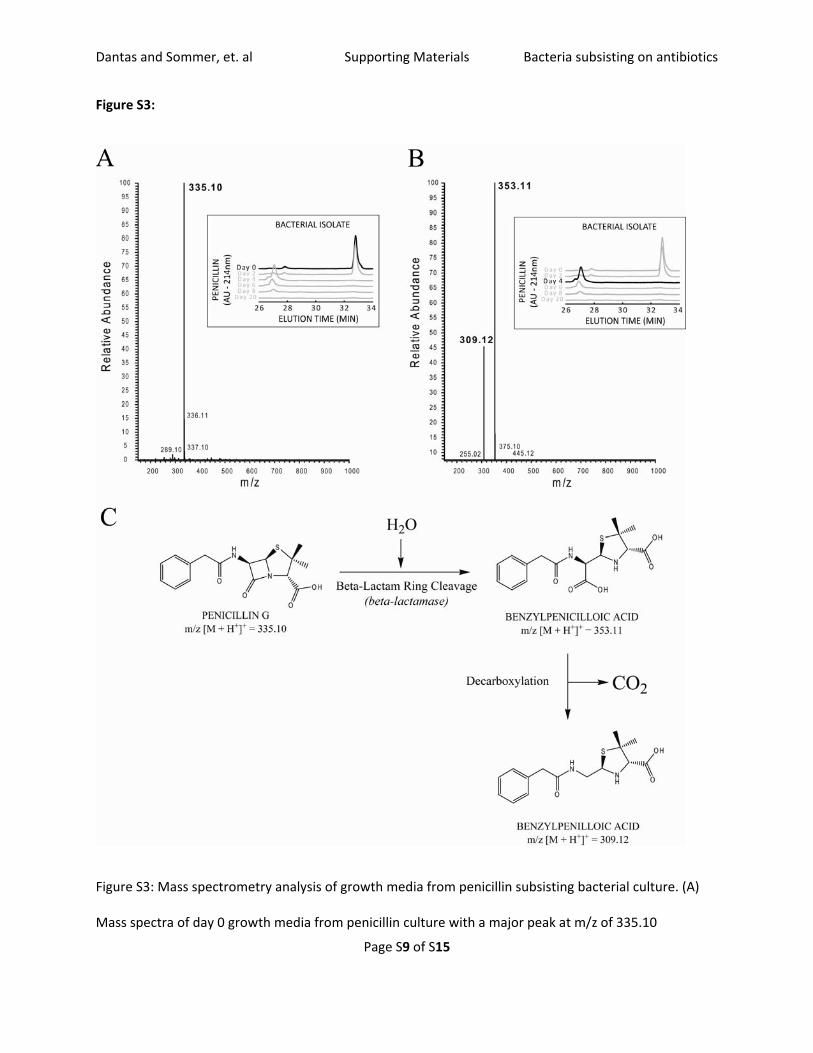
Figure S3: Mass spectrometry analysis of growth media from penicillin subsisting bacterial culture. (A)
Mass spectra of day 0 growth media from penicillin culture with a major peak at m/z of 335.10
Page 11
Dantas and Sommer, et. al Supporting Materials Bacteria subsisting on antibiotics
Page S10 of S15
corresponding exactly to the protonated penicillin G molecule. (B) Mass spectra of day 4 growth media
from penicillin culture with two major peaks at m/z values 353.11 and 309.12 corresponding to
protonated benzylpenicilloic acid and benzylpenilloic acid, respectively. (C) Proposed first steps of
penicillin G degradation pathway.
Page 12
Dantas and Sommer, et. al Supporting Materials Bacteria subsisting on antibiotics
Page S11 of S15
Supporting Tables
Table S1. Lot purities of antibiotics used, as reported on Certificates of Analysis from Sigma‐Aldrich.
(NR=Not Reported)
Antibiotics Lot Purity % Ciprofloxacin 98.5 Levofloxacin 100.0 Sisomicin 99 Gentamicin NR Kanamycin NR Amikacin 100 Penicillin G 99.7 Carbenicillin 92.9 Dicloxacillin 99.8 Chloramphenicol >99 Nalidixic acid 100 Thiamphenicol >99 Sulfisoxazole 99.7 Trimethoprim 100 Mafenide 100 Sulfamethizole 99.9 D‐Cycloserine 98 Vancomycin NR
Page 13
Dantas and Sommer, et. al Supporting Materials Bacteria subsisting on antibiotics
Page S12 of S15
Table S2: Soil information for the 11 different soils from which bacteria capable of subsisting on
antibiotics were isolated.
Figure 1A identifiers
Soil type Soil name
Soil collection location
F1 Farmland S1G Corn Field with Antibiotic Treated Manure, Great Brook Farm, Carlisle, MA
F2 Farmland S1N Alfalfa Field with Manure Treatment, Northcroft Farm , Pelican Rapids, MN
F3 Farmland S2N Alfalfa Field without Manure Treatment, Northcroft Farm, Pelican Rapids, MN
P1 Pristine S2R Raccoon Ledger, Rockport, MA P2 Pristine S3N Prairie next to Northcroft Farm,
Pelican Rapids, MN P3 Pristine S1R Brier’s Swamp, Rockport, MA P4 Pristine S1A Pristine Forest Soil,
Alan Seeger Natural Area, PA P5 Pristine S2T Untreated Forested Area,
Toftrees State Gameland Area, PA U1 Urban S1T Waste Water Treated Area,
Toftrees State Gameland Area, PA U2 Urban S3F Boston Fens, MA U3 Urban S1P Boston Public Garden, MA
Page 14
Dantas and Sommer, et. al Supporting Materials Bacteria subsisting on antibiotics
Page S13 of S15
Table S3: Strain information for the 75 clonal isolates used for resistance profiles. Figure 3A identifier Strain name Subsisting on From soil
1 Levo‐S2T‐M1LLLSSL‐2 Levofloxacin S2T 2 Kana‐S2T‐M1LLLSSL‐3 Kanamycin S2T 3 Amik‐S2T‐M1LLLSSL‐1 Amikacin S2T 4 Carb‐S2T‐M1LLLSSL‐2 Carbenicillin S2T 5 Chlo‐S2T‐M1LLLSSL‐2 Chloramphenicol S2T 6 Nali‐S2T‐M1LLLSSL‐1 Nalidixic acid S2T 7 Thia‐S2T‐M1LLLSSL‐2 Thiamphenicol S2T 8 Trim‐S2T‐M1LLLSSL‐1 Trimethoprim S2T 9 Mafe‐S2T‐M1LLLSSL‐3 Mafenide S2T 10 Cycl‐S2T‐M1LLLSSL‐3 D‐Cycloserine S2T 11 Vanc‐S2T‐M1LLLSSL‐3 Vancomycin S2T 12 Siso‐S2N‐M1LLLSSL‐1 Sisomycin S2N 13 Gent‐S2N‐M1LLLSSL‐2 Gentamycin S2N 14 Kana‐S2N‐M1LLLSSL‐2 Kanamycin S2N 15 Peni‐S2N‐M1LLLSSL‐2 Penicillin G S2N 16 Dicl‐S2N‐M1LLLSSL‐1 Dicloxacillin S2N 17 Trim‐S2N‐M1LLLSSL‐1 Trimethoprim S2N 18 Vanc‐S2N‐M1LLLSSL‐1 Vancomycin S2N 19 Dicl‐S3N‐M1LLLSSL‐2 Dicloxacillin S3N 20 Thia‐S3N‐M1LLLSSL‐3 Thiamphenicol S3N 21 Trim‐S3N‐M1LLLSSL‐2 Trimethoprim S3N 22 Mafe‐S3N‐M1LLLSSL‐2 Mafenide S3N 23 Vanc‐S3N‐M1LLLSSL‐2 Vancomycin S3N 24 Cipr‐S1P‐M1LLLSSL‐3 Ciprofloxacin S1P 25 Peni‐S1P‐M1LLLSSL‐2 Penicillin G S1P 26 Chlo‐S1P‐M1LLLSSL‐1 Chloramphenicol S1P 27 Thia‐S1P‐M1LLLSSL‐1 Thiamphenicol S1P 28 Trim‐S1P‐M1LLLSSL‐3 Trimethoprim S1P 29 Slfm‐S1P‐M1LLLSSL‐2 Sulfamethizole S1P 30 Cycl‐S1P‐M1LLLSSL‐1 D‐Cycloserine S1P 31 Vanc‐S1P‐M1LLLSSL‐3 Vancomycin S1P 32 Cipr‐S1T‐M1LLLSSL‐2 Ciprofloxacin S1T 33 Levo‐S1T‐M1LLLSSL‐1 Levofloxacin S1T 34 Siso‐S1T‐M1LLLSSL‐1 Sisomycin S1T 35 Carb‐S1T‐M1LLLSSL‐1 Carbenicillin S1T 36 Dicl‐S1T‐M1LLLSSL‐1 Dicloxacillin S1T 37 Chlo‐S1T‐M1LLLSSL‐1 Chloramphenicol S1T 38 Thia‐S1T‐M1LLLSSL‐3 Thiamphenicol S1T
Page 15
Dantas and Sommer, et. al Supporting Materials Bacteria subsisting on antibiotics
Page S14 of S15
Figure 3A identifier Strain name Subsisting on From soil 39 Trim‐S1T‐M1LLLSSL‐2 Trimethoprim S1T 40 Mafe‐S1T‐M1LLLSSL‐1 Mafenide S1T 41 Cycl‐S1T‐M1LLLSSL‐2 D‐Cycloserine S1T 42 Vanc‐S1T‐M1LLLSSL‐1 Vancomycin S1T 43 Levo‐S3F‐M1LLLSSL‐3 Levofloxacin S3F 44 Slfs‐S3F‐M1LLLSSL‐3 Sulfisoxazole S3F 45 Trim‐S3F‐M1LLLSSL‐1 Trimethoprim S3F 46 Mafe‐S3F‐M1LLLSSL‐3 Mafenide S3F 47 Slfm‐S3F‐M1LLLSSL‐3 Sulfamethizole S3F 48 Vanc‐S3F‐M1LLLSSL‐2 Vancomycin S3F 49 Amik‐S1R‐M1LLLSSL‐3 Amikacin S1R 50 Peni‐S1R‐M1LLLSSL‐2 Penicillin G S1R 51 Mafe‐S1R‐M1LLLSSL‐2 Mafenide S1R 52 Vanc‐S1R‐M1LLLSSL‐2 Vancomycin S1R 53 Trim‐S1N‐M1LLLSSL‐1 Trimethoprim S1N 54 Vanc‐S1N‐M1LLLSSL‐1 Vancomycin S1N 55 Kana‐S1A‐M1LLLSSL‐2 Kanamycin S1A 56 Carb‐S1A‐M1LLLSSL‐2 Carbenicillin S1A 57 Slfs‐S1A‐M1LLLSSL‐1 Sulfisoxazole S1A 58 Vanc‐S1A‐M1LLLSSL‐2 Vancomycin S1A 59 Kana‐S2R‐M1LLLSSL‐2 Kanamycin S2R 60 Amik‐S2R‐M1LLLSSL‐3 Amikacin S2R 61 Peni‐S2R‐M1LLLSSL‐2 Penicillin G S2R 62 Dicl‐S2R‐M1LLLSSL‐1 Dicloxacillin S2R 63 Mafe‐S2R‐M1LLLSSL‐2 Mafenide S2R 64 Slfm‐S2R‐M1LLLSSL‐1 Sulfamethizole S2R 65 Cipr‐S1G‐M1LLLSSL‐1 Ciprofloxacin S1G 66 Levo‐S1G‐M1LLLSSL‐1 Levofloxacin S1G 67 Gent‐S1G‐M1LLLSSL‐3 Gentamycin S1G 68 Kana‐S1G‐M1LLLSSL‐1 Kanamycin S1G 69 Peni‐S1G‐M1LLLSSL‐1 Penicillin G S1G 70 Carb‐S1G‐M1LLLSSL‐3 Carbenicillin S1G 71 Chlo‐S1G‐M1LLLSSL‐3 Chloramphenicol S1G 72 Nali‐S1G‐M1LLLSSL‐2 Nalidixic acid S1G 73 Thia‐S1G‐M1LLLSSL‐1 Thiamphenicol S1G 74 Slfs‐S1G‐M1LLLSSL‐3 Sulfisoxazole S1G 75 Mafe‐S1G‐M1LLLSSL‐2 Mafenide S1G
Page 16
Dantas and Sommer, et. al Supporting Materials Bacteria subsisting on antibiotics
Page S15 of S15
Supporting References:
1. T. Z. DeSantis et al., Nucleic Acids Res 34, W394 (Jul, 2006). 2. T. Z. DeSantis et al., Applied and Environmental Microbiology 72, 5069 (Jul, 2006). 3. J. R. Cole et al., Nucleic Acids Res 35, D169 (Jan, 2007). 4. D. L. Wheeler et al., Nucleic Acids Res 28, 10 (Jan 1, 2000). 5. W. Ludwig et al., Nucleic Acids Res 32, 1363 (Feb, 2004).