Page 1
www.sciencemag.org/cgi/content/full/science.1210125/DC1
Supporting Online Material for
Entorhinal Cortex Layer III Input to the Hippocampus Is Crucial for Temporal Association Memory
Junghyup Suh, Alexander J. Rivest, Toshiaki Nakashiba, Takashi Tominaga, Susumu Tonegawa*
*To whom correspondence should be addressed. E-mail: [email protected]
Published 3 November 2011 on Science Express
DOI: 10.1126/science.1210125
This PDF file includes:
Materials and Methods SOM Text Figs. S1 to S18 References
Page 2
1
SUPPORTING ON-LINE MATERIAL
1. Materials and Methods
Generation of Oxr-1- Cre Mouse
Previous DNA microchip analyses (S1-S2) provided a list of candidate genes with tentative specific
expression in the EC superficial layers. To determine the accurate expression profiles of those 37 genes,
in situ hybridization was employed. Riboprobes of each gene were generated from PCR products cloned
from a mouse brain cDNA library. We found that oxr1 (oxidation resistance 1) displayed strong and
specific expression in superficial layers (layer II and III) of the EC. In addition, oxr1 transcripts
colocalized with CaMKII (α calcium/calmodulin-dependent protein kinase II) transcripts, but not with
GAD (glutamic acid decarboxylase), suggesting expression only in excitatory neurons. To generate a
transgenic line that expresses Cre recombinase under the control of the promoter of the oxr1 gene, we
obtained a bacterial artificial chromosome (BAC) construct containing the putative promoter (~80 kb, 5‟
upstream), entire exons of oxr1, and the 3‟ downstream region (~50 kb) (BACPAC Resource Center) and
then employed BAC recombination engineering (S3) to insert Cre recombinase into the translation
initiation site in exon 2. The final construct was purified and injected to the pronuclei of fertilized eggs
from C57BL/b mice to generate transgenic offspring. Twenty six founders were backcrossed with
wildtype mice and characterized based on the X-gal staining distribution in brains of offspring after
crossing each line with a reporter line, Rosa26. We identified one transgenic line (pOxr1-Cre), in which
the level of the Cre-loxP recombination was robust in superficial layer III of the MEC.
Histology and Immunohistochemistry
X-gal staining for Fig 1B and 1C, and double immunofluorescent staining for Figures 1D and 1E were
carried out as previously described (S4). Thionin staining was performed following the manufacturer‟s
instruction. Brain sections were incubated with rabbit antigal (1:2000) (Fig. 1, S3 and S4),
antiNeuN (1:200) (Figs. 1D, S3 and S4), anti-PGP9.5 (1:200) (Fig. S3), antiparvalbumin (1:500) (Figs.
1E and S3), anti-GAD67 (1:2000) (Fig. S3), anti-VGluT1 (1:200) (Fig. S9), anti-GluR1 (1:40) (Fig. S9),
and anti-c-Fos (1:5000) (Fig. S10), and subsequently incubated with AlexaFluor488 or AlexaFluor555
conjugated secondary antibodies.
Retrograde Tracing
We injected 5-10 nl of AlexaFluor488-conjugated CTB into different areas of the HP along the
semptotemporal axis. After 5-7 day survival periods, the animals were sacrificed and brain sections were
processed for immunohistochemistry.
Page 3
2
Control of TeTX expression by a triple transgenic strategy
We previously developed a TeTX triple transgenic mouse method that allows for inducible and reversible
silencing of synaptic transmission of specific neuronal populations (S5). As shown in Fig. 2A, in
transgenic mouse 1 (Tg1), Cre recombinase expression is driven by a cell-type specific transcriptional
promoter (pOxr1). In transgenic mouse 2 (Tg2), expression of the tetracycline transactiviator (tTA)
depends on Cre-loxP recombination as well as a second transcriptional promoter (CaMKII) specific for
mature excitatory neurons in the forebrain (S6). In the progeny of the cross between two transgenic mice,
due to the excision of the „STOP‟ sequence by a Cre/loxP recombination, tTA expression will occur only
in the tissue or cell type in which both promoters are active. In transgenic mouse 3 (Tg3), the expression
of TeTX is under the control of the tetracycline operator (tetO) and hence in the progeny of crosses
among the three transgenic mice, TeTX will be expressed only in those cells in which the tTA is
expressed. The TeTX specifically cleaves VAMP-2 (S7-8), an obligatory component of the SNARE
complex (S9) that is required for exocytosis of neurotransmitter release at presynaptic terminals (S10).
The expression of TeTX can be blocked by a dietary supplement of doxycycline (Dox) which prevents
tTA from binding to the tetO (S11). Thus, when a mother carrying triple transgenic pups is maintained on
Dox diet (10 mg/kg, Bio-serve) during the pregnancy and the subsequent fostering period and the weaned
mice are kept on the same diet (10 mg/kg, Bio-server) until they grow to adulthood (10-12 weeks of age),
TeTX expression will be repressed in these mice and hence the synaptic transmission will remain normal
throughout the entire period. When their diet is switched to one free of Dox, TeTX will be expressed only
in those cells in which tTA is synthesized and consequently, synaptic transmission will be inhibited only
at those synapses to which the tTA-positive cells provide presynaptic terminals. A subsequent switch
back to Dox diet restores synaptic transmission.
Mouse Breeding
To generate the triple transgenic MECIII-TeTX mice, we followed the breeding scheme previously
described (S5) with a minor modification. Since homozygous double transgenic mice (pOxr1-Cre/pOxr1-
Cre, tetO-TeTX/tetO-TeTX) displayed poor fertility and poor nurturing, we bred either
heterozygous/homozygous (pOxr1-Cre/+, tetO-TeTX/tetO-TeTX) or homozygous/heterozygous (pOxr1-
Cre/pOxr1-Cre, tetO-TeTX/+) double transgenic males with heterozygous (pCaMKII-loxP-STOP-loxP-
tTA/+) females. The progeny with heterozygous triple transgenic mice (pOxr1-Cre/+, tetO-TeTX/+,
pCaMKII-loxP-STOP-loxP-tTA/+) were referred to as the MECIII-TeTX mice and the progeny with
heterozygous double transgenic (pOxr1-Cre/+, tetO-TeTX/+, +/+) served as controls. The CA3-TeTX
Page 4
3
mice were generated and bred as described (S5). All procedures relating to animal care and treatment
conformed to the Institutional and NIH guidelines.
Doxycycline (Dox) Treatment
All physiological and behavioral experiments were conducted with 14-20 week-old male mice that had
been on Dox diet (10 mg/kg) from pregnancy to adulthood. In most experiments, the Dox withdrawal was
for 4 weeks prior to the experiments. For Dox re-administration experiments, Dox (40 mg/kg) was given
to the animals for 4 weeks prior to the experiments. The efficiency of the Dox treatment regimens for the
inhibition and restoration of the ECIII-CA1 synaptic transmission was demonstrated by the VSD imaging
method (Fig. 2).
Fluorescent Voltage-Sensitive Dye (VSD) Imaging
Imaging was carried out as previously described (S12). Hippocampal slices (350 µm thick) were prepared
from 14-20 week-old male mice and maintained in an interface chamber filled with humidified carbogen
mixture (95%/5% O2/CO2 gas) and artificial cerebrospinal fluid (aCSF) (124 mM NaCl, 2.5 mM KCl, 2
mM CaCl2, 2 mM MgSO4, 1.25 mM NaH2PO4, 26 mM NaHCO3, and 10 mM glucose, pH 7.4). Knife
cuts were made to remove the CA3 and DG circuits from the hippocampus. Each slice was placed on a
fine-mesh membrane filter and held in place by a thin Plexiglas ring (inner diameter, 11 mm; outer
diameter, 15 mm; thickness 1–2 mm). The temperature was held at 32˚C for 1 hr, and then maintained at
room temperature thereafter. After 1 hr incubation, each slice was stained for 25 min with 100 µl of the
VSD solution, containing 0.2 mM Di- 4-ANEPPS in 2.5% ethanol, 0.13% Cremaphor EL, 1.17% distilled
water, 48.1% fetal bovine serum and 48.1% aCSF. The slices were subjected to experiments after at least
1 hr incubation at room temperature after the washout of VSD with aCSF. Stimulation (bi-polar pulse,
400 µsec total) was alternately applied at a 0.05 Hz at fixed intensity through a stimulation electrode
placed in the middle of SR and a stimulation electrode place in the middle of SLM. The two stimulation
electrodes were separated by 400 µm along the CA3-subiculum axis. The Plexiglas ring supporting each
slice was placed in an immersion-type recording chamber and continuously perfused with pre-warmed
(31°C) and oxygenated aCSF (1 ml/min). Optical signals were recorded using MiCAM Ultima imaging
system with an THT-01 epifluorescence optics with an excitation light source (150 W halogen lamp) with
an excitation filter ( = 530 ± 10 nm) and an emission filter ( > 590 nm). The spatial resolution was
approximately 22 µm x 22 µm at the objective plane (100 pixels x 100 pixels resolution) and the temporal
resolution was 0.1 ms/frame. The intensity of fluorescence emitted by the slice prior to stimulation (a
pre-stimulation period usually lasted from 10 frames to 200 frames) was averaged and used as the
reference intensity (F0). The fractional change in fluorescence [∆F(t)=F(t)-F0] was normalized by the F0
Page 5
4
(∆F/F0), and this value was used as the optical signal. Optical signals referred to in this study represented
signals filtered in spatial and temporal dimensions with a digital Gaussian kernel of 5 x 5 x 3 (horizontal x
vertical x temporal; = 1). We analyzed only image frames covering 9 msec duration that included the
maximum peak of each optical signal, but excluded the stimulus artifact (Fig. S5). The intensity of the
optical signals was measured at the middle of SR (200 m from soma). Optical signals were analyzed
offline using a set of customized scripts. All the experiments were performed by experimenters who were
blind to the genotypes of the mice used and their Dox treatments.
TUNEL assay
The in situ cell death detection kit (Roche, TMR red) was used following the manufacturer‟s instruction.
Sixteen week-old control and mutant mice off-Dox for 4 weeks were sacrificed prior to TUNEL assay.
As a positive control for DNA fragmentation, sections were treated with 2 units/ml DNase I for 10
minutes prior to TUNEL staining.
Seizure induction
Sixteen week-old C57Bl/6 mice were injected with 20 mg/kg kainic acid. Ninety minutes after evidence
of Class 5 seizure (rearing and falling) (S13), animal was sacrificed and perfused with 4% PFA. Brain
sections in 50 um thickness were incubated with anti-c-Fos antibody.
In vivo electrophysiology
Multi-electrode recording was conducted to detect ensemble activity in dorsal CA1 cells in male mice
between 14 and 22 weeks of age, with the method described previously (S5). All experiments were
conducted by researchers blind to the genotype of the individual animals.
Morris Water Maze (MWM)
MWM task for spatial reference memory was conducted with male mice between 14 and 22 weeks of age,
with the method described previously (S5). Behavioral experiments with this and all other paradigms
were conducted by researchers blind to the genotypes of individual mice and their Dox treatments.
Delayed Matching-to-Place (DMP) Watermaze
DMP watermaze task was conducted with male mice between 14 and 22 weeks of age. The task protocol
used was similar to that previously reported (S14) with minor modifications in inter-trial interval and
platform size as shown in Fig. 3A.
Page 6
5
Delayed Non-Matching-to-Place (DNMP) T-Maze
Both control and mutant male mice, between 14 and 22 weeks of age, that were off-Dox for at least 4
weeks and were food deprived until they reached 85% body weight. On the first two days of food
depravation, mice were fed only the sugar-pellet rewards that they would get in the task (20 mg), and
were fed a 50/50 mix of those pellets and dry food until habituation started. Mice were habituated to the
T-Maze over two days. Cage mate mice were all placed into the T-Maze apparatus for 4 sessions of three
minutes each for both days. Sugar pellet rewards were placed in the reward cup at the end of each arm,
and were replaced over the three-minute session as they were consumed. Once experiments began, mice
were given ten trials per day. Each trial consisted of two runs, the Sample run that was followed by the
Choice run. In the Sample run, mice were placed in the stem of the T-maze and allowed to run to the end
of one arm of the maze. The reward was placed at the end of one arm, while the other arm was closed off
to force the mouse to run one way. Over the ten trials, the Sample arm was pseudo-randomly assigned
Left or Right to avoid biases, based on and adapted from a previous report (S15). If the mouse did not run
after 120 s, it was gently pushed to initiate movement. Once a mouse reached the end of the Sample arm,
it was allowed to consume the reward, and was then gently picked up and placed back in the start box.
The mouse was trapped in the start arm while the maze was quickly wiped with 10% EtOH. The delay
between Sample run and Choice run was around 15 s. The previously blocked door was opened so that
both arms of the T were opened, and the mouse was released from the start box by raising the door. The
mouse was allowed to choose which arm to visit next. The opposite arm from the Sample arm was
rewarded, while the arm previously visited was not. If the animal chose the previous arm, it was blocked
in that arm for a 20 s punishment and was then placed back in its home cage until the next trial. If the
mouse chose the opposite arm that was rewarded, it was given time to consume the pellet and then gently
picked up and placed back in the home cage. A set of 8 mice ran for a trial before the subsequent trial
began. The time interval between trials was between 15-20 min. Mice were scored on the percentage of
time they made a successful alternation, how long it took them to choose an arm on the choice phase from
when the door released them from the start box, on the % of Right/Left choices they made overall, and on
the time between the Sample and Choice run.
Fear Conditioning
Fear conditioning was performed with male mice between 14 and 20 weeks of age in the animal facility
during the light cycle with minor modifications of the method described previously (S16).
Trace Paradigm: On Day 1, mice were placed in Context “A” and allowed to explore for 240 s, at which
point a 20 s tone (75 db, 2000 Hz) played, followed by a 20 s trace, and then a 2 s, 0.75 mA foot-shock.
Page 7
6
This repeated two more times, starting at 402 s and 564 s. Mice remained in the conditioning chamber for
a total of 706 s. On Day 2 (24 hr later), mice were placed in Context “B” and allowed to explore for
240 s, at which point the same tone as from day 1 played for 60 s, followed by 180 s of no-tone (post-tone
period). This repeated two more times and mice were then removed after 960 s in the chamber. For Figs.
4C and 4D, tone testing was performed 4 weeks after conditioning.
Delay Paradigm: Conditioning protocol was similar to the Trace paradigm, but tone was co-terminated
with shock.
40 s Trace Paradigm: Conditioning protocol was similar to the 20 s Trace paradigm, except that the
temporal gap between the tone and footshock was 40 s.
Contextual Fear Paradigm: Three .75 mA shocks were administered without any tone presentation at 240
s, 380 s and 520 s into the 706 s session.
Pharmacology
Mice were anesthetized by injecting Avertin and secured in stereotaxic instruments. The scalp was
retracted and small burr holes (3 for bone screws and 2 for cannula) were drilled. A guide cannula (26
gauge) was lowered through each hole to the following coordinates: anteroposterior, -4.5 mm;
mediolateral, ±3.1 mm; dorsoventral, -3.7 mm relative to bregma, at an angle of 12 degree in the anterior-
to-posterior direction in the sagittal plane. Dental cement was applied to secure the cannulae in place.
Animals recovered for at least 7 days before conditioning. Thirty to 60 min before conditioning, animals
were briefly anesthetized with Isoflurane and infused with either vehicle (5% DMSO in PBS) or a mixture
of scopolamine hydrobromide (10 mg/ml) and LY367385 (100 mM) in 5% DMSO /PBS bilaterally
through adapter cannulae (33 gauge) and vinyl tubing. The tubing was sealed hydrostatically with
mineral oil and attached to 5 ul Hamilton syringe. Infusion was performed at 20 nl per sec by a
micropump and cannulae were kept for at least 5 min after the infusion was completed.
Statistical Analysis
Results are given as Mean ± S.E.M. Where appropriate, statistical analyses were performed with 2-way
analysis of variance (ANOVA) test with repeated measures. The 2-Way ANOVA with repeated measures
was used for the data represented in Figs. 3B, 3C, with Bonferroni post-tests for comparisons of replicate
means of each genotype. The 2-Way ANOVA with repeated measures was used for Figs. 3E, S11D, and
S12B and S13A, S16B-C, S17, S18A-B. A 2-Way ANOVA was used for Figs. 2D-F, and S6 with
Bonferroni post tests for comparisons of replicate means of each genotype, and for S14. The unpaired t-
test was used for the data presented in Figs. 3F, S11A-C and E, S12C-D, S13B-D and S15. The Mann-
Whitney U test was used for the statistical analysis of the tone and tone+post-tone periods represented in
Page 8
7
Figs. 4A-F, S16D, and S18D. This test was used since three bouts of tone or tone+post-tone were
averaged from single animals, thus individual mice contributed more than one data point. Because of this,
the data are not independent. The null hypothesis was rejected at P < 0.05 level. Further explanation of
the statistics is discussed in “Statistics and Sample Sizes.”
Page 9
8
2. Supporting Results and Discussions
The MECIII-TeTX mutant mice were normal in the acquisition, consolidation and recall of spatial
reference memory. Prior to testing the hypothesis that the direct EC input to the HP is important for
temporal association memory, we examined whether the mutants are normal for spatial memory both at
the behavioral and electrophysiological (i.e., place cell) levels. These experiments are relevant because
previous studies with less specific lesion methods showed that the direct ECIII input to the HP plays
crucial roles in long-term spatial memory consolidation (S17) as well as for the tuning of CA1 place cells
(S18). On the spatial reference memory version of the Morris water maze task (Fig. S12), the mutants
learned the location of the hidden platform with the same escape latency kinetics as the controls and did
not exhibit any discernable deficits in probe trials conducted during the training (i.e., day 6), immediately
after the 11-day training (day 11) or four weeks after the completion of the training (day 39) (Fig. S12).
Furthermore, no deficit was observed in the mutant mice when they were subjected to the reversal task of
the water maze (Fig. S13).
Consistent with the normal spatial learning and memory, the basic properties of the mutants‟ place cells
and interneurons of dorsal CA1, namely field sizes, mean firing rates and spatial information, were
normal in both the novel (day 1) and familiar (days 2 and 3) linear tracks (Fig. S14).
Numerous previous studies carried out with the EC lesions have failed to produce consistent results
regarding the role of this brain region in spatial memory (S19-S24). Nevertheless, one study in which the
lesion was targeted to all layers of the dorsolateral band of the EC concluded that this part of the EC is
required for recall but not for encoding of the spatial reference memory (S25). Another study with
attempted lesions of the EC projection (temporoammonic) to CA1 concluded that the direct EC input is
required for consolidation of the spatial memory but not for its acquisition (S17). The present study with
mouse mutants with a blockade of a much more spatially restricted EC layer III projection agreed with
these previous studies about its dispensability for spatial memory acquisition (Fig. S12), but did not
support the claims of an involvement of the EC input via the temporoammonic projection in recall or
consolidation of long-term spatial memory (Fig. S12). It is possible that the contradiction can be
attributable to an incomplete blockade of the direct EC input in our mutant mice (Fig. 2D, F). However,
this possibility is unlikely because the proportional reduction of the post-synaptic response in our study
(78.4-95.9%) is higher than the proportion (38.8%) of the area lesioned within the EC in a previous study
(S25). It is also unlikely that the discrepancy arose from the intact ventral EC-HP connection in our
mutants because this connection is known to be involved in non-spatial rather than spatial information
Page 10
9
processing (S26). Thus, the parsimonious explanation of the discrepancy is that in earlier studies the
brain area lesioned was too broad. In fact, in these studies, the ablation extended to areas adjacent to the
dorsal and intermediate part of the MEC layer III and its projections (S17, S25).
In addition to behavioral discrepancies, it is of interest to note that a previous electrophysiology study
with purported lesions to the MEC layer III showed a deficit in spatial tuning of CA1 place cells. Given
that the extent of the lesions was relatively incomplete (unilateral, and intermediate and ventral portion of
the MEC) as compared to our mutants, there could be other explanations for their results. For example,
the authors reported collateral damage in other brain areas such as LEC, MEC layers II and V, ventral
claustrum, and posterior piriform cortex. The chemically induced seizure can cause changes in
electrophysiological properties in a cell and network level. Therefore, the discrepancy observed
regarding the basic properties of CA1 place cells could also be explained by the difference in the extent of
the lesions and manipulation methods (S18).
Page 11
10
3. Supporting Figures
Fig. S1.
A
B
1 2
1’ 2’
CA1
CA3
DG
CA1
CA3
DG
Mouse 1
Mouse 2
Dorsal Ventral
Page 12
11
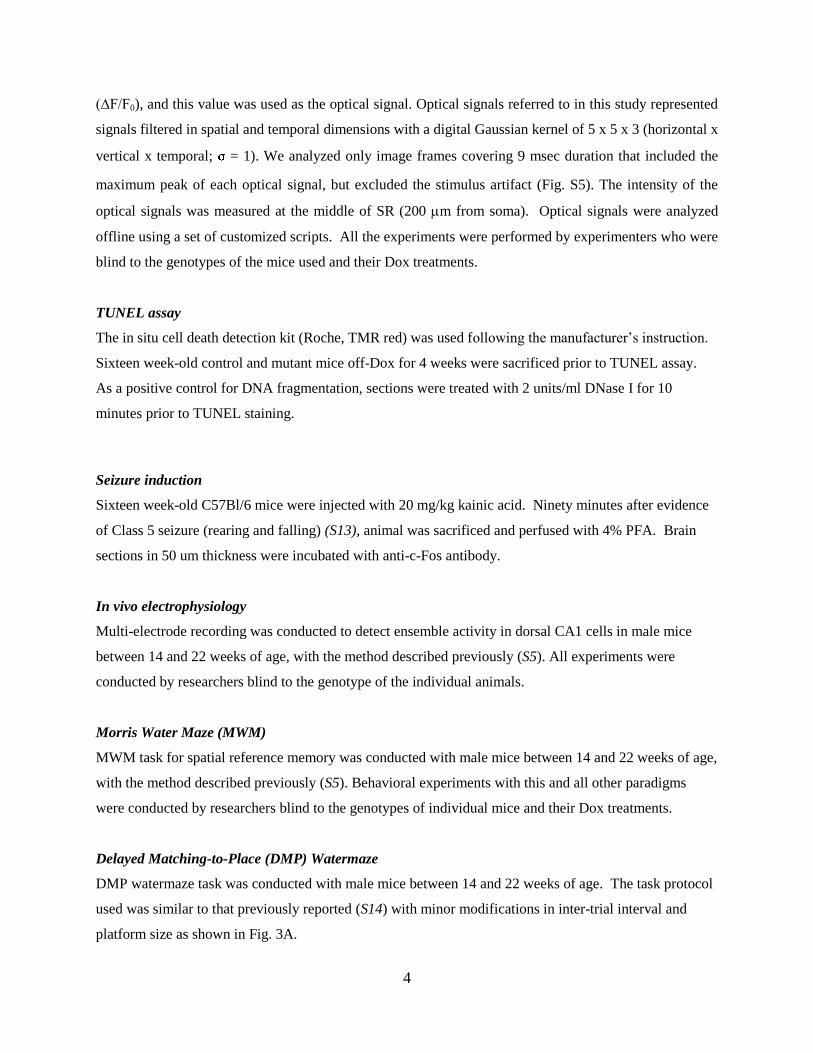
Fig. S1. The Cre/loxP recombination is confined to the entorhinal cortex in pOxr1-Cre mouse line.
(A) Horizontal sections from two brains of 12-week-old pOxr1-Cre/Rosa26 double transgenic mice
stained with X-gal and nuclear fast red. Sections are shown at five levels between the dorsal and ventral
poles of the entorhinal cortex. (B) High magnificaiton images of boxes areas in (B). Blue staining in the
hippocampus represents the terminal projections and axons of the MEC neurons and the staining in layer I
of the MEC represents the apical dendritic branches of the MEC neurons. A few scattered stained cells
were also detected in the subiculum. Arrow heads indicate the rhinal fissure. The recombination patterns
were consistent among the mice.
Page 13
12
Fig. S2.
A B
1
2
3
4
5
1’
2’
3’
4’
5’
MEC
MEC
MEC
MEC
LEC
Dorsal
Ventral
X-gal / NFR Thionin
MEC
LEC
MEC
MEC
MEC
Page 14
13
Fig. S2. The Cre/loxP recombination is confined to medial and not lateral, and mostly dorsal and
not ventral entorhinal cortex in pOxr1-Cre mouse line. (A) Horizontal sections from brains of 12-
week-old pOxr1-Cre/Rosa26 double transgenic mouse (mouse 1 in Fig. S1) stained with X-gal and
nuclear fast red (NFR). Sections are shown at five levels between the dorsal and ventral poles of the
entorhinal cortex. (B) Sections adjacent to sections used for X-gal staining in (A) were stained with
thionin solution to visualize cell bodies. In coherence with the criteria previously used for determining
the medial EC (MEC) and lateral EC (LEC) borders (S27), the thionin staining revealed a relatively cell-
free zone between layers II and III in LEC (Section 4‟), but absence of this zone in MEC. Arrow heads
indicate boundaries for MEC and LEC in each section.
Page 15
14
Fig. S3.
-gal
A
B
C
-gal NeuN
NeuN
III II
-gal
Parv
III II
-gal
GAD67
Horizontal sections
Sagittal sections
D
G
E
F
H
PGP9.5 -gal
PGP9.5
-gal
Sagittal sections
Sagittal sections
Page 16
15
Fig. S3. The Cre/loxP recombination is confined to excitatory, and not inhibitory neurons in pOxr1-
Cre mouse line. (A-C) Horizontal sections from brains of 12-week-old pOxr1-Cre/Rosa26 double
transgenic mouse were double-immunostained with antibodies against NeuN (AlexaFluor488, green) and
-gal (AlexaFluor555, red). Although immunoreactivity of NeuN was weaker in the layer III, fluorescent
signals were still visible and countable. (D-F) Sagittal sections from brains of 12-week-old pOxr1-
Cre/Rosa26 double transgenic mouse were double-immunostained with antibodies against PGP9.5 (a
neuronal marker, AlexaFluor488, green) and -gal (AlexaFluor555, red). -gal is co-localized with
PGP9.5, confirming that the recombination is confined to neurons. (G and H) Sagittal sections from
brains of 12-week-old pOxr1-Cre/Rosa26 double transgenic mouse were double-immunostained with
antibodies against parvalbumin (AlexaFluor488, green) and -gal (AlexaFluor555, red). Arrow heads
indicate interneurons. The cell bodies expressing -gal were not immunostained by interneuronal makers,
GAD67 and parvalbumin.
Page 17
16
Fig. S4.
Section EC
Layer Cell Dorsal Intermediate Ventral
A
II
-gal + 3.00 ± 0.17 3.67 ± 0.25 1.00 ± 0.29
NeuN + 64.33 ± 0.76 68.67 ± 1.76 65.00 ± 3.98
% (-gal+ / NeuN+) 4.61 ± 0.21 5.34 ± 0.34 2.56 ± 0.74
III
-gal + 86.67 ± 1.71 74.00 ± 4.81 17.33 ± 1.11
NeuN + 118.67 ± 1.35 101.33 ± 3.77 127.00 ± 4.23
% (-gal+ / NeuN+) 71.62 ± 1.69 71.24 ± 2.73 13.68 ± 0.70
B
II
-gal + 3.67 ± 0.19 3.33 ± 0.25 3.00 ± 1.67
NeuN + 64.33 ± 0.96 67.33 ± 1.18 70.33 ± 0.91
% (-gal+ / NeuN+) 5.62 ± 0.20 4.83 ± 0.29 4.25 ± 0.22
III
-gal + 113.67 ± 6.08 120.67 ± 4.02 24.00 ± 1.04
NeuN + 132.33 ± 5.92 138.00 ± 2.93 110.00 ± 2.25
% (-gal+ / NeuN+) 85.23 ± 0.85 87.13 ± 1.83 21.60 ± 0.52
Medial Lateral
Dorsal
Ventral
A B C D
Page 18
17
C
II
-gal + 2.00 ± 0.67 1.67 ± 0.25 0.33 ± 0.10
NeuN + 60.00 ± 0.44 61.33 ± 1.71 68.33 ± 1.25
% (-gal+ / NeuN+) 3.30 ± 0.26 2.51 ± 0.39 0.49 ± 0.14
III
-gal + 75.00 ± 1.92 95.67 ± 3.94 14.67 ± 0.34
NeuN + 105.00 ± 2.08 123.67 ± 3.18 131.00 ± 3.48
% (-gal+ / NeuN+) 72.55 ± 2.94 76.55 ± 1.31 11.21 ± 0.05
D
II
-gal + 3.00 ± 0.17 3.67 ± 0.54 2.67 ± 0.63
NeuN + 61.67 ± 2.58 60.33 ± 1.44 76.33 ± 1.57
% (-gal+ / NeuN+) 4.85 ± 0.15 5.68 ± 0.84 3.84 ± 0.91
III
-gal + 89.33 ± 3.40 76.33 ± 4.29 13.3 ± 0.63
NeuN + 107.00 ± 2.78 98.33 ± 3.04 122.67 ± 5.17
% (-gal+ / NeuN+) 82.94 ± 1.51 76.61 ± 2.22 10.92 ± 0.40
Fig. S4. Distribution and quantification of the Cre/loxP recombination pattern within the
superficial layer of entorhinal cortex in pOxr1-Cre mouse line. (A-D) Representative low
magnification (5x) images of four sagittal sections (50 um thickness, 300 um apart, A-D) along with the
medial-lateral axis showing the location of areas (white boxes, 300 um x 300 um) with the dorsal-ventral
axis (d, dorsal; i, intermediate; v, ventral) used for quantification of NeuN+, and b-gal+ cells. Twenty
four sections were selected from brains of three mice (8 sections per each mouse) from pOxr1-
Cre/Rosa26 crosses. A 20x objective was placed at the dorsal tip of the MEC to scan an entire boxed area
first and then was moved 350-400 um ventrally to scan the second and third boxed areas along with the
dorsoventral axis. Images were given to an experimenter who was blind to the selection process of
sections, locations of scanned areas, and the nature of staining. Only cells with the clear boundary of the
soma were manually counted by using ImageJ. The proportion of -gal positive cells varied from 71.62-
87.13 % in the dorsal and intermediate part of the MECIII, while it varied from 10.92-21.60% in ventral
part of the MECIII. In the MECII, the proportion of -gal positive cells varied from 0.49-5.68%. These
data indicated that the recombination is primarily restricted to the dorsal and intermediate parts of the
medial entorhinal cortex layer III.
Page 19
18
Fig. S5.
100908070 (msec)
4 x 10⁻³ a b c
c
b
a
A
B
69.0 ms 70.4 ms 70.8 ms 71.2 ms68.6 ms 71.6 ms 72.0 ms 72.8 ms72.4 ms
73.6 ms73.2 ms 74.0 ms 74.8 ms74.4 ms 75.2 ms 75.6 ms 76.0 ms 76.4 ms
76.8 ms 77.2 ms 78.0 ms77.6 ms 78.4 ms 78.8 ms 79.2 ms 79.6 ms 80.0 ms
69.0 ms 70.4 ms 70.8 ms 71.2 ms68.6 ms 71.6 ms 72.0 ms 72.8 ms72.4 ms
73.6 ms73.2 ms 74.0 ms 74.8 ms74.4 ms 75.2 ms 75.6 ms 76.0 ms 76.4 ms
76.8 ms 77.2 ms 78.0 ms77.6 ms 78.4 ms 78.8 ms 79.2 ms 79.6 ms 80.0 ms
C
D
100908070 (msec)
4 x 10⁻³
c
b
a
abc
Time window
for measurement
Time window
for measurement
SR
stim
ula
tio
nS
LM
stim
ula
tio
n
stim
(at 68.6 ms)
stim
(at 68.6 ms)
Page 20
19
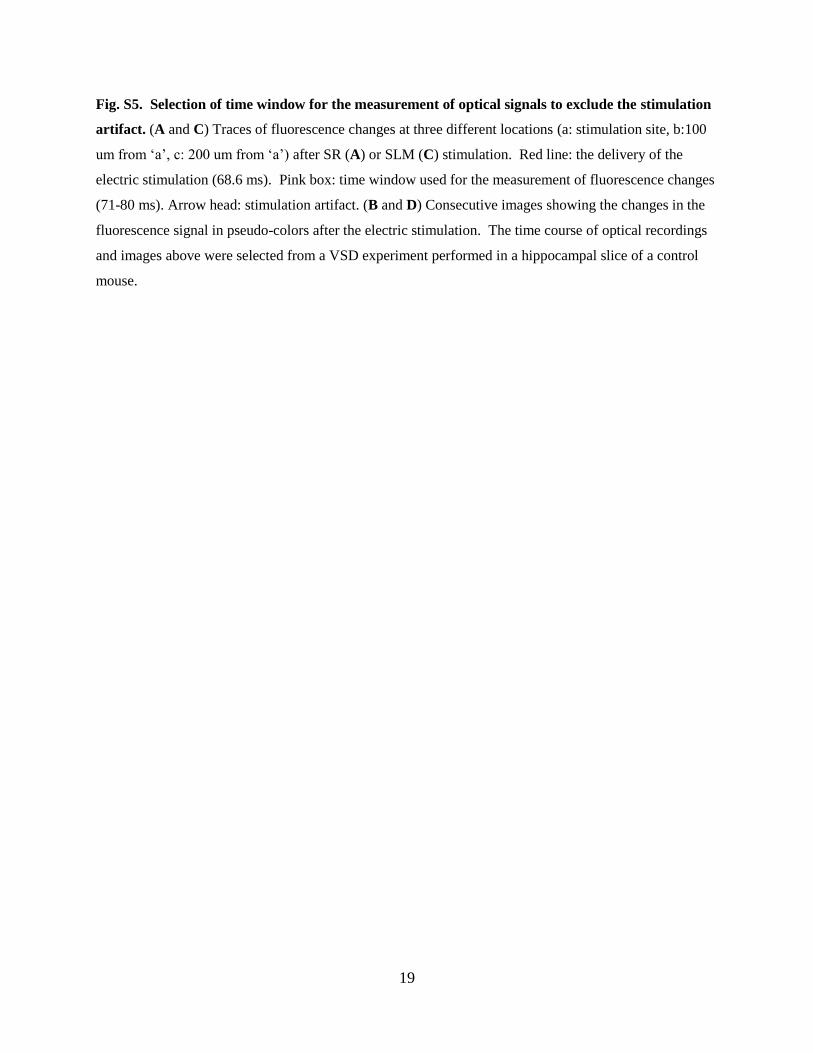
Fig. S5. Selection of time window for the measurement of optical signals to exclude the stimulation
artifact. (A and C) Traces of fluorescence changes at three different locations (a: stimulation site, b:100
um from „a‟, c: 200 um from „a‟) after SR (A) or SLM (C) stimulation. Red line: the delivery of the
electric stimulation (68.6 ms). Pink box: time window used for the measurement of fluorescence changes
(71-80 ms). Arrow head: stimulation artifact. (B and D) Consecutive images showing the changes in the
fluorescence signal in pseudo-colors after the electric stimulation. The time course of optical recordings
and images above were selected from a VSD experiment performed in a hippocampal slice of a control
mouse.
Page 21
20
Fig. S6. Inducible and reversible inhibition of MECIII input to CA1. Data from Figures 2D and 2F
were re-plotted. (A) When the hippocampal slices were prepared from the mice off-Dox for 4 weeks, the
post-synaptic fluorescence was reduced and matched that of the slices from mice off-Dox for 8 weeks (2-
way ANOVA: Week x Stimulation Intensity, F(4, 110) = 2.12, P = 0.0831; Week, F(1, 110) = 0.96, P =
0.3281; Stimulation Intensity, F(4, 110) = 37.55, P < 0.0001). Bonferroni post-tests showed no statistical
differences on any stimulation intensity (50 uA: t = 0.3333, P > 0.05; 100 uA: t = 0.8926, P > 0.05; 150
uA: t = 2.292, P > 0.05; 200 uA: t = 0.4361, P > 0.05; 250 uA: t = 1.758, P > 0.05). (B) With 4 weeks of
Dox withdrawal followed by 4 weeks of Dox re-administration, the post-synaptic fluorescence at the
ECIII-CA1 synapses in the mutants was restored to levels comparable to the controls (2-way ANOVA:
Genotype x Stimulation Intensity, F(4, 110) = 1.19, P = 0.3208; Genotype, F(1, 110) = 5.41, P = 0.0591;
Stimulation Intensity, F(4, 110) = 129.81, P < 0.0001). Bonferroni post-tests showed no statistical
differences on any stimulation intensity (50 uA: t = 0.4744, P > 0.05; 100 uA: t = 0.4099, P > 0.05; 150
uA: t = 0.937, P > 0.05; 200 uA: t = 2.324, P > 0.05; 250 uA: t = 2.086, P > 0.05).
Page 22
21
Fig. S7. Apoptotic cell death was not observed in the entorhinal cortex of the mutant. (A-C)
TUNEL staining in entorhinal cortex of control (A) and mutant (B). DNase treated tissue was used for
positive control (C). (D-F) high magnification images from white boxes in (A-C), respectively. The
apoptotic signals were visualized by TMR (red).
Control Mutant +DNAse
En
torh
ina
lC
ort
ex
A B C
D E F
Page 23
22
Fig. S8. Lack of molecular and cytoarchitectural abnormalities in GABAergic inhibitory neurons in
mutants. (A-D) Immunostaining with anti-GAD67 (A and B) or anti-parvalbumin (C and D) antibody
and AlexaFluor488-conjugate secondary antibody in the hippocampus from sagittal sections of the
controls and mutants. (E-H) High magnifcation images of boxed areas in (A-D). (I-L) Immunostaining
with anti-GAD67 (I and J) or anti-parvalbumin (K and L) and AlexaFluor488-conjugate secondary
antibody in the entorhinal cortex of sagittal sections of controls and mutants. (M-N) High magnification
images of boxed areas in (I-L). Dotted line: lamina dissecans. Scale bar: 500 um.
Page 24
23
Fig. S9. Lack of changes in GluR1 and VGluT1 protein expression in the hippocampus of the
mutant. (A and C) The hippocampus of the control mouse was immunostained with an antibody against
GluR1 or VGluT1 and AlexaFluor555-conjugated secondary antibody. (B and D) The hippocampus of
the mutant mouse was immunostained with an antibody against GluR1 or VGluT1 and AlexaFluor555-
conjugated secondary antibody.
Glu
R1
VG
LU
T1
Control Mutant
A
C
B
D
Page 25
24
Fig. S10. Lack of robust of focally localized c-Fos protein expression in the entorhinal cortex and
hippocampus of the mutant. (A and D) Sagittal sections of brains from the control were
immunostained with c-Fos antibody and AlexaFluor555-conjugated secondary antibody (red). (B and E)
Sagittal sections of brains from the control were immunostained with c-Fos antibody and AlexaFluor555-
conjugated secondary antibody (red). (C and F) Sagittal sections of brains from seizure induced wildtype
mouse were immunostained with c-Fos antibody and AlexaFluor555-conjugated secondary antibody (red).
All sections were counter-stained with DAPI (blue).
En
torh
inal
Co
rtex
Hip
po
ca
mp
us
Control MutantWild Type
Post Seizure
A B C
D E F
Page 26
25
Fig. S11. MECIII-TeTX mutants exhibited no changes in elevated plus maze, rotarod and hot plate
test. (A to C) Performance in the elevated plus maze of mutants (MUT, N = 8) and control littermates
(CTL, N = 8) 4 weeks after Dox withdrawal (age = 14-20 weeks). There was no statistically significant
difference between the two genotypes in the frequency of visits to the open or closed arms (P > 0.05) (A),
in the percentages of time spent in each type of arm (P > 0.05) (B), and in the total distance traveled (P >
0.05) (C). (D) Performance in the rotarod test over three trials with mutants (N = 13) and controls (N =
15) 4 weeks after Dox withdrawal (age = 14-20 weeks). There was not a statistically significant
difference between the two genotypes over the three trials (2-way ANOVA with repeated measures:
Genotype x Time, F(2,52) = 1.91, P = 0.1577; Time F(2,52) = 14.26, P < 0.0001; Genotype, F(1,52) =
0.20, P = 0.6596). (E) Performance in the hot plate test of mutants (N = 13) and controls (N = 15) after 4
weeks of Dox withdrawal (age = 14-20 weeks). There was not a statistically significant difference on
latency to front paw lift (P > 0.05).
Page 27
26
Fig. S12. Normal spatial reference memory acquisition, consolidation, and recall in MECIII-TeTX
mutants. (A) Experimental scheme for a hidden platform version of the Morris water maze and Dox
withdrawal schedule. (B) The average escape latencies to the hidden platform location between the
genotypes (CTL, N = 16; MUT, N = 15; age = 14-20 weeks) were not significantly different (2-way
ANOVA: Genotype x Day, F(10, 250) = 0.93, P= 0.5105; Day, F(10,250) = 26.99, P < 0.0001; Genotype,
F(1,250) = 0.00, P = 0.9819). (C) Target quadrant occupancies were not significantly different between
the two genotypes (P = 0.8268 on Day 6; P = 0.5536 on Day 11; P = 0.5749 on Day 39). Occupancies
between target (TA) and opposite (OP) quadrants in controls were significantly different (P < 0.0001 on
Day 6; P < 0.0001 on Day 11; P < 0.0001 on Day 39). Occupancies between TA and OP quadrants in
mutants were significantly different (P < 0.0001 on Day 6; P < 0.0001 on Day 11; P < 0.0001 on Day 39).
(D) Phantom platform crossings during probes were not significantly different between the two genotypes
(P = 0.9417 on Day 6; P = 0.4882 on Day 11; P = 0.2533 on Day 39). Platform crossings between TA and
Page 28
27
OP quadrants in controls were significantly different (P < 0.0001 on Day 6; P < 0.0001 on Day 11; P <
0.0001 on Day 39). Platform crossings between TA and OP quadrants in mutants were also significantly
different (P < 0.0001 on Day 6; P < 0.0001 on Day 11; P < 0.0001 on Day 39). (E) Averaged search time
in heat maps.
Page 29
28
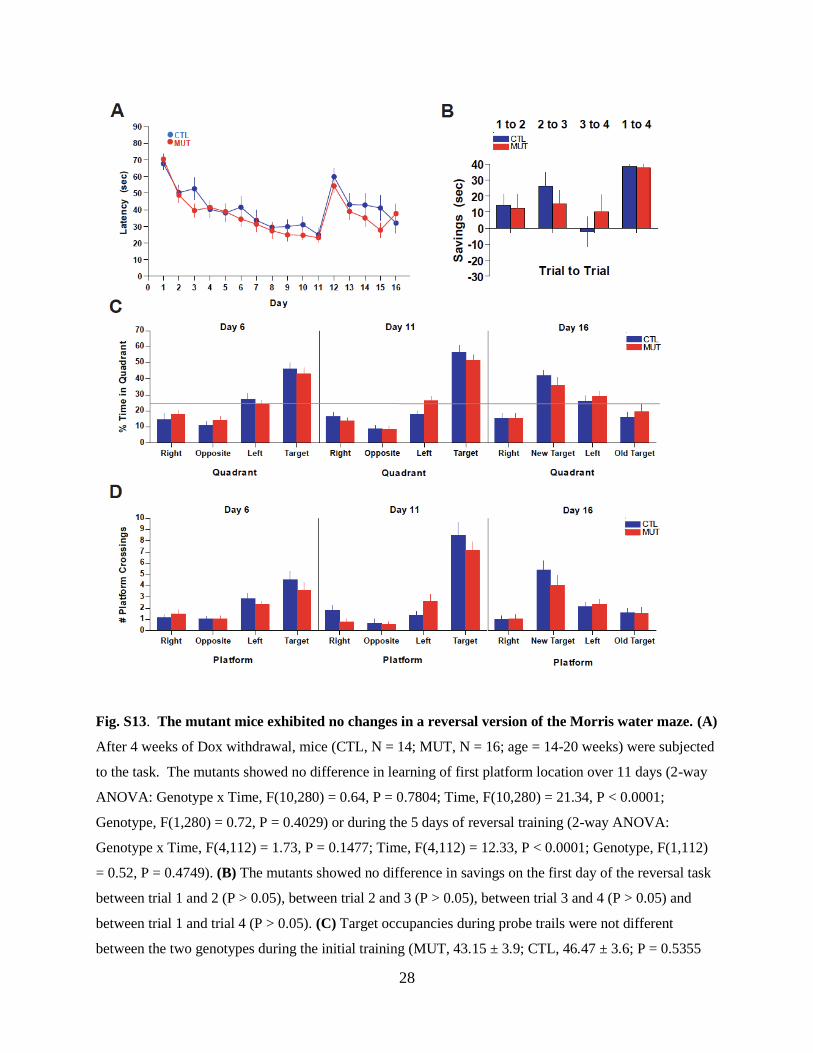
Fig. S13. The mutant mice exhibited no changes in a reversal version of the Morris water maze. (A)
After 4 weeks of Dox withdrawal, mice (CTL, N = 14; MUT, N = 16; age = 14-20 weeks) were subjected
to the task. The mutants showed no difference in learning of first platform location over 11 days (2-way
ANOVA: Genotype x Time, F(10,280) = 0.64, P = 0.7804; Time, F(10,280) = 21.34, P < 0.0001;
Genotype, F(1,280) = 0.72, P = 0.4029) or during the 5 days of reversal training (2-way ANOVA:
Genotype x Time, F(4,112) = 1.73, P = 0.1477; Time, F(4,112) = 12.33, P < 0.0001; Genotype, F(1,112)
= 0.52, P = 0.4749). (B) The mutants showed no difference in savings on the first day of the reversal task
between trial 1 and 2 (P > 0.05), between trial 2 and 3 (P > 0.05), between trial 3 and 4 (P > 0.05) and
between trial 1 and trial 4 (P > 0.05). (C) Target occupancies during probe trails were not different
between the two genotypes during the initial training (MUT, 43.15 ± 3.9; CTL, 46.47 ± 3.6; P = 0.5355
Page 30
29
on Day 6: MUT, 51.29 ± 3.5; CTL, 56.13 ± 4.3; P = 0.3988 on Day 11). Quadrant occupancy after
reversal (Day 16) for the new target was not significantly different between genotypes (MUT, 35.89 ±
4.9; CTL, 41.93 ± 3.5; P = 0.3165). (D) Platform crossings during probes were not significantly different
between the two genotypes (MUT, 3.64 ± 0.71; CTL, 4.56 ± 0.75; P = 0.3851 on Day 6: MUT, 7.14 ±
0.78; CTL 8.5 ± 1.16; P = 0.3541 on Day 11). Platform crossings after reversal (Day 16) for the new
target were not significantly different between genotypes (MUT, 4.07 ± 0.85; CTL, 5.44 ± 0.77; P =
0.2452).
Page 31
30
Fig. S14.
A
B C D
1 2 3
0
20
40
60
Day
Fie
ldS
ize
(%o
fS
am
ple
dS
pa
ce
)
1 2 3
0
1
2
Day
Me
an
Fir
ing
Ra
te(H
z)
1 2 3
0
1
2
Day
Sp
ati
al
Info
rma
tio
n
(bit
s/
sp
ike
)
E
F G
H
CTL
MUT
CTLMUT
CTLMUT
CTLMUT
I
ON Dox
OFF Dox
Surgery10-12 wk
4 wk 3-4 wk
Recording
J
Day 1
Day 2/3
Spatial Information (bits/spike)
0 1 2 3
CTLMUT
1 2 3
0
10
20
30
40
Day
CS
I
1 2 3
80
90
100
110
120
Day
Fie
ldS
ize
(%o
fS
am
ple
dS
pa
ce
)
1 2 3
0
10
20
30
40
50
Day
Me
an
Fir
ing
Ra
te(H
z)
1 2 3
40
50
60
70
80
90
Day
Pe
ak
Fir
ing
Ra
te(H
z)CTL
MUTCTLMUT
CTLMUT
CTLMUT
Pyra
mid
al N
eu
ron
sIn
tern
euro
ns
Page 32
31
Fig. S14. Basic properties of CA1 pyramidal neurons and interneurons were normal in the mutant.
(A) Experimental scheme of in vivo multi-electrode recording and Dox withdrawal schedule. (B)
Examples of place fields of CA1 pyramidal cells of controls (CTL, 4 mice) and mutants (MUT, 4 mice),
aged between 14-22 weeks, on a linear track. Properties of pyramidal neurons (in C-G, Day 1: CTL, N =
46, MUT, N = 41; Day 2: CTL, N = 37, MUT, N = 47; Day 3: CTL, N = 24, MUT, N = 37) and
interneurons (in H-J, Day 1: CTL, N =10, MUT, N = 8; Day 2: CTL, N = 7, MUT, N = 7; Day 3: CTL, N
= 6, MUT, N = 8) were plotted for each day. (C) Size of CA1 place fields, determined by the percentage
of space on the track. No significant changes were observed between genotypes across days (2-way
ANOVA: Genotype x Day, F(2, 226) = 0.37, P = 0.6943; Genotypes, F(1, 226) = 0.01, P = 0.9404; Day,
F(2, 226) = 0.7992, P = 0.7992). (D) Mean firing rate of place cells. No significant changes were
observed between genotypes across days. No significant changes were observed between genotypes
across days (2-way ANOVA: Genotype x Day, F(2, 226) = 0.33, P = 0.7176; Genotypes, F(1, 226) = 0.01,
P = 0.9863; Day, F(2, 226) = 0.7992, P = 0.8886). (E) Averaged spatial information. No significant
changes were observed between genotypes across days (2-way ANOVA: Genotype x Day, F(2, 226) =
0.07, P = 0.9311; Genotypes, F(1, 226) = 2.18, P = 0.1413; Day, F(2, 226) = 0.89, P = 0.4119). (F)
Spatial information for individual cells for day 1 and day2/3. (G) Complex spike index (CSI). No
significant changes were observed between genotypes across days (2-way ANOVA: Genotype x Day, F(2,
226) = 1.26, P = 0.2863; Genotypes, F(1, 226) = 2.18, P = 0.9902; Day, F(2, 226) = 1.25, P = 0.2877).
(H) Field size of interneurons, determined by the percentage of space on the track. No significant
changes were observed between genotypes across days (2-way ANOVA: Genotype x Day, F(2, 40) =
0.63, P = 0.5376; Genotypes, F(1, 40) = 0.39, P = 0.5340; Day, F(2, 40) = 0.54, P = 0.5851). (I) Mean
firing rate of interneurons. No significant changes were observed between genotypes across days (2-way
ANOVA: Genotype x Day, F(2, 40) = 0.25, P = 0.7793; Genotypes, F(1, 40) = 1.29, P = 0.2621; Day, F(2,
40) = 0.18, P = 0.8346). (J) Peak firing rate of interneurons. No significant changes were observed
between genotypes across days (2-way ANOVA: Genotype x Day, F(2, 40) = 0.07, P = 0.9281;
Genotypes, F(1, 40) = 0.70, P = 0.4067; Day, F(2, 40) = 1.76, P = 0.1844).
Page 33
32
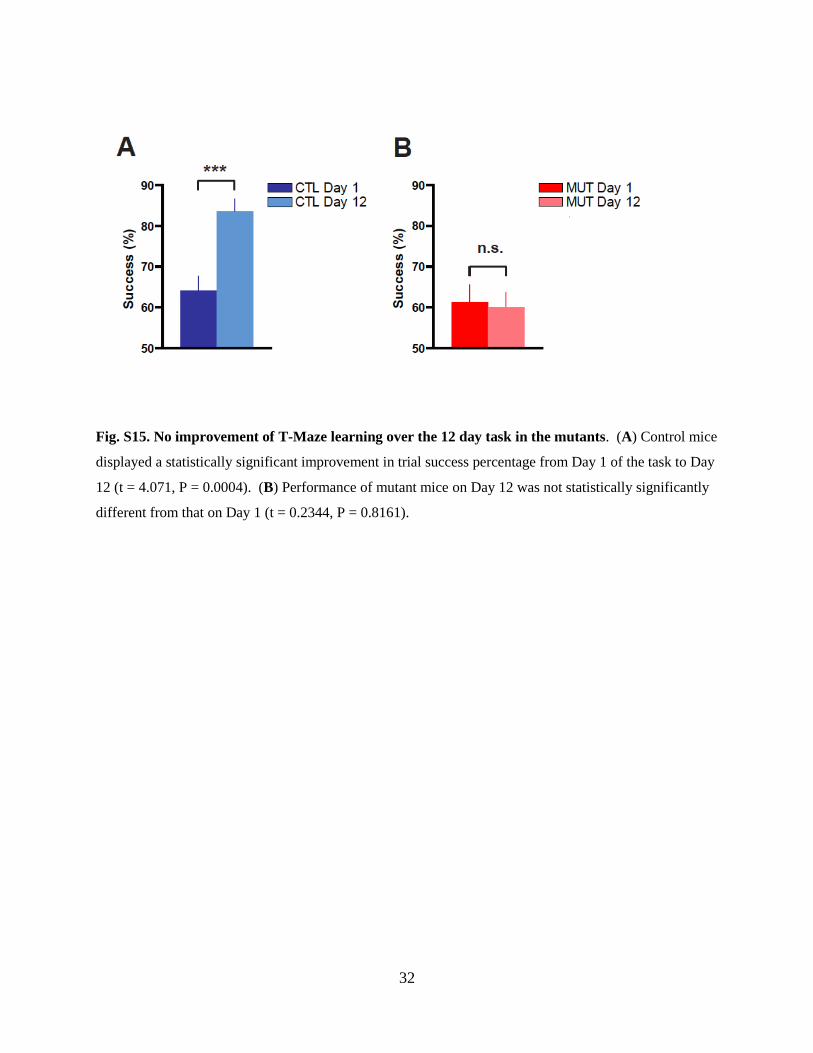
Fig. S15. No improvement of T-Maze learning over the 12 day task in the mutants. (A) Control mice
displayed a statistically significant improvement in trial success percentage from Day 1 of the task to Day
12 (t = 4.071, P = 0.0004). (B) Performance of mutant mice on Day 12 was not statistically significantly
different from that on Day 1 (t = 0.2344, P = 0.8161).
Page 34
33
Fig. S16. No difference was observed in tone recall in control and mutant mice injected with the
antagonist mixture and conditioned with DFC. (A) Experimental scheme for DFC experiments and
Dox withdrawal schedule. (B) The time course of freezing observed during training on day 1 expressed
in 20 s bins. Grey and green bars represent the tone and shock delivery, respectively. (C) The time course
of freeing observed during tone testing on day 2. (D) Freezing levels during the testing were averaged
over three epochs of the 60 s tone period and of the entire 240 s tone plus post-tone periods. There was
no difference between the genotypes in freezing levels during tone (CTL, N = 8, MUT, N = 8; Mann
Whitney U-test, P > 0.05) and tone plus post-tone (CTL, N = 8, MUT, N = 8; Mann Whitney U-test, P >
0.05) period.
ON DoxOFF Dox
TestInjection/
10-12 wk4 wk
Training
CTL-AntMUT-Ant
0 2 4 6 8 10 12 14 160
20
40
60
80
Time (min)
Fre
ez
ing
(%)
n.s.
n.s.
Tone Tone +
Post-Tone
0
20
40
60
80
Fre
ez
ing
(%)
0 2 4 6 8 10 120
20
40
60
80
100
Time (min)
Fre
ez
ing
(%)
A
B C D
Page 35
34
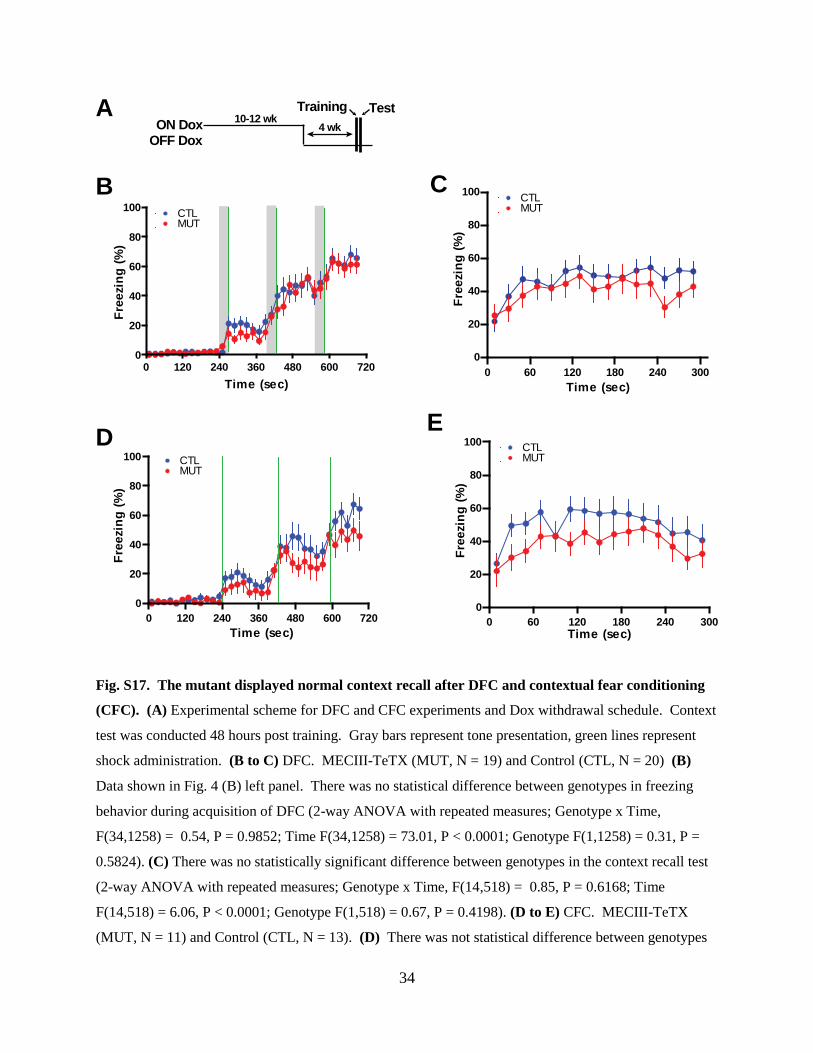
Fig. S17. The mutant displayed normal context recall after DFC and contextual fear conditioning
(CFC). (A) Experimental scheme for DFC and CFC experiments and Dox withdrawal schedule. Context
test was conducted 48 hours post training. Gray bars represent tone presentation, green lines represent
shock administration. (B to C) DFC. MECIII-TeTX (MUT, N = 19) and Control (CTL, N = 20) (B)
Data shown in Fig. 4 (B) left panel. There was no statistical difference between genotypes in freezing
behavior during acquisition of DFC (2-way ANOVA with repeated measures; Genotype x Time,
F(34,1258) = 0.54, P = 0.9852; Time F(34,1258) = 73.01, P < 0.0001; Genotype F(1,1258) = 0.31, P =
0.5824). (C) There was no statistically significant difference between genotypes in the context recall test
(2-way ANOVA with repeated measures; Genotype x Time, F(14,518) = 0.85, P = 0.6168; Time
F(14,518) = 6.06, P < 0.0001; Genotype F(1,518) = 0.67, P = 0.4198). (D to E) CFC. MECIII-TeTX
(MUT, N = 11) and Control (CTL, N = 13). (D) There was not statistical difference between genotypes
0 120 240 360 480 600 7200
20
40
60
80
100
Time (sec)
Fre
ezin
g(%
)
CTLMUT
0 120 240 360 480 600 720
0
20
40
60
80
100
Time (sec)
Fre
ezin
g(%
)
CTLMUT
0 60 120 180 240 300
0
20
40
60
80
100
Time (sec)
Fre
ezin
g(%
)CTLMUT
0 60 120 180 240 300
0
20
40
60
80
100
Time (sec)
Fre
ezin
g(%
)
CTLMUT
ON DoxOFF Dox
TestTraining10-12 wk
4 wk
A
B C
DE
Page 36
35
in freezing behavior during acquisition of CFC (2-way ANOVA with repeated measures; Genotype x
Time, F(34,748) = 0.97, P = 0.5140; Time F(34,748) = 35.19, P < 0.0001; Genotype F(1,748) = 1.72, P =
0.2034). (E) There was no statistically significant difference between genotypes in the context recall test
(2-way ANOVA with repeated measures; Genotype x Time, F(14,308) = 0.80, P = 0.6741; Time,
F(14,308) = 5.19, P < 0.0001; Genotype F(1,308) = 1.38, P = 0.2529).
Page 37
36
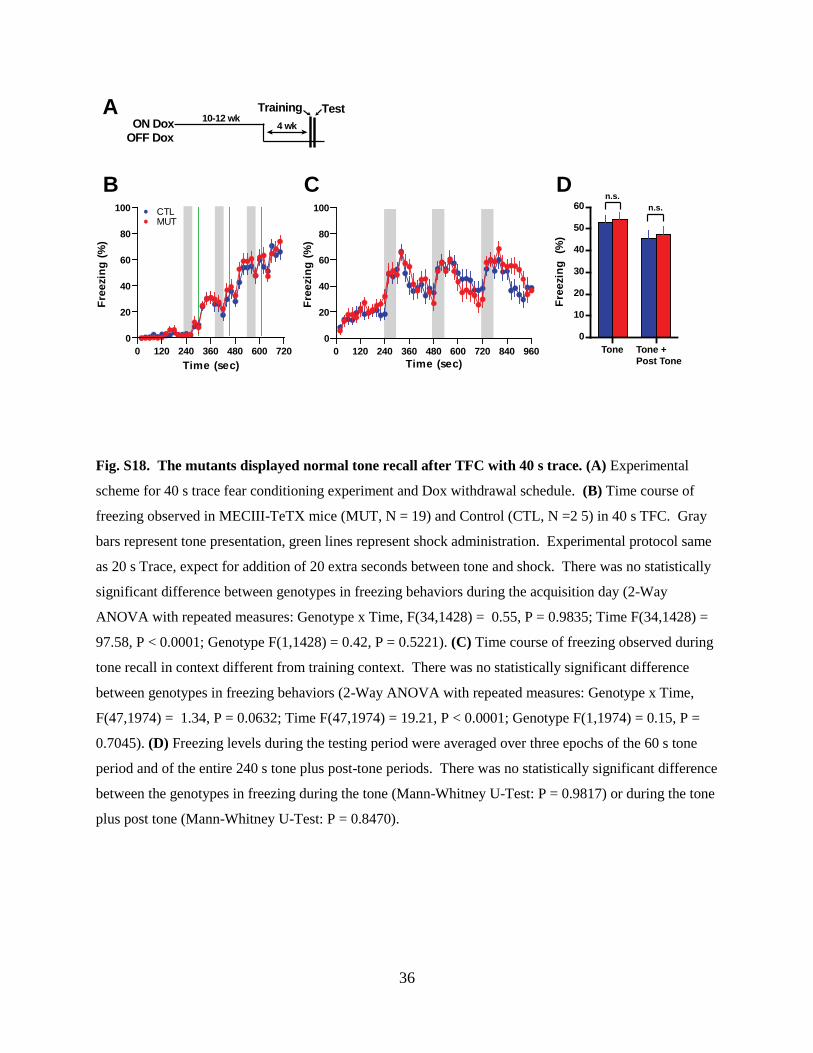
Fig. S18. The mutants displayed normal tone recall after TFC with 40 s trace. (A) Experimental
scheme for 40 s trace fear conditioning experiment and Dox withdrawal schedule. (B) Time course of
freezing observed in MECIII-TeTX mice (MUT, N = 19) and Control (CTL, N =2 5) in 40 s TFC. Gray
bars represent tone presentation, green lines represent shock administration. Experimental protocol same
as 20 s Trace, expect for addition of 20 extra seconds between tone and shock. There was no statistically
significant difference between genotypes in freezing behaviors during the acquisition day (2-Way
ANOVA with repeated measures: Genotype x Time, F(34,1428) = 0.55, P = 0.9835; Time F(34,1428) =
97.58, P < 0.0001; Genotype F(1,1428) = 0.42, P = 0.5221). (C) Time course of freezing observed during
tone recall in context different from training context. There was no statistically significant difference
between genotypes in freezing behaviors (2-Way ANOVA with repeated measures: Genotype x Time,
F(47,1974) = 1.34, P = 0.0632; Time F(47,1974) = 19.21, P < 0.0001; Genotype F(1,1974) = 0.15, P =
0.7045). (D) Freezing levels during the testing period were averaged over three epochs of the 60 s tone
period and of the entire 240 s tone plus post-tone periods. There was no statistically significant difference
between the genotypes in freezing during the tone (Mann-Whitney U-Test: P = 0.9817) or during the tone
plus post tone (Mann-Whitney U-Test: P = 0.8470).
ON DoxOFF Dox
TestTraining10-12 wk
4 wk
7200 120 240 360 480 600
0
20
40
60
80
100 CTLMUT
Time (sec)
Fre
ezin
g(%
)
0 120 240 360 480 600 720 840 960
0
20
40
60
80
100
Time (sec)
Fre
ezin
g(%
)
Tone Tone +
Post Tone
0
10
20
30
40
50
60
Fre
ezin
g(%
)
n.s.
n.s.
A
B C D
Page 38
37
4. Statistics and Sample Sizes
Fig. 2D. In vitro electrophysiological characterization of synaptic transmission after stimulation in SLM
of hippocampal CA1 in mutant (N = 8, 16 brain slices) and control mice (N = 8, 16 brain slices). Post-
synaptic fluorescent changes were significantly decreased in mutant (2-way ANOVA: Genotype x
Stimulation Intensity, F(4, 150) = 45.11, P < 0.0001; Genotype, F(1, 150) = 349.53, P < 0.0001;
Stimulation Intensity, F(4, 150) = 115.13, P < 0.0001). Bonferroni post-tests showed statistical
differences on stimulation intensity at 150, 200, and 250 (50 uA: t = 0.6776, P > 0.05; 100 uA: t = 1.505,
P > 0.05; 150 uA: t = 7.368, P < 0.001; 200 uA: t = 13.51, P < 0.001; 250 uA: t = 16.75, P < 0.001).
Fig. 2E. In vitro electrophysiological characterization of synaptic transmission after stimulation in SR of
hippocampal CA1 of mutant (N = 8, 16 brain slices) and control mice (N = 8, 16 brain slices). No changes
in post-synaptic fluorescence between genotypes (2-way ANOVA: Genotype x Stimulation Intensity, F(4,
150) = 0.49, P = 0.7453; Genotype, F(1, 150) = 2.91, P = 0.09; Stimulation Intensity, F(4, 150) = 93.19, P
< 0.0001). Bonferroni post-tests showed statistical no differences on any of stimulation intensity (50 uA:
t = 1.992, P > 0.05; 100 uA: t = 0.5219, P > 0.05; 150 uA: t = 0.2628, P > 0.05; 200 uA: t = 0.5928, P >
0.05; 250 uA: t = 0.4460, P > 0.05).
Fig. 2F. In vitro electrophysiological characterization of synaptic transmission after stimulation in SLM
of hippocampal CA1 of mutant after Dox withdrawal (N=4, 8 brains slices) and mutant mice (N=4, 8
brains slices) after on-Dox for 4 weeks following the withdrawal for 4 weeks. Post-synaptic fluorescent
changes were significantly increased in mutant with Dox re-treatment (2-way ANOVA: Dox treatment x
Stimulation Intensity, F(4, 70)=45.11, P < 0.0001; Dox treatment, F(1, 70) = 372.57, P < 0.0001;
Stimulation Intensity, F(4, 70)=141.20, P < 0.0001). Bonferroni post-tests showed statistical differences
on stimulation intensity at 150, 200, and 250 (50 uA: t = 0.0074, P > 0.05; 100 uA: t = 1.065, P > 0.05;
150 uA: t = 9.398, P < 0.001; 200 uA: t = 12.80, P < 0.001; 250 uA: t = 17.29, P < 0.001).
Fig. 3B. Escape latency in each block of the DMP task in water maze (controls, N = 47; mutants, N = 49).
Block 0: The average escape latencies to the visible platform were not significantly different between the
two genotypes (2-way ANOVA: Genotype x Run, F(2.927,1118.096) = 0.092, P = 0.962; Run,
F(2.927,1118.096) = 21.339 P < 0.0001; Genotype, F(1,382) = 0.002, P = 0.963 with the Huynh-Feldt
correction). Bonferroni post-tests showed no statistical differences on any of the Runs (R1: t = 0.3565, P
> 0.05; R2: t = 0.02804, P > 0.05; R3: t = 0.01525, P > 0.05; R4: t = 0.2382, P > 0.05). Block 1: The
average escape latencies over the first four days with the invisible 11 cm platform locations were not
Page 39
38
significantly different between the two genotypes (2-way ANOVA: Genotype x Run, F(2.952,1127.778)
= 1.557, P = 0.199; Run, F(2.952,1127.778) = 15.165, P < 0.0001; Genotype, F(1,382) = 1.59, P = 0.208
with the Huynh-Feldt correction). Bonferroni post-tests showed no statistical differences on any of the
Runs (R1: t = 1.224, P > 0.05; R2: t = 0.8371, P > 0.05; R3: t = 1.316, P > 0.05; R4: t = 1.534, P > 0.05).
Block 2: The average escape latencies over the last four days with the invisible 11 cm platform locations
were not significantly different between the two genotypes (2-way ANOVA: Genotype x Run,
F(2.844,1086.421) = 0.203, P = 0.886; Run, F(2.844,1086.421) = 30.953, P < 0.0001; Genotype, F(1,382)
= 0.721, P = 0.396 with the Huynh-Feldt correction). Bonferroni post-tests showed no statistical
differences on any of the Runs (R1: t = 0.2788, P > 0.05; R2: t = 0.2630, P > 0.05; R3: t = 1.082, P >
0.05; R4: t = 0.6484, P > 0.05). Block 3: The average escape latencies over the first four days with the
invisible 8 cm platform locations was significantly different between the two genotypes (2-way ANOVA:
Genotype x Run, F(3,1146) = 3.514, P = 0.015; Run, F(3,1146) = 14.859, P < 0.0001; Genotype, F(1,382)
= 6.837, P = 0.009). Bonferroni post-tests showed statistical differences on R2 and R4 (R1: t = 0.3294, P
> 0.05; R2: t = 2.562, P < 0.05; R3: t = 1.420, P > 0.05; R4: t = 3.370, P < 0.01). Block 4: The average
escape latencies over the last four days with the invisible 8 cm platform locations was not significantly
different between the two genotypes (2-way ANOVA: Genotype x Run, F(2.96,1130.655) = 5.448, P =
0.0001; Run, F(2.96,1130.655) = 16.89 P < 0.0001; Genotype, F(1,382) = 2.868, P = 0.091 with the
Huynh-Feldt correction). Bonferroni post-tests showed statistical differences on R2 (R1: t = 1.350, P >
0.05; R2: t = 3.434, P < 0.01; R3: t = 0.6535, P > 0.05; R4: t = 1.778, P > 0.05).
Fig. 3C. The averaged R1 to R2 savings over the four blocks with hidden platforms showed a significant
difference between the genotypes (2-way ANOVA: Genotype x Block, F(2.973,1135.79) = 6.931, P =
0.0001; Block, F(2.973,1135.79) = 0.866, P = 0.458; Genotype, F(1,382) = 5.911, P = 0.016 with the
Huynh-Feldt correction). Bonferroni post-tests showed statistical differences on Block 3 and Block 4
(Block1: t = 1.735, P > 0.05; Block2: t = 0.01326, P > 0.05; Block3: t = 2.564, P< 0.05; Block4: t = 4.132,
P < 0.001).
Fig. 3E. There was a significant difference between genotypes (controls, N = 14; mutants, N = 18) in
performance of the DNMP version of the T-Maze task as measured by fraction of correct alternations per
day, with 10 trials per day and over 12 days of the task.
Fig. 3F. Unpaired t-test with the Welch correction showed statistical differences (t = 9.856, P < 0.001).
Page 40
39
Fig. 4A. On the acquisition day, there was a significant difference between genotypes (controls, N = 39;
mutants, N = 35) in freezing behavior (2-way ANOVA: Genotype x Time, F(34,2448) = 2.08, P = 0.0003;
Time, F(34,2448) = 142.46, P < 0.0001; Genotype, F(1,2248) = 11.95, P = 0.0009). During the tone test
session, there was a significant difference between genotypes in freezing behavior (2-way ANOVA:
Genotype x Time, F(47,3384) = 1.30, P = 0.0861; Time, F(47,3384) = 33.82, P < 0.0001; Genotype,
F(1,3384) = 17.24, P < 0.0001). The mutants froze significantly less than controls during tone period,
(Mann Whitney U-test: P = 0.0004) and during the period tone and post-tone combined (Mann Whitney
U-test: P < 0.0001).
Fig. 4B. On the acquisition day, there was not a significant difference between genotypes (controls, N =
15; mutants, N = 17) in freezing behavior (2-way ANOVA: Genotype x Time, F(34,1258) = 0.54, P =
0.9852; Time, F(34,1258) = 73.01, P < 0.0001; Genotype, F(1,1258) = 0.31, P = 0.5824). During the tone
test session, there was not a significant difference between genotypes in freezing behavior (2-way
ANOVA: Genotype x Time, F(47,1739) = 0.89, P = 0.6821; Time, F(47,1739) = 34.72, P < 0.0001;
Genotype, F(1,1739) = 1.29, P = 0.2637). There was no a significant difference between genotypes
during tone presentation, (Mann Whitney T-test: P = 0.0830) and during the period tone and the post-tone
combined (Mann Whitney U-test: P = 0.1096).
Fig. 4C. During the tone test session, there was a statistically significant difference between genotypes
(controls, N = 26; mutants, N = 18) in freezing behavior (2-way ANOVA: Genotype x Time, F(47,1974)
= 1.45, P = 0.0252; Time, F(47, 1974) = 9.29, P < 0.0001; Genotype, F(1, 1974) = 10.04, P = 0.0029).
The mutants displayed significantly low freezing during tone presentation, (Mann Whitney U-test: P =
0.0149) and during the period tone and post-tone combined (Mann Whitney U-test: P < 0.0001).
Fig. 4D. During the tone test session, there was not a statistically significant difference between
genotypes (controls, N = 25; mutants, N = 19) in freezing behavior (2-way ANOVA: Genotype x Time,
F(47,1974) = 0.70, P = 0.9407; Time, F(47, 1974) = 8.13, P < 0.0001; Genotype, F(1, 1974) = 0.02, P =
0.8827). The mutants displayed a similar freezing level during tone presentation, (Mann Whitney U-test:
P = 0.8076) and during the period tone and post-tone combined (Mann Whitney U-test: P = 0.6069).
Fig. 4E. On the acquisition day, there was not a significant difference between genotypes (CA3-CTL, N =
20; CA3-MUT, N = 20) in freezing behavior (2-way ANOVA: Genotype x Time, F(34,1292) = 1.18, P =
0.2261; Time, F(34, 1292) = 84.47, P < 0.0001; Genotype, F(1, 1292) = 0.10, P = 0.7515). During the
Page 41
40
tone test session, there was not a significant difference between genotypes in freezing behavior (2-way
ANOVA: Genotype x Time, F(47,1786) = 2.06, P < 0.0001; Time, F(47, 1786) = 17.41, P < 0.0001;
Genotype, F(1, 1786) = 2.07, P = 0.1584). Specifically, during tone presentation, (Mann Whitney U-test:
P = 0.5997) mutants did not freeze statistically different from controls, but during the post-tone period
(Mann Whitney U-test: P = 0.0236) the mutant animals did freeze statistically less than controls.
Fig. 4F. During the tone test session, there was not a statistically significant difference between genotypes
(controls with antagonists, N = 13; mutants with antagonists, N = 10; controls with vehicle, N = 8) with
antagonist treatment in freezing behavior (2-way ANOVA: Genotype x Time, F(47,987) = 0.50, P =
0.9983; Time, F(47, 987) = 16.08, P < 0.0001; Genotype, F(1, 987) = 0.19, P = 0.6666). However, there
was a significant difference between controls with antagonists and controls with vehicle (2-way ANOVA:
Antagonists x Time, F(47,912) = 0.34, P = 1.000; Time, F(47, 912) = 0.84, P < 0.0001; Antagonists, F(1,
912) =63.05, P < 0.0001) and between mutants with antagonists and controls with vehicle (2-way
ANOVA: Genotype x Time, F(47,768) = 0.30, P = 1.000; Time, F(47, 768) = 83.13, P < 0.0001;
Genotype, F(47, 768) = 7.77, P < 0.0001). Specifically, controls with antagonists did not freeze
statistically different from mutants with antagonists during the tone period (Mann Whitney U-test: P =
0.5457) and during the period tone and post-tone combined (Mann Whitney U-test: P = 0.3135). Freezing
levels of controls and mutants with antagonists were significantly lower than that of controls with vehicle
during tone period (Mann Whitney U-test: P = 0.0003 and P < 0.0001) and during the period tone and
post-tone combined (Mann Whitney U-test: P = 0.0004 and P < 0.0001).
Page 42
41
5. Supporting References
S1. R. Sandberg et al., Proc Natl Acad Sci U S A 97, 11038 (2000).
S2. P. Pavlidis, W. S. Noble, Genome Biol 2, RESEARCH0042 (2001).
S3. E. C. Lee et al., Genomics 73, 56 (2001).
S4. T. J. McHugh et al., Science 317, 94 (2007).
S5. T. Nakashiba, J. Z. Young, T. J. McHugh, D. L. Buhl, S. Tonegawa, Science 319, 1260 (2008).
S6. A. J. Silva, C. F. Stevens, S. Tonegawa, Y. Wang, Science 257, 201 (1992).
S7. E. Link et al., Biochem Biophys Res Commun 189, 1017 (1992).
S8. G. Schiavo et al., Nature 359, 832 (1992).
S9. M. Baumert, P. R. Maycox, F. Navone, P. De Camilli, R. Jahn, EMBO J 8, 379 (1989).
S10. T. C. Sudhof, Nature 375, 645 (1995).
S11. M. Gossen et al., Science 268, 1766 (1995).
S12. T. Tominaga, Y. Tominaga, H. Yamada, G. Matsumoto, M. Ichikawa, J Neurosci Methods 102,
11 (2000).
S13. R. J. Racine, Electroencephalogr Clin Neurophysiol 32, 281 (1972).
S14. K. Nakazawa et al., Neuron 38, 305 (2003).
S15. B. J. Fellows, Psychol Bull 67, 87 (1967).
S16. T. J. McHugh, S. Tonegawa, Hippocampus 19, 1153 (2009).
S17. M. Remondes, E. M. Schuman, Nature 431, 699 (2004).
S18. V. H. Brun et al., Neuron 57, 290 (2008).
S19. C. Parron, B. Poucet, E. Save, Behav Brain Res 154, 345 (2004).
S20. C. Parron, B. Poucet, E. Save, Behav Brain Res 170, 99 (2006).
S21. L. E. Jarrard, T. L. Davidson, B. Bowring, Hippocampus 14, 434 (2004).
S22. R. Galani, I. Weiss, J. C. Cassel, C. Kelche, Behav Brain Res 96, 1 (1998).
S23. F. Schenk, R. G. Morris, Exp Brain Res 58, 11 (1985).
S24. L. E. Jarrard, H. Okaichi, O. Steward, R. B. Goldschmidt, Behav Neurosci 98, 946 (1984).
S25. H. A. Steffenach, M. Witter, M. B. Moser, E. I. Moser, Neuron 45, 301 (2005).
S26. E. L. Hargreaves, G. Rao, I. Lee, J. J. Knierim, Science 308, 1792 (2005).
S27. T. van Groen, Hippocampus 11, 397 (2001).


![Brain Waves · Brain Waves In This Issue: [continued. on p. 2] 2016 Neuroscience Research Symposium Summary By N&PP student Joshua Cruz (Kalin Lab) Co-sponsored by the Neuroscience](https://static.documents.pub/doc/80x56/5ffd494ce4a7d36c1a593174/brain-waves-brain-waves-in-this-issue-continued-on-p-2-2016-neuroscience-research.jpg)


