CONTENTS CONTENTS........................................................................................................................... 1 Introduction ........................................................................................................................ 2 Patterns of access to tertiary education for students with SEN (and what kinds of special needs) ..................................................................................................................... 2 National Example from Luxembourg .................................................................................. 6 How can the drop-out rate of students with SEN before finishing upper secondary education be reduced, so that they acquire access to tertiary education? ....................... 7 How do the academic and social experiences of students with SEN vary by special need, subject studied and type of tertiary education institution attended? ................... 11 What are the experiences and progression rates of students with SEN? ........................ 14 How do their levels of qualifications compare with their counterparts without SEN? .... 16 Extent of European tertiary education institutions becoming more inclusive................. 18 Remaining barriers and what needs to be changed in the future? How can tertiary education institutions be better prepared to widen access, better cater to students with SEN and foster their progression? ............................................................................ 20 What works, why does it work and how does it work in supporting this group to attain higher skills and qualifications? ........................................................................................ 22 Final remarks .................................................................................................................... 23 REFERENCES ...................................................................................................................... 25 Supporting young adults with special educational needs (SEN) in obtaining higher qualifications NESET II ad hoc question No. 6/2016 By Arthur Limbach-Reich & Justin J. W. Powell University of Luxembourg
Patterns of access to tertiary education for students with SEN (and what kinds of special needs) ..................................................................................................................... 2
National Example from Luxembourg .................................................................................. 6
How can the drop-out rate of students with SEN before finishing upper secondary education be reduced, so that they acquire access to tertiary education? ....................... 7
How do the academic and social experiences of students with SEN vary by special need, subject studied and type of tertiary education institution attended? ................... 11
What are the experiences and progression rates of students with SEN? ........................ 14
How do their levels of qualifications compare with their counterparts without SEN? .... 16
Extent of European tertiary education institutions becoming more inclusive ................. 18
Remaining barriers and what needs to be changed in the future? How can tertiary education institutions be better prepared to widen access, better cater to students with SEN and foster their progression? ............................................................................ 20
What works, why does it work and how does it work in supporting this group to attain higher skills and qualifications? ........................................................................................ 22
Final remarks .................................................................................................................... 23
By Arthur Limbach-Reich & Justin J. W. Powell University of Luxembourg
Young adults with special educational needs (SEN) / 2016
2
INTRODUCTION The following report discusses the specified topic of ‘supporting young adults with SEN’ pursuant to the proposed leading questions on national and international (European) background(s). There are few international comparative publications that focus particularly on disability and higher education. Mostly these have been written under the aegis of international organizations like ANED, EADSNE, and OECD (Commission/EACEA/Eurydice, 2014; Ebersold, 2008b, 2012; Grammenos, 2013; WHO, 2011). These comparative studies risk of losing sight of the fact that key concepts such as Higher Education1, Disability2, and Accessibility3 differ widely and are linked to ‘inclusion’, itself an elusive and ethically charged concept currently controversially discussed in many countries. In addition, inclusion sometimes morphs into a catchword in these discussions without connection to real political will and without considering the necessary consequences in a competitive and mainly capitalistic market-driven economy in which persons with impairments or disabilities are regarded as human capital with the objective to change them from tax-user to tax-payer (Becker, 2015; Sierck, 2013). Both, ‘from global and local perspectives accessibility to higher education for students with a disability / additional needs, seems fragmented and inconsistent’ (Supple & Abgenyega, 2011, p. 97). This relates to the multiple functions and rising importance of higher education for labour market integration, social integration, and life chances.
PATTERNS OF ACCESS TO TERTIARY EDUCATION FOR STUDENTS WITH SEN (AND WHAT KINDS OF SPECIAL NEEDS)
Internationally, a watershed moment for inclusivity in education came with the Salamanca Declaration, which strongly supported its progression, and specifically advocated for the provision of ‘mainstream’ education for students with disabilities (UNESCO, 1994). The Convention on the Rights of Persons with Disabilities (UN-CRPD, 2006) has vastly furthered the issue of inclusion in education, binding more than 160 States Parties to ensure an inclusive education systems at all levels and to provide access to general tertiary education for everyone. In 2008, the OECD summarized country-specific pathways through which people with disabilities attain tertiary education in some OECD member states. The report credits anti-discrimination legislation during the 1990s and 2000s with broadening the access of young adults with disabilities to tertiary education (Ebersold, 2008b). Three years later, an OECD Report (2011) noted that significant progress had been made: more young adults with disabilities, and especially those with learning difficulties, were participating in tertiary education, and more were gaining the prerequisites for tertiary education.
According to the OECD Report (2011), tertiary education institutions had been increasingly designing a diverse array of admissions and support strategies for students with disabilities. Support has been developed in relation to housing and transport, and students were being provided with information and
1 See major changes in ISCED 2011 (OECD 2016: Education at a Glance OECD 2016 INDICATORS, 27). Most young adults with disabilities are enrolled in ISCED 5A level courses, but in some countries for example pre-primary education is related to a university programme, while in others it is not (e.g., Germany). Even at the same level, there are fundamental differences in Bachelor degrees between Germany and UK, see Lenzen, 2014 http://www.deutschlandfunk.de/bachelor-und-master-wir-brauchen-eine-reform-der-bologna.680.de.html?dram:article_id=282962. 2 ‘Learning Disabilities’, which are the biggest and fast growing groups in Anglophone universities, are not recognized in Italian universities, where learning difficulties are not considered as disabilities (Maggiolini & Molteni, 2013). 3 Beyond physical and sensory impairments, the question arises how to define accessibility in relation to ADHD, psychiatric disorders or special learning disabilities.
Young adults with special educational needs (SEN) / 2016
3
advice about courses, secondary education institutions, and their own educational pathways (OECD, 2011). In terms of admissions strategies, they had been designed to make students with disabilities responsible for themselves, encouraging them to clarify their particular educational needs as early as possible. Universities also provided information and advice to students on courses, their accessibility policy, available support and accommodation (Ebersold, 2012).
Based on national reports compiled by the Academic Network of European Disability experts (ANED), the executive summary report ( Ebersold, Schmitt & Priestley, 2011) stated that despite an increase over time, the relative numbers and rates of students with disabilities in higher education were still very low compared to their nondisabled peers. For example, in Ireland between 2000 and 2006, while the rate of participation for disabled students increased by 2.6 %, the overall rate of access to tertiary education rose at a much higher rate, namely 8 %. Several other countries showed similar disparities: Norway, 9 % versus 21 %; Malta, 4.4 % versus 10 %; Spain, 5.4 % versus 19.1 %; United Kingdom: 28 % versus 41 %. Germany reported that disabled students tended to take somewhat more erratic educational pathways; their studies tended to be of longer duration, they were more likely than non-disabled students to change their courses of study (23 % vs. 19 %) and/or the university (18 % vs. 16 %), and they were less likely to finally attain a university degree (Ebersold, Schmitt, & Priestley, 2011).
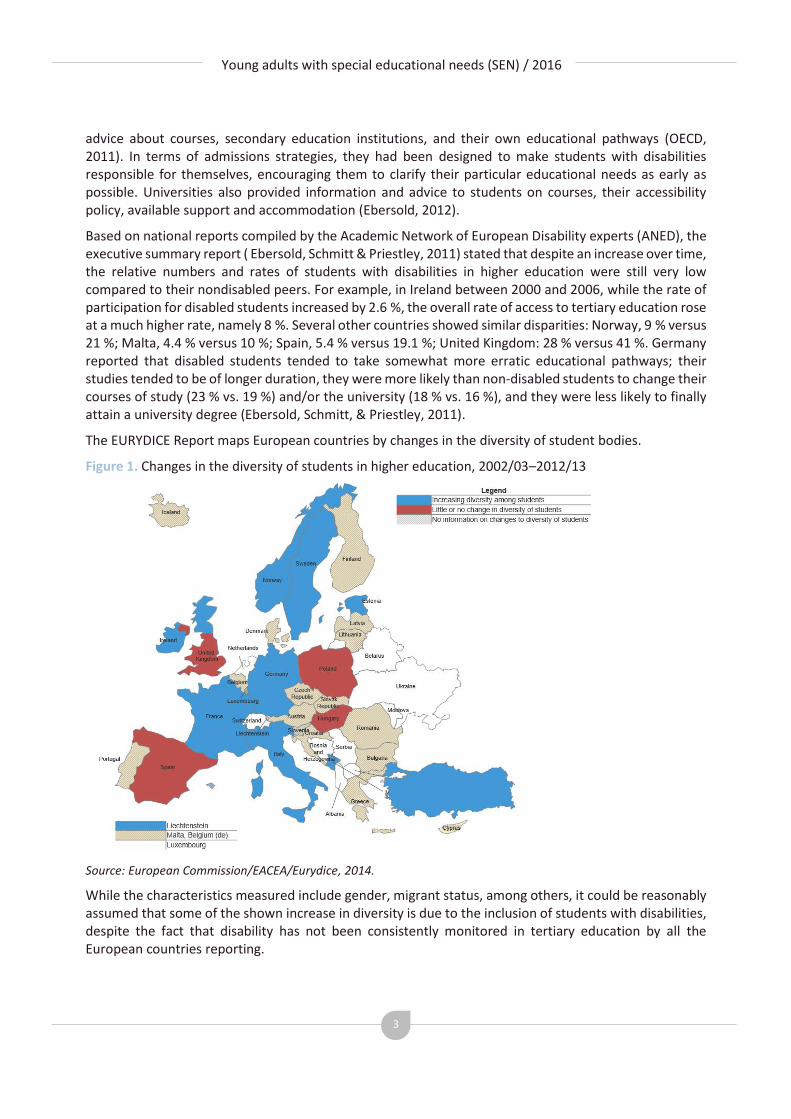
The EURYDICE Report maps European countries by changes in the diversity of student bodies.
Figure 1. Changes in the diversity of students in higher education, 2002/03–2012/13
Source: European Commission/EACEA/Eurydice, 2014.
While the characteristics measured include gender, migrant status, among others, it could be reasonably assumed that some of the shown increase in diversity is due to the inclusion of students with disabilities, despite the fact that disability has not been consistently monitored in tertiary education by all the European countries reporting.
Young adults with special educational needs (SEN) / 2016
4
Figure 2. Monitoring of student social profiles
Source: European Commission/EACEA/Eurydice, 2014, p. 18.
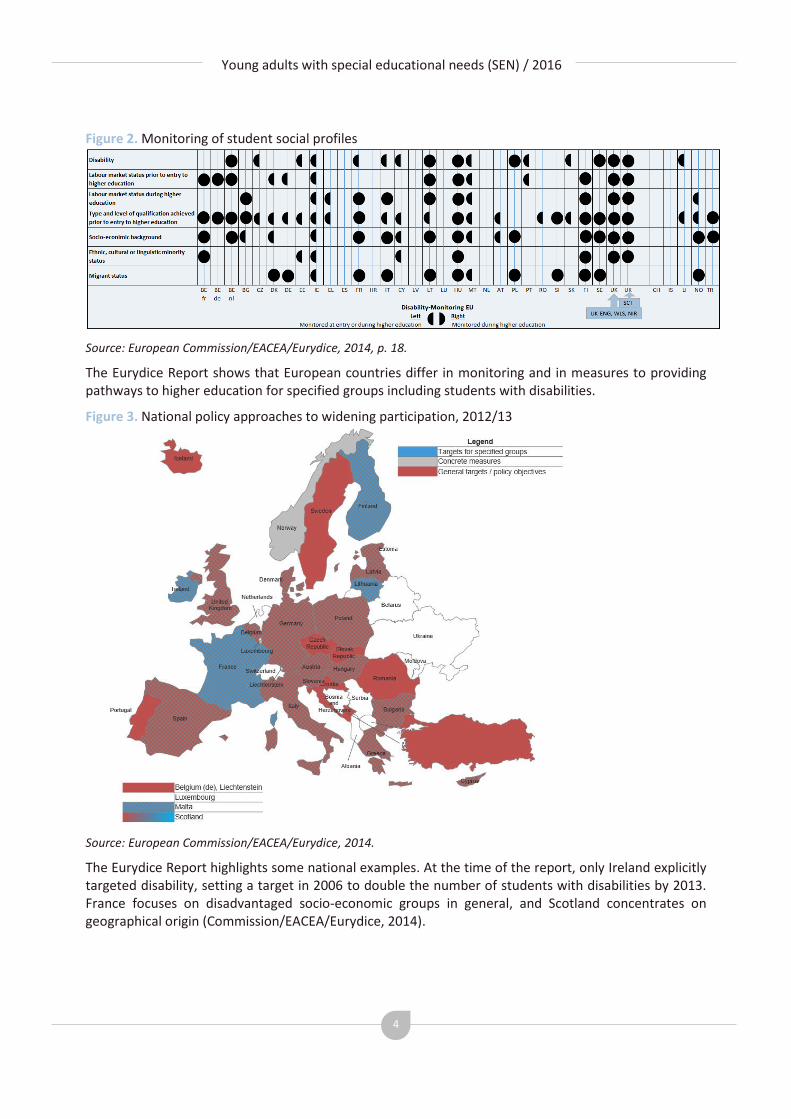
The Eurydice Report shows that European countries differ in monitoring and in measures to providing pathways to higher education for specified groups including students with disabilities.
Figure 3. National policy approaches to widening participation, 2012/13
Source: European Commission/EACEA/Eurydice, 2014.
The Eurydice Report highlights some national examples. At the time of the report, only Ireland explicitly targeted disability, setting a target in 2006 to double the number of students with disabilities by 2013. France focuses on disadvantaged socio-economic groups in general, and Scotland concentrates on geographical origin (Commission/EACEA/Eurydice, 2014).
Young adults with special educational needs (SEN) / 2016
5
Focusing on European and North American universities, Powell analyses developments from dis/ableism to accessibility to the ‘Universal Design University’ and address the changes necessary to realize it. Measures to increase the accessibility of a university include financial compensation, architectural improvements, wayshowing systems, and technical support. Empowerment programmes or services such as a Disability and Well-Being Office are equally important as they encourage disabled students to draw up individual transition plans and focus on their future, their expectations, their personal potentials and the resources they will require to achieve their goals (Powell, 2012).
The human right to inclusive education across the life course and the implementation of such measures in higher education institutions has led to remarkable increases of students with disability in tertiary education. The trend is evident across countries and types of disability or special (educational) need, which indicates that there are several different pathways at work.
The OECD (2008) juxtaposed categorical data from France and Germany. In France, the most common disabilities were: sensory impairments (24.7 %), physical deficiency (19.8 %) and health problems (20.6 %), followed by psychological disorders (11.2 %), language problems (8.2 %), and temporary incapacities (5.3 %). In Germany (in 2006), 60 % of students who disclosed a disability or a health problem had either respiratory problems, allergies, or a skin disease, while amongst the remaining, 16 % were visually impaired, 13 % had a musculoskeletal deficiency and 11 % had psychological disorders (OECD, 2008). Several explanations have been offered to explain the irregularities: the two countries used different methods in data acquisition (representative sampling in Germany and enumeration of related requests in France); the disabilities and disorders were defined in different ways (learning disability: subsumed or not subsumed); and different access pathways to tertiary education.
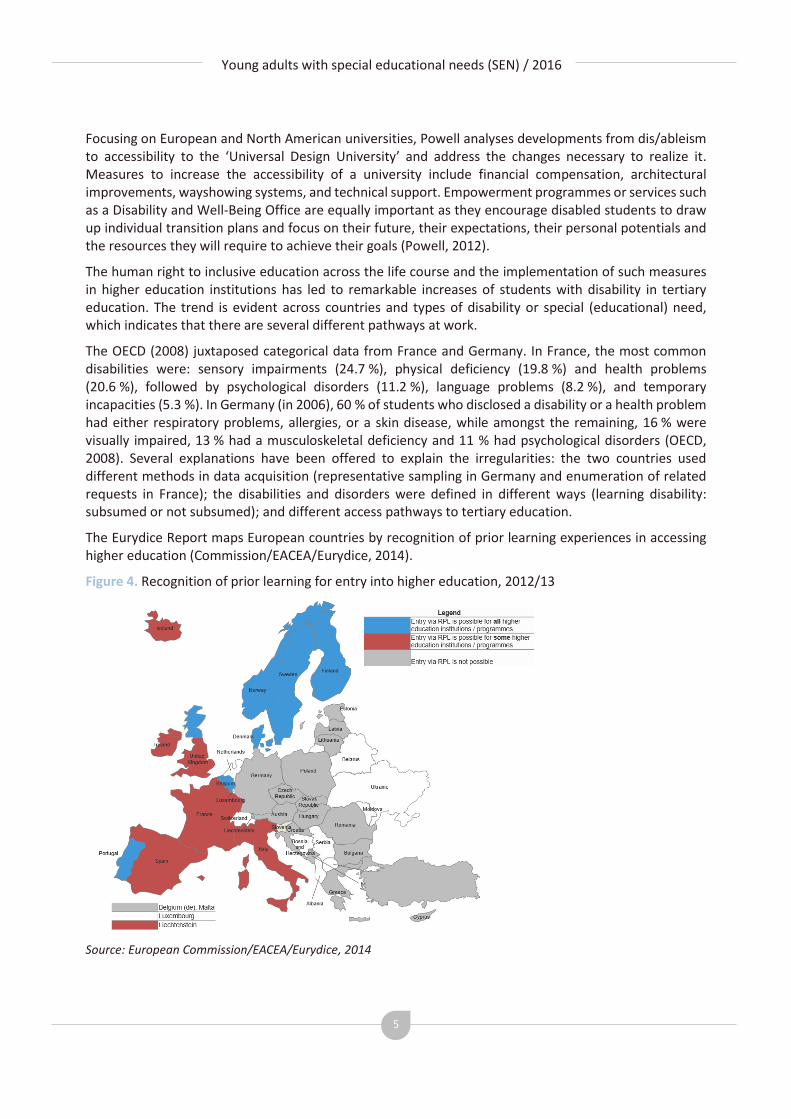
The Eurydice Report maps European countries by recognition of prior learning experiences in accessing higher education (Commission/EACEA/Eurydice, 2014).
Figure 4. Recognition of prior learning for entry into higher education, 2012/13
Source: European Commission/EACEA/Eurydice, 2014
Young adults with special educational needs (SEN) / 2016
6
Contrary to the map, in most of the German states or Länder it is now legally possible to enroll at universities via prior learning experience or professional activity without a high school certificate (Abitur
or Fachabitur)4. Mention of pathways from special education to higher education are limited to a few
individual reports, and are overlooked entirely in recent Eurydice or OECD reports (but on Austria, Germany, and Switzerland, see Powell, Felkendorff & Hollenweger, 2008). The project of a European Sign Language University in Bad Kreuznach (Germany)5 seems to be postponed or abandoned.
Pathways to tertiary education depend on financial resources, and financial resources continue to impact student success in tertiary education (OECD, 2011). In a study comparing higher education finance in selected European countries (including Czech Republic Denmark, France, and Norway), Serge Ebersold concludes that students cannot afford their studies without some form of financing, which may come in the form of public funding, parental support, or their own work (Ebersold, 2012).
Table 1. Students with Disabilities: Work while studying, formal support and support from parents (%) Czech Republic
(n=117) Denmark (n=414)
France (n=305)
Total (n=836)
Work while studying (p=ns)
Never 34.2 % 45.0 % 48.3 % 44.2 %
Rarely 18.8 % 11.6 % 11.1 % 12.5 %
Occasionally 22.3 % 17.7 % 26.6 % 20.2 %
Regularly 24.7 % 25.7 % 14.0 % 23.1 %
Total 100 % 100 % 100 % 100 %
Financial support (p<0.0001)
Grants/bursaries 36.4 % 13.1 % 32.0 % 21.0 %
Loan 1.1 % 36.4 % 11.4 % 25.4 %
Financial support from parents (p=0.000)
Enrolment fees 47.5 % 2.8 % 67.0 % 25.6 %
School materials 46.6 % 33.5 % 65.1 % 37.8 %
Accommodation 55.3 % 34.8 % 52.9 % 32.7 %
Food and transport 52.4 % 38.1 % 69.8 % 45.8 %
Source OECD, 2011
In Norway, 60.6 % of students with disabilities primarily paid for their studies with grants and loans; 15.1 % relied primarily on disability (rehabilitation and benefit) allowances; and 10.6 % depended on support from their family. The percentage of disabled Norwegian students who worked during their studies was 63.9 %. There are considerable differences in the sources of income and in the levels of employment during studies (see Table 1).
National Example from Luxembourg
In Luxembourg, access to vocational training and tertiary education generally requires a secondary education diploma (Lycée seconaire technique; Lycée secondaire general). Access to higher education and university is restricted to the diploma of general secondary education or upper technical secondary education section (Diplôme de fin d’études techniques). Access to tertiary education may be granted by recognition of prior qualifications and learning experiences (RPL in French: VAE - Validation des Acquis de
4 An up to date overview provides the German Hochschul Konferenze Web page “Hochschulkompass” at: http://www.hochschulkompass.de/studium/voraussetzungen-fuers-studium/hochschulzugangsberechtigung/studieren-ohne-abitur.html.
5 Web page of the European Sign Language University https://signlangunieu.wordpress.com.
Young adults with special educational needs (SEN) / 2016
7
l'Expérience). There are a number of special schools for students with special educational needs (Education différenciée); however, these special schools do not provide access to higher education. In mainstream secondary education, students with disabilities (élèves à besoins éducatives particuliers) are eligible for reasonable accommodations and special support or adaptations provided by The School Act of 15 July 2011 (Loi du 15 juillet 2011). The School Act doesn’t mention tertiary education, and indeed reasonable accommodations are not mandatory at the national university of Luxembourg, the largest and only research university in the country (Powell, 2015). Students with disabilities cannot benefit from general quota systems or from specific disability compensation at university entry or during the enrolment process. The Réglement Grand-Ducal 22 Mai 2006 allows students with disabilities to specifically request the maximal study time (prolongation beyond 10 semesters in BA programmes or beyond 6 semesters in MA programmes) and for exemption from the threshold of minimal credit points acquired in the two first semesters. A legislative proposal by the Government (Project de Reglement Grand-Ducal, 2016) provides an extension of the period students with disabilities may receive state support. Students with disabilities at the University of Luxembourg can request a maximum of two additional semesters’ bursary or loan financing for each cycle, or four additional semesters for a one-cycle course of study (Powell, Limbach-Reich, & Brendel, 2017).
HOW CAN THE DROP-OUT RATE OF STUDENTS WITH SEN BEFORE FINISHING UPPER SECONDARY EDUCATION BE REDUCED, SO THAT THEY ACQUIRE ACCESS TO TERTIARY EDUCATION?
Today, only 9 EU countries, including France and the United Kingdom, have policy programmes in place to enhance the participation of students with SEN in higher education; the programmes generally aim to offer simple assistance to students with certain impairments through free transport or barrier-free access to colleges and universities and to their respective classrooms. Some programmes go further. In Ireland, for example, many higher education institutions offer special technical aids for SEN students, summer-schools are offered for students with intellectual disabilities, and additional assistance is provided by ‘visiting/peripatetic teachers’ for students with visual or hearing impairments. In Denmark and Sweden, sign language or LPC translators are provided. Norway encourages students with sensory or motor deficits, with severe learning disabilities, with emotional or social problems, and other serious impairments, to participate in special programs that facilitate their studies. Some Scandinavian countries try to reduce the dropout rate of disabled students in postsecondary and higher education by offering distance courses, e-learning or blended learning programmes (Ebersold et al., 2011; Seale, 2014).
Estimates based on the recent OECD Report on Education (OECD, 2016) indicate that an average of 85 % of today’s young people in OECD countries will complete upper secondary education over their lifetimes. 15 % are not expected to reach this threshold and will presumably leave education early.
Young adults with special educational needs (SEN) / 2016
8
Figure 6. Upper secondary graduation rates (2013)
Source: OECD, 2016, p. 46.
OECD data on graduation rates do not identify students who have a disability, and it is not clear whether the data includes individuals who were diagnosed with a disorder after secondary or tertiary education.
Students who dropout from their studies during upper secondary education are generally precluded from entering higher education, and this applies no less to students with disabilities. There is no generally or universally agreed-upon definition of dropout, and only some OECD countries systematically monitor dropout rates in secondary education and collect data related to specific groups such as students with disabilities. While national education systems have aimed to reduce dropout rates through guidance, assistance and reasonable accommodations, there is still a lack of data to analyse and address dropout (Eurydice Report, 2014).
Data on dropout is more widely available in the EU. In the EU-28, overall dropout from education is much higher amongst disabled people (31.5 %) than for non-disabled people (12.3 %). The gap between the two is less marked in Finland, Sweden and Switzerland (less than a 10-point difference). At the other end of the scale, Romania recorded the highest discrepancy: 71 % of those who reported a work limitation caused by a LHPAD (Longstanding health problem or disease) were early school leavers, while only 17 % of those without work limitations were early school leavers. The dropout rate of people aged 18 to 24 with basic activity difficulties (seeing, hearing, walking, and communicating) in the EU-28 varied widely, from 11 % in Sweden to more than 60 % in Turkey and Bulgaria (Eurostat, 2014).
Dropout and early school leaving rates are also a matter of concern in Luxembourg. Based on data compiled by the national ANED Report 2016, the dropout rate of disabled and non-disabled students in Luxembourg (24%) is just slightly above the EU average at 22.4 % (Limbach-Reich, 2016a).
0
10
20
30
40
50
60
70
80
90
100
Po
rtug
al
Fin
land
Jap
an
Ne
w Z
ea
land
Ne
the
rlan
ds
Ko
rea
De
nm
ark
Italy
Lith
uan
ia
Ge
rma
ny
Slo
ve
nia
Au
str
ia
Isra
el
Ice
lan
d*
Ca
nad
a*
Hu
nga
ry
Latv
ia
Ch
ile
EU
22
avera
ge
Ch
ina
OE
CD
avera
ge
No
rwa
y
Slo
va
k R
ep
ub
lic
Po
lan
d
Un
ite
d S
tate
s
Sp
ain
Czech
Rep
ublic
Luxe
mb
ourg
Sa
ud
i A
rab
ia
Co
lom
bia
Indo
nesia
Sw
ed
en
Tu
rke
y
Bra
zil
Arg
en
tina
*
Co
sta
Ric
a
Me
xic
o
Russia
n F
ed
era
tio
n
So
uth
Afr
ica
Upper secondary graduation rates
Over 25 years old Below 25 years old Total
%
Young adults with special educational needs (SEN) / 2016
9
Figure 5. Early school leavers aged 18-24 EU28 and Luxembourg
Source: EUSILC UDB 2013 – version 2 August 2015.
The Luxembourg Ministry for Education, Childhood and Youth (MENJE) estimates that 11.6 % of the cohort 2012/2013 left school early (taux de décrochage théorique)6, and other recent data indicate that early school leaving will continue to rise considerably in Luxembourg (Gouvernement du Grand-Duché de Luxembourg, 2015).
At the same time, higher education attainment has increased in Luxembourg, with half in the age group 25 to 54 having attained a tertiary degree, compared with 28.5 % in the age group 55 to 74 (Powell et al., 2017). However, Luxembourg has a high proportion of grade repeaters in general education, and of extended durations in upper secondary education, with only 40 % of students completing on time. One of the first attempts to reduce school dropout was the ‘School integration act’ (Loi du 28 juin 1994 sur l’integration scolaire), which paved the way for pupils with disabilities to attend mainstream education. Three years later, support was added by the ambulatory services that provide remedial teaching and supplemental instruction for integrated pupils (Arrêté Grand-Ducal du 9 janvier 1998). The Act of Primary Schooling in 2009 (Loi du 6 février 2009), reorganised and renamed these ambulatory services as multi-professional teams (“équipes multiprofessionnelles”, EMP). The mandate of EMP professionals is to collaborate with general teachers, remedial teachers, and other professionals who temporarily assist students in both primary and secondary education. The Act of 15 July 2011 (Loi du 15 juillet 2011) specified accommodations and adaptations in post-primary schooling, with a particular aim to enabling students with special needs to pass examinations.
Luxembourg has also established several special education centres. The Centre de Logopedie provides support and assistance for pupils with hearing and speech impairments from the nursery (precoce) up to secondary level. Other special education centres offer special support to pupils with visual impairments, those on the autistic spectrum, have psychological issues, or have physical impairments. For youth aged 16 and older, vocational training centres (CPP) offer special programmes to learn a suitable vocation; students with learning disabilities participate widely in these official programmes. At the level of secondary education, many schools offer “mosaic classes” (classes mosaïque) to prevent alienation and
6 This theoretical dropout rates are based on pupils just before the end of compulsive school age attending (or dropping out from) regular schools.
22.4%24%
10.9%
16.5%
0.0%
5.0%
10.0%
15.0%
20.0%
25.0%
30.0%
EU 28 average Luxembourg average
Early school leavers
Disabled young people (18-29) Non-disabled (18-29)
Young adults with special educational needs (SEN) / 2016
10
drop-out7. The first such classes were formed in 2005 and received their legal basis in 20098. The classes offer individualised support and behaviour management to reintegrate students with behavioural problems into their initial class, or into a class more appropriate to their needs (Bonifacas, 2014). A special school “Verhalen, Testen an Trainéieren” (VTT) was opened in 2012, which offers an academic programme and supervision for a small groups of youth aged between 11 and 15 years with serious behavioural problems and who are at risk of dropping out of school (Script INFO). While first evaluations of the programme have been undertaken, the data available is insufficient to judge the programme’s success.
The Canadian Ministry of Education (Ministere de l’Education, du Loisir et du Sport) in 2013 presented seven operating principles to reduce dropout in secondary education:
1. IDENTIFICATION AND SUPPORT: Students who exhibit early signs of dropping out are identified and supported.
2. STUDENT-TEACHER RELATIONSHIPS: Teachers establish good relationships with Secondary IV and V students.
3. AFFECTIVE AND COGNITIVE ENGAGEMENT: Teachers foster students’ affective and cognitive engagement.
4. PLANS FOR FUTURE: Students have educational plans or pursue occupational goals.
5. THE SCHOOL AS A COMMUNITY: Students have a strong feeling of belonging to their school.
6. THE PARENTS’ CONTRIBUTION: Parental support with respect to students’ perseverance in their studies and their academic and vocational guidance is recognized and encouraged by the entire school staff.
7. SCHOOL ORGANIZATION: Flexibility provided by The Education Act, the Basic school regulation, and other framework legislation is used to adapt school organization to potential dropouts and students returning to their studies.9
These general guidelines may help to initialize prevention and first steps to reduce dropout, but it remains unclear whether the principles can be adequately measured or attained; e.g. “students have a strong feeling of belonging to their school” is not only difficult to ascertain, but also difficult to achieve in a highly competitive environment.
The Eurydice Report (2014) points out how important it is to support first-year students in higher education to improve retention. Providing information, advice and guidance are seen as the key interventions to support student retention and reduce dropout caused by unrealistic expectations in the first year (Eurydice 2014). In mapping the EU countries the Eurydice Report indicates differences in incentives given to higher education institutions to encourage them to pro-actively address dropout.
7 Current research in Luxembourg and Switzerland examines the reasons that well-being in school decreases over time and the process of alienation from school (see Hadjar, A., Backes, S. Gysin, S., 2015). 8 Réglement Grand-Ducal, 2009.
Young adults with special educational needs (SEN) / 2016
11
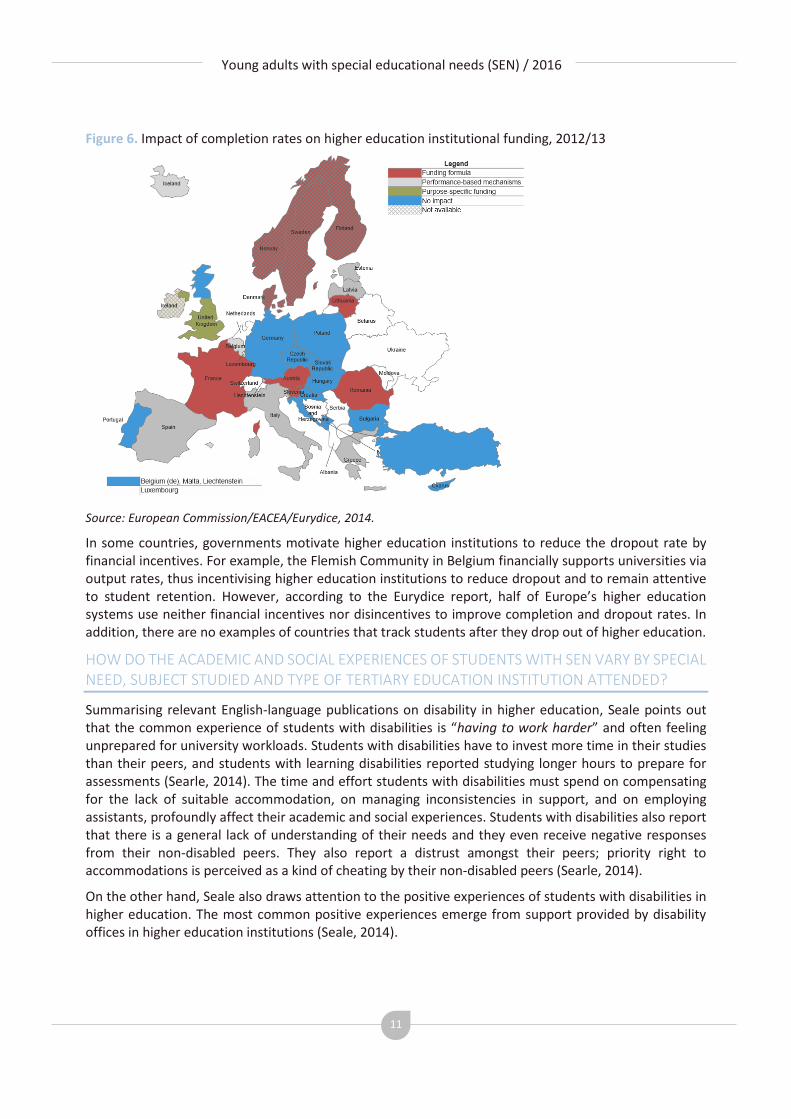
Figure 6. Impact of completion rates on higher education institutional funding, 2012/13
Source: European Commission/EACEA/Eurydice, 2014.
In some countries, governments motivate higher education institutions to reduce the dropout rate by financial incentives. For example, the Flemish Community in Belgium financially supports universities via output rates, thus incentivising higher education institutions to reduce dropout and to remain attentive to student retention. However, according to the Eurydice report, half of Europe’s higher education systems use neither financial incentives nor disincentives to improve completion and dropout rates. In addition, there are no examples of countries that track students after they drop out of higher education.
HOW DO THE ACADEMIC AND SOCIAL EXPERIENCES OF STUDENTS WITH SEN VARY BY SPECIAL NEED, SUBJECT STUDIED AND TYPE OF TERTIARY EDUCATION INSTITUTION ATTENDED?
Summarising relevant English-language publications on disability in higher education, Seale points out that the common experience of students with disabilities is “having to work harder” and often feeling unprepared for university workloads. Students with disabilities have to invest more time in their studies than their peers, and students with learning disabilities reported studying longer hours to prepare for assessments (Searle, 2014). The time and effort students with disabilities must spend on compensating for the lack of suitable accommodation, on managing inconsistencies in support, and on employing assistants, profoundly affect their academic and social experiences. Students with disabilities also report that there is a general lack of understanding of their needs and they even receive negative responses from their non-disabled peers. They also report a distrust amongst their peers; priority right to accommodations is perceived as a kind of cheating by their non-disabled peers (Searle, 2014).
On the other hand, Seale also draws attention to the positive experiences of students with disabilities in higher education. The most common positive experiences emerge from support provided by disability offices in higher education institutions (Seale, 2014).
Young adults with special educational needs (SEN) / 2016
12
As mentioned above, systematical and cross-national studies on experiences of students with disabilities in higher education are rare; only few countries monitor the academic and social experience of students with special needs in tertiary education (Eurydice 2014) (see Figure 9).
Figure 9. National Monitoring of Disability in Student Bodies in Higher Education
Source: European Commission/EACEA/Eurydice (2014, p. 18).
In France, the National Office for Education and Training (Office national d'information sur les enseigne–ments et les professions – Enseignement superieur et handicap) summarises the participation of students with disabilities by type of impairment or disorder, along with their incidence in different programmes (see Table 2).
Table 2. Participation of students with disabilities in higher education in France 2011/2012 Type of disorder Original French terminology Percentage of all students with disabilities Physical Troubles moteurs 24 %
Speech Troubles du langage et la parole 18 %
Metabolism Troubles viscéraux 14 %
Psychological Troubles psychiques 11 %
Sight Troubles visuels 9 %
Hearing Troubles auditifs 6 %
Complex Plusieurs troubles associés 4 %
Metabolism Troubles intellectuels et cognitifs 2 %
Other Autres troubles 12 %
Source: Enseignement Superieur en France10.
France’s Ministry of Higher Education provides additional data that are broken down by kind of disability and level of higher education programme (Table).
Table. Disabled and non-disabled students in higher education by programme in France (2011/2012) BA programmes MA programmes PhD doctorat programmes
Young adults with special educational needs (SEN) / 2016
13
Students with disabilities participate in Bachelor degrees more often than in Master programmes, and generally speaking, the proportions of students with disabilities decrease as qualification levels rise.
In Germany, the DSW (2011/2012) survey included the following data about disability and higher education (Middendorff et al., 2013). While 14 % of all students declare that they have a disability or chronic illness, half of them (7 % of the student body) indicate and attribute problems during their study programme to the barriers that cause disablement. The DSW data suggest that so called “hidden disabilities” are more common, particularly in the female student population, than are physical or sensory impairments (Table 3).
Table 3. DSW survey 2011/2012 percentage of specific disorder/illness by gender
Data from the United States (NCES, 2011) on students who identified themselves to their institution as having a disability indicate that specific learning disabilities (31 % ) are the most frequently reported by higher education institutions, followed by ADD/ADHD (18 %), mental illness/psychological or psychiatric conditions (15 %), and health impairment/condition (11 %) (see Table 4). The overall percentage of students with a disability was estimated to be about 11 %. The NCES database includes undergraduate students from community colleges granting 2-year degrees that are not comparable to Bologna process BA programmes (NCES, 2011).
Table 4. Students with disabilities in US higher education programmes 2009 Type of Disability % of all disabilities
Hearing Difficulty 4 %
Seeing Difficulty 3 %
Speaking Difficulty or language impairment 1 %
Mobility limitation/ orthopedic impairment 7 %
Traumatic brain injury 2 %
Specific learning disabilities 31 %
ADD or ADHD 18 %
Autism Spectrum Disorders 2 %
Cognitive difficulties or intellectual disability 3 %
Health impairment/ condition, including chronic conditions 11 %
Mental illness/ psycho- logical or psychiatric condition 15 %
Source: Raue & Lewis, 2011.
ADHD takes a prominent position here, and indeed ADHD is one of the fastest growing subgroups in the US (Lombardi, Murray, & Dallas, 2013). It is, however, a disorder that is only rarely recorded separately in European data records on higher education. Maggiolini and Molteni (2013) draw attention to the fact that learning disabilities such as ADHD aren’t recognized in higher education in Italy (Maggiolini & Molteni, 2013).
Young adults with special educational needs (SEN) / 2016
14
Turning to the German-speaking universities, Maike Gatterman-Kasper (2014) assessed the impact of different disabilities within higher education.
Table 5. Percentage of disabilities with a negative impact on study programme Type of Disability % of mentions
Again, and like in the DSW survey, ‘hidden disabilities’ rank much higher than sensory disorders in having negative impacts on studies.
WHAT ARE THE EXPERIENCES AND PROGRESSION RATES OF STUDENTS WITH SEN?
Among the clear findings on success and retention rates of students with disabilities, is that they are less likely than students without disabilities both to stay enrolled throughout and to successfully progress in study programmes from level one to level two (Seale, 2014). For example, in France, the percentage of students with disabilities decreases with each increasing level of the programme; expectedly, the majority of students with disabilities are enrolled in BA-programmes.
Figure 7. Students with disabilities and level of tertiary education in France
Students with disabilities in
BA programme Students with disabilities in
Master programme Students with disabilities
in PhD programme
Percentage of all Students with disabilities
80,28 % 18,29 % 1,43 %
Source: MESR-DEGESIP, 2012.
Students with disabilities are less likely to earn higher degrees and find secure employment than non-disabled students. College participation and retention rates lag behind those of non-disabled students. Students with physical disabilities are seen among the most at risk of attrition. The DIUS Report (2009) does, however, list slightly lower non-continuation rates for students with disabilities compared to their non-disabled peers (DIUS Department for Innovation, 2009).
Ebersold (2012) found that students with disabilities are proportionally enrolled more often in undergraduate courses (63 %) than graduate courses. Students with a learning difficulty are enrolled most often in human and social sciences (41.9 %), followed by health professions (16 %). Those with mobility impairments are largely enrolled in sciences and technical courses (50 %). Students with a health problems are more frequently enrolled in law, economics, and management courses (54 %), while students with a sensory disorder are more likely to be enrolled in either human and social sciences (30 %), or in law, economics, and management (30 %).
Young adults with special educational needs (SEN) / 2016
15
Table 6. Enrollment of Students with Disabilities by Subject and Programme
Level of studies
Undergraduate courses 63 %
Postgraduate courses 37 %
Total 100 %
Type of studies
Engineering, manufacturing, building, science and technical courses 21 %
Health sciences 13 %
Human and social sciences 24 %
Trade, economics, management 24 %
Law, judicial sciences 8 %
Others 10 %
Total 100 %
Source: OECD, 2011.
Compiled data from selected European countries on progression rates and experiences of students with disabilities (OECD 2011). The majority of Czech, Danish, and French students with disabilities moved on to tertiary education or found work less than three months after leaving upper secondary school. 57 % of the young adults with disabilities who left upper secondary school in 2007 continued their education or training. Of those not in education or employment, 31 % entered work and 12 % were inactive. Transition data from Norway indicate a 15 % inactivity rate among students with disability, while 38 % are in education or training and 47 % are employed.
Table 7. Progression and activity of students with disabilities post-secondary education
In Germany, the DSW survey (2011/12) showed that over 30 % of temporary dropouts (vorübergehende Studienunterbrechung) are related to disability or chronic illness (Middendorff et al., 2013). Most of the students with disabilities or chronic illness (60 %) indicate a moderate or more serious impediment in fulfilling the requirements of the study programme. More than 25 % of the students with disabilities or illness report serious problems in the programme. Students with psychological/psychiatric disorders experience more difficulty than students with physical health problems (35 % vs. 16 %).
Young adults with special educational needs (SEN) / 2016
16
Figure 8. Disability and negative consequences in studies
Source: DSW Survey, 2011/2012, p. 456.
Luxembourg’s higher education system consists of a number of small post-secondary organizations, but was transformed by the founding of an ambitious national research university in 2003: the University of Luxembourg (Powell, 2013). The number of students self-identifying as disabled at the University of Luxembourg is rising, but remains a relatively small group of about 40 students, which is less than 1 % of the current student population of around 6,200 students (Limbach-Reich, 2016b).
During the enrollment procedure, the majority of students declared physical and sensory impairments, followed by chronic illnesses and psychological issues. Learning disabilities and ADHD were reported less often, although they are prevalent in earlier stages of education and most of these students continue past secondary education. Anecdotal reports and non-systematic data suggest that students with disabilities face challenges and barriers due to limited support and access.
Because countries maintain different conventions in defining what constitutes an impairment or disability, comparability between countries is limited. It also brings into question whether students who graduate from different secondary school systems share a common understanding of impairment and disability; indeed, the share of EUROSTUDENT survey respondents who indicated that they have mobility impairments was less than 3 % in all countries, and respondents who indicated learning disabilities were also uncommon. The percentage of impaired students who self-assessed the severity of their impairments as being “ (quite) a big obstacle” ranged from less than 5 % in Romania to 13% in the Netherlands; Luxembourg was not surveyed (Hauschildt et al., 2015). The issue of cultural background and language is particularly significant at the University of Luxembourg, where students from 100 countries attend, half of the student population is non-native, and three official languages are spoken (German, French, and English).
HOW DO THEIR LEVELS OF QUALIFICATIONS COMPARE WITH THEIR COUNTERPARTS WITHOUT SEN?
Based on ANED (2013) data compilation at the EU-28 level, an estimated 19 % of young disabled persons are early school leavers, compared to 11 % of non-disabled young persons (Grammenos, 2013). The EU average is 12 %. The high rates of early school leavers among young disabled persons indicate that persons with disabilities in aggregate have lower educational attainments than non-disabled persons.
40
26
51
33
39
33
27
35
16
All
Psychologicaldisorder
Somatic chronicillness
weak mediocre serious
Negative consequences for the studies
Young adults with special educational needs (SEN) / 2016
17
Figure 9. Share of early school leavers by disability status, Age 18-24, 2011
Source: Grammenos, 2013, p. 89.
Lower educational achievements for persons with disabilities also indicate the different rates in completion of tertiary education or its equivalent (the EU average is 36 %): 27 % of persons with disabilities have completed tertiary education, compared to 37 % for persons without disabilities. There is also a gender gap: 23 % of men with disabilities aged 30-34 complete tertiary education, whereas 31 % of their female counterparts do. Persons with a severe disability aged 30-34 more rarely attain a higher education degree (15 %) than persons with a moderate disability do (32 %) (Grammenos, 2013).
Ebersold (2008) pointed out some differences in the levels of qualification of disabled and non-disabled students: ‘in general young adults with disabilities continue to experience difficulty in entering tertiary education. In the United States, just 14 % of upper secondary school leavers took an entrance examination for tertiary education in 2001/02, although 47 % wanted to enroll. In the United Kingdom, disabled students remain persistently under-represented in tertiary education. In France, disabilities affecting upper secondary students were strikingly different from those of disabled students in tertiary education: in upper secondary education in 2005/06, a significant majority of disabled students (66 %) presented physical deficiencies including those of a visceral, metabolic or nutritional kind (32 %), motor impairment (17 %) or sensory impairment (17 %). During the 2006/07 academic year, out of those students in tertiary education who disclosed a disability or health-related problems, 20.6 % had health problems, 20.3 % had musculoskeletal disorders, 13.9 % were visually impaired, 10.8 % had hearing deficiencies, 11.2 % predominantly psychological disorders, 8.2 % language problems such as dyslexia, and 5.3 % a temporary disability’ (Group of National Experts on Special Needs Education, 2008, pp. 11). The National Experts continue by providing enrolment data that students with disabilities are more likely participating in study programmes maintaining looser links with the labour market than those that enroll non-disabled students. Examples of disproportionally higher enrolments of students with disabilities have been reported in Germany (21 % of disabled students enrolled in social sciences/pedagogy/psychology); in Switzerland (21.9 % in theology); in France (36 % in languages or humanities), and, according to the
0
10
20
30
40
50
60
PL SI CZ SK NL FI LT AT BE EE FR EL DE DK LU SE CY HU PT EU BG RO LV ES IT MT HR UK
Share of early school leavers by disability status
Persons with disabilities Persons without disabilities Europe 2020
Young adults with special educational needs (SEN) / 2016
18
data from the Higher Education Statistics Agency (HESA)11 compiled by the DIUS Department for Innovation (2009) in the United Kingdom, where 12.5 % of the students with disabilities are enrolled in art and design. Additional data from the Netherlands suggest that 50 % of disabled students fall behind in their studies, and that they are more likely to drop out from professional higher education (Group of National Experts on Special Needs Education, 2008).
At the University of Luxembourg, no other data is available to compare the level of qualification (bachelor, master, PhD) of students with or without disabilities. The National Employment Development Agency (ADEM) reports that, as in other countries, persons with disabilities who are looking for a job are less educated than non-disabled job-seekers. The ADEM (2016) reports that 63 % of unemployed persons with disabilities have a low qualification level, and only 6 % of jobseekers with disabilities have graduated with a tertiary education degree (Schlesser, 2016).
EXTENT OF EUROPEAN TERTIARY EDUCATION INSTITUTIONS BECOMING MORE INCLUSIVE
The OECD report (2003) points out that in 1990 one could observe rising enrolment of students with disabilities in many OECD countries: Sweden, France, and Germany were singled out (OECD, 2003). In 2008, Serge Ebersold compiled a new OECD study with data from several European and other OECD countries to compare pathways to higher education for students with disabilities. The report concluded that ‘some countries have already readjusted their education system so that due regard is paid to the subsequent possible pathways offered to students with disabilities when they leave upper secondary school, and have established an institutional framework specifically to address the issue of transition. Others have concentrated on ensuring that their system focuses on the life chances of disabled students at the end of compulsory education, in preference to factors governing the conduct of upper secondary education and the transition to tertiary education. Yet others have begun to refocus their education system so that the different paths leading to tertiary education and employment are more stable and secure’ (Ebersold, 2008, p. 19-20). Based on this literature review, Ebersold emphasizes the importance of curricula to help students acquire the competences, ethical faculties, and the social and physical skills needed to make decisions for which they can assume responsibility, and to develop the sense of belonging required to interact with others on an equal footing. Encouraging participation in extracurricular activities, or artistic, sports or voluntary activities, may enable students with disabilities to overcome problems, make decisions and assume responsibility for themselves. Ebersold (2008) also recommends joint planning that professional staff can undertake with young disabled adults that addresses matters relevant to their transition, and which encourages them to develop professional goals and greater awareness of the demands of working life or the academic world, and to be ready to identify their needs. This is a strong pledge for service centers for students with disabilities at higher education institutions (Ebersold, 2008b; Group of National Experts on Special Needs Education, 2008).
Global trends on increasing enrolment of students with disabilities in higher education:
Table 8. Development in of Inclusive Higher Education, Select Countries Country Increase of enrolment
United States 1987- 2003, from 9.2 % to 1996-2007: 10.8 %
Young adults with special educational needs (SEN) / 2016
19
Country Increase of enrolment
Germany 2003 to 2006 from 15 % to 18.5 % ; 14 % in 2012/12
France 2000 to 2006 from 0.2 % to 0.4 %; 1 % in 2013
Danmark 2004 – 2006 from 0.5 % to 0.7 %.
Norway 2004 – 2006 from 0.5 % to 0.7 %.
Italy (Maggiolin & Molteni) 2013: 0.9 % 13
Source: OECD, (2008) and OECD, (2011); Maggiolini & Molteni (2013, p. 251).
The Europe 2020 strategy aims to increase, to at least 40 %, the proportion of 30-34 year olds having completed tertiary or equivalent education. This target arises from the conviction that tertiary education is a major driver of economic competitiveness and growth (OECD, 2008). To reach this target, access to tertiary education — which generally requires a secondary education diploma in most European countries — was expanded and alternative pathways to tertiary education have been created (e.g. introduction of alternatives to diplomas such as recognition of prior qualifications and learning experiences).
Figure 10. European policy approaches to widening tertiary education participation 2012/13
Source: European Commission/EACEA/Eurydice (2014, p. 16)
In some countries, the tertiary policy approaches include general measures (corresponding quotas, positive discrimination, financial support, etc.) for specified groups (i.e. students from families with less-
12 The DSW Survey 2011/12 reports 7 % students with disabilities. In contrast S. Ebersold (2008, 27): In Germany, the proportion of those who said they had a disability or chronic illness increased from 12.5 % in 2003 (DSW, 2004) to 18.9 % in 2006 (DSW, 2008). 13 ‘In Italy learning difficulties are not considered a disability’ (Maggiolini & Molteni, 2013, p. 255).
Young adults with special educational needs (SEN) / 2016
20
educated parents, gender, students from particular regions, etc.); however, with the sole exceptions of Ireland and Estonia, disability and SEN are not mentioned in the Eurydice (2014) report. Furthermore, the strategic framework for European cooperation in education and training (ET2020, 2009) does not mention disability explicitly, nor do the majority of other policy documents stemming from it (Council of the EU, 2009)14.
Rising tertiary completion rates for disabled persons indicate that higher education institutions may have become more inclusive during the past years: ‘We may observe a continuous improvement of the situation of persons with disabilities. The disability gap of 14 percentage points in 2010 has been reduced to 10 percentage points in 2011’ (Grammenos, 2013, p. 7).
Many European universities have indeed become more inclusive. Yet students with disabilities do not benefit equally, as primarily students with physical and sensory impairments have benefited from accommodation and support measures, and yet, many campuses continue to lack social and structural accessibility.
REMAINING BARRIERS AND WHAT NEEDS TO BE CHANGED IN THE FUTURE? HOW CAN TERTIARY EDUCATION INSTITUTIONS BE BETTER PREPARED TO WIDEN ACCESS, BETTER CATER TO STUDENTS WITH SEN AND FOSTER THEIR PROGRESSION?
Remaining barriers and challenges concern all relevant cluster types of students with SEN: They are related to:
disclosure of disability; access to information and awareness of support that is available; criteria and entitlement of support;
resources for special needs (specific materials, accommodation, counseling); barriers to learning, such as effects of an impairment or medical condition, physical environment,
availability and effectiveness of educational support; teaching style, teachers’ attitudes and relations with SEN students and assessment methods.
Disability disclosure may be a difficult decision for students, carrying with it the risk of labeling and stigmatism. Disability officers often encounter students with disabilities opposed to disclosing their disability, preferring to withhold the information from their peers and professors. Armineh Soorenian (2013) claims that despite a general recognition of the importance of the social model of disability, the individual, medical, and paternalistic models of disability continue to exert a strong influence in higher education. Proposed solutions have often been inadequate and made little structural impact.
Maike Gattermann-Kasper (2014) identifies some of the reasons students do not take advantage of or abandon reasonable accommodations in higher education. The first reason is simply that students do not know about the possibilities of getting appropriate accommodations at the university. Students do not want to be treated differently, do not know they are eligible, or are simply too shy or prefer to be discreet with their personal information (see Unger et al. 2012).
14 ANED (2014): Annotated review of European Union law and policy with reference to disability; Synthesis Report for the Academic Network of European Disability Experts Prepared by Janina Arsenjeva, under the direction of Professor Lisa Waddington. http://www.disability-europe.net/content/aned/media/Legal%20mapping%20-%20August%202016_ready%20for%20WEB.doc.
Young adults with special educational needs (SEN) / 2016
21
Table 9. Why students waive reasonable accommodations? Reasons to waive resonable accommodations Percentage
Don’t know the option 57
Don’t want to be treated special 44
Don’t believe of being eligible 43
Too shy to ask staff 37
Discretion preference 33
Too shy to go to the concerned office 32
Don’t know for sure whether being eligible 31
Don’t know anybody to ask for counselling or assistance 26
Too much additional work 16
Measure not helpful 14
Need already previously unconsidered 4
Request already previously rejected 1
Other reasons 4
Source: Unger et al., 2012, p. 191.
In addition, Fuller, Bradley, and Healey (2004) report cases of university staff not making accommodations for students’ disability-related needs and unhelpful staff behaviour.
Barriers to accessibility persist even in Luxembourg, which is one of Europe’s wealthiest countries and has several national disability acts. Luxembourg’s national research university enjoys a state-of-the-art new campus at Esch-Belval, yet this former steel factory has not been remodeled sufficiently to be regarded as best or even good practice in universal design. The lack of essential guides for persons with visual impairments, and serious barriers on campus and inside the buildings, hamper the movement and inclusion of students with mobility impairments. The national accessibility legislation is not strict enough to provide barrier-free access for all. The law allows exceptions from the application of the requirements of accessibility for technical, budgetary or historical reasons (protection of historical heritage) and there are no effective sanctions if the requirements of the act are disregarded. The National Action Plan (2012)
stressed these challenges, suggested essential improvements in accessibility, and affirmed the obligation to respect the principles of design for all. However, the proposed actions are still works in progress (Limbach-Reich & Powell, 2016).
A joint initiative of counselors and disability officers of the Universities of the Greater Region (UniGR) provided a Charta on Studying with a Disability in the Greater Region. Consisting of seven articles, the Charta aims to enable students with disabilities to participate in exchange programmes on an equal basis and to benefit from accommodations and support across national and cultural borders.
Mandy Hauser and Saskia Schuppener (2015) discuss a paradigm shift in the role of universities related to inclusion of students with disabilities. They call for equal and full participation of persons with learning disabilities in all aspects of scientific work, and assign academic staff the roles of assisting and counseling partners. They cite examples of appropriate programmes at Trinity College in Dublin (Hauser & Schuppener, 2015). Clemens Dannenbeck and Carmen Dorrance (2015) believe it is crucial for higher education to turn away from the medical model of disability, and are strongly in favour of inclusive and awareness-raising programmes for and with staff members (Dannenbeck & Dorrance, 2015).
Finally, Weis et al. (2012) point out that there is currently no consensus on operational definitions of specific learning disabilities in higher education. This opens the door for abuse in competitive assessment situations. The label of specific learning disabilities offers unfair advantages to students with the sophistication and financial resources to seek out and acquire specific learning disability classification. In
Young adults with special educational needs (SEN) / 2016
22
other words, disabled students may fear being accused of feigning a specific learning disorder to gain undue advantages (Weis, Sykes, & Unadkat, 2012).
The OECD 2011 set up a list of recommendations for more inclusion in higher education:
provide all students, to the greatest possible extent, with the same knowledge and skills; furnish them with qualifications recognized by tertiary education institutions and the labour market; offer them chances of access to the same quality of employment as young adults without disabilities; give them equal opportunities in terms of the length and quality of transitions (OECD, 2011, p. 131).
WHAT WORKS, WHY DOES IT WORK AND HOW DOES IT WORK IN SUPPORTING THIS GROUP TO ATTAIN HIGHER SKILLS AND QUALIFICATIONS?
According to Soorenian (2013), the availability of a social network with both staff and students to support individual students with disabilities is an important factor in maintaining physical and psychological wellbeing, and in limiting the negative effects of stress on health (Soorenian, 2013). Academic success for students with disabilities is significantly affected by attitudes of faculty and their willingness to provide accommodations (Maggiolini & Molteni, 2013).
In 2006, Noelle Kurth and Daryl Mellard evaluated widely used accommodations for students with disabilities in post-secondary education. Subsequent efforts on inclusion in higher education have tried to identify barriers to participation (Kurth & Mellard, 2006). Orr and Hammig Bachman (2009) argue in favour of Universal Design in higher education and underline some basic approaches:
Multiple means of presentation
Inclusive teaching and learner support
Inclusive assessment
Instructor approachability and empathy.
Reed at al. (2011) provide evidence that students with and without learning disabilities benefit from a first-year university preparation course. Students with learning disabilities particularly gained additional confidence in their skills after the preparation course (Reed, Kennett, Lewis, & Lund-Lucas, 2011). Although the authors acknowledge that there is a lack of empirical evidence some measures, Rath & Royer (2002) list the following programmes that many universities have implemented to assist students with learning disabilities:
Assistive technologies and programmes
Program modifications
Direct assistance, and
Therapy and counseling, among others.
Janiga & Costenbader (2002) found that the most frequent measures taken by American colleges to assist students with disabilities were: extended time (88 %); tutors (77 %); note takers (69 %); registration assistance (55 %); text on tape (55 %); adaptive technologies (58 %); and sign language interpretation (45 %) (Janiga & Costenbader, 2002). Kurth and Mellard (2006) found that these measures were effective in 75 % of cases (Kurth & Mellard, 2006), yet Cawthon & Cole (2010) point out that some students don’t use the available measures, and indeed, that students are not always aware of the support measures on offer (Cawthon & Cole, 2010). Wiebke Toebelmann (2014) analysed the extent to which the concept of “university for all” (Hochschule für alle) had been realised in the different Länder in Germany, finding disparities the levels of higher education institutions and at states (Toebelmann, 2014).
Young adults with special educational needs (SEN) / 2016
23
Ebersold (2012) compares support and success factors for Czech, Danish, and French respondents, by type of disability. Table 10. Received support and perceived success factors
Ebersold (2012) discovered that teaching methods are in most cases described as factors that facilitate success by persons with a visual problem (47.8 %), a physical impairment (34.3 %), a cognitive impairment (32.3 %), a psychological disorder (31.3 %) or a learning difficulty (29.4 %), while students with mental health problems or severe disabilities may lack appropriate teaching and support from the university and may need considerabe support of their families. Overall, support from family and friends was primarily described as a factor in attainment by young adults with disabilities who had a psychological disorder (63.2 %) or several disabilities (63.2 %), whereas the regular assessment of progress was highlighted above all by respondents with a hearing problem (38.5 %) and a physical impairment (20.5 %) (Ebersold, 2012).
FINAL REMARKS Supporting young adults with special educational needs in obtaining higher qualifications is an ambitious, desirable, and noble project, occasionally labeled ‘university for all’ or ‘full inclusion in higher education’. There is a risk that beyond inclusive rhetoric, universities persist in being perceived by national policymakers and also perceive themselves as elitist institutions only accessible for highly-educated and highly-skilled persons that, temporarily able-bodied, will likely be successful in labour-market competitions and so promise to provide returns on the investments in their higher education. Debate is necessary about whether the motivation of inclusion endeavours is about inclusion and increasing the capabilities of individuals with disabilities or rather more about national economic growth and international competitiveness. While some students with disabilities will manage to adapt to the existing, barrier-filled systems of higher education, especially as reasonable accommodations and universal design principles diffuse, but there will be other students still barred from campus. Those potential students labeled incompatible with existing employment opportunities are still excluded from higher education. Bearing in mind this risk, the rhetoric of ‘university for all’ has to be reconsidered. At the same time that many public universities are seriously challenged by reductions in state funding, universal design becomes more important worldwide, and the UN Convention on the Rights for People with Disabilities mandates accessibility at all levels of learning, including higher education.
Young adults with special educational needs (SEN) / 2016
24
With the implementation of alternative pathways towards higher education, several points of discussion arise. Seale notes, for instance, that there is little agreement about what constitutes good or ‘best practice’ and there is too little evidence that the measures currently introduced are effective (Seale, 2014). Helen Knauf discusses three scenarios regarding inclusion in higher education: the barrier-free environment university; the university as a diversity management driven organization; and the concept of an inclusive university. The realization of an inclusive university requires profound changes in universities and diversifying their goals beyond purely scientific excellence (Knauf, 2015), where and when that can be measured. The ‘university for all’ recognizes differences and dis/abilities and turns diversity into an asset in establishing a community of learners. The question is how we can change higher education and our societies to be more inclusive and thus lessen those aspects of higher education that have so often led to (institutionalized) discrimination.
Young adults with special educational needs (SEN) / 2016
25
REFERENCES Arsenjeva, J., Waddington, L., Annotated Review of European Union Law and Policy with Reference to Disability: Synthesis Report, prepared for Academic Network of European Disability Experts, 2016. http://www.disability-europe.net/content/aned/media/Legal%20mapping%20-%20August%202016_ready%20for%20WEB.doc
Becker, U., Die Inklusionsluge. Behinderung im flexiblen Kapitalismus, Bielefeld: transcript Verlag, 2015.
Bonifacas, L., Presentation of the classes IPDM and classes mosaïque, Overview of the policy in the field of intervention, 2014. http://www.lbas.lv/upload/stuff/201403/prezentacija_nr6.pdf.
Cawthon, S. W.; Cole, E. V., Postsecondary Students who have a Learning Disability: Student Perspectives on Accommodations Access and Obstacles. Journal of Postsecondary Education and Disability, 23(2), 112-127, 2010.
Commission/EACEA/Eurydice, E., Modernisation of Higher Education in Europe: Access, Retention and Employability, 2014. Eurydice Report. Retrieved: http://eacea.ec.europa.eu/education/eurydice/documents/thematic_reports/165EN.pdf
Council of the European Union, Council conclusions of 12 May 2009 on a strategic framework for European cooperation in education and training (‘ET 2020’). Official Journal of the European Union, C 119/2, 2009.
Dannenbeck, C.; Dorrance C., Wir auch? Auch wir? Wie die UN-BRK in der Hochschule ankommt, Teilhabe, 54(1), 32-35, 2015.
DIUS, DIUS Research Report 09/06: Disabled Students and Higher Education, London: UK Department for Innovation, Universities and Skills, 2009.
Ebersold, S., Adapting Higher Education to the Needs of Disabled Students: Development, Challenges and Prospects, Paris: OECD, 2008a.
Ebersold, S., Pathways for People with Disabilities Towards Tertiary Education and Employment. Preliminary Findings from a Literature Review Covering Selected OECD Countries, Paris: OECD, 2008b.
Ebersold, S., Transitions to Tertiary Education and Work for Youth with Disabilities, Education and Training Policy, Paris: OECD, 2012.
Ebersold, S.; Schmitt, M. J.; Priestley, M., Inclusive Education for Young Disabled People in Europe: Trends, Issues and Challenges: A Synthesis of Evidence from ANED Country Reports and Additional Sources, 2011. http://www.disability-europe.net/.
Education policy committee, Patghways for People with Disabilities towards Tertiary Education and Employment. Preliminary Findings from a Literature Review covering selected countries, Paper presented at the OECD Conference Informal workshop 22 October 2008, at, Paris. http://www.oecd.org/officialdocuments/publicdisplaydocumentpdf/?cote=EDU/EDPC/SEN(2008)10&docLanguage=En.
European Commission/EACEA/Eurydice, Modernisation of Higher Education in Europe: Access, Retention and Employability 2014, Eurydice Report, Luxembourg: Publications Office of the European Union, doi:10.2797/72146, 2014. http://eacea.ec.europa.eu/education/eurydice/documents/thematic_reports/165EN.pdf.
Young adults with special educational needs (SEN) / 2016
26
European Union Council, ‘Council conclusions of 12 May 2009 on a strategic framework for European cooperation in education and training ("ET 2020")’, Official Journal of the European Union, 2009. http://eur-lex.europa.eu/legal-content/EN/TXT/PDF/?uri=CELEX:52009XG0528(01)&from=EN.
Eurostat, Disability statistics - access to education and training, 2014. http://ec.europa.eu/eurostat/statistics-explained/index.php/Disability_statistics_-_access_to_education_and_training.
Fuller, M.; Bradley, A.; Healey, M., Incorporating Disabled Students within an Inclusive Higher Education Environment. Disability & Society, 19(5), 455-468, 2004.
Gattermann-Kasper, M., Nachteilsausgleiche fur Studierende mit Beeinträchtigungen bei Lehrveranstaltungen, Prufungen und Fristen – Ein Überblick, Inklusion–online.net, p. 1-2, 2014. http://www.inklusion-online.net/index.php/inklusion-online/article/view/213/214.
Gouvernement du Grand-Duché de Luxembourg, Education in numbers, 2012/2013, 2015.
Grammenos, S., European comparative data on Europe 2020 & People with disabilities, report prepared on behalf of the Academic Network of European Disability Experts (ANED), 2013. Retrieved from http://digitalcommons.ilr.cornell.edu/cgi/viewcontent.cgi?article=1569&context=gladnetcollect.
Group of National Experts on Special Needs Education, Pathways for People with Disabilities towards Tertiary Education and Employment. Preliminary Findings from a Literature Review Covering Selected Countries, Paper presented at the OECD Workshop on 22 October 2008. Paris: OECD. http://www.oecd.org/officialdocuments/publicdisplaydocumentpdf/?cote=EDU/EDPC/SEN(2008)10&docLanguage=En
Hadjar, A.; Backes, S.; Gysin, S., School Alienation, Patriarchal Gender Role Orientations and the Lower Educational Success of Boys, A Mixed-method Study, Masculinities and Social Change 4(1): 85-116, 2015.
Handi-U, French Disability Portal, date accessed 26th of September, 2016. http://www.handi-u.fr.
Hauschildt, K.; Gwosć, C.; Netz, N.; Mishra, S, Social and Economic Conditions of Student Life in Europe: Synopsis of Indicators, Eurostudent 5, 2012-15. Bielefeld: W. Bertelsmann, 2015.
Hauser, M.; Schuppener, S., Menschen mit Lernschwierigkeiten an der Hochschule Entwicklungen in Großbritannien, Irland und Deutschland. Teilhabe, 54(3), 100-106, 2015.
Janiga, S. J.; Costenbader, V., The transition from high school to post-secondary education for students with learning disabilities: A survey of college coordinators, Journal of Learning Disabilities, 35(5), 562-468, 2002.
Knauf, H., Paths to Inclusion. Implementing the CRPD in German Higher Education, HSW(1), 21-28, 2015.
Kurth, N.; Mellard, D., Student Perceptions of the Accommodation Process in Postsecondary Education, Journal of Postsecondary Education and Disability, 19(1), 71-84, 2006.
Le Gouvernement du grand-duche de Luxembourg [Ministry of Education], Education in numbers and dropout, 2012/2013. http://www.men.public.lu/catalogue-publications/themes-transversaux/statistiques-analyses/enseignement-chiffres/2014-2015-depliant/en.pdf.
Loi du 15 juillet 2011, [School Act of 15 July 2], 2011. http://www.legilux.public.lu/leg/a/archives/2011/0150/a150.pdf.
Young adults with special educational needs (SEN) / 2016
27
Lombardi, A.; Murray, C.; Dallas, B., University Faculty Attitudes Toward Disability and Inclusive Instruction: Comparing Two Institutions’, Journal of Postsecondary Education and Disability, p. 26, p. 3, p. 221-232, 2013.
Limbach-Reich, A., European Semester 2016 Country Fiche on Disability, Academic Network of European Disability Experts Report, 2016a.
Limbach-Reich, A., Unpublished Report of the Service for Students with Disabilities at the University of Luxembourg (based on data of the University student service (SEVE)), 2016b.
Limbach-Reich, A.; Powell, J. J. W., Studieren und Barrierefreiheit. Stolpersteine auf dem Weg zur Barrierefreiheit und wie sie aus dem Weg geräumt werden könnten. Forum für Politik, Gesellschaft und Kultur, 366, 30-33, 2016.
Loi du 15 juillet 2011, [School Act of 15 July 2011], Grand Duchy of Luxembourg, 2011.
Lombardi, A.; Murray, C.; Dallas, B., University Faculty Attitudes Toward Disability and Inclusive Instruction: Comparing Two Institutions. Journal of Postsecondary Education and Disability, 26(3), 221-232, 2013.
Maggiolini, S.; Molteni, P., University and Disability: An Italian Experience of Inclusion. Journal of Postsecondary Education and Disability, 26(3), 249-262, 2013.
MENJE - Ministere de l’éducation et formation nationale [Ministry of Education], Le décrochage scolaire au Luxembourg, Parcours et caractéristiques des jeunes en rupture scolaire, Causes du décrochage, année scolaire 2012/2013. http://www.men.public.lu/catalogue-publications/secondaire/statistiques-analyses/decrochage-scolaire/decrochage-12-13/fr.pdf.
MESR-DEGESIP - Ministère de l'Enseignement Supérieur et de la Recherche - Direction Générale de l'Enseignement Supérieur et de l’Insertion Professionnelle (2012). Recensement des étudiants en situation de handicap, Année universitaire 2010-2011 et évolutions, 2012. https://www.sup.adc.education.fr/handiu_stat/doc/rec2011-2012.pdf.
Middendorff, I.; Apolinarski, B.; Poskowsky, J.; Kandulla, M., N.; Netz, N., Die wirtschaftliche und soziale Lage der Studierenden in Deutschland 2012. 20. Sozialerhebung des Deutschen Studentenwerks (DSW). Berlin: DSW, 2013.
NCES, Digest of Education Statistics, 2011. Washington, DC: National Center for Education Statistics, U.S. Department of Education, 2011. https://nces.ed.gov/fastfacts/display.asp?id=60.
OECD, Education at a Glance: OECD Indicators, Paris: OECD, 2016.
OECD, Inclusion of Students with Disabilities in Tertiary Education and Employment, Education and Training Policy, Paris: OECD, 2011.
OECD, Pathways for People with Disabilities towards Tertiary Education: Preliminary Findings from a Literature Review Covering Selected OECD Countries (EDU/EDPC/SEN 2008/10), Paris: OECD, 2008a.
OECD, Tertiary Education for the Knowledge Society, Vo.1., 2008b. http://www.oecd.org/education/skills-beyond-school/41266690.pdf.
OECD, Disability in Higher Education. Paris: OECD, 2003.
Orr, A. C.; Hammig Bachmann, S., Inclusive Postsecondary Strategies for Teaching Students with Learning Disabilities: A Review of the Literature. Learning Disability Quarterly, 32(3), 181-196, 2009.
Young adults with special educational needs (SEN) / 2016
28
Powell, J. J. W., Hochschulbildung und Forschung in Luxemburg [Higher Education and Research in Luxembourg]. In University of Luxembourg/Ministry of Education (Ed.), Bildungsbericht, Luxemburg, [National Education Report, Luxembourg] (pp. 109-118), Luxembourg: Université du Luxembourg/MENJE, 2015.
Powell, J. J. W., From Ableism to Accessibility in the Universal Design University, The Review of Disability Studies 8(4): 29–41, 2012.
Pwell, J. J. W., Founding the Inter/National University of Luxembourg in the Bologna Era. In: Margue, M. (Ed.), Université du Luxembourg 2003–2013. Luxembourg: University of Luxembourg, 2013, 22–27.
Powell, J. J. W.; Felkendorff K.; J. Hollenweger., Disability in the German, Swiss, and Austrian Higher Education Systems. In: Gabel, S.; Danforth S. (Eds.): Disability and the Politics of Education: An International Reader, New York: Peter Lang, 517–540, 2008.
Powell, J. J. W.; Limbach-Reich, A.; Brendel, M., Grand Duchy of Luxembourg. In M. Wehmeyer, L. & J. Patton, R. (Eds.), The Praeger International Handbook of Special Education (in press), 2017.
Projet de Reglement Grand-Ducal, (Réglement Grand-Ducal du 22 mai, 2016), draft version of the legislative proposal. Grand Duchy of Luxembourg, 2016.
Rath, K. A.; Royer, J. M., The Nature and Effectiveness of Learning Disability Services for College Students. Educational Psychological Review, 14(4), 353-381, 2002.
Raue, K.; Lewis, L., Students With Disabilities at Degree-Granting Postsecondary Institutions Washington, DC: National Center for Education Statistics, 2011.
Recueil delegislation [Act on accessibility], N 43, 2001. http://www.legilux.public.lu/leg/a/archives/2001/0043/a043.pdf#page=2.
Reed, M. J.; Kennett, D. J.; Lewis, T.; Lund-Lucas, E., The relative benefits found for students with and without learning disabilities taking a first-year university preparation course. Active Learning in Higher Education, 12(2), 133-142, 2011.
Réglement Grand-Ducal 25 March 2009, Classe mosaique, Association momentanée Imprimerie Centrale 2009. http://www.legilux.public.lu/leg/a/archives/2009/0067/a067.pdf.
Réglement Grand-Ducal 22 Mai 2006, L'obtention du grade de doctorat de l'Université du Luxembourg, 2016.
Reupert, A.; Hemmings B.; Connors, J., Do We Practice What We Preach? The Teaching Practices of Inclusive Educators in Tertiary Settings. International Journal of Teaching and Learning in Higher Education. 22, 2, 120-130, 2010. Schlesser, I., In: Thery, P., ‘Les salariés handicapés sont 4 000 à travailler’, L'essentiel, 2016. http://www.lessentiel.lu/fr/news/luxembourg/story/10902262.
Script INNO, Cellule de compétence pour l’innovation pédagogique et technologique, Projects: Izigerstee VTT. http://portal.education.lu/inno/PROJETS/ArtMID/2494/ArticleID/137/Izigerstee-VTT.
Seale, J. K., E-Learning and Disability in Higher Education. Accessibility Research and Practice. London: Routledge, 2014.
Service rè-èducatif ambulatoire (SREA), https://www.gouvernement.lu/804617/sra.pdf.
Sierck, U., Budenzauber Inklusion. Neu-Ulm: AG Spak, 2013.
Soorenian, A., Disability, Higher Education and Disabled International Students. Disabled International Students in British Higher Education: Experiences and Expectations, Rotterdam: Sense Publishers, 2013.
Young adults with special educational needs (SEN) / 2016
29
Supple, B.; Abgenyega, J., 'Developing the Understanding and Practice of Inclusion in Higher Education for International Students with disabilities/ Additional Needs : A Whole Schooling Approach', International Journal of Whole Schooling, 7(2), 92-108, 2011.
Toebelmann, W., Wie weit ist die Hochschule für Alle? DSW JOURNAL 4, 16-17m 2014.
UN-CRPD, Convention on the rights of persons with disabilities. New York: United Nations, 2006.
UNESCO, The Salamanca Statement and Framework for Action on Special Needs Education . Adopted by the World Conference On Special Needs Education: Access and Quality. Salamanca, Spain, 7-10 June 1994, 1994.
UniGR (Universities of the Greater Region), Charta 'Universität der Großregion: Bildung, Forschung und Mobilität für alle'/ 'Charte de l’ Université de la Grande Région: Formation, recherche et mobilité pour tous' translated by the author. http://www.uni-gr.eu/fileadmin/Studieren/UniGR_Charta_Handicap_final_de_20131122.pdf.
Unger, M.; Wejwar, P.; Zaussinger, S.; Laimer, A., Beeinträchtigt studieren. Datenerhebung zur Situation Studierender mit Behinderung und chronischer Krankheit 2011, Paper presented at the conference 'Es ist normal verschieden zu sein. Wunsch oder Wirklichkeit? Studieren mit Behinderung/chronischer Krankheit an deutschen Hochschulen im Jahr 2012', 2012.
Fachtagung der Informations- und Beratungsstelle Studium und Behinderung (IBS) des Deutschen Studentenwerks (DSW) am 14./15. Juni 2012 in Berlin, Berlin. http://www.hrk.de/uploads/media/beeintraechtigt_studieren_2011_01.pdf
Weis, R.; Sykes, L.; Unadkat, D., Qualitative differences in learning disabilities across postsecondary institutions’, Journal on Learning Disability, 45(6), 491-502, 2012.
WHO, World Report on Disability. New York: United Nations, 2011.