Surat Basin non–resident population projections, 2015 to 2021 Introduction With the use of fly-in/fly-out and drive-in/drive-out (FIFO/DIDO) work practices, it is common for resource regions to have a large population of non-resident workers who live in the area only while on-shift. This non-resident population is not included in the Australian Bureau of Statistics’ (ABS) official resident population estimates for these areas. To bridge this information gap, Surat Basin non–resident population projections, 2015 to 2021 provides projected numbers of non-resident workers on-shift for local government areas (LGAs) in the Surat Basin region (Figure 1). The report presents three projection series, based on information provided by industry regarding existing operations and future projects. Data tables to supplement the report are available on the Queensland Government Statistician’s Office (QGSO) website (www.qgso.qld.gov.au). Key points Key points of this report include: The non-resident population of the Surat Basin reached 14,490 persons in June 2014, more than four times the number estimated in June 2011 (3,270 persons). This growth was largely influenced by the FIFO/DIDO construction workforces of three coal seam gas (CSG) projects, which are estimated to have peaked in 2014. Three projection series represent a range of potential non–resident population outcomes for the Surat Basin, based on different assumptions about future project and operations workforces. Under all three series, the winding down of CSG construction activity will see the region’s non-resident population decline rapidly in 2014–15. The Series A projection, which represents all existing operations plus projects that have passed final investment decision (FID), indicates that the Surat Basin’s non-resident population will decrease to 3,650 persons by 2021. The Series B projection, which factors in the additional impacts of projects that have had an Environmental Impact Statement (EIS) approved but are yet to reach FID, anticipates the non-resident population of the Surat Basin to fall to 4,460 persons by 2021. The Series C projection, which also includes consideration of projects that have yet to finalise an EIS process, expects the number of non–resident workers on-shift in the Surat Basin to decline to 5,470 persons by 2021. Western Downs (R) will continue to account for the majority of resource industry activity and to have the largest non-resident population of the three LGAs in the region. From a peak of 9,100 persons in 2014, Series A projects the non-resident population of Western Downs (R) to reach 2,450 persons by 2021. The Series B projection for Western Downs (R), which includes approved CSG and other resource projects that have not reached FID, sees a more gradual decrease to 3,250 persons by 2021. The non-resident population of Maranoa (R) is estimated to have peaked at 5,210 persons in 2014, with a projected decrease to 1,020 persons (Series A) or 2,020 persons (Series C) by 2021. The non-resident population of Toowoomba (R) is projected to remain stable at around 180 persons from 2014 to 2021 (Series A), with a potential peak of 490 persons in 2017 (Series C). Due to ongoing uncertainty around FID for the Surat Basin Rail project, none of the projection series for the Surat Basin include consideration of proposed coal mining projects in Western Downs (R). Figure 1: Surat Basin region In this publication, the Surat Basin region is defined as the local government areas (LGAs) of Maranoa (R), Western Downs (R) and Toowoomba (R).
Transcript
Surat Basin non–resident population projections, 2015 to 2021
Introduction
With the use of fly-in/fly-out and drive-in/drive-out (FIFO/DIDO)
work practices, it is common for resource regions to have a large
population of non-resident workers who live in the area only while
on-shift. This non-resident population is not included in the
Australian Bureau of Statistics’ (ABS) official resident population
estimates for these areas.
To bridge this information gap, Surat Basin non–resident population
projections, 2015 to 2021 provides projected numbers of
non-resident workers on-shift for local government areas (LGAs) in
the Surat Basin region (Figure 1). The report presents three
projection series, based on information provided by industry
regarding existing operations and future projects.
Data tables to supplement the report are available on the
Queensland Government Statistician’s Office (QGSO) website
(www.qgso.qld.gov.au).
Key points
Key points of this report include:
The non-resident population of the Surat Basin reached 14,490 persons in June 2014, more than four times the number
estimated in June 2011 (3,270 persons). This growth was largely influenced by the FIFO/DIDO construction workforces of
three coal seam gas (CSG) projects, which are estimated to have peaked in 2014.
Three projection series represent a range of potential non–resident population outcomes for the Surat Basin, based on
different assumptions about future project and operations workforces. Under all three series, the winding down of CSG
construction activity will see the region’s non-resident population decline rapidly in 2014–15.
The Series A projection, which represents all existing operations plus projects that have passed final investment decision
(FID), indicates that the Surat Basin’s non-resident population will decrease to 3,650 persons by 2021.
The Series B projection, which factors in the additional impacts of projects that have had an Environmental Impact
Statement (EIS) approved but are yet to reach FID, anticipates the non-resident population of the Surat Basin to fall to
4,460 persons by 2021.
The Series C projection, which also includes consideration of projects that have yet to finalise an EIS process, expects the
number of non–resident workers on-shift in the Surat Basin to decline to 5,470 persons by 2021.
Western Downs (R) will continue to account for the majority of resource industry activity and to have the largest
non-resident population of the three LGAs in the region. From a peak of 9,100 persons in 2014, Series A projects the
non-resident population of Western Downs (R) to reach 2,450 persons by 2021.
The Series B projection for Western Downs (R), which includes approved CSG and other resource projects that have not
reached FID, sees a more gradual decrease to 3,250 persons by 2021.
The non-resident population of Maranoa (R) is estimated to have peaked at 5,210 persons in 2014, with a projected
decrease to 1,020 persons (Series A) or 2,020 persons (Series C) by 2021.
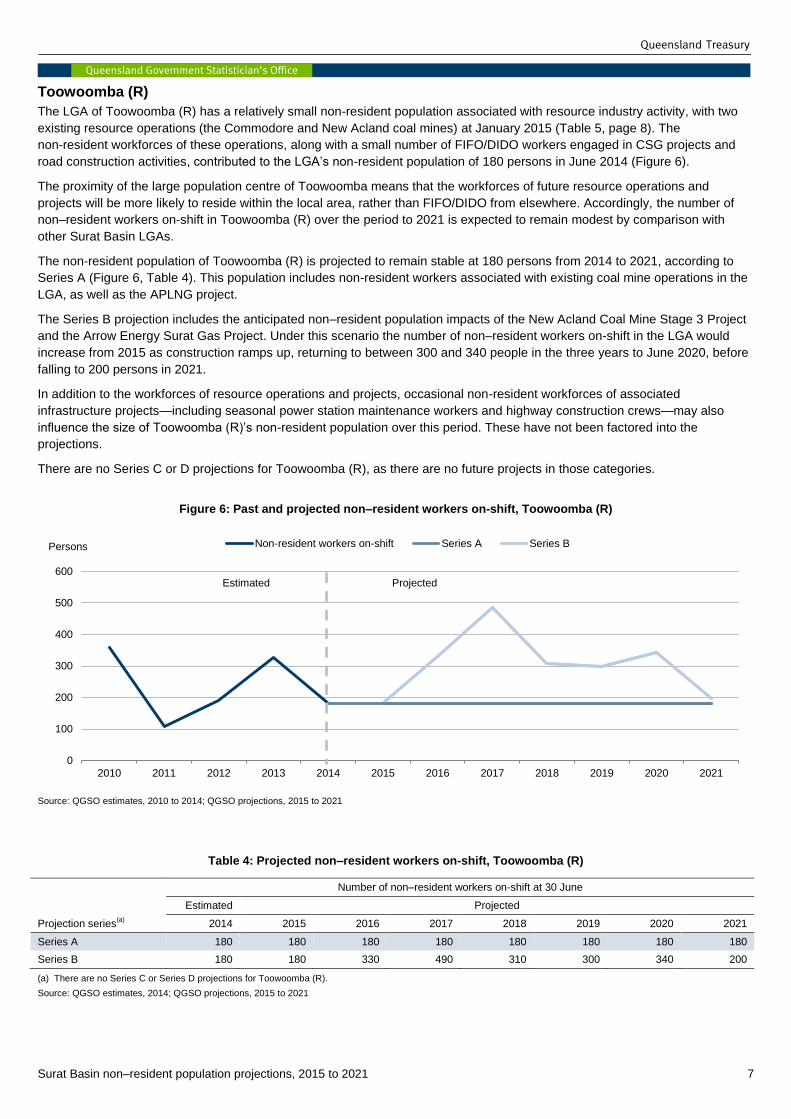
The non-resident population of Toowoomba (R) is projected to remain stable at around 180 persons from 2014 to 2021
(Series A), with a potential peak of 490 persons in 2017 (Series C).
Due to ongoing uncertainty around FID for the Surat Basin Rail project, none of the projection series for the Surat Basin
include consideration of proposed coal mining projects in Western Downs (R).
Figure 1: Surat Basin region
In this publication, the Surat Basin region is defined as the
local government areas (LGAs) of Maranoa (R), Western
Downs (R) and Toowoomba (R).
Surat Basin non–resident population projections, 2015 to 2021 2
Projection methodology
QGSO’s 2015 to 2021 non–resident population projection methodology comprises four different series, which represent a range
of possible outcomes arising from the future development of resource projects and operations in the Surat Basin. Each series
estimates the cumulative non-resident population that would be present in each LGA at 30 June of each year to 2021, should
the operations and projects listed in each category proceed according to advised timeframes and workforce numbers.1
Users of these projections should note that there is a degree of uncertainty about the likelihood of these projects proceeding as
assumed, and as such the projections should be regarded as being indicative scenarios rather than probabilistic predictions.
QGSO does not advocate any of the projection series as being the most likely or favoured outcome. See caveats on page 9 of
this report for further details.
The four projection series are based on the workforces of operations and projects at the time of preparation. Projects are
categorised and included in each scenario according to their standing in the EIS process2.
Series A projection is based on the number of non–resident workers on-shift who were engaged in existing resource
operations and associated infrastructure activities in the area at June 2014. The projection takes into account future
changes to those operational workforces as advised by resource company sources, as well as the estimated non–resident
construction and operational workforces of Category A projects (i.e. those that had reached FID) at the time of preparation.
Series B projection includes the Series A projection plus projected growth in the non-resident population arising from
Category B projects (those that have an EIS approved but have yet to reach FID).
Series C projection includes the Series A and B projections, plus the projected growth in the non-resident population arising
from Category C projects (those that have lodged an EIS, but have yet to proceed through to final approval).
Series D projection includes Series A, B and C projections, plus the projected growth in the non-resident population from
Category D projects (those that have yet to publish an EIS, including projects that have lodged an Initial Advice Statement
(IAS) as well as projects that have yet to begin the approvals process). However, there is no Series D projection for the
Surat Basin in this edition as there are no future projects in Category D.
Where FID for an approved project has been delayed indefinitely by the proponent, it is not possible to give consideration to its
indicative workforce data or project sequencing in the QGSO projections. Such projects, along with other projects that are
dependent on them in order to commence, are designated as Category E and are not included in any of the four projection
series.
1 See the Surat Basin population report, 2014 http://www.qgso.qld.gov.au/products/publications/surat-basin-pop-report/index.php.
2 The projections also include some projects where an EIS is not or may not be mandatory.
Surat Basin future influences
The Surat Basin is emerging as Queensland’s major energy province, as three CSG projects in the region approach production. The CSG
to liquefied natural gas (LNG) industry was responsible for strong employment growth in the Surat Basin LGAs of Western Downs (R) and
Maranoa (R) during 2013–14, as proponents increased their efforts to complete project construction according to schedule1. Much of this
growth took the form of FIFO/DIDO contract labour, which temporarily boosted the size of the region’s non-resident population.
By June 2014, construction of first stage gas gathering and processing facilities for the three CSG projects was well advanced, while all
three trunk pipelines linking the Surat Basin gas fields to port facilities at Gladstone were completed (GasFields Commission, 2014).
The Queensland Curtis LNG (QCLNG) project commenced gas exports from Gladstone in December 2014 (BG Group, 2014).
Construction of a central processing plant (CPP) near Dalby and six field compression stations (FCS) was completed in 2014, while
a further three CPPs and 17 FCS were under construction (Thiess, 2014).
The Gladstone LNG (GLNG) project in Maranoa (R) was more than 85% complete by the end of 2014, with three upstream gas hubs
ready for commissioning. The project is on track for first gas exports in 2015 (GasFields Commission, 2014).
The Australia Pacific LNG (APLNG) project was 76% complete by June 2014, with construction of gas processing facilities near
Miles and Chinchilla finalised. First LNG delivery to Gladstone is expected in mid-2015 (GasFields Commission, 2014).
The construction stage of these projects will wind down rapidly from 2015 onward, and the non-resident population of the Surat Basin is
expected to decline accordingly. The extent of this downturn will depend on the approval and commencement of other gas projects in the
region, most notably:
the Surat Gas project component of the Arrow Energy LNG project, which has been approved but is awaiting FID
the Santos GLNG Gas Field Development project, which lodged an EIS with the Queensland Government in 2014, but has yet to
receive approval or FID.
At January 2015 there were four coal mining operations in the Surat Basin, all producing thermal coal for local markets and for limited
Surat Basin non–resident population projections, 2015 to 2021 3
A full list of existing operations and projects included in each category is available in Table 5 (page 8), and a map of future
projects in the Surat Basin is shown in Figure 2.
Figure 2: Selected future projects(a)
, Surat Basin
(a) Does not include gas field development and expansion projects, or existing gas operations. Future project status is current as at January 2015. See Table 5 (page 8) for a full list of existing operations and future projects by category. Pipelines, rail corridors, and other project locations shown in map are indicative only.
Source: QGSO, 2015
Surat Basin non–resident population projections, 2015 to 2021 4
Projected non–resident workers on-shift, Surat Basin
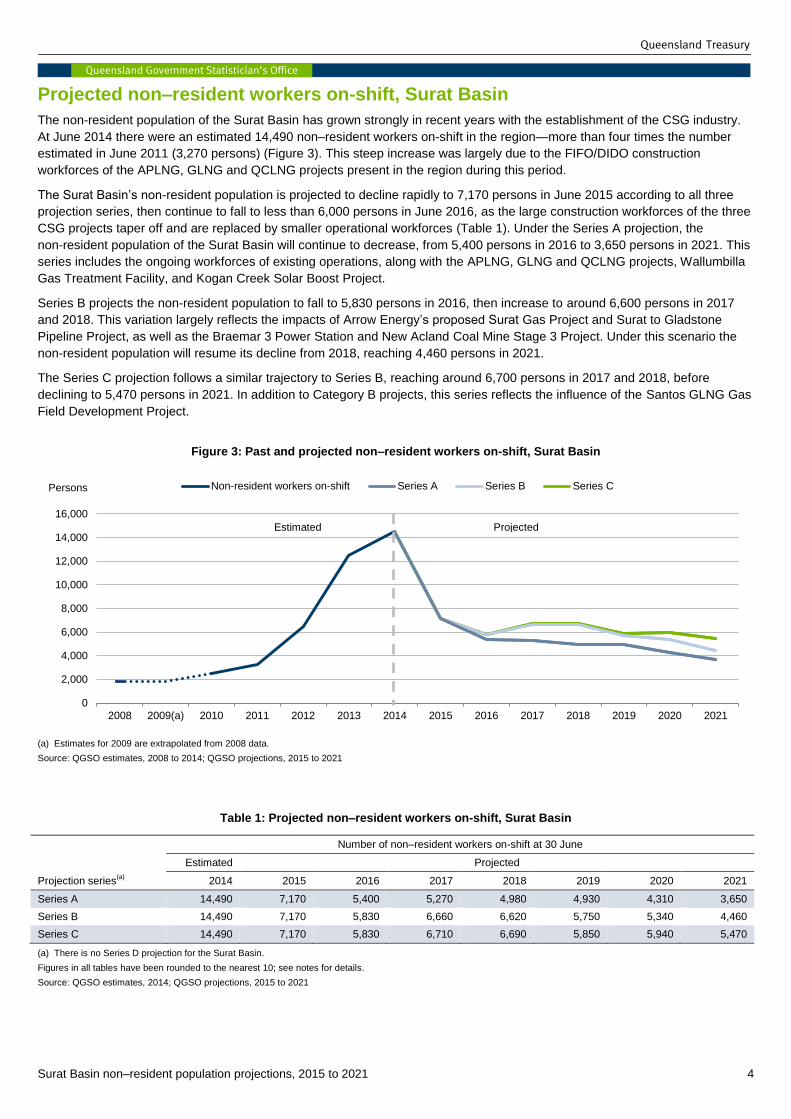
The non-resident population of the Surat Basin has grown strongly in recent years with the establishment of the CSG industry.
At June 2014 there were an estimated 14,490 non–resident workers on-shift in the region—more than four times the number
estimated in June 2011 (3,270 persons) (Figure 3). This steep increase was largely due to the FIFO/DIDO construction
workforces of the APLNG, GLNG and QCLNG projects present in the region during this period.
The Surat Basin’s non-resident population is projected to decline rapidly to 7,170 persons in June 2015 according to all three
projection series, then continue to fall to less than 6,000 persons in June 2016, as the large construction workforces of the three
CSG projects taper off and are replaced by smaller operational workforces (Table 1). Under the Series A projection, the
non-resident population of the Surat Basin will continue to decrease, from 5,400 persons in 2016 to 3,650 persons in 2021. This
series includes the ongoing workforces of existing operations, along with the APLNG, GLNG and QCLNG projects, Wallumbilla
Gas Treatment Facility, and Kogan Creek Solar Boost Project.
Series B projects the non-resident population to fall to 5,830 persons in 2016, then increase to around 6,600 persons in 2017
and 2018. This variation largely reflects the impacts of Arrow Energy’s proposed Surat Gas Project and Surat to Gladstone
Pipeline Project, as well as the Braemar 3 Power Station and New Acland Coal Mine Stage 3 Project. Under this scenario the
non-resident population will resume its decline from 2018, reaching 4,460 persons in 2021.
The Series C projection follows a similar trajectory to Series B, reaching around 6,700 persons in 2017 and 2018, before
declining to 5,470 persons in 2021. In addition to Category B projects, this series reflects the influence of the Santos GLNG Gas
Field Development Project.
Figure 3: Past and projected non–resident workers on-shift, Surat Basin
(a) Estimates for 2009 are extrapolated from 2008 data.
Source: QGSO estimates, 2008 to 2014; QGSO projections, 2015 to 2021
Table 1: Projected non–resident workers on-shift, Surat Basin
Projection series(a)
Number of non–resident workers on-shift at 30 June
Estimated Projected
2014 2015 2016 2017 2018 2019 2020 2021
Series A 14,490 7,170 5,400 5,270 4,980 4,930 4,310 3,650
Series B 14,490 7,170 5,830 6,660 6,620 5,750 5,340 4,460
Series C 14,490 7,170 5,830 6,710 6,690 5,850 5,940 5,470
(a) There is no Series D projection for the Surat Basin.
Figures in all tables have been rounded to the nearest 10; see notes for details.
Source: QGSO estimates, 2014; QGSO projections, 2015 to 2021
Persons Non-resident workers on-shift Series A Series B
Estimated Projected
Surat Basin non–resident population projections, 2015 to 2021 8
Table 5: Resource operations and future projects, Surat Basin
Category(a)
Project / operation name Company name LGA
Existing operations
A Arrow Energy – existing gas operations Arrow Energy Western Downs (R)
A Cameby Downs mine Yancoal Australia Western Downs (R)
A Commodore mine Millmerran Power Partners Toowoomba (R)
A Kogan Creek mine CS Energy Western Downs (R)
A New Acland mine New Hope Group Toowoomba (R)
A Origin Energy – existing gas operations Origin Energy Maranoa (R), Western Downs (R)
A QGC – existing gas operations QGC (BG Group) Western Downs (R)
A Santos – existing gas operations GLNG Operations Maranoa (R), Western Downs (R)
Future projects
A Australia Pacific LNG Project APLNG(b)
Maranoa (R), Toowoomba (R), Western Downs (R)
A Kogan Creek Solar Boost Project CS Energy Western Downs (R)
A Queensland Curtis LNG Project QGC (BG Group)(c)
Western Downs (R)
A Santos GLNG Santos GLNG(d)
Maranoa (R), Western Downs (R), Central Highlands (R)
A Wallumbilla Gas Treatment Facility Santos GLNG(d)
Maranoa (R)
B Braemar 3 Power Station ERM Power Western Downs (R)
B New Acland Coal Mine Stage 3 Project New Hope Group Toowoomba (R)
B Surat Gas Project Arrow Energy Western Downs (R), Toowoomba (R)
B Surat to Gladstone Pipeline Project Arrow Energy Western Downs (R), Banana (S), Gladstone (R)
C Santos GLNG Gas Field Development Project Santos GLNG Maranoa (R), Central Highlands (R)
E Elimatta Project New Hope Group Western Downs (R)
E Ironbark Project Origin Energy Western Downs (R)
E North Surat–Collingwood Coal Project New Hope Group Western Downs (R)
E Surat Basin Rail Project Surat Basin Rail Western Downs (R), Banana (S)
E The Range Project Stanmore Coal Western Downs (R)
E Wandoan Coal Project Wandoan Joint Venture Western Downs (R)
(a) The five categories include existing operations and future projects, grouped according to their status in the EIS process as at January 2015. See methodology (page 2) and caveats (page 9) for further details. There are no Category D projects in the Surat Basin.
(b) Australia Pacific LNG (APLNG) is a joint venture between Origin Energy, ConocoPhillips and Sinopec.
(c) BG Group's Australian business QGC Pty Limited is the operator and majority owner of the Queensland Curtis LNG (QCLNG) project.
(d) Santos Gladstone LNG (GLNG) is a joint venture between Santos, PETRONAS, Total and KOGAS.
Source: QGSO, 2015
Surat Basin non–resident population projections, 2015 to 2021 9
Notes
(R) – Regional Council (S) – Shire
Non-resident workers are people who fly-in/fly-out or drive-in/drive-out (FIFO/DIDO) to work and live in the area temporarily while rostered on, and who have their usual place of residence elsewhere. Non-resident workers include FIFO/DIDO mining and gas industry employees and contractors, construction workers and associated sub-contractors. Figures in this report refer to the number of non–resident workers on-shift, or present in the area at a given point in time, and should not be confused with total non–resident workforce numbers.
CSG/LNG pipeline and rail projects, and some gas field projects, will extend beyond the Surat Basin into neighbouring LGAs. Where this occurs, the population impacts of these projects are included in projections for the Bowen Basin and Gladstone (R) rather than the Surat Basin.
Data in this report are derived from surveys conducted by QGSO in 2014 and other sources. The Survey of Accommodation Providers counted the number of non–resident workers on-shift during the last week of June 2014. See the Surat Basin population report, 2014 http://www.qgso.qld.gov.au/products/publications/surat-basin-pop-report/index.php for further details. The Resource Operations Employment Survey and the Resource Projects Employment Survey gathered workforce information from companies with existing operations or future projects in the Surat Basin as at June 2014. A full list of existing operations and future projects is available in Table 5 of this report.
The total number of non–resident workers on-shift for the Surat Basin represents the aggregate non-resident populations of all LGAs in the region. This total may include a small number of non-resident workers in each LGA who live elsewhere within the Surat Basin. Data for Toowoomba (R) were not collected in 2008. The total number of non–resident workers on-shift in the Surat Basin therefore does not include any non-resident workers that may have been in Toowoomba (R) during the survey period. As no data were collected for the Surat Basin in 2009, estimates for that year are extrapolated from 2008 data.
Figures in tables have been rounded to the nearest 10. As a result of rounding, discrepancies may occur between sums of the component items and totals. Percentages and other calculations are made prior to rounding of figures and discrepancies might therefore exist between these calculations and those that could be derived from the rounded figures.
Data tables to supplement this report are available online at http://www.qgso.qld.gov.au/products/tables/index.php.
References
BG Group (2014) BG Group loads first LNG cargo from QCLNG, 29 December 2014 http://www.qgc.com.au/news-media/NewsDetails?Id=5630
DSDIP (2014) New Acland Coal Mine Stage 3 Project http://www.dsdip.qld.gov.au/assessments-and-approvals/new-acland-coal-mine-stage-3-expansion.html
GasFields Commission Queensland (2014) CSG–LNG Projects Update – as at end of June Quarter 2014 http://www.gasfieldscommissionqld.org.au/resources/gasfields/csg-lng-project-update-jun-2014.pdf
Thiess (2014) Major milestone for QCLNG http://www.thiess.com.au/news/2014/qclng-tackling-the-tyranny-of-distance