83
December 1997 NASA Reference Publication 1404 Surface-Based Observations of Contrail Occurrence Over the U.S., April 1993 - April 1994 Patrick Minnis, J. Kirk Ayers, and Steven P. Weaver

December 1997
NASA Reference Publication 1404
Surface-Based Observations of ContrailOccurrence Over the U.S., April 1993 -April 1994
Patrick Minnis, J. Kirk Ayers, and Steven P. Weaver

National Aeronautics andSpace Administration
Langley Research CenterHampton, Virginia 23681-2199
December 1997
NASA Reference Publication 1404
Surface-Based Observations of ContrailOccurrence Over the U.S., April 1993 -April 1994
Patrick MinnisLangley Research Center, Hampton, Virginia
J. Kirk AyersAnalytical Services and Materials, Inc., Hampton, Virginia
Steven P. Weaver88th Weather Squadron, Wright-Patterson Air Force Base, Ohio
Available from the following:
NASA Center for AeroSpace Information (CASI) National Technical Information Service (NTIS)800 Elkridge Landing Road 5285 Port Royal RoadLinthicum Heights, MD 21090-2934 Springfield, VA 22161-2171(301) 621-0390 (703) 487-4650
Acknowledgments
The data from the Air Force Bases and Army Air Stations weresupplied by Captain Carolyn Vadnais, United States Air Force.The data were transcribed by Theresa Hedgepeth of the ScienceApplications International Corporation, Hampton, Virginia. Thefuel use data were obtained through Karen Sage of ScienceApplications International Corporation, Hampton, Virginia. Thisresearch is supported by the NASA Atmospheric Effects ofAviation Project Subsonic Assessment Program.

Summary
Surface observers stationed at 19 U.S. Air Force Basesand Army Air Stations recorded the daytime occurrence ofcontrails and cloud fraction on an hourly basis for the periodApril 1993 through April 1994. Each observation uses oneof four main categories to report contrails as unobserved,non-persistent, persistent, and indeterminate. Additionalclassification includes the co-occurrence of cirrus with eachreport. The data cover much of the continental U.S.including locations near major commercial air routes. Themean annual frequency of occurrence in unobstructedviewing conditions is 13 percent for these sites. Contrailoccurrence varied substantially with location and season.Most contrails occurred during the winter months and leastduring the summer with a pronounced minimum duringJuly. Although nocturnal observations are not available, itappears that the contrails have a diurnal variation that peaksduring mid morning over most areas. Contrails were mostoften observed in areas near major commercial air corridorsand least often over areas far removed from the heaviest airtraffic. A significant correlation exists between meancontrail frequency and aircraft fuel usage above 7 kmsuggesting predictive potential for assessing future contraileffects on climate. Additional surface observations and aconcerted satellite observation effort are needed to accuratelyassess the climatic effect of aircraft condensation trails.
Introduction
Condensation trails or contrails have become acommon feature in the Northern Hemisphere since WorldWar II. These anthropogenic clouds represent the mostvisible byproduct of jet fuel combustion at high altitudes.The mechanism for contrail formation is complex,depending on a variety of parameters including the type ofjet engine, the sort of fuel, and the ambient temperature andhumidity (Karcher, 1994; Schumann, 1996). The exhaustmay produce numerous sulfate aerosols that act as cloudcondensation nuclei which initiate tiny droplets thatsubsequently freeze. The resulting cloud usually containslarge concentrations of small ice crystals (e.g., Murcray,1970). They generally form at temperatures less than -30°Cat high relative humidities or below -50°C at moderate tolow moisture levels (e.g., Appleman, 1953). If formed inclear air, contrails can spread, developing into cirrusindistinguishable from natural clouds. Their persistence andgrowth depend on the available moisture and ambienttemperature. When aircraft fly through existing clouds theycan produce contrails or distrails (cloud-free trails) dependingon the conditions (e.g., Scorer, 1972). In either case, theyproduce an immediate effect by altering the microphysicalproperties of the existing cloud.
Increases in cloud cover or cloud particle concentrationsdue to contrails can alter the local radiative balance byreflecting more solar radiation and absorbing and emittinglongwave infrared radiation (e.g., Kuhn, 1970). The overalleffect of contrails on climate depends on a number of factorsincluding frequency and timing of occurrence, arealcoverage, lifetime, altitude, location, and microphysicalproperties. The upper troposphere is a relatively clean(aerosol-free) environment so that the addition of highconcentrations of cloud condensation nuclei have thepotential for making a larger impact than they would in thelower troposphere. With commercial air traffic expected toincrease by more than 200 percent by 2015 (Baughcum,1996), the effects of aircraft exhaust on the atmosphere havebecome a subject of considerable interest leading to theNASA Atmospheric Effects of Aircraft Program (AEAP)which has sponsored the Subsonic Assessment (SASS)Project (Thompson, et al., 1996). One of the goals of theAEAP SASS Project is to evaluate the effect of contrailson climate. This paper presents the results of a study ofcontrail occurrence frequencies over the U.S based on recentsurface observations.
Background
Evaluations of contrail coverage or occurrence havebeen made either directly or indirectly from surface andsatellite observations since the 1980's. These efforts havebeen sporadic and generally confined to a few particularareas. Examples of inferred contrail coverage include theconclusions of Chagnon (1981) and Angell et al. (1984)that decreased sunshine and increased cloudiness since 1960and between 1950 and 1972, respectively, are attributable tocontrails. Seaver and Lee (1987) found that the number ofcloudless days over the continental United States (US)decreased significantly for the period 1950-1982 comparedto 1900-1936 possibly due to the appearance of contrailsduring the latter period. In a follow-up study, Angell(1990) found that US cloudiness continued to increasethrough 1988 while sunshine duration decreased. Therelative magnitude of the change in sunshine was not asgreat as the cloudiness increase. This finding suggests anincrease in thin cirrus due, most likely, to contrail-generatedcirrus. Significant decreases in insolation were alsoobserved in Germany during the past 20 to 40 years. Weber(1990) suggested that increased cyclonic activity increasedcloud cover and decreased sunshine over Germany. Liepertet al. (1994) estimated that contrail coverage, based on asurface study of contrails over a single site, was too smallto account for the diminished sunshine. Discrepanciesbetween the conclusions of these various studies highlightthe uncertainties in the current assessment of the climateimpact of contrails.

2
Satellite data have been used in a variety of ways tostudy contrails over larger areas and longer time periods.Joseph et al. (1975) used two photographs from an Earthresources satellite to demonstrate the detection of contrailsfrom space over the Mediterranean. From preliminarystudies of Defense Meteorological Satellite Program(DMSP) imagery, Carleton and Lamb (1986) found thatinfrared (IR) data were more valuable for detecting contrailsthan visible data. Lee (1989) showed that brightnesstemperature differences between the split window channelson the NOAA Advanced Very High Resolution Radiometer(AVHRR) could be used to detect contrails more easily thansimply examining infrared window channel imagery.DeGrand et al. (1990) used the single-channel IR imageryfrom the Sun-synchronous DMSP satellites to develop aclimatology of contrail occurrence over the US for theperiod 1977-1979. Although they provided estimates of therelative magnitudes of the mean seasonal and diurnal cyclesover US, the actual frequencies of occurrence were notreported. Engelstad et al. (1992) added image processingtechniques to the brightness temperature difference imageryto automatically detect contrails without humanintervention. Their method, however, has not yet beenapplied to significant amounts of satellite data. Schumannand Wendling (1993) also developed an automated techniquebut they have reported only preliminary results from 99AVHRR images over central Europe. Bakan et al. (1994)used visual analysis of thousands of quicklook AVHRR IRimages taken over the northeast Atlantic and Europe toestimate contrail cloudiness for 1979-1981 and 1989-1992.They found a distinct seasonal cycle with a southwarddisplacement of the contrail maximum during winter.Maximum contrail coverage in their analysis occurredduring summer centered along the North Atlantic air routes.The coverage increased in that area during the 10-yearinterim. Similar analyses over the air corridors of the UShave not yet been performed. The surface observationsreported here represent the first step to better defining thecontrail-based cirrus coverage over the US.
Nomenclature
AEAP Atmospheric Effects of Aircraft Program
AFB Air Force Base
AVHRR Advanced Very High Resolution Radiometer
c mean annual contrail frequency
DMSP Defense Meteorological SatelliteProgram
f mean annual fuel usage above 7 km, 106 lbs
IR infrared
LAFB Langley Air Force Base
LT local time
M mean contrail frequency
Max1 primary maximum hourly contrail frequency
Max2 secondary maximum hourly contrail frequency
Min minimum hourly contrail frequency
NASA National Aeronautics and Space Administration
NOAA National Oceanographic and Atmospheric Administration
R linear correlation coefficient
RH relative humidity
SASS Subsonic Assessment
Tf monthly average temperature at mean flight level
U.S. United States
US Continental United States
UTC Universal Coordinated Time
WPAFB Wright-Patterson Air Force Base
zp monthly mean tropopause altitude
Data
The U.S. Air Force established a unique network ofsurface observers to develop a climatology of contrailoccurrences over the US for studying contrail formation andforecast models. This dataset was made available to NASAin its raw form: log sheets of hourly meteorologicalobservations with distinct contrail codes or special logsheets used only for recording the contrail codes. Thecontrail observations were listed as one of fourclassifications: no contrails, non-persistent contrails,persistent contrails, and indeterminate contrails. Inaddition, each classifier was qualified as being with orwithout cirrus. Finally, the contrail observations were notalways taken even though weather data were recorded.Thus, there is a no-observation category yielding a total ofnine possible contrail classifications. These contrail codesas well as the sky cover in tenths were transposed to acomputer spreadsheet format for additional analysis.

3
The observation network, comprising 19 U.S. AirForce Bases and Army Air Facilities, was spread over theUS (Figure 1) to determine the spatial variability of contrailformation. The nominal period of observation for thisspecial effort was April 1, 1993 through March 31, 1994.The actual period varied with reporting station. The earliestmonth is January 1993, while the latest is May 1994. Asmany as 15 and as few as 7 months of data were taken at agiven location. Most sites recorded data for 13 months.
Contrail observations were taken every hour at thesame time as the standard meteorological data, but onlyduring the daytime. Nocturnal data were not recordedbecause of the ambiguities associated with taking high-cloud observations in the dark (e.g., Hahn et al., 1995).Sky cover was recorded at most locations for much of theperiod, although the special contrail logs were the onlyavailable data for a few stations. The indeterminatecategory was selected if the sky was overcast below thelevel of cirrus clouds. Persistent contrails were defined forthis study as those extending at least several miles behindthe aircraft with no tendency for dissipation. Anonpersistent contrail is defined as one that tends toevaporate and only extends a short distance behind theaircraft.
Figure 2 shows an example of the raw data in the formof a coded summary of the hourly contrail observations forLangley Air Force Base (LAFB) taken during December1993. At night, no contrail data were taken although cirrusoccurrences were recorded. Indeterminate contrail conditionsdominated during at least 10 days, especially December 4,5, 15, 16, 28, and 29. A period of persistent contrails withcirrus on the 2nd was followed the next day withsporadically persistent and nonpersistent contrails and nocirrus. A few temporary or nonpersistent contrails wereseen early during December 6 followed by several hourswithout contrails or cirrus. After 1200 UTC, cirrusoccurred every hour during the next day with a fewtemporary contrails and 2 hours of indeterminate contrails.
Eglin
Hill
Cairns
Langley
Offut
Whiteman
Loring
Luke
Minot
Kelly
Wright-Pat.
Tinker
Barksdale
Beale
McClellan
Fairchild
Griffis
EdwardsJ
J
J
J
J
J
J
J
J
J
J
J
J
J
J
J
J
J
J
Mt. Home
Figure 1. Contrail observation network, comprised of 19 U.S.
Air Force Bases and Army Air Facilities.
1 D S S S S S S DSDG DS D D D
2 DGDB DGDBDBDGDBDBDS S S
3 G G > B G B S S S S G
4 S S S S S S S S S
5 S S S S S S S S S
6 G > > G G G G G G DG D D
7 S D>DGDSDGDS G DG D>D> D
8 D D S S G G G S G G G DG D
9 B > B B B B S S B B
10 D D DB DBDBDSDSDSDSDS S
11 S S S S G S S S S
12 G G
13 D D D D DB D>DGDGD>DBDGDG DGDB
14 D D D D D D D DB DB G G G G G S S
15 S S S S S S S S S
16 S S S S S S S S S S
17 D D D D D S G > > > D>DGD>D> DBDB D D
18 D DS S S S S DSDS S S S
19 D D D D G DG G G G DGDGDG D>DG
20 D D D D D G DBDBDBDSDSDSDS S
21 S S S S G G G G G
22 D DG DGDG G G B S S S
23 S S S S S S S S G
24 D D D D D G B B S B B G G DSDB D D
25 D D D G S S S S S S S G G
26 D S S
27 D D D D D D D D D S S
28 S S S S S S S S S
29 S S S S S S S S S
30 D D D D D G G G G G G G G D> D D D
31 D D D D D G G G G G > G > G G
1 2 3 4 5 6 7 8 9 10 11 12 13 14 15 16 17 18 19 20 21 22 23 24
Cirrus presentContrails, Persistant
Contrails, Not Persistant
No Contrails
Indeterminant Contrails
DB
S>
G
UTC
Day
Figure 2. Coded summary of Langley AFB December 1993
contrail and cirrus observations.
The other significant periods of persistent contrails includeDecember 9, 10, 14, 20, and 24. Contrails were observedfor a total of 52 hours. They were not observed during 85hours. Persistent contrails account for 65 percent of all ofthe contrail observations. Of these, only 34 percent wereunaccompanied by cirrus.
Figure 3 summarizes the 24-hour, daily observationsover LAFB for the period from March 1993 through April1994. The colors at the top of graph correspond toindeterminate (light gray) and contrail-free cases, while theblack area in the middle registers the percentage of missingand nighttime data. Along the bottom of the graph, thecolors refer to various contrail conditions includingindeterminate contrails with cirrus (gray at bottom). Nodata were taken during November 1993 and January,February, and March 1994. Persistent contrails occurredmost often during a given day in the spring during both1993 (days 110-150) and 1994 (days 465-480) and leastduring the late summer of 1993 (days 190-220). This latterperiod also has the most observations of no contrails withcirrus.
Temperatures and humidities at the standardmeteorological levels were taken from 12-hourly NationalMeteorological Center analyses. These data are available ona 2.5° latitude-longitude grid. They were bi-linearly

4
0%
10%
20%
30%
40%
50%
60%
70%
80%
90%
100%
60 78 96 114
132
150
168
186
204
222
240
258
276
294
312
330
348
366
384
402
420
438
456
474
Day Number (3/93 - 4/94)
Contrails, Persistent Contrails, Persistent, w/CirrusContrails, Not Persistent Contrails, Not Persistent, w/CirrusNo Data Indeterminate ContrailsIndeterminate Contrails, w/Cirrus No ContrailsNo Contrails, w/Cirrus
Figure 3. Summary of daily observations over LAFB for the period from March 1993 through April 1994.

5
interpolated to match the location of each surface site.Only data from July 1993 and January and April 1994 areconsidered here.
Results
The data for each for the contrail categories and thecloud observations were averaged for each month and hourin Coordinated Universal Time (UTC). The seasonal,regional, and diurnal variation of these averages is givenbelow.
Seasonal Variations
Examples of the monthly means are plotted in Figure 4for LAFB. Contrails occurred most frequently during April1993 as ~32 percent of the total observations (Figure 4a).A similar number of contrail observations was reported
during the following April. Nonpersistent contrails weremost frequent during June 1993 and April 1994. Thefewest contrails (~5 percent) were seen during July 1993when cirrus clouds were most abundant. The worst viewingconditions were found during March and December 1993when the indeterminate levels were greatest. Figure 4bcombines the categories into four classes that do notconsider the occurrence of cirrus. The indeterminateclassifications, more easily discerned in this figure,generally correspond to the occurrence frequencies of 90 and100 percent cloud cover (Figure 5a). If indeterminate dataare removed and the classifications are normalized to thenumber of remaining observations, the relative temporalpattern of contrail occurrence remains much the same exceptfor the substantial increase in contrails during December(Figure 4c). These normalized percentages may be a moreaccurate accounting of the contrails because theindeterminate data are almost equivalent to missing data.
J F M A M J J A S O N D J F M A M0
0.2
0.4
0.6
0.8
1
Freq
uenc
y
Month
Contrails, Persistent
Contrails, Persistent, w/Ci
Contrails, Not Persistent
Contrails, Not Persistent, w/Ci
No Contrails
No Contrails, w/Ci
Indeterminate Contrails
Indeterminate Contrails, w/Ci
J F M A M J J A S O N D J F M A M0
0.2
0.4
0.6
0.8
1
Freq
uenc
y
Month
J F M A M J J A S O N D J F M A M0
0.2
0.4
0.6
0.8
1
Freq
uenc
y
Month
a)
b)
c)
Figure 4. Summary of monthly observations for Langley AFB, Virginia from January 1993 to May 1994: (a) relative frequency of
contrails and cirrus, (b) relative frequency and persistence of contrails, and (c) relative frequency of contrails and cirrus with
indeterminate data removed.

6
The months having the most clear days are October andDecember 1993 and April 1994 (Figure 5a). Resultscorresponding to Figure 4 are provided in Appendix A foreach observing site. The missing data evident in Figure 5for November 1993 and for January, February, and March,1994 are not typical for most of the sites. Better samplingwas obtained for 14 other sites.
Table 1 lists the mean contrail occurrences for each siteand the corresponding period of observation. Figure 6shows the means and standard deviations based on monthlyaverages of the combined persistent and nonpersistentcontrails from data like those in Figure 4a which includesindeterminate data. The fewest number of persistentcontrails occurred over Eglin AFB (3.6 percent) and MinotAFB (3.8 percent), while the greatest number were seenover Wright-Patterson AFB (WPAFB; 15.1 percent) andEdwards AFB (14.9 percent). If indeterminate cases areomitted, then contrails were most frequent over WPAFB(28.5 percent) and LAFB (19.9 percent). Without theindeterminate observations, the sites with the fewestpersistent contrails are Eglin (5.1 percent) and Luke (5.4percent) AFB's. Nonpersistent contrails were most oftenobserved over Luke AFB (9.2 percent) and LAFB (~5percent), while the fewest were seen over Kelly AFB. Bothpersistent and nonpersistent contrails are most likely tooccur when cirrus clouds are present. The mean probability
J F M A M J J A S O N D J F M A M0
0.2
0.4
0.6
0.8
1
Freq
uenc
y
Month
0%
10% to 20%
30% to 40%
50% to 60%
70% to 80%
90% to 100%
7 8 9 101112131415161718192021222324 1 2 3 4 5 60
0.2
0.4
0.6
0.8
1
Freq
uenc
y
UTC
a)
b)
c)
JJJJJJJ
J JJ
J F M A M J J A S O N D J F M A M0
20
40
60
80
100
Clo
ud C
over
(%
)
Month
Figure 5. Summary of cloud cover for Langley AFB, Virginia
from January 93 to May 94: (a) relative frequency of cloud
cover, (b) diurnal cycle of cloud cover relative frequency
centered at local noon, and (c) monthly mean cloud cover.
B
B
B
B
B
BB
B
B
B
B
B
B
B
B
B
BB B
Min
otF
airc
hild
Lorin
gG
riffis
Mt.
Hom
eO
ffut
Hill
Wrig
ht P
at.
Bea
leM
cCle
llan
Whi
tem
anLa
ngle
yT
inke
rE
dwar
dsLu
keB
arks
dale
Cai
rns
Egl
inK
elly
0
0.05
0.1
0.15
0.2
0.25
0.3
0.35
Fre
quen
cy
BASE
Figure 6. Means and standard deviations of combined
persistent and non-persistent monthly contrail frequencies,
sites ordered north to south according to latitude.
for seeing a contrail when cirrus are present is 24.8 percent,compared to only 7.3 percent when cirrus are not observed.Contrails are also more likely to persist when cirrus arepresent. When cirrus and contrails occurred together, 75percent of the contrails were classified as persistentcompared to 55 percent when cirrus were absent. Thegreatest monthly variability (Figure 6) occurs overMcClellan AFB, while contrail occurrence over Eglin isconsistently low from month to month.
Figure 7, which summarizes the results in AppendixA, reveals that the maximum contrail occurrence occursbetween January (Figure 7a) and April (Figure 7b) for mostsites. A notable exception is Minot AFB where October(Figure 7d) is the most favored month for contrails.Minimum contrail occurrence is generally found during July(Figure 7c). The seasonal variations in contrail eventsaveraged for all sites are shown in Figure 8. If the eventsare referenced to the total number of observations (Figure8a), then there is a distinct maximum during February andan apparent secondary peak during October. Although theOctober value is statistically different from the Septembermean, it does not differ significantly from the Novemberresult. Overall, contrails are scarcest during July. Ifindeterminate observations are excluded from the total(Figure 8b), the seasonal curve becomes smoother. Themaximum occurs during March or between February andMarch with no secondary peak during October. Regionalvariability is considerable. In absolute terms, it is greatestduring February. If computed relative to the meanoccurrence values, the greatest geographical variabilityoccurs during July and November.

7
0 5 10 15 20 25 30 35 40%
LoringGriffis
Langley
Minot
HillBeale
Cairns
TinkerLuke
Kelly
Whiteman
Edwards
McClellan
Fairchild
Wright Patterson
Barksdale
OffutMountain Home
d) October
Loring
Langley
Luke
Whiteman
b) April
LoringGriffis
Minot
Hill
Tinker
Kelly
Edwards
McClellan
Fairchild
Wright Patterson
Barksdale
OffutMountain Home
LoringGriffis
Langley
Minot
HillBeale
Cairns
TinkerLuke
Kelly
Whiteman
Edwards
McClellan
Fairchild
Wright Patterson
Barksdale
OffutMountain Home
c) July
Loring
Griffis
Eglin
Minot
HillBeale
Tinker
Kelly
Whiteman
Edwards
McClellan
Fairchild
Wright Patterson
Barksdale
OffutMountain Home
a) January
Figure 7. Comparison of persistent contrail frequency with
indeterminate data excluded for several months. a) January.
b) April. c) July. d) October.
Diurnal Variability
Figure 9 depicts the diurnal variations in contrailfrequency over LAFB. The greatest number of contrailswas observed (Figure 9a) during midmorning at 1400 UTC(0900 LT). A broad secondary maximum covers the periodfrom 1800-2100 UTC. Normalization to the total number
BB
B BB
BB
B B
B B B
Jan Feb Mar Apr May Jun Jul Aug Sep Oct Nov Dec
0
0.1
0.2
0.3
0.4
0.5
Mea
n C
ontr
ail F
requ
ency
Month
a)
b)
B
B B
B
B
BB
B B
B BB
Jan Feb Mar Apr May Jun Jul Aug Sep Oct Nov Dec
0
0.1
0.2
0.3
0.4
0.5
Mea
n C
ontr
ail F
requ
ency
Month
Figure 8. Monthly mean persistent contrail frequency for 19
sites. Bars indicate standard deviations: a) All daytime data.
b) Indeterminate data excluded.
of observations (Figure 9b) reveals a substantial peak at2400 UTC. This maximum may not be representative,however, because it is based on a limited sampling of ~110observations (Figure 9a) that are confined to particularmonths. This number of observations is about half of thetotal between 1200 and 2200 UTC. The differences inhourly sampling are primarily due to changes in the daylength with season. It is important to consider thesampling when examining these diurnal results. If onlythose hours having more than 150 samples are considered,the peak contrail frequency remains at 1400 UTC and thefewest contrails occur at 1200 and 1700 UTC. Whenindeterminate data are removed (Figure 9c), the relativediurnal cycle is the same although the morning maximumis enhanced slightly. The primary minima occur at 1200(0700 LT) and 1700 UTC (local noon). Plots of the meanhourly contrail statistics are provided in Appendix B foreach observation site.
By excluding the indeterminate data and using onlythose hours with more than half the maximum number ofhourly samples for each site, it is possible to determine theprimary and secondary diurnal maxima in contrailoccurrence. Here, the primary maximum Max1 is definedas that hour having the greatest contrail frequency. Thesecondary maximum Max2 is the hour with the nexthighest frequency that is at least 3 hours removed from theprimary maximum. The amplitude of these maxima is halfof the difference between a given maximum and theminimum Min divided by the mean total contrailoccurrence M. In Figure 9c, Max1 at 1400 UTC is 39percent and Min is 20 percent at 1800 UTC. The

8
Persistent
Persistent, w/Ci
Not Persistent
Not Persistent, w/Ci
None
None, w/Ci
Indeterminate
Indeterminate, w/Ci
10 1112 13 14 1516 17 18 19 2021 22 23 24 1
050
100150200250300
Hou
rs o
f O
bser
vatio
n
UTC
10 1112 13 14 1516 17 18 19 2021 22 23 24 1
00.2
0.4
0.6
0.8
1
Freq
uenc
y
UTC
10 1112 13 14 1516 17 18 19 2021 22 23 24 10
0.2
0.4
0.6
0.8
1
Freq
uenc
y
UTC
a)
b)
c)
Figure 9. Summary of hourly contrail and cirrus observations
from Langley AFB, Virginia, centered at local noon: (a)
number of observations, (b) relative frequency of occurrence,
and (c) relative frequency of occurrence with indeterminate
data removed.
amplitude of this maximum is 40 percent because M is 24percent (Table 1). The secondary peak at 1800 UTC with amagnitude of 19 percent may not be particularly significant.Table 2 summarizes the diurnal characteristics of contrailfrequency for each site. Loring AFB has the greatestamplitude with Max1 in the evening. The smallestamplitude is 23 percent at Barksdale AFB, also with anearly evening maximum. The average primary andsecondary amplitudes are 58 and 46 percent, respectively.Amplitude does not appear to have a longitudinaldependence. Plots of the primary and secondary maximatimes in Figure 10 also show some interesting features. InFigure 10a, the primary maxima are concentrated between1500 and 1800 UTC and between 2300 and 0100 UTC,while many of the secondary maxima occur between 1800and 2300 UTC. When converted to local time (Figure 10b),the primary maxima cluster around 0900 and 1700 LT,while the secondary peaks primarily occur during theafternoon. Figure 11, a plot of the maxima as a function oflongitude, shows that, except for Loring AFB, the times ofprimary maximum are found near 0830 LT over the easternUS, during the late morning or late afternoon over thecentral US, and during the early morning or late afternoonin the west. The secondary maxima generally fall in theafternoon except for some of the westernmost sites.
12 13 14 15 16 17 18 19 20 21 22 23 24 2501234567
Freq
uenc
y
UTC (hr)
Primary Secondary
(a)
(b)6 7 8 9 10 11 12 13 14 15 16 17 18
01234567
Freq
uenc
y
Local Time (hr)
Primary Secondary
Figure 10. Times of maximum contrail occurrence for the 19
study sites.
H
H
H
H
H
H
H
H
H
H
H
H
H
H
H
H
H
H
H
6
8
10
12
14
16
18
20
125 115 105 95 85 75 65
Loc
al T
ime
(hr)
West Longitude (°)
Primary H Secondary
Figure 11. Longitudinal dependence of times of maximum
contrail occurence
Cloud Cover
The fractional cloudiness frequencies and monthly meanareal cloud coverage are given in Figure 5 for LAFB. Themonthly frequency of a given cloud fraction (Figure 5a) wasdiscussed earlier. The mean annual diurnal variation of eachfractional cloud amount is shown in Figure 5b. The timesare given in UTC, but the abscissa scale is shifted such thatthe hour closest to local noon is at the center of the graph.

9
In this particular case, cloud observations were taken for thecomplete diurnal cycle. Clear skies are most frequent nearlocal midnight (5 - 8 UTC) and seen least often around localnoon (17 - 21 UTC). Both fractional and overcastcloudiness follow a diurnal cycle complementary to theclear skies. The monthly mean cloudiness in Figure 5cvaries from a low in June 1993 to a peak during March1993. The missing months prevent a more completedetermination of the annual cycle. Data corresponding toFigure 5 have been plotted in Appendix C for each site. Nocloud observations were available at five sites: Griffis, Hill,Kelly, McClellan, and Tinker Air Force Bases. Complete24-hour sampling is available at the remaining sites.
The monthly mean cloudiness for the 14 sites withobservations is summarized in Figure 12 with the mean USsurface-observed cloud amounts from Hahn et al. (1986) forthe period 1971-1981. The average for both datasets is ~55percent. In both cases, cloud amount peaks during thewinter with a minimum during late summer and autumnalthough the annual range for the contrail dataset is ~26percent compared to 12 percent from the US average.Figure 13 shows the monthly averages of mean cirrusfrequencies. These results show that cirrus was observedover the surface sites least often during the winter and mostfrequently during the late autumn months. Thus, the cirrusfrequencies are slightly out of phase with the correspondingcloud amounts. Overall, cirrus was observed in ~55 percentof the observations. Figure 13b also plots seasonal meanUS cirrus frequencies based on surface observations during1971-1980 (Hahn et al., 1984). The seasonal meanscorrespond well to the present results for winter and spring.Cirrus clouds were observed 4 and 10 percent more often inthe current dataset than in 10-year average for summer andautumn, respectively. The general agreement between thecloud amounts and cirrus frequencies suggest that theselected sites are representative of the US as a whole.
The mean monthly variations of persistent contrailswith and without cirrus are shown in Figure 14. In general,both curves follow the total contrail seasonal trends seen inFigure 8b. The ratio of seasonal contrail frequencies withcirrus to those without cirrus are 3.1, 4.3, 3.6, and 5.1 forwinter, spring, summer, and fall, respectively. These co-occurrence ratios are consistent with the minimum andmaximum frequencies of cirrus in Figure 13b. Figure 15shows the contrail frequencies as a function of coincidentcloud amount averaged for the sites reporting hourly cloudamounts. Few persistent contrails were seen in otherwiseclear skies (Figure 15a), while cloud amounts near 75percent correspond to the most frequent occurrence ofpersistent contrails. This result is consistent with the
BBB
B
B
B B
BB
B
B
B
B
20
30
40
50
60
70
0 2 4 6 8 10 12
Clo
ud A
mou
nt (
%)
Month
AFB 93-94
1971-81
Fig. 12. Comparison of U.S. climatological average and
contrail-data monthly mean cloud cover.
B B
B
B B B
B
B
B
B
BB
30
40
50
60
70
0 2 4 6 8 10 12
Cir
rus
Freq
uenc
y (%
)
Month
B
B
B
B
BB
B
B
B
B
BB
B
B
B
B
B
Jan-
93Fe
b-93
Mar
-93
Apr
-93
May
-93
Jun-
93Ju
l-93
Aug
-93
Sep-
93O
ct-9
3N
ov-9
3D
ec-9
3Ja
n-94
Feb-
94M
ar-9
4A
pr-9
4M
ay-9
4
30
40
50
60
70C
irru
s Fr
eque
ncy
(%)
Month
a) For all AFB contrail sites
b) Monthly averages
AFB sites
US seasonal mean (1971-80)
Figure 13. Frequency of cirrus occurrence over the contrail-data
sites and the U.S. climatological mean.

10
B
B
B BB B
BB B
B
B
B
J
J
J
J
J
J
J
JJ
J
J
J
J F M A M J J A S O N D0
0.05
0.1
0.15
0.2P
ersi
sten
t Con
trai
l Fre
quen
cy
Month
PC w/o Cirrus
PC w/Cirrus
Figure 14. Monthly mean persistent contrail frequency with
and without cirrus for all 19 surface sites.
frequent occurrence of contrails with cirrus. Conversely,non-persistent contrails were observed most often in almostclear skies (Figure 15b) suggesting that the nonpersistentcontrails form primarily in drier conditions. When allcontrails are considered, the maxima arise in mostly cloudyand partly cloudy conditions with minima in almost clear orovercast conditions and when the cloud fraction is around 50percent (Figure 15c).
Discussion
The occurrence of contrails is primarily determined bytwo factors: the presence of aircraft exhaust and theambient conditions at flight level. An observation of acontrail requires both proper timing and a sufficient line ofsight from the observer to the contrails. These factors andtheir relationships to the observations are discussed here.
Aircraft Fuel Use
A preliminary dataset of fuel usage was developed fromthe estimates of commercial scheduled and other non-scheduled and military air traffic by Baughcum et al. (1993)for May 1990. The data were compiled on a 1° x 1°latitude-longitude grid with a vertical resolution of 1 km. Itwas assumed that the May data are representative of theannual mean. A later analysis by Baughcum (1996)confirms that assumption. Figure 16 shows the mean fuelusage as a function of altitude for the nine 1° boxes centeredover the 19 contrail sites.
The maximum fuel use above the boundary layeroccurs at flight levels between 10 and 12 kilometers.(33,000 - 38,000 ft) for all of the sites. The low-altitudefuel is primarily expended on the runway and during
J
J J J JJJ
J J
J J
0 10 20 30 40 50 60 70 80 90 100
0
0.05
0.1
0.15
0.2
Mea
n C
ontr
ail F
requ
ency
Cloud Amount (%)
J
J
JJJJJ
JJ
J J
0 10 20 30 40 50 60 70 80 90 100
0
0.05
0.1
0.15
0.2
Mea
n C
ontr
ail F
requ
ency
Cloud Amount (%)
J
JJ J
JJ
J
J J
J J
0 10 20 30 40 50 60 70 80 90 100
0
0.05
0.1
0.15
0.2
Mea
n C
ontr
ail F
requ
ency
Cloud Amount (%)
a
b
c
Figure 15. Contrail frequency as a function of cloud amount:
a) Persistent contrails only. b) Non-persistent contrails.
c) All contrails.
02468
101214161820
0 5 10 15 20
Alti
tude
(km
)
Fuel (106 kg)
Fig. 16. Vertical distribution of annual mean fuel use for 3°
latitude-longitude boxes centered over the 19 U.S. contrail
observation sites based on May 1990 data from Baughcum et
al. (1993).
takeoffs. To account for all flight levels in which mostcontrails are likely to occur, the data were summed for allaltitudes above 7 km. The distribution of the sums in
11
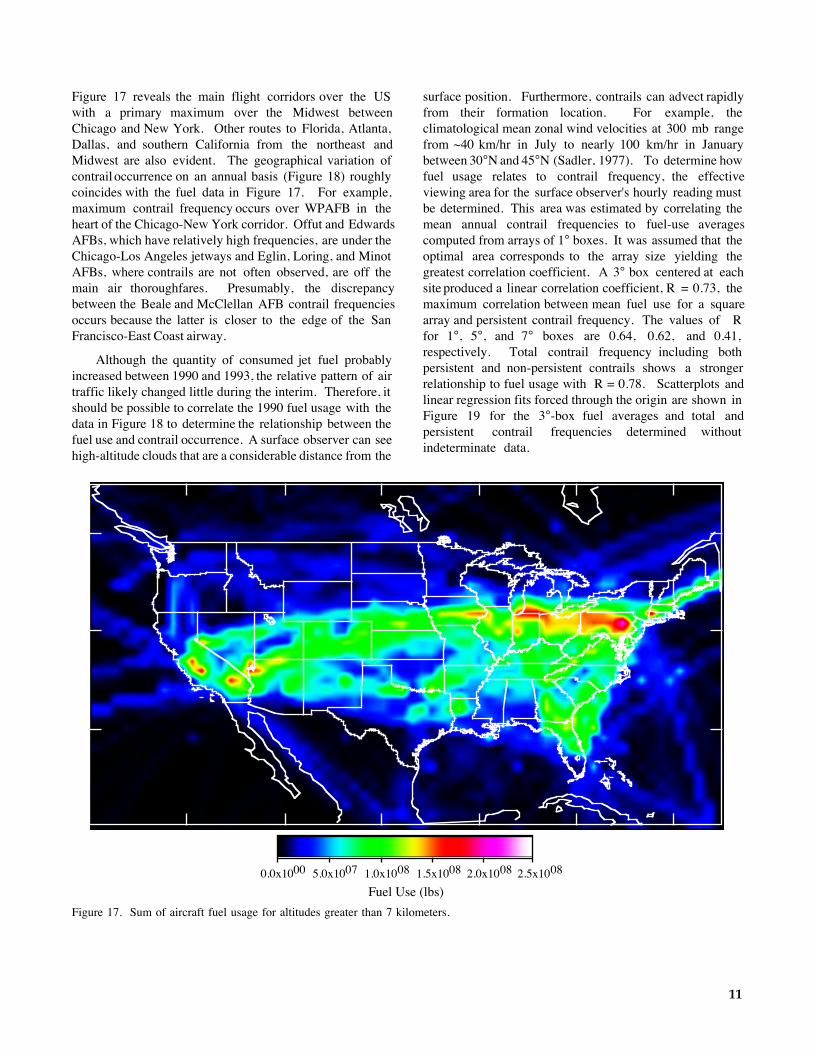
Figure 17 reveals the main flight corridors over the USwith a primary maximum over the Midwest betweenChicago and New York. Other routes to Florida, Atlanta,Dallas, and southern California from the northeast andMidwest are also evident. The geographical variation ofcontrail occurrence on an annual basis (Figure 18) roughlycoincides with the fuel data in Figure 17. For example,maximum contrail frequency occurs over WPAFB in theheart of the Chicago-New York corridor. Offut and EdwardsAFBs, which have relatively high frequencies, are under theChicago-Los Angeles jetways and Eglin, Loring, and MinotAFBs, where contrails are not often observed, are off themain air thoroughfares. Presumably, the discrepancybetween the Beale and McClellan AFB contrail frequenciesoccurs because the latter is closer to the edge of the SanFrancisco-East Coast airway.
Although the quantity of consumed jet fuel probablyincreased between 1990 and 1993, the relative pattern of airtraffic likely changed little during the interim. Therefore, itshould be possible to correlate the 1990 fuel usage with thedata in Figure 18 to determine the relationship between thefuel use and contrail occurrence. A surface observer can seehigh-altitude clouds that are a considerable distance from the
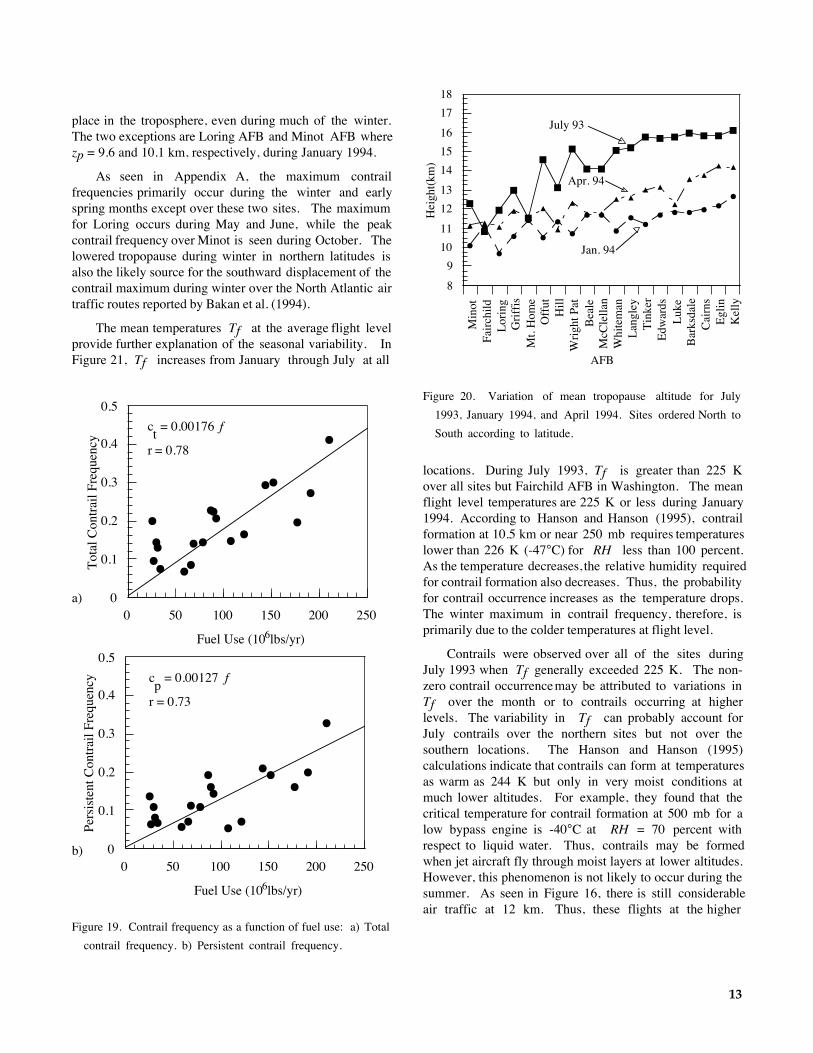
surface position. Furthermore, contrails can advect rapidlyfrom their formation location. For example, theclimatological mean zonal wind velocities at 300 mb rangefrom ~40 km/hr in July to nearly 100 km/hr in Januarybetween 30°N and 45°N (Sadler, 1977). To determine howfuel usage relates to contrail frequency, the effectiveviewing area for the surface observer's hourly reading mustbe determined. This area was estimated by correlating themean annual contrail frequencies to fuel-use averagescomputed from arrays of 1° boxes. It was assumed that theoptimal area corresponds to the array size yielding thegreatest correlation coefficient. A 3° box centered at eachsite produced a linear correlation coefficient, R = 0.73, themaximum correlation between mean fuel use for a squarearray and persistent contrail frequency. The values of Rfor 1°, 5°, and 7° boxes are 0.64, 0.62, and 0.41,respectively. Total contrail frequency including bothpersistent and non-persistent contrails shows a strongerrelationship to fuel usage with R = 0.78. Scatterplots andlinear regression fits forced through the origin are shown inFigure 19 for the 3°-box fuel averages and total andpersistent contrail frequencies determined withoutindeterminate data.
0.0x1000 1.0x10085.0x1007 1.5x1008 2.5x10082.0x1008
Fuel Use (lbs)
Figure 17. Sum of aircraft fuel usage for altitudes greater than 7 kilometers.

12
0 5 10 15 20 25 30 35 40%
LoringGriffis
Langley
Eglin
Minot
HillBeale
Cairns
Tinker
Luke
Kelly
Whiteman
Edwards
McClellan
Fairchild
Wright Patterson
Barksdale
Offut
Mountain Home
Figure 18. Annual mean persistent contrail frequency excluding indeterminate data for 19 surface observation sites.
According to these fits, the mean annual total and persistentcontrail frequencies are
ct = 0.00176 f, (1)
and
cp = 0.00127 f, (2)
respectively, where f is the mean fuel use above 7 km inthe nine 1° boxes centered over a given location. Fuelconsumption is given in 106 lbs yr-1. While thesecorrelations demonstrate the obvious, that the likelihood ofobserving a contrail increases as the number of planes ataltitude increases, it also quantifies, for the first time, therelationship between aircraft fuel usage and contrailfrequency. Moreover, it shows that over the US, fuelexpenditure can account for 61 percent (R2) of the variancein mean annual persistent contrail occurrence and thatcontrail occurrence will increase as air traffic volumeexpands.
Using the mean 3° regional US fuel usage above 7 km,4.8 x 106 lbs yr-1, in Eq. (1) yields a mean occurrencefrequency of 0.085 for the country as a whole. This resultsuggests that, on average, an observer situated at a randomlocation and time in the US will have an 8.5 percent chanceof seeing a contrail if the sky is not totally obscured.Before the commercial jet age began in earnest during the
1960's, contrails were a rare sight. In some regions like themidwestern US, especially during winter, the likelihood ofobserving a contrail is on the order of 40 percent, an almostevery-other-day occurrence.
Meteorological Conditions
Fuel use cannot account for all of the variability incontrail occurrence. Most of the remaining variance isprobably due to the diverse temperature and relativehumidity RH conditions at flight level, although engineand fuel type as well as the operating conditions alsoinfluence contrail formation. While a detailed examinationof the meteorological conditions affecting contrailoccurrence is beyond the scope of this study, monthlyaverages of certain parameters are examined to demonstratehow atmospheric profiles may affect the contrail frequenciesin this dataset.
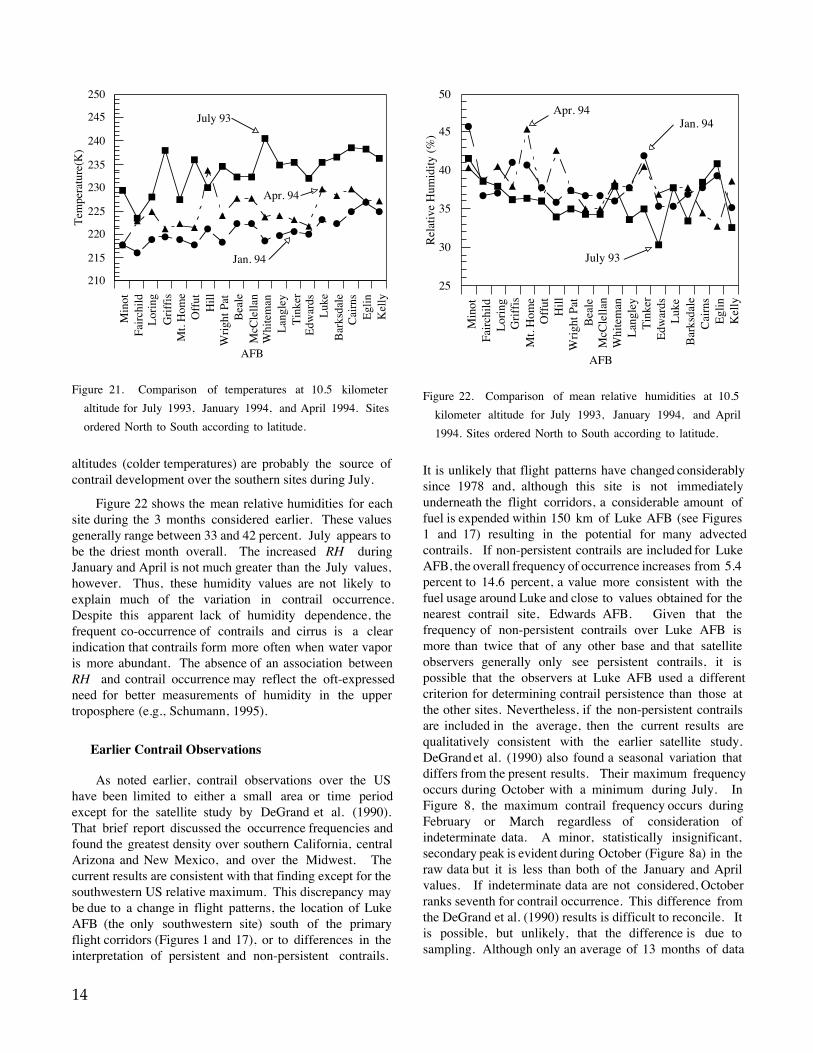
Because of the typically low relative humidities in thestratosphere, a plane is unlikely to produce a significantcontrail if it flies above the tropopause. Figure 20 showsthe variation of mean tropopause altitude zp withobserving site for 3 months. During January 1994, zpvaries from 9.6 km in Maine to over 12 km in Texas.Most of the heights are between 10.5 and 11.5 km. Thetropopause height generally increases during April 1994 tobetween 10.8 and 14 km. During July 1993, the range is10.8 to 16 km. If 10.5 km is assumed to be the averageflight level, then most of the air traffic over the US takes
13
place in the troposphere, even during much of the winter.The two exceptions are Loring AFB and Minot AFB wherezp = 9.6 and 10.1 km, respectively, during January 1994.
As seen in Appendix A, the maximum contrailfrequencies primarily occur during the winter and earlyspring months except over these two sites. The maximumfor Loring occurs during May and June, while the peakcontrail frequency over Minot is seen during October. Thelowered tropopause during winter in northern latitudes isalso the likely source for the southward displacement of thecontrail maximum during winter over the North Atlantic airtraffic routes reported by Bakan et al. (1994).
The mean temperatures Tf at the average flight levelprovide further explanation of the seasonal variability. InFigure 21, Tf increases from January through July at all
J
J
J
J
J
J
J
J
J
J
J
J
J
J
J
J
JJJ
0
0.1
0.2
0.3
0.4
0.5
0 50 100 150 200 250
Pers
iste
nt C
ontr
ail F
requ
ency
Fuel Use (106lbs/yr)
J
J
J
J
J
J
J
J
J
J
J
J
J
J
J
J
JJJ
0
0.1
0.2
0.3
0.4
0.5
0 50 100 150 200 250
Tot
al C
ontr
ail F
requ
ency
Fuel Use (106lbs/yr)
ct = 0.00176 f
r = 0.78
a)
b)
cp = 0.00127 f
r = 0.73
Figure 19. Contrail frequency as a function of fuel use: a) Total
contrail frequency. b) Persistent contrail frequency.
B
B
B
B
B
B
B
B
B B
B B
B B BB B B
B
J
J
J
J
J
J
J
J
J J
J
JJ
J J J JJ
J
H HH
HH
H
H
H
H H
H H
H H
H
HH
H H
Min
otFa
irch
ildL
orin
gG
riff
isM
t. H
ome
Off
utH
illW
righ
t Pat
Bea
leM
cCle
llan
Whi
tem
anL
angl
eyT
inke
rE
dwar
dsL
uke
Bar
ksda
leC
airn
sE
glin
Kel
ly
8
9
10
11
12
13
14
15
16
17
18
Hei
ght(
km)
AFB
Jan. 94
July 93
Apr. 94
Figure 20. Variation of mean tropopause altitude for July
1993, January 1994, and April 1994. Sites ordered North to
South according to latitude.
locations. During July 1993, Tf is greater than 225 Kover all sites but Fairchild AFB in Washington. The meanflight level temperatures are 225 K or less during January1994. According to Hanson and Hanson (1995), contrailformation at 10.5 km or near 250 mb requires temperatureslower than 226 K (-47°C) for RH less than 100 percent.As the temperature decreases, the relative humidity requiredfor contrail formation also decreases. Thus, the probabilityfor contrail occurrence increases as the temperature drops.The winter maximum in contrail frequency, therefore, isprimarily due to the colder temperatures at flight level.
Contrails were observed over all of the sites duringJuly 1993 when Tf generally exceeded 225 K. The non-zero contrail occurrence may be attributed to variations inTf over the month or to contrails occurring at higherlevels. The variability in Tf can probably account forJuly contrails over the northern sites but not over thesouthern locations. The Hanson and Hanson (1995)calculations indicate that contrails can form at temperaturesas warm as 244 K but only in very moist conditions atmuch lower altitudes. For example, they found that thecritical temperature for contrail formation at 500 mb for alow bypass engine is -40°C at RH = 70 percent withrespect to liquid water. Thus, contrails may be formedwhen jet aircraft fly through moist layers at lower altitudes.However, this phenomenon is not likely to occur during thesummer. As seen in Figure 16, there is still considerableair traffic at 12 km. Thus, these flights at the higher
14
B
B
B
B
B
B
B
B
B B
B
B B
B
BBB B
B
JJ
J J JJ
J
J
J J
JJJ J
JJ
JJJ
H
HH
HHH
H
H
H H
H H HH
HHH
H H
Min
otFa
irch
ildL
orin
gG
riff
isM
t. H
ome
Off
utH
illW
righ
t Pat
Bea
leM
cCle
llan
Whi
tem
anL
angl
eyT
inke
rE
dwar
dsL
uke
Bar
ksda
leC
airn
sE
glin
Kel
ly
210
215
220
225
230
235
240
245
250
Tem
pera
ture
(K)
AFB
Jan. 94
July 93
Apr. 94
Figure 21. Comparison of temperatures at 10.5 kilometer
altitude for July 1993, January 1994, and April 1994. Sites
ordered North to South according to latitude.
altitudes (colder temperatures) are probably the source ofcontrail development over the southern sites during July.
Figure 22 shows the mean relative humidities for eachsite during the 3 months considered earlier. These valuesgenerally range between 33 and 42 percent. July appears tobe the driest month overall. The increased RH duringJanuary and April is not much greater than the July values,however. Thus, these humidity values are not likely toexplain much of the variation in contrail occurrence.Despite this apparent lack of humidity dependence, thefrequent co-occurrence of contrails and cirrus is a clearindication that contrails form more often when water vaporis more abundant. The absence of an association betweenRH and contrail occurrence may reflect the oft-expressedneed for better measurements of humidity in the uppertroposphere (e.g., Schumann, 1995).
Earlier Contrail Observations
As noted earlier, contrail observations over the UShave been limited to either a small area or time periodexcept for the satellite study by DeGrand et al. (1990).That brief report discussed the occurrence frequencies andfound the greatest density over southern California, centralArizona and New Mexico, and over the Midwest. Thecurrent results are consistent with that finding except for thesouthwestern US relative maximum. This discrepancy maybe due to a change in flight patterns, the location of LukeAFB (the only southwestern site) south of the primaryflight corridors (Figures 1 and 17), or to differences in theinterpretation of persistent and non-persistent contrails.
B
BB
B B B
BBB B
B
B
B
B
B
B
B
B
B
J
J J
J J
J
J
JJ J
J
J
J
J J
JJ
J
J
H
H
H
H
H
H
H
H
H H
HH
H
HH H
H
H
H
Min
otFa
irch
ildL
orin
gG
riff
isM
t. H
ome
Off
utH
illW
righ
t Pat
Bea
leM
cCle
llan
Whi
tem
anL
angl
eyT
inke
rE
dwar
dsL
uke
Bar
ksda
leC
airn
sE
glin
Kel
ly
25
30
35
40
45
50
Rel
ativ
e H
umid
ity (
%)
AFB
Jan. 94
July 93
Apr. 94
Figure 22. Comparison of mean relative humidities at 10.5
kilometer altitude for July 1993, January 1994, and April
1994. Sites ordered North to South according to latitude.
It is unlikely that flight patterns have changed considerablysince 1978 and, although this site is not immediatelyunderneath the flight corridors, a considerable amount offuel is expended within 150 km of Luke AFB (see Figures1 and 17) resulting in the potential for many advectedcontrails. If non-persistent contrails are included for LukeAFB, the overall frequency of occurrence increases from 5.4percent to 14.6 percent, a value more consistent with thefuel usage around Luke and close to values obtained for thenearest contrail site, Edwards AFB. Given that thefrequency of non-persistent contrails over Luke AFB ismore than twice that of any other base and that satelliteobservers generally only see persistent contrails, it ispossible that the observers at Luke AFB used a differentcriterion for determining contrail persistence than those atthe other sites. Nevertheless, if the non-persistent contrailsare included in the average, then the current results arequalitatively consistent with the earlier satellite study.DeGrand et al. (1990) also found a seasonal variation thatdiffers from the present results. Their maximum frequencyoccurs during October with a minimum during July. InFigure 8, the maximum contrail frequency occurs duringFebruary or March regardless of consideration ofindeterminate data. A minor, statistically insignificant,secondary peak is evident during October (Figure 8a) in theraw data but it is less than both of the January and Aprilvalues. If indeterminate data are not considered, Octoberranks seventh for contrail occurrence. This difference fromthe DeGrand et al. (1990) results is difficult to reconcile. Itis possible, but unlikely, that the difference is due tosampling. Although only an average of 13 months of data

15
was used for the present study, the seasonal results areconsistent for almost all sites over the US and with themeteorological trends. Whether this seasonal cycle istypical on a climatological scale is a question that can onlybe addressed with further observations.
The discrepancy between the DeGrand et al. (1990) andthe current results, however, may arise from the differingviewing perspectives of the satellite and surface observers.The surface observer can easily recognize a thin contrailshortly after its formation. If it undergoes significantgrowth, however, it may be interpreted as a cirrus by asurface observer but could still be recognized as a contrail ininfrared satellite imagery, especially against a warmbackdrop, because of its linear characteristics. Thus,advecting contrails that have had time to grow may often beidentified as cirrus clouds by a surface observer whilecounted as contrails in infrared image analysis. It ispossible that much of the excess cirrus cloudiness detectedin the autumn surface observations relative to climatology(Figure 13b) may be contrail cirrus rather than naturalcirrus. Such an interpretation would be compatible withthe results of Angell (1990) who found that cloudinessincreases over the US were greatest during autumn and weremost likely due to thin cirrus.
Conversely, contrails may be easily distinguishedagainst a blue sky from the surface but may be difficult todetect in morning and evening satellite imagery when thebackground is cold. Because contrails are optically thin,they provide minimal contrast in infrared imagery unlessthe background is significantly warmer than the cloud.Bispectral brightness temperature difference techniques (e.g.,Lee, 1989) rely more on the contrail's small particle sizeand should be more effective for detecting contrails in lowcontrast conditions. Because the Degrand et al. (1990) datawere limited to a single infrared channel, it is probable thatmany contrails were not detected during winter and earlyspring when the background is significantly colder than it isduring summer and autumn. This contrast problem wouldbe exacerbated by the lack of DMSP satellite data during theafternoon when the contrast between clouds and the surfaceis greatest during all seasons. Furthermore, because thesatellite resolution is between 1 and 8 km, only the largestpersistent contrails can be detected. It is possible that thedifferences in the seasonal cycle of contrails are due to acombination of viewing perspective and contrail growth.Coordinated surface and satellite analyses would be neededto better reconcile the differences.
Diurnal Variability
Because the observations were limited to sunlit hours,the diurnal variations are incomplete and the meanfrequencies may be in error. Commercial aircraft frequently
operate at night over the US, especially before localmidnight and after 0600 LT. In particular, contrails fromearly morning flights will be missed in the observationsduring the winter months. Inclusion of nocturnalobservations could change the results for the diurnalstatistics and would affect the overall mean frequencies.Because air traffic is generally heavier during the daytime,the times of maximum contrail occurrence found here areprobably accurate for most of the sites. The minimumhourly frequencies, however, would probably be lower if24-hour observations were used. For the same reasons, themean contrail frequencies would be smaller than the currentdaytime values.
The diurnal maxima seen in Figure 11 may reflect, tosome extent, the timing of flights over the US. Contrailsobserved over a particular site are probably due to flightsthat originated or terminated at least one half hour from thesite because of the time needed to reach or descend fromcruising altitude. Primary morning maxima over the east(75-85°W) suggest that most flights commence early in theday before 0800 - 0900 LT. The secondary afternoonmaxima are probably the result of later originating flightsand the arrival of eastbound flights. A similar breakdownof flights occurs over the west coast with a mixture ofafternoon and morning primary maxima. The number oflong distance flights in either direction plus the north-southtraffic would shift both the primary and secondary peaks tothe late morning and late afternoon over the center of thecountry. The exception to this general pattern is LoringAFB which is primarily affected by US-European air traffic.Much of the eastbound traffic originates during the lateafternoon and early evening for morning arrival while thewestbound flights arrive earlier in the day. While theconnection between flight times and contrail occurrence iscomplex and cannot be fully explained here, theobservations are consistent with the general constraintsimposed by commercial air traffic. A complementaryanalysis of satellite data covering the entire day would helpcomplete the depiction of contrail diurnal variability.
Other Considerations
Relying on the interpretation of surface observers,these data are subject to some errors based on the judgmentof a particular observer. Distinguishing a contrail from anatural cloud can be difficult a short time after the contrail'sformation. As a consequence, some bias towardunderestimation of contrail frequency is probable becauseonly those contrails that can be confidently identified willbe included in the observations. It is unlikely that anyolder contrails missed in the statistics will be offset bycirrus clouds mistaken as contrails. The threshold betweenthe persistent and non-persistent contrails is also subjectiveto some degree and will result in uncertainty in the actual

16
ratio of persistent to non-persistent contrails. It was notedearlier that the high incidence of non-persistent contrailsover Luke AFB compared to other sites may be the result ofdifferent criteria used for determining persistence.
The viewing conditions can also influence the detectionof contrails. Observations represent the conditions at oneinstant. Therefore, the line of sight to contrails may beblocked at a given time by scattered or broken cloudconditions. In overcast situations, this effect is recognizedin the indeterminate category, but it is possible thatcontrails can remain unobserved in other circumstances. Although Figure 15 indicates that persistent contrails weremost often seen during mostly cloudy conditions, it ispossible that the actual frequency is even greater due to line-of-sight obstruction. This effect would also causeadditional underestimation of the true contrail frequency. Inthis analysis, it was assumed that the frequency in theindeterminate cases is the same as in the determinateviewing conditions. This assumption has not been testedyet. Proper accounting for the cases in which the contrailsare potentially obscured will require analyses of satellitedata coincident with the surface observations.
Concluding Remarks
This paper provides the most complete inventory ofcontrail frequencies over the US to date. It is just the firststep, however, in assessing the impact of aircraftcondensation trails on climate. Because only 1 year ofobservations was available, it is not possible tounequivocally conclude that this dataset is a reliableclimatology of US contrails. Data from other years areneeded to develop such a climatological picture. Muchadditional information is also required to confidentlyestimate the radiative effects of contrails. Statisticsregarding the lifetimes, areal coverage, optical properties,and advection of contrails and contrail cirrus are essential toproperly characterize changes in the mean radiation fields.Assessment of climate change due to increasing air trafficappears feasible, however, because of the strongrelationship found between fuel usage and contrailoccurrence and the consistency between seasonalmeteorology and contrails. The contrail dataset presentedhere can be exploited to refine the relationships betweencontrails and fuel consumption and meteorology.Correlations between temperature and humidity fromsoundings coincident with hourly contrail observations willbe critical to empirically quantify the trends found here. Amore detailed seasonal analysis of fuel use and contrailfrequency could be useful for simulating contrail occurrenceover a given location in the US. With supplementalnocturnal data, it may be possible to realistically simulatethe diurnal cycle as well. The hourly observations can also
serve as validation data for coincident satellite retrievals ofcontrail occurrence. Combination of satellite retrievals andthese surface observations will be required to completelydepict the entire diurnal cycle.
Contrails have become a prevalent feature of Americanskies. The relationships established here indicate that theywill become even more common in the future as airlineservice expands. Because contrails add directly to cloudcover, they will affect the radiation budget at somemagnitude. Even if the impact is determined to be small ona global scale, the local effects may still be substantial.Thus, it is important to determine the relationships betweencontrail frequency and changes in cloud cover. This surfaceanalysis of contrails should also be repeated in a few yearswhen air traffic has increased significantly to detect anychanges in contrail occurrence and to test anyprognostication schemes developed from this dataset.Commercial air traffic is growing worldwide with thepotential for an increase in contrails over many areasoutside of the US. To fully assess contrails on a globalscale, their detection and reporting should be made a routinepart of standard meteorological observations. Because theyare a distinct type of cloud, they could easily be included aspart of the cloud type codes currently used in the globalmeteorological observing system. An accurate evaluationof the climatic impact of contrails will require an effort thatcombines surface and satellite observing systems.
NASA Langley Research CenterHampton, VA 23681-0001December 2, 1997

17
Appendix A
Monthly Mean Contrail Frequencies for Each Site

18
J F M A M J J A S O N D J F M A M0
0.2
0.4
0.6
0.8
1F
requ
ency
Month
Contrails, Persistent
Contrails, Persistent, w/Ci
Contrails, Not Persistent
Contrails, Not Persistent, w/Ci
No Contrails
No Contrails, w/Ci
Indeterminate Contrails
Indeterminate Contrails, w/Ci
J F M A M J J A S O N D J F M A M0
0.2
0.4
0.6
0.8
1
Fre
quen
cy
Month
Contrails, Persistent
Contrails, Not Persistent
No Contrails
Indeterminate Contrails
J F M A M J J A S O N D J F M A M0
0.2
0.4
0.6
0.8
1
Fre
quen
cy
Month
Contrails, Persistent
Contrails, Persistent, w/Ci
Contrails, Not Persistent
Contrails, Not Persistent, w/Ci
No Contrails
No Contrails, w/Ci
Figure A1. Summary of monthly observations for Barksdale AFB, Louisiana from January 93 to May 94: (a) relative
frequency of contrails and cirrus, (b) relative frequency and persistence of contrails, and (c) relative frequency of contrails
and cirrus with indeterminate data removed.
a)
b)
c)
19
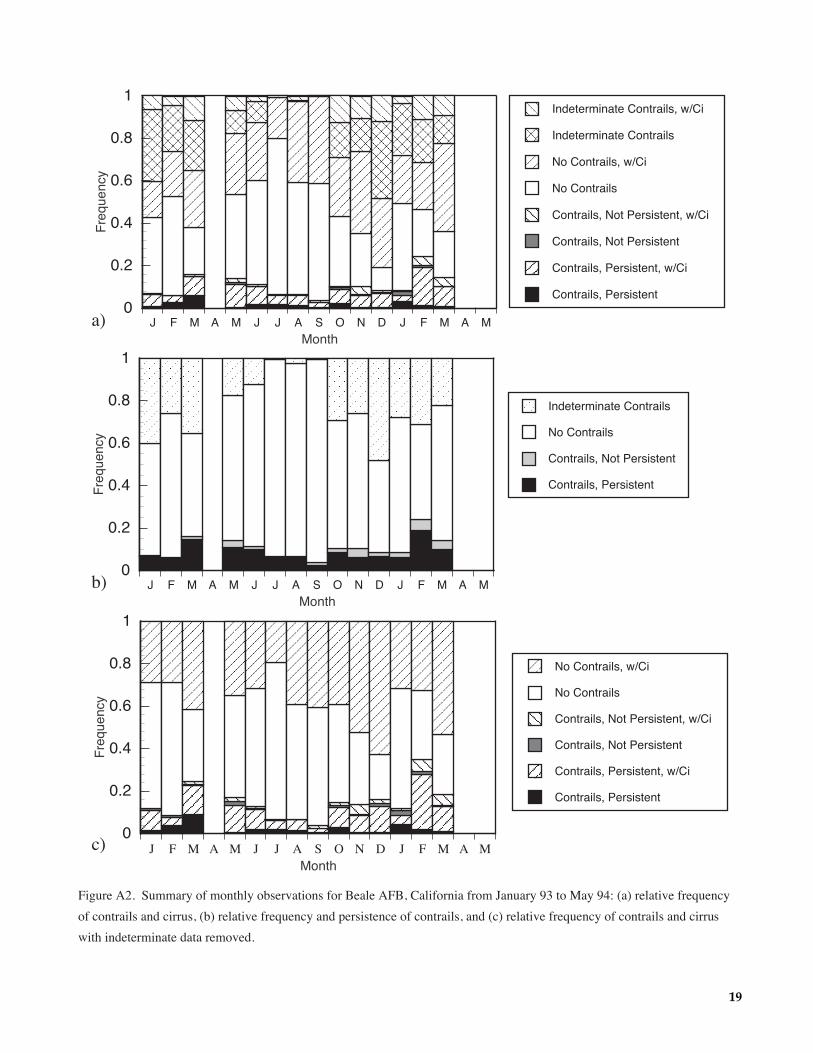
Figure A2. Summary of monthly observations for Beale AFB, California from January 93 to May 94: (a) relative frequency
of contrails and cirrus, (b) relative frequency and persistence of contrails, and (c) relative frequency of contrails and cirrus
with indeterminate data removed.
J F M A M J J A S O N D J F M A M0
0.2
0.4
0.6
0.8
1F
requ
ency
Month
Contrails, Persistent
Contrails, Persistent, w/Ci
Contrails, Not Persistent
Contrails, Not Persistent, w/Ci
No Contrails
No Contrails, w/Ci
Indeterminate Contrails
Indeterminate Contrails, w/Ci
J F M A M J J A S O N D J F M A M0
0.2
0.4
0.6
0.8
1
Fre
quen
cy
Month
Contrails, Persistent
Contrails, Not Persistent
No Contrails
Indeterminate Contrails
J F M A M J J A S O N D J F M A M0
0.2
0.4
0.6
0.8
1
Fre
quen
cy
Month
Contrails, Persistent
Contrails, Persistent, w/Ci
Contrails, Not Persistent
Contrails, Not Persistent, w/Ci
No Contrails
No Contrails, w/Ci
a)
b)
c)
20
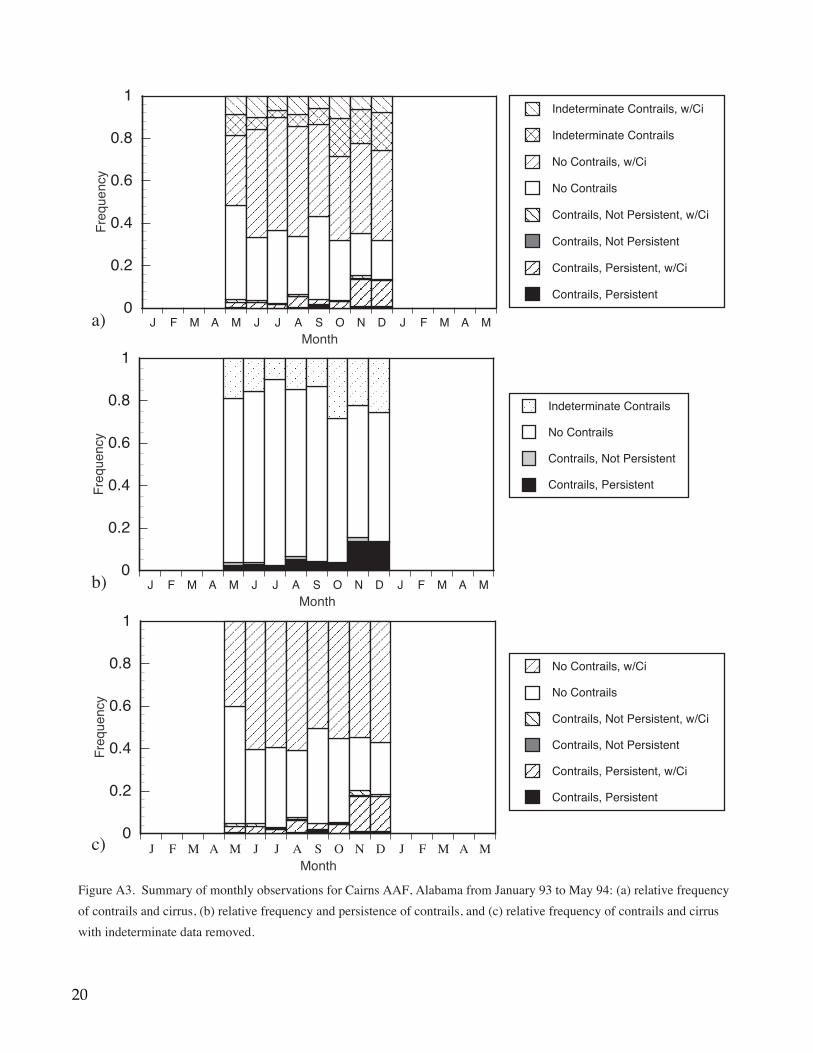
Figure A3. Summary of monthly observations for Cairns AAF, Alabama from January 93 to May 94: (a) relative frequency
of contrails and cirrus, (b) relative frequency and persistence of contrails, and (c) relative frequency of contrails and cirrus
with indeterminate data removed.
J F M A M J J A S O N D J F M A M0
0.2
0.4
0.6
0.8
1F
requ
ency
Month
Contrails, Persistent
Contrails, Persistent, w/Ci
Contrails, Not Persistent
Contrails, Not Persistent, w/Ci
No Contrails
No Contrails, w/Ci
Indeterminate Contrails
Indeterminate Contrails, w/Ci
J F M A M J J A S O N D J F M A M0
0.2
0.4
0.6
0.8
1
Fre
quen
cy
Month
Contrails, Persistent
Contrails, Not Persistent
No Contrails
Indeterminate Contrails
J F M A M J J A S O N D J F M A M0
0.2
0.4
0.6
0.8
1
Fre
quen
cy
Month
Contrails, Persistent
Contrails, Persistent, w/Ci
Contrails, Not Persistent
Contrails, Not Persistent, w/Ci
No Contrails
No Contrails, w/Ci
a)
b)
c)

21
Figure A4. Summary of monthly observations for Edwards AFB, California from January 93 to May 94: (a) relative
frequency of contrails and cirrus, (b) relative frequency and persistence of contrails, and (c) relative frequency of contrails
and cirrus with indeterminate data removed.
J F M A M J J A S O N D J F M A M0
0.2
0.4
0.6
0.8
1F
requ
ency
Month
Contrails, Persistent
Contrails, Persistent, w/Ci
Contrails, Not Persistent
Contrails, Not Persistent, w/Ci
No Contrails
No Contrails, w/Ci
Indeterminate Contrails
Indeterminate Contrails, w/Ci
J F M A M J J A S O N D J F M A M0
0.2
0.4
0.6
0.8
1
Fre
quen
cy
Month
Contrails, Persistent
Contrails, Not Persistent
No Contrails
Indeterminate Contrails
J F M A M J J A S O N D J F M A M0
0.2
0.4
0.6
0.8
1
Fre
quen
cy
Month
Contrails, Persistent
Contrails, Persistent, w/Ci
Contrails, Not Persistent
Contrails, Not Persistent, w/Ci
No Contrails
No Contrails, w/Ci
a)
b)
c)

22
Figure A5. Summary of monthly observations for Eglin AFB, Florida from January 93 to May 94: (a) relative frequency of
contrails and cirrus, (b) relative frequency and persistence of contrails, and (c) relative frequency of contrails and cirrus with
indeterminate data removed.
J F M A M J J A S O N D J F M A M0
0.2
0.4
0.6
0.8
1F
requ
ency
Month
Contrails, Persistent
Contrails, Persistent, w/Ci
Contrails, Not Persistent
Contrails, Not Persistent, w/Ci
No Contrails
No Contrails, w/Ci
Indeterminate Contrails
Indeterminate Contrails, w/Ci
J F M A M J J A S O N D J F M A M0
0.2
0.4
0.6
0.8
1
Fre
quen
cy
Month
Contrails, Persistent
Contrails, Not Persistent
No Contrails
Indeterminate Contrails
J F M A M J J A S O N D J F M A M0
0.2
0.4
0.6
0.8
1
Fre
quen
cy
Month
Contrails, Persistent
Contrails, Persistent, w/Ci
Contrails, Not Persistent
Contrails, Not Persistent, w/Ci
No Contrails
No Contrails, w/Ci
a)
b)
c)

23
Figure A6. Summary of monthly observations for Fairchild AFB, Washington from January 93 to May 94: (a) relative
frequency of contrails and cirrus, (b) relative frequency and persistence of contrails, and (c) relative frequency of contrails
and cirrus with indeterminate data removed.
J F M A M J J A S O N D J F M A M0
0.2
0.4
0.6
0.8
1F
requ
ency
Month
Contrails, Persistent
Contrails, Persistent, w/Ci
Contrails, Not Persistent
Contrails, Not Persistent, w/Ci
No Contrails
No Contrails, w/Ci
Indeterminate Contrails
Indeterminate Contrails, w/Ci
J F M A M J J A S O N D J F M A M0
0.2
0.4
0.6
0.8
1
Fre
quen
cy
Month
Contrails, Persistent
Contrails, Not Persistent
No Contrails
Indeterminate Contrails
J F M A M J J A S O N D J F M A M0
0.2
0.4
0.6
0.8
1
Fre
quen
cy
Month
Contrails, Persistent
Contrails, Persistent, w/Ci
Contrails, Not Persistent
Contrails, Not Persistent, w/Ci
No Contrails
No Contrails, w/Ci
a)
b)
c)

24
Figure A7. Summary of monthly observations for Griffis AFB, New York from January 93 to May 94: (a) relative
frequency of contrails and cirrus, (b) relative frequency and persistence of contrails, and (c) relative frequency of contrails
and cirrus with indeterminate data removed.
J F M A M J J A S O N D J F M A M0
0.2
0.4
0.6
0.8
1F
requ
ency
Month
Contrails, Persistent
Contrails, Persistent, w/Ci
Contrails, Not Persistent
Contrails, Not Persistent, w/Ci
No Contrails
No Contrails, w/Ci
Indeterminate Contrails
Indeterminate Contrails, w/Ci
J F M A M J J A S O N D J F M A M0
0.2
0.4
0.6
0.8
1
Fre
quen
cy
Month
Contrails, Persistent
Contrails, Not Persistent
No Contrails
Indeterminate Contrails
J F M A M J J A S O N D J F M A M0
0.2
0.4
0.6
0.8
1
Fre
quen
cy
Month
Contrails, Persistent
Contrails, Persistent, w/Ci
Contrails, Not Persistent
Contrails, Not Persistent, w/Ci
No Contrails
No Contrails, w/Ci
a)
b)
c)

25
Figure A8. Summary of monthly observations for Hill AFB, Utah from January 93 to May 94: (a) relative frequency of
contrails and cirrus, (b) relative frequency and persistence of contrails, and (c) relative frequency of contrails and cirrus with
indeterminate data removed.
J F M A M J J A S O N D J F M A M0
0.2
0.4
0.6
0.8
1F
requ
ency
Month
Contrails, Persistent
Contrails, Persistent, w/Ci
Contrails, Not Persistent
Contrails, Not Persistent, w/Ci
No Contrails
No Contrails, w/Ci
Indeterminate Contrails
Indeterminate Contrails, w/Ci
J F M A M J J A S O N D J F M A M0
0.2
0.4
0.6
0.8
1
Fre
quen
cy
Month
Contrails, Persistent
Contrails, Not Persistent
No Contrails
Indeterminate Contrails
J F M A M J J A S O N D J F M A M0
0.2
0.4
0.6
0.8
1
Fre
quen
cy
Month
Contrails, Persistent
Contrails, Persistent, w/Ci
Contrails, Not Persistent
Contrails, Not Persistent, w/Ci
No Contrails
No Contrails, w/Ci
a)
b)
c)

26
Figure A9. Summary of monthly observations for Kelly AFB, Texas from January 93 to May 94: (a) relative frequency of
contrails and cirrus, (b) relative frequency and persistence of contrails, and (c) relative frequency of contrails and cirrus with
indeterminate data removed.
J F M A M J J A S O N D J F M A M0
0.2
0.4
0.6
0.8
1F
requ
ency
Month
Contrails, Persistent
Contrails, Persistent, w/Ci
Contrails, Not Persistent
Contrails, Not Persistent, w/Ci
No Contrails
No Contrails, w/Ci
Indeterminate Contrails
Indeterminate Contrails, w/Ci
J F M A M J J A S O N D J F M A M0
0.2
0.4
0.6
0.8
1
Fre
quen
cy
Month
Contrails, Persistent
Contrails, Not Persistent
No Contrails
Indeterminate Contrails
J F M A M J J A S O N D J F M A M0
0.2
0.4
0.6
0.8
1
Fre
quen
cy
Month
Contrails, Persistent
Contrails, Persistent, w/Ci
Contrails, Not Persistent
Contrails, Not Persistent, w/Ci
No Contrails
No Contrails, w/Ci
a)
b)
c)

27
Figure A10. Summary of monthly observations for Langley AFB, Virginia from January 93 to May 94: (a) relative
frequency of contrails and cirrus, (b) relative frequency and persistence of contrails, and (c) relative frequency of contrails
and cirrus with indeterminate data removed.
J F M A M J J A S O N D J F M A M0
0.2
0.4
0.6
0.8
1F
requ
ency
Month
Contrails, Persistent
Contrails, Persistent, w/Ci
Contrails, Not Persistent
Contrails, Not Persistent, w/Ci
No Contrails
No Contrails, w/Ci
Indeterminate Contrails
Indeterminate Contrails, w/Ci
J F M A M J J A S O N D J F M A M0
0.2
0.4
0.6
0.8
1
Fre
quen
cy
Month
Contrails, Persistent
Contrails, Not Persistent
No Contrails
Indeterminate Contrails
J F M A M J J A S O N D J F M A M0
0.2
0.4
0.6
0.8
1
Fre
quen
cy
Month
Contrails, Persistent
Contrails, Persistent, w/Ci
Contrails, Not Persistent
Contrails, Not Persistent, w/Ci
No Contrails
No Contrails, w/Ci
a)
b)
c)

28
Figure A11. Summary of monthly observations for Loring AFB, Maine from January 93 to May 94: (a) relative frequency
of contrails and cirrus, (b) relative frequency and persistence of contrails, and (c) relative frequency of contrails and cirrus
with indeterminate data removed.
J F M A M J J A S O N D J F M A M0
0.2
0.4
0.6
0.8
1F
requ
ency
Month
Contrails, Persistent
Contrails, Persistent, w/Ci
Contrails, Not Persistent
Contrails, Not Persistent, w/Ci
No Contrails
No Contrails, w/Ci
Indeterminate Contrails
Indeterminate Contrails, w/Ci
J F M A M J J A S O N D J F M A M0
0.2
0.4
0.6
0.8
1
Fre
quen
cy
Month
Contrails, Persistent
Contrails, Not Persistent
No Contrails
Indeterminate Contrails
J F M A M J J A S O N D J F M A M0
0.2
0.4
0.6
0.8
1
Fre
quen
cy
Month
Contrails, Persistent
Contrails, Persistent, w/Ci
Contrails, Not Persistent
Contrails, Not Persistent, w/Ci
No Contrails
No Contrails, w/Ci
a)
b)
c)

29
Figure A12. Summary of monthly observations for Luke AFB, Arizona from January 93 to May 94: (a) relative frequency
of contrails and cirrus, (b) relative frequency and persistence of contrails, and (c) relative frequency of contrails and cirrus
with indeterminate data removed.
J F M A M J J A S O N D J F M A M0
0.2
0.4
0.6
0.8
1F
requ
ency
Month
Contrails, Persistent
Contrails, Persistent, w/Ci
Contrails, Not Persistent
Contrails, Not Persistent, w/Ci
No Contrails
No Contrails, w/Ci
Indeterminate Contrails
Indeterminate Contrails, w/Ci
J F M A M J J A S O N D J F M A M0
0.2
0.4
0.6
0.8
1
Fre
quen
cy
Month
Contrails, Persistent
Contrails, Not Persistent
No Contrails
Indeterminate Contrails
J F M A M J J A S O N D J F M A M0
0.2
0.4
0.6
0.8
1
Fre
quen
cy
Month
Contrails, Persistent
Contrails, Persistent, w/Ci
Contrails, Not Persistent
Contrails, Not Persistent, w/Ci
No Contrails
No Contrails, w/Ci
a)
b)
c)

30
Figure A13. Summary of monthly observations for McClellan AFB, California from January 93 to May 94: (a) relative
frequency of contrails and cirrus, (b) relative frequency and persistence of contrails, and (c) relative frequency of contrails
and cirrus with indeterminate data removed.
J F M A M J J A S O N D J F M A M0
0.2
0.4
0.6
0.8
1F
requ
ency
Month
Contrails, Persistent
Contrails, Persistent, w/Ci
Contrails, Not Persistent
Contrails, Not Persistent, w/Ci
No Contrails
No Contrails, w/Ci
Indeterminate Contrails
Indeterminate Contrails, w/Ci
J F M A M J J A S O N D J F M A M0
0.2
0.4
0.6
0.8
1
Fre
quen
cy
Month
Contrails, Persistent
Contrails, Not Persistent
No Contrails
Indeterminate Contrails
J F M A M J J A S O N D J F M A M0
0.2
0.4
0.6
0.8
1
Fre
quen
cy
Month
Contrails, Persistent
Contrails, Persistent, w/Ci
Contrails, Not Persistent
Contrails, Not Persistent, w/Ci
No Contrails
No Contrails, w/Ci
a)
b)
c)

31
Figure A14. Summary of monthly observations for Minot AFB, North Dakota from January 93 to May 94: (a) relative
frequency of contrails and cirrus, (b) relative frequency and persistence of contrails, and (c) relative frequency of contrails
and cirrus with indeterminate data removed.
J F M A M J J A S O N D J F M A M0
0.2
0.4
0.6
0.8
1F
requ
ency
Month
Contrails, Persistent
Contrails, Persistent, w/Ci
Contrails, Not Persistent
Contrails, Not Persistent, w/Ci
No Contrails
No Contrails, w/Ci
Indeterminate Contrails
Indeterminate Contrails, w/Ci
J F M A M J J A S O N D J F M A M0
0.2
0.4
0.6
0.8
1
Fre
quen
cy
Month
Contrails, Persistent
Contrails, Not Persistent
No Contrails
Indeterminate Contrails
J F M A M J J A S O N D J F M A M0
0.2
0.4
0.6
0.8
1
Fre
quen
cy
Month
Contrails, Persistent
Contrails, Persistent, w/Ci
Contrails, Not Persistent
Contrails, Not Persistent, w/Ci
No Contrails
No Contrails, w/Ci
a)
b)
c)

32
Figure A15. Summary of monthly observations for Mountain Home AFB, Idaho from January 93 to May 94: (a) relative
frequency of contrails and cirrus, (b) relative frequency and persistence of contrails, and (c) relative frequency of contrails
and cirrus with indeterminate data removed.
J F M A M J J A S O N D J F M A M0
0.2
0.4
0.6
0.8
1F
requ
ency
Month
Contrails, Persistent
Contrails, Persistent, w/Ci
Contrails, Not Persistent
Contrails, Not Persistent, w/Ci
No Contrails
No Contrails, w/Ci
Indeterminate Contrails
Indeterminate Contrails, w/Ci
J F M A M J J A S O N D J F M A M0
0.2
0.4
0.6
0.8
1
Fre
quen
cy
Month
Contrails, Persistent
Contrails, Not Persistent
No Contrails
Indeterminate Contrails
J F M A M J J A S O N D J F M A M0
0.2
0.4
0.6
0.8
1
Fre
quen
cy
Month
Contrails, Persistent
Contrails, Persistent, w/Ci
Contrails, Not Persistent
Contrails, Not Persistent, w/Ci
No Contrails
No Contrails, w/Ci
a)
b)
c)

33
Figure A16. Summary of monthly observations for Offut AFB, Nebraska from January 93 to May 94: (a) relative frequency
of contrails and cirrus, (b) relative frequency and persistence of contrails, and (c) relative frequency of contrails and cirrus
with indeterminate data removed.
J F M A M J J A S O N D J F M A M0
0.2
0.4
0.6
0.8
1F
requ
ency
Month
Contrails, Persistent
Contrails, Persistent, w/Ci
Contrails, Not Persistent
Contrails, Not Persistent, w/Ci
No Contrails
No Contrails, w/Ci
Indeterminate Contrails
Indeterminate Contrails, w/Ci
J F M A M J J A S O N D J F M A M0
0.2
0.4
0.6
0.8
1
Fre
quen
cy
Month
Contrails, Persistent
Contrails, Not Persistent
No Contrails
Indeterminate Contrails
J F M A M J J A S O N D J F M A M0
0.2
0.4
0.6
0.8
1
Fre
quen
cy
Month
Contrails, Persistent
Contrails, Persistent, w/Ci
Contrails, Not Persistent
Contrails, Not Persistent, w/Ci
No Contrails
No Contrails, w/Ci
a)
b)
c)

34
Figure A17. Summary of monthly observations for Tinker AFB, Oklahoma from January 93 to May 94: (a) relative
frequency of contrails and cirrus, (b) relative frequency and persistence of contrails, and (c) relative frequency of contrails
and cirrus with indeterminate data removed.
J F M A M J J A S O N D J F M A M0
0.2
0.4
0.6
0.8
1F
requ
ency
Month
Contrails, Persistent
Contrails, Persistent, w/Ci
Contrails, Not Persistent
Contrails, Not Persistent, w/Ci
No Contrails
No Contrails, w/Ci
Indeterminate Contrails
Indeterminate Contrails, w/Ci
J F M A M J J A S O N D J F M A M0
0.2
0.4
0.6
0.8
1
Fre
quen
cy
Month
Contrails, Persistent
Contrails, Not Persistent
No Contrails
Indeterminate Contrails
J F M A M J J A S O N D J F M A M0
0.2
0.4
0.6
0.8
1
Fre
quen
cy
Month
Contrails, Persistent
Contrails, Persistent, w/Ci
Contrails, Not Persistent
Contrails, Not Persistent, w/Ci
No Contrails
No Contrails, w/Ci
a)
b)
c)

35
Figure A18. Summary of monthly observations for Whiteman AFB, Missouri from January 93 to May 94: (a) relative
frequency of contrails and cirrus, (b) relative frequency and persistence of contrails, and (c) relative frequency of contrails
and cirrus with indeterminate data removed.
J F M A M J J A S O N D J F M A M0
0.2
0.4
0.6
0.8
1F
requ
ency
Month
Contrails, Persistent
Contrails, Persistent, w/Ci
Contrails, Not Persistent
Contrails, Not Persistent, w/Ci
No Contrails
No Contrails, w/Ci
Indeterminate Contrails
Indeterminate Contrails, w/Ci
J F M A M J J A S O N D J F M A M0
0.2
0.4
0.6
0.8
1
Fre
quen
cy
Month
Contrails, Persistent
Contrails, Not Persistent
No Contrails
Indeterminate Contrails
J F M A M J J A S O N D J F M A M0
0.2
0.4
0.6
0.8
1
Fre
quen
cy
Month
Contrails, Persistent
Contrails, Persistent, w/Ci
Contrails, Not Persistent
Contrails, Not Persistent, w/Ci
No Contrails
No Contrails, w/Ci
a)
b)
c)

36
Figure A19. Summary of monthly observations for Wright Patterson AFB, Ohio from January 93 to May 94: (a) relative
frequency of contrails and cirrus, (b) relative frequency and persistence of contrails, and (c) relative frequency of contrails
and cirrus with indeterminate data removed.
J F M A M J J A S O N D J F M A M0
0.2
0.4
0.6
0.8
1F
requ
ency
Month
Contrails, Persistent
Contrails, Persistent, w/Ci
Contrails, Not Persistent
Contrails, Not Persistent, w/Ci
No Contrails
No Contrails, w/Ci
Indeterminate Contrails
Indeterminate Contrails, w/Ci
J F M A M J J A S O N D J F M A M0
0.2
0.4
0.6
0.8
1
Fre
quen
cy
Month
Contrails, Persistent
Contrails, Not Persistent
No Contrails
Indeterminate Contrails
J F M A M J J A S O N D J F M A M0
0.2
0.4
0.6
0.8
1
Fre
quen
cy
Month
Contrails, Persistent
Contrails, Persistent, w/Ci
Contrails, Not Persistent
Contrails, Not Persistent, w/Ci
No Contrails
No Contrails, w/Ci
a)
b)
c)

37
Appendix B
Hourly Mean Contrail Frequencies for Each Site

38
7 8 9 1011 1213 1415 1617 1819 2021 222324 1 2 3 4 5 60
50
100
150
200
250
300
350
400
450H
ours
of O
bser
vatio
n
UTC
Contrails, Persistent
Contrails, Persistent, w/Ci
Contrails, Not Persistent
Contrails, Not Persistent, w/Ci
No Contrails
No Contrails, w/Ci
Indeterminate Contrails
Indeterminate Contrails, w/Ci
7 8 9 10 1112 1314 1516 1718 1920 2122 2324 1 2 3 4 5 60
0.2
0.4
0.6
0.8
1
Fre
quen
cy
UTC
7 8 9 1011 1213 1415 1617 1819 202122 2324 1 2 3 4 5 60
0.2
0.4
0.6
0.8
1
Fre
quen
cy
UTC
Figure B1. Summary of hourly contrail and cirrus observations from Barksdale AFB, Louisiana, centered at local noon: (a)
number of observations, (b) relative frequency of occurrence, and (c) relative frequency of occurrence with indeterminate
data removed.
a)
b)
c)

39
Figure B2. Summary of hourly contrail and cirrus observations from Beale AFB, California, centered at local noon: (a)
number of observations, (b) relative frequency of occurrence, and (c) relative frequency of occurrence with indeterminate
data removed.
7 8 9 1011 1213 141516 1718 1920 2122 2324 1 2 3 4 5 60
50
100
150
200
250
300
350
400
450H
ours
of O
bser
vatio
n
UTC
Contrails, Persistent
Contrails, Persistent, w/Ci
Contrails, Not Persistent
Contrails, Not Persistent, w/Ci
No Contrails
No Contrails, w/Ci
Indeterminate Contrails
Indeterminate Contrails, w/Ci
7 8 9 1011 1213 1415 1617 1819 2021 2223 24 1 2 3 4 5 60
0.2
0.4
0.6
0.8
1
Fre
quen
cy
UTC
7 8 9 10 1112 1314 1516 1718 1920 212223 24 1 2 3 4 5 60
0.2
0.4
0.6
0.8
1
Fre
quen
cy
UTC
a)
b)
c)
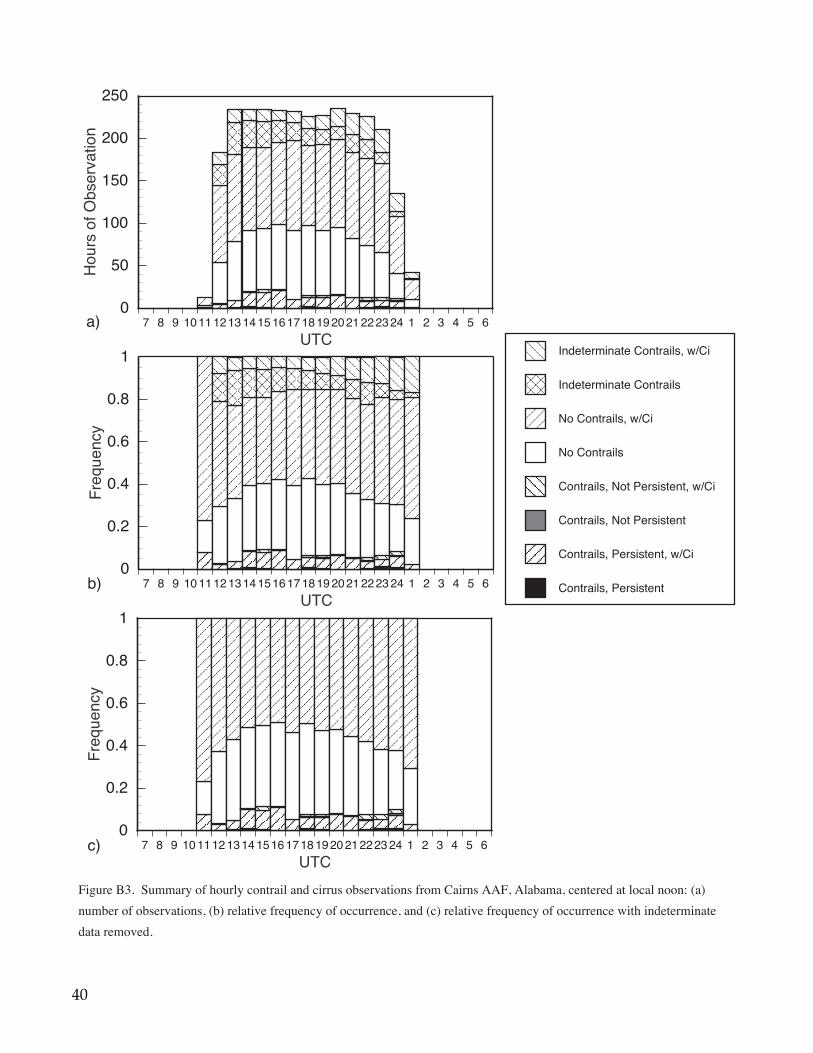
40
Figure B3. Summary of hourly contrail and cirrus observations from Cairns AAF, Alabama, centered at local noon: (a)
number of observations, (b) relative frequency of occurrence, and (c) relative frequency of occurrence with indeterminate
data removed.
7 8 9 1011 1213 1415 1617 1819 2021 222324 1 2 3 4 5 60
50
100
150
200
250H
ours
of O
bser
vatio
n
UTC
Contrails, Persistent
Contrails, Persistent, w/Ci
Contrails, Not Persistent
Contrails, Not Persistent, w/Ci
No Contrails
No Contrails, w/Ci
Indeterminate Contrails
Indeterminate Contrails, w/Ci
7 8 9 10 1112 1314 151617 1819 2021 2223 24 1 2 3 4 5 60
0.2
0.4
0.6
0.8
1
Fre
quen
cy
UTC
7 8 9 10 1112 1314 1516 1718 1920 212223 24 1 2 3 4 5 60
0.2
0.4
0.6
0.8
1
Fre
quen
cy
UTC
a)
b)
c)

41
Figure B4. Summary of hourly contrail and cirrus observations from Edwards AFB, California, centered at local noon: (a)
number of observations, (b) relative frequency of occurrence, and (c) relative frequency of occurrence with indeterminate
data removed.
7 8 9 10 1112 131415 1617 1819 2021 2223 24 1 2 3 4 5 60
50
100
150
200
250
300
350H
ours
of O
bser
vatio
n
UTC
Contrails, Persistent
Contrails, Persistent, w/Ci
Contrails, Not Persistent
Contrails, Not Persistent, w/Ci
No Contrails
No Contrails, w/Ci
Indeterminate Contrails
Indeterminate Contrails, w/Ci
7 8 9 10 1112 1314 1516 1718 1920 2122 2324 1 2 3 4 5 60
0.2
0.4
0.6
0.8
1
Fre
quen
cy
UTC
7 8 9 1011 1213 1415 1617 1819 202122 2324 1 2 3 4 5 60
0.2
0.4
0.6
0.8
1
Fre
quen
cy
UTC
a)
b)
c)

42
Figure B5. Summary of hourly contrail and cirrus observations from Eglin AFB, Florida, centered at local noon: (a) number
of observations, (b) relative frequency of occurrence, and (c) relative frequency of occurrence with indeterminate data
removed.
7 8 9 1011 1213 1415 1617 1819 2021 222324 1 2 3 4 5 60
50
100
150
200
250H
ours
of O
bser
vatio
n
UTC
Contrails, Persistent
Contrails, Persistent, w/Ci
Contrails, Not Persistent
Contrails, Not Persistent, w/Ci
No Contrails
No Contrails, w/Ci
Indeterminate Contrails
Indeterminate Contrails, w/Ci
7 8 9 10 1112 1314 151617 1819 2021 2223 24 1 2 3 4 5 60
0.2
0.4
0.6
0.8
1
Fre
quen
cy
UTC
7 8 9 1011 121314 1516 1718 1920 2122 2324 1 2 3 4 5 60
0.2
0.4
0.6
0.8
1
Fre
quen
cy
UTC
a)
b)
c)

43
Figure B6. Summary of hourly contrail and cirrus observations from Fairchild AFB, Washington, centered at local noon: (a)
number of observations, (b) relative frequency of occurrence, and (c) relative frequency of occurrence with indeterminate
data removed.
7 8 9 10 1112 131415 1617 1819 2021 2223 24 1 2 3 4 5 60
50
100
150
200
250
300
350H
ours
of O
bser
vatio
n
UTC
Contrails, Persistent
Contrails, Persistent, w/Ci
Contrails, Not Persistent
Contrails, Not Persistent, w/Ci
No Contrails
No Contrails, w/Ci
Indeterminate Contrails
Indeterminate Contrails, w/Ci
7 8 9 10 1112 1314 1516 1718 1920 2122 2324 1 2 3 4 5 60
0.2
0.4
0.6
0.8
1
Fre
quen
cy
UTC
7 8 9 1011 1213 1415 1617 1819 202122 2324 1 2 3 4 5 60
0.2
0.4
0.6
0.8
1
Fre
quen
cy
UTC
a)
b)
c)

44
Figure B7. Summary of hourly contrail and cirrus observations from Griffis AFB, New York, centered at local noon: (a)
number of observations, (b) relative frequency of occurrence, and (c) relative frequency of occurrence with indeterminate
data removed.
7 8 9 10 1112 1314 1516 1718 192021 2223 24 1 2 3 4 5 60
50
100
150
200
250
300
350
400H
ours
of O
bser
vatio
n
UTC
Contrails, Persistent
Contrails, Persistent, w/Ci
Contrails, Not Persistent
Contrails, Not Persistent, w/Ci
No Contrails
No Contrails, w/Ci
Indeterminate Contrails
Indeterminate Contrails, w/Ci
7 8 9 1011 1213 141516 1718 1920 2122 2324 1 2 3 4 5 60
0.2
0.4
0.6
0.8
1
Fre
quen
cy
UTC
7 8 9 10 111213 1415 1617 1819 2021 2223 24 1 2 3 4 5 60
0.2
0.4
0.6
0.8
1
Fre
quen
cy
UTC
a)
b)
c)

45
Figure B8. Summary of hourly contrail and cirrus observations from Hill AFB, Utah, centered at local noon: (a) number of
observations, (b) relative frequency of occurrence, and (c) relative frequency of occurrence with indeterminate data
removed.
7 8 9 1011 121314 1516 1718 1920 2122 2324 1 2 3 4 5 60
50
100
150
200
250
300
350
400H
ours
of O
bser
vatio
n
UTC
Contrails, Persistent
Contrails, Persistent, w/Ci
Contrails, Not Persistent
Contrails, Not Persistent, w/Ci
No Contrails
No Contrails, w/Ci
Indeterminate Contrails
Indeterminate Contrails, w/Ci
7 8 9 1011 1213 1415 1617 1819 202122 2324 1 2 3 4 5 60
0.2
0.4
0.6
0.8
1
Fre
quen
cy
UTC
7 8 9 10 1112 1314 1516 171819 2021 2223 24 1 2 3 4 5 60
0.2
0.4
0.6
0.8
1
Fre
quen
cy
UTC
a)
b)
c)

46
Figure B9. Summary of hourly contrail and cirrus observations from Kelly AFB, Texas, centered at local noon: (a) number
of observations, (b) relative frequency of occurrence, and (c) relative frequency of occurrence with indeterminate data
removed.
7 8 9 1011 12131415 161718 19202122 2324 1 2 3 4 5 60
50
100
150
200
250
300
350
400H
ours
of O
bser
vatio
n
UTC
Contrails, Persistent
Contrails, Persistent, w/Ci
Contrails, Not Persistent
Contrails, Not Persistent, w/Ci
No Contrails
No Contrails, w/Ci
Indeterminate Contrails
Indeterminate Contrails, w/Ci
7 8 9 1011 12131415 161718 19202122 2324 1 2 3 4 5 60
0.2
0.4
0.6
0.8
1
Fre
quen
cy
UTC
7 8 9 10 111213 14151617 181920 21222324 1 2 3 4 5 60
0.2
0.4
0.6
0.8
1
Fre
quen
cy
UTC
a)
b)
c)

47
Figure B10. Summary of hourly contrail and cirrus observations from Langley AFB, Virginia, centered at local noon: (a)
number of observations, (b) relative frequency of occurrence, and (c) relative frequency of occurrence with indeterminate
data removed.
7 8 9 1011 1213 1415 1617 1819 2021 222324 1 2 3 4 5 60
50
100
150
200
250
300H
ours
of O
bser
vatio
n
UTC
Contrails, Persistent
Contrails, Persistent, w/Ci
Contrails, Not Persistent
Contrails, Not Persistent, w/Ci
No Contrails
No Contrails, w/Ci
Indeterminate Contrails
Indeterminate Contrails, w/Ci
7 8 9 10 1112 1314 151617 1819 2021 2223 24 1 2 3 4 5 60
0.2
0.4
0.6
0.8
1
Fre
quen
cy
UTC
7 8 9 1011 121314 1516 1718 1920 2122 2324 1 2 3 4 5 60
0.2
0.4
0.6
0.8
1
Fre
quen
cy
UTC
a)
b)
c)

48
Figure B11. Summary of hourly contrail and cirrus observations from Loring AFB, Maine, centered at local noon: (a)
number of observations, (b) relative frequency of occurrence, and (c) relative frequency of occurrence with indeterminate
data removed.
7 8 9 1011 1213 1415 1617 1819 2021 222324 1 2 3 4 5 60
20
40
60
80
100
120
140
160H
ours
of O
bser
vatio
n
UTC
Contrails, Persistent
Contrails, Persistent, w/Ci
Contrails, Not Persistent
Contrails, Not Persistent, w/Ci
No Contrails
No Contrails, w/Ci
Indeterminate Contrails
Indeterminate Contrails, w/Ci
7 8 9 10 1112 1314 151617 1819 2021 2223 24 1 2 3 4 5 60
0.2
0.4
0.6
0.8
1
Fre
quen
cy
UTC
7 8 9 1011 121314 1516 1718 1920 2122 2324 1 2 3 4 5 60
0.2
0.4
0.6
0.8
1
Fre
quen
cy
UTC
a)
b)
c)

49
Figure B12. Summary of hourly contrail and cirrus observations from Luke AFB, Arizona, centered at local noon: (a)
number of observations, (b) relative frequency of occurrence, and (c) relative frequency of occurrence with indeterminate
data removed.
7 8 9 10 1112 1314 1516 1718 1920 2122 2324 1 2 3 4 5 60
50
100
150
200
250H
ours
of O
bser
vatio
n
UTC
Contrails, Persistent
Contrails, Persistent, w/Ci
Contrails, Not Persistent
Contrails, Not Persistent, w/Ci
No Contrails
No Contrails, w/Ci
Indeterminate Contrails
Indeterminate Contrails, w/Ci
7 8 9 1011 1213 1415 1617 181920 2122 2324 1 2 3 4 5 60
0.2
0.4
0.6
0.8
1
Fre
quen
cy
UTC
7 8 9 10 1112 1314 151617 1819 2021 2223 24 1 2 3 4 5 60
0.2
0.4
0.6
0.8
1
Fre
quen
cy
UTC
a)
b)
c)

50
Figure B13. Summary of hourly contrail and cirrus observations from McClellan AFB, California, centered at local noon:
(a) number of observations, (b) relative frequency of occurrence, and (c) relative frequency of occurrence with
indeterminate data removed.
7 8 9 10 1112 131415 1617 1819 2021 2223 24 1 2 3 4 5 60
50
100
150
200
250
300H
ours
of O
bser
vatio
n
UTC
Contrails, Persistent
Contrails, Persistent, w/Ci
Contrails, Not Persistent
Contrails, Not Persistent, w/Ci
No Contrails
No Contrails, w/Ci
Indeterminate Contrails
Indeterminate Contrails, w/Ci
7 8 9 10 1112 1314 1516 1718 1920 2122 2324 1 2 3 4 5 60
0.2
0.4
0.6
0.8
1
Fre
quen
cy
UTC
7 8 9 1011 1213 1415 1617 1819 202122 2324 1 2 3 4 5 60
0.2
0.4
0.6
0.8
1
Fre
quen
cy
UTC
a)
b)
c)

51
Figure B14. Summary of hourly contrail and cirrus observations from Minot AFB, North Dakota, centered at local noon: (a)
number of observations, (b) relative frequency of occurrence, and (c) relative frequency of occurrence with indeterminate
data removed.
7 8 9 10 1112 131415 1617 1819 2021 2223 24 1 2 3 4 5 60
50
100
150
200
250
300
350
400H
ours
of O
bser
vatio
n
UTC
Contrails, Persistent
Contrails, Persistent, w/Ci
Contrails, Not Persistent
Contrails, Not Persistent, w/Ci
No Contrails
No Contrails, w/Ci
Indeterminate Contrails
Indeterminate Contrails, w/Ci
7 8 9 10 1112 1314 1516 1718 1920 2122 2324 1 2 3 4 5 60
0.2
0.4
0.6
0.8
1
Fre
quen
cy
UTC
7 8 9 1011 1213 1415 1617 1819 202122 2324 1 2 3 4 5 60
0.2
0.4
0.6
0.8
1
Fre
quen
cy
UTC
a)
b)
c)

52
Figure B15. Summary of hourly contrail and cirrus observations from Mountain Home AFB, Idaho, centered at local noon:
(a) number of observations, (b) relative frequency of occurrence, and (c) relative frequency of occurrence with
indeterminate data removed.
7 8 9 1011 1213 1415 1617 1819 2021 222324 1 2 3 4 5 60
50
100
150
200
250
300
350
400H
ours
of O
bser
vatio
n
UTC
Contrails, Persistent
Contrails, Persistent, w/Ci
Contrails, Not Persistent
Contrails, Not Persistent, w/Ci
No Contrails
No Contrails, w/Ci
Indeterminate Contrails
Indeterminate Contrails, w/Ci
7 8 9 10 1112 1314 151617 1819 2021 2223 24 1 2 3 4 5 60
0.2
0.4
0.6
0.8
1
Fre
quen
cy
UTC
7 8 9 1011 121314 1516 1718 1920 2122 2324 1 2 3 4 5 60
0.2
0.4
0.6
0.8
1
Fre
quen
cy
UTC
a)
b)
c)
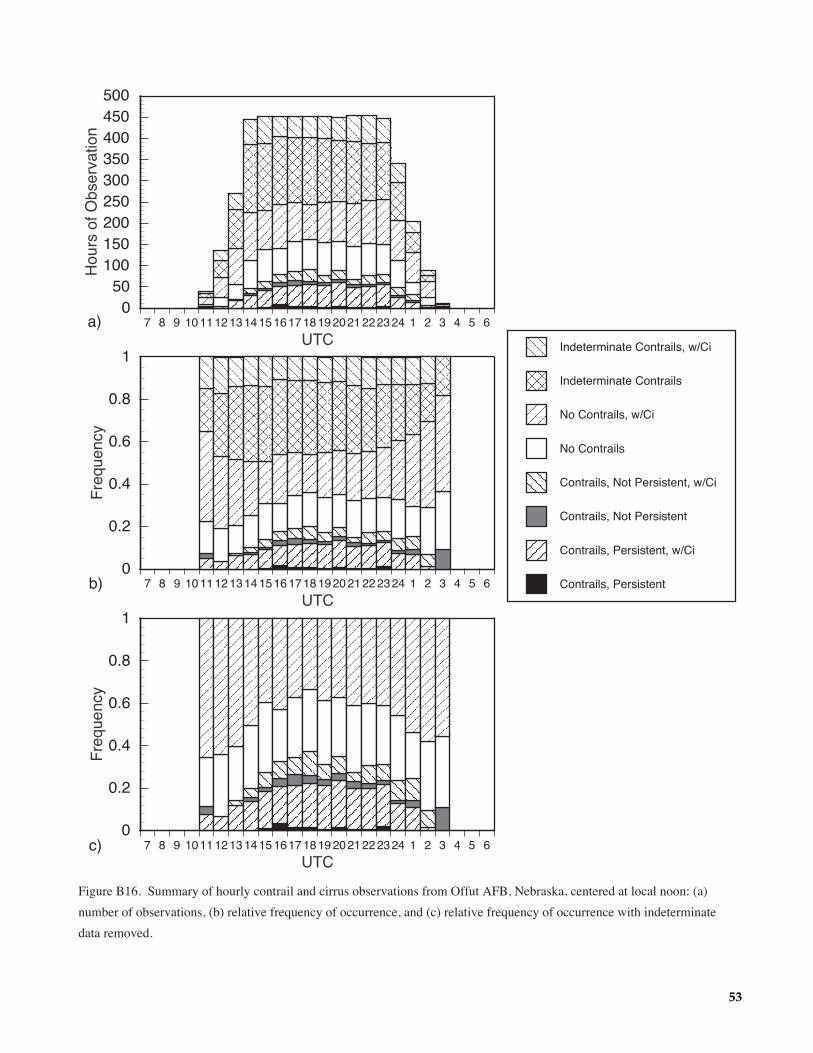
53
Figure B16. Summary of hourly contrail and cirrus observations from Offut AFB, Nebraska, centered at local noon: (a)
number of observations, (b) relative frequency of occurrence, and (c) relative frequency of occurrence with indeterminate
data removed.
7 8 9 10 1112 131415 1617 1819 2021 2223 24 1 2 3 4 5 60
50100150200250300350400450500
Hou
rs o
f Obs
erva
tion
UTC
Contrails, Persistent
Contrails, Persistent, w/Ci
Contrails, Not Persistent
Contrails, Not Persistent, w/Ci
No Contrails
No Contrails, w/Ci
Indeterminate Contrails
Indeterminate Contrails, w/Ci
7 8 9 10 1112 1314 1516 1718 1920 2122 2324 1 2 3 4 5 60
0.2
0.4
0.6
0.8
1
Fre
quen
cy
UTC
7 8 9 1011 1213 1415 1617 1819 202122 2324 1 2 3 4 5 60
0.2
0.4
0.6
0.8
1
Fre
quen
cy
UTC
a)
b)
c)

54
Figure B17. Summary of hourly contrail and cirrus observations from Tinker AFB, Oklahoma, centered at local noon: (a)
number of observations, (b) relative frequency of occurrence, and (c) relative frequency of occurrence with indeterminate
data removed.
7 8 9 1011 1213 1415 1617 1819 2021 222324 1 2 3 4 5 60
50
100
150
200
250
300
350
400H
ours
of O
bser
vatio
n
UTC
Contrails, Persistent
Contrails, Persistent, w/Ci
Contrails, Not Persistent
Contrails, Not Persistent, w/Ci
No Contrails
No Contrails, w/Ci
Indeterminate Contrails
Indeterminate Contrails, w/Ci
7 8 9 10 1112 1314 151617 1819 2021 2223 24 1 2 3 4 5 60
0.2
0.4
0.6
0.8
1
Fre
quen
cy
UTC
7 8 9 1011 121314 1516 1718 1920 2122 2324 1 2 3 4 5 60
0.2
0.4
0.6
0.8
1
Fre
quen
cy
UTC
a)
b)
c)

55
Figure B18. Summary of hourly contrail and cirrus observations from Whiteman AFB, Missouri, centered at local noon: (a)
number of observations, (b) relative frequency of occurrence, and (c) relative frequency of occurrence with indeterminate
data removed.
7 8 9 1011 1213 141516 1718 1920 2122 2324 1 2 3 4 5 60
50100150200250300350400450500
Hou
rs o
f Obs
erva
tion
UTC
Contrails, Persistent
Contrails, Persistent, w/Ci
Contrails, Not Persistent
Contrails, Not Persistent, w/Ci
No Contrails
No Contrails, w/Ci
Indeterminate Contrails
Indeterminate Contrails, w/Ci
7 8 9 1011 1213 1415 1617 1819 2021 2223 24 1 2 3 4 5 60
0.2
0.4
0.6
0.8
1
Fre
quen
cy
UTC
7 8 9 10 1112 1314 1516 1718 1920 212223 24 1 2 3 4 5 60
0.2
0.4
0.6
0.8
1
Fre
quen
cy
UTC
a)
b)
c)

56
Figure B19. Summary of hourly contrail and cirrus observations from Wright Patterson AFB, Ohio, centered at local noon:
(a) number of observations, (b) relative frequency of occurrence, and (c) relative frequency of occurrence with
indeterminate data removed.
7 8 9 10 1112 1314 1516 1718 192021 2223 24 1 2 3 4 5 60
50
100
150
200
250
300
350H
ours
of O
bser
vatio
n
UTC
Contrails, Persistent
Contrails, Persistent, w/Ci
Contrails, Not Persistent
Contrails, Not Persistent, w/Ci
No Contrails
No Contrails, w/Ci
Indeterminate Contrails
Indeterminate Contrails, w/Ci
7 8 9 1011 1213 141516 1718 1920 2122 2324 1 2 3 4 5 60
0.2
0.4
0.6
0.8
1
Fre
quen
cy
UTC
7 8 9 10 111213 1415 1617 1819 2021 2223 24 1 2 3 4 5 60
0.2
0.4
0.6
0.8
1
Fre
quen
cy
UTC
a)
b)
c)

57
Appendix C
Cloud Amount Statistics for Each Site

58
J F M A M J J A S O N D J F M A M0
0.2
0.4
0.6
0.8
1F
requ
ency
Month
0%
10% to 20%
30% to 40%
50% to 60%
70% to 80%
90% to 100%
7 8 9 1011 1213 1415 1617 1819 202122 2324 1 2 3 4 5 60
0.2
0.4
0.6
0.8
1
Fre
quen
cy
UTC
Figure C1. Summary of cloud cover for Barksdale AFB, Louisiana from January 93 to May 94: (a) relative frequency of
cloud cover, (b) diurnal cycle of cloud cover relative frequency centered at local noon, and (c) monthly mean cloud cover.
a)
b)
c)
J
J
JJ J
J
J
JJ
J J
JJJJ
J F M A M J J A S O N D J F M A M0
102030405060708090
100
Clo
ud C
over
(%
)
Month
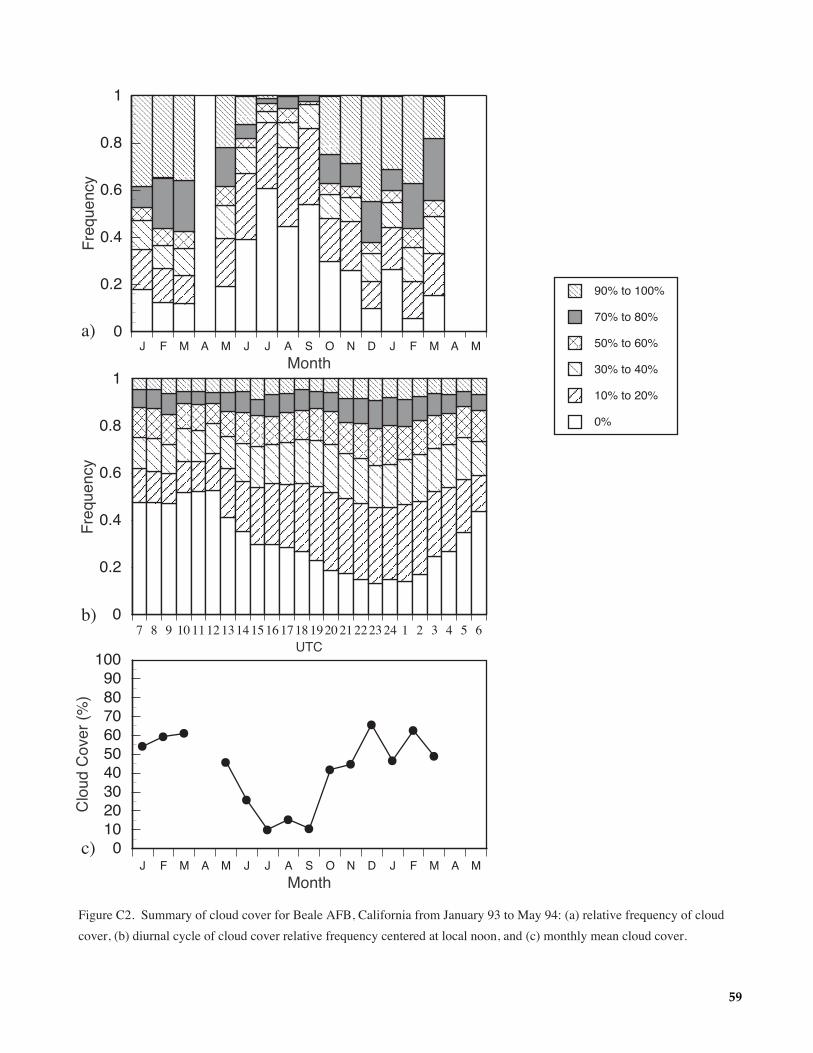
59
J F M A M J J A S O N D J F M A M0
0.2
0.4
0.6
0.8
1F
requ
ency
Month
0%
10% to 20%
30% to 40%
50% to 60%
70% to 80%
90% to 100%
7 8 9 10 1112 1314 1516 1718 1920 212223 24 1 2 3 4 5 60
0.2
0.4
0.6
0.8
1
Fre
quen
cy
UTC
Figure C2. Summary of cloud cover for Beale AFB, California from January 93 to May 94: (a) relative frequency of cloud
cover, (b) diurnal cycle of cloud cover relative frequency centered at local noon, and (c) monthly mean cloud cover.
a)
b)
c)
JJ J
J
J
JJJ
JJ
J
J
J
J
J F M A M J J A S O N D J F M A M0
102030405060708090
100
Clo
ud C
over
(%
)
Month

60
J F M A M J J A S O N D J F M A M0
0.2
0.4
0.6
0.8
1F
requ
ency
Month
0%
10% to 20%
30% to 40%
50% to 60%
70% to 80%
90% to 100%
7 8 9 10 1112 1314 1516 1718 1920 212223 24 1 2 3 4 5 60
0.2
0.4
0.6
0.8
1
Fre
quen
cy
UTC
Figure C3. Summary of cloud cover for Cairns AAF, Alabama from January 93 to May 94: (a) relative frequency of cloud
cover, (b) diurnal cycle of cloud cover relative frequency centered at local noon, and (c) monthly mean cloud cover.
a)
b)
c)
J
JJ
JJ
JJ
J
J F M A M J J A S O N D J F M A M0
102030405060708090
100
Clo
ud C
over
(%
)
Month

61
J F M A M J J A S O N D J F M A M0
0.2
0.4
0.6
0.8
1F
requ
ency
Month
0%
10% to 20%
30% to 40%
50% to 60%
70% to 80%
90% to 100%
7 8 9 10 1112 1314 1516 1718 1920 212223 24 1 2 3 4 5 60
0.2
0.4
0.6
0.8
1
Fre
quen
cy
UTC
Figure C4. Summary of cloud cover for Edwards AFB, California from January 93 to May 94: (a) relative frequency of
cloud cover, (b) diurnal cycle of cloud cover relative frequency centered at local noon, and (c) monthly mean cloud cover.
a)
b)
c)
J
J
J
JJ
J
J JJJ
J
J
J F M A M J J A S O N D J F M A M0
102030405060708090
100
Clo
ud C
over
(%
)
Month

62
J F M A M J J A S O N D J F M A M0
0.2
0.4
0.6
0.8
1F
requ
ency
Month
0%
10% to 20%
30% to 40%
50% to 60%
70% to 80%
90% to 100%
7 8 9 10 1112 1314 1516 1718 1920 212223 24 1 2 3 4 5 60
0.2
0.4
0.6
0.8
1
Fre
quen
cy
UTC
Figure C5. Summary of cloud cover for Eglin AFB, Florida from January 93 to May 94: (a) relative frequency of cloud
cover, (b) diurnal cycle of cloud cover relative frequency centered at local noon, and (c) monthly mean cloud cover.
a)
b)
c)
J J
JJ J
JJJJ
J
J F M A M J J A S O N D J F M A M0
102030405060708090
100
Clo
ud C
over
(%
)
Month

63
J F M A M J J A S O N D J F M A M0
0.2
0.4
0.6
0.8
1F
requ
ency
Month
0%
10% to 20%
30% to 40%
50% to 60%
70% to 80%
90% to 100%
7 8 9 10 1112 1314 1516 1718 1920 212223 24 1 2 3 4 5 60
0.2
0.4
0.6
0.8
1
Fre
quen
cy
UTC
Figure C6. Summary of cloud cover for Fairchild AFB, Washington from January 93 to May 94: (a) relative frequency of
cloud cover, (b) diurnal cycle of cloud cover relative frequency centered at local noon, and (c) monthly mean cloud cover.
a)
b)
c)
JJ J
J
J
J J
JJ J
J
J
J F M A M J J A S O N D J F M A M0
102030405060708090
100
Clo
ud C
over
(%
)
Month

64
No Data Available
Figure C7. Summary of cloud cover for Griffis AFB, New York from January 93 to May 94: (a) relative frequency of cloudcover, (b) diurnal cycle of cloud cover relative frequency centered at local noon, and (c) monthly mean cloud cover.

65
No Data Available
Figure C8. Summary of cloud cover for Hill AFB, Utah from January 93 to May 94: (a) relative frequency of cloud cover,(b) diurnal cycle of cloud cover relative frequency centered at local noon, and (c) monthly mean cloud cover.

66
No Data Available
Figure C9. Summary of cloud cover for Kelly AFB, Texas from January 93 to May 94: (a) relative frequency of cloud cover,(b) diurnal cycle of cloud cover relative frequency centered at local noon, and (c) monthly mean cloud cover.

67
J F M A M J J A S O N D J F M A M0
0.2
0.4
0.6
0.8
1F
requ
ency
Month
0%
10% to 20%
30% to 40%
50% to 60%
70% to 80%
90% to 100%
7 8 9 10 1112 1314 1516 1718 1920 212223 24 1 2 3 4 5 60
0.2
0.4
0.6
0.8
1
Fre
quen
cy
UTC
Figure C10. Summary of cloud cover for Langley AFB, Virginia from January 93 to May 94: (a) relative frequency of
cloud cover, (b) diurnal cycle of cloud cover relative frequency centered at local noon, and (c) monthly mean cloud cover.
a)
b)
c)
J
JJJ J J J
J J
J
J F M A M J J A S O N D J F M A M0
102030405060708090
100
Clo
ud C
over
(%
)
Month

68
J F M A M J J A S O N D J F M A M0
0.2
0.4
0.6
0.8
1F
requ
ency
Month
0%
10% to 20%
30% to 40%
50% to 60%
70% to 80%
90% to 100%
7 8 9 10 1112 1314 1516 1718 1920 212223 24 1 2 3 4 5 60
0.2
0.4
0.6
0.8
1
Fre
quen
cy
UTC
Figure C11. Summary of cloud cover for Loring AFB, Maine from January 93 to May 94: (a) relative frequency of cloud
cover, (b) diurnal cycle of cloud cover relative frequency centered at local noon, and (c) monthly mean cloud cover.
a)
b)
c)
J
J J J J
J J
JJ J
J J
J F M A M J J A S O N D J F M A M0
102030405060708090
100
Clo
ud C
over
(%
)
Month

69
J F M A M J J A S O N D J F M A M0
0.2
0.4
0.6
0.8
1F
requ
ency
Month
0%
10% to 20%
30% to 40%
50% to 60%
70% to 80%
90% to 100%
7 8 9 10 1112 1314 1516 1718 1920 212223 24 1 2 3 4 5 60
0.2
0.4
0.6
0.8
1
Fre
quen
cy
UTC
Figure C12. Summary of cloud cover for Luke AFB, Arizona from January 93 to May 94: (a) relative frequency of cloud
cover, (b) diurnal cycle of cloud cover relative frequency centered at local noon, and (c) monthly mean cloud cover.
a)
b)
c)
J
J J
J
J
J
J
J
J F M A M J J A S O N D J F M A M0
102030405060708090
100
Clo
ud C
over
(%
)
Month

70
No Data Available
Figure C13. Summary of cloud cover for McClellan AFB, California from January 93 to May 94: (a) relative frequency ofcloud cover, (b) diurnal cycle of cloud cover relative frequency centered at local noon, and (c) monthly mean cloud cover.
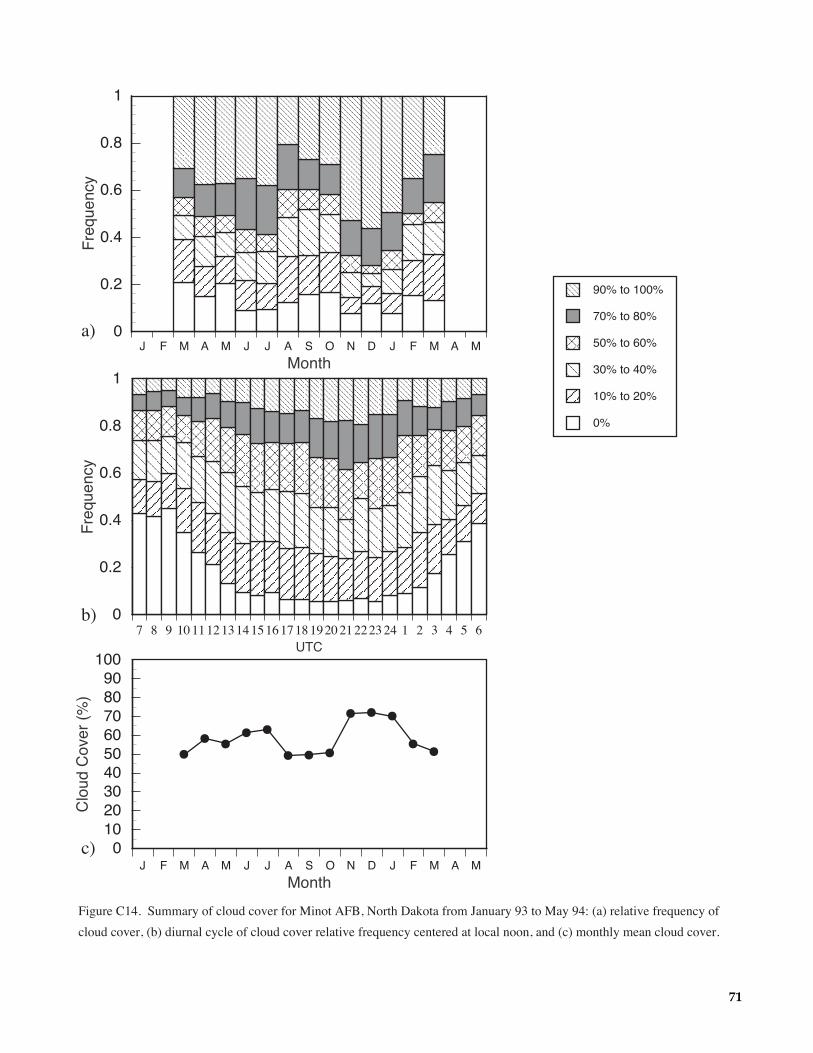
71
J F M A M J J A S O N D J F M A M0
0.2
0.4
0.6
0.8
1F
requ
ency
Month
0%
10% to 20%
30% to 40%
50% to 60%
70% to 80%
90% to 100%
7 8 9 10 1112 1314 1516 1718 1920 212223 24 1 2 3 4 5 60
0.2
0.4
0.6
0.8
1
Fre
quen
cy
UTC
Figure C14. Summary of cloud cover for Minot AFB, North Dakota from January 93 to May 94: (a) relative frequency of
cloud cover, (b) diurnal cycle of cloud cover relative frequency centered at local noon, and (c) monthly mean cloud cover.
a)
b)
c)
J
JJJ J
J J J
J J J
JJ
J F M A M J J A S O N D J F M A M0
102030405060708090
100
Clo
ud C
over
(%
)
Month

72
J F M A M J J A S O N D J F M A M0
0.2
0.4
0.6
0.8
1F
requ
ency
Month
0%
10% to 20%
30% to 40%
50% to 60%
70% to 80%
90% to 100%
7 8 9 1011 121314 1516 1718 1920 2122 2324 1 2 3 4 5 60
0.2
0.4
0.6
0.8
1
Fre
quen
cy
UTC
Figure C15. Summary of cloud cover for Mountain Home AFB, Idaho from January 93 to May 94: (a) relative frequency of
cloud cover, (b) diurnal cycle of cloud cover relative frequency centered at local noon, and (c) monthly mean cloud cover.
a)
b)
c)
J
J
JJ
J
JJ
J
J
J
J
J
J
J F M A M J J A S O N D J F M A M0
102030405060708090
100
Clo
ud C
over
(%
)
Month

73
J F M A M J J A S O N D J F M A M0
0.2
0.4
0.6
0.8
1F
requ
ency
Month
0%
10% to 20%
30% to 40%
50% to 60%
70% to 80%
90% to 100%
7 8 9 10 1112 1314 1516 1718 1920 212223 24 1 2 3 4 5 60
0.2
0.4
0.6
0.8
1
Fre
quen
cy
UTC
Figure C16. Summary of cloud cover for Offut AFB, Nebraska from January 93 to May 94: (a) relative frequency of cloud
cover, (b) diurnal cycle of cloud cover relative frequency centered at local noon, and (c) monthly mean cloud cover.
a)
b)
c)
JJJ
J JJ
J
J J J
J JJJ
J
J F M A M J J A S O N D J F M A M0
102030405060708090
100
Clo
ud C
over
(%
)
Month

74
No Data Available
Figure C17. Summary of cloud cover for Tinker AFB, Oklahoma from January 93 to May 94: (a) relativefrequency of cloud cover, (b) diurnal cycle of cloud cover relative frequency centered at local noon, and(c) monthly mean cloud cover.

75
J F M A M J J A S O N D J F M A M0
0.2
0.4
0.6
0.8
1F
requ
ency
Month
0%
10% to 20%
30% to 40%
50% to 60%
70% to 80%
90% to 100%
7 8 9 10 1112 1314 1516 1718 1920 212223 24 1 2 3 4 5 60
0.2
0.4
0.6
0.8
1
Fre
quen
cy
UTC
Figure C18. Summary of cloud cover for Whiteman AFB, Missouri from January 93 to May 94: (a) relative frequency of
cloud cover, (b) diurnal cycle of cloud cover relative frequency centered at local noon, and (c) monthly mean cloud cover.
a)
b)
c)
J J
J
J J J
JJ J
J
J
J
J
J
J
J
J F M A M J J A S O N D J F M A M0
102030405060708090
100
Clo
ud C
over
(%
)
Month

76
J F M A M J J A S O N D J F M A M0
0.2
0.4
0.6
0.8
1F
requ
ency
Month
0%
10% to 20%
30% to 40%
50% to 60%
70% to 80%
90% to 100%
7 8 9 10 1112 1314 1516 1718 1920 212223 24 1 2 3 4 5 60
0.2
0.4
0.6
0.8
1
Fre
quen
cy
UTC
Figure C19. Summary of cloud cover for Wright Patterson AFB, Ohio from January 93 to May 94: (a) relative frequency of
cloud cover, (b) diurnal cycle of cloud cover relative frequency centered at local noon, and (c) monthly mean cloud cover.
a)
b)
c)
J
JJJ J J
J
JJJ
J J
J F M A M J J A S O N D J F M A M0
102030405060708090
100
Clo
ud C
over
(%
)
Month

77
References
Angell, J. K. 1990: Variation in United States Cloudiness andSunshine Duration Between 1950 and the Drought Year of1988. J. Climate, 3, 296-308.
Angell, J. K.; Korshover, K. J.; and Cotton, G. F. 1984:Variation in United States Cloudiness and Sunshine. J.Climate Appl. Meteorol., 23, 752-761.
Appleman, H., 1953: The Formation of Exhaust CondensationTrails by Jet Aircraft. Bull. Am. Meteorol. Soc., 34, pp.14-20.
Bakan, S.; Betancour, M.; Gayler, V.; and Grassl, H. 1994:Contrail Frequency Over Europe From NOAA-SatelliteImages. Annal. Geophys., 12, 962-968.
Baughcum, S. L. 1996: Subsonic Aircraft EmissionInventories. Atmospheric Effects of Aviation: First Reportof the Subsonic Assessment Project, NASA RP-1385, pp.15-29.
Baughcum, S. L.; Metwally, M.; Seals, R. K.; and Wuebbles, D.J., 1993: Emissions Scenarios Development: CompletedScenarios Database. Atmospheric Effects of StratosphericAircraft: A Third Program NASA RP-1313, pp. 185-208.
Carleton, A. M.; and Lamb, P. J.: 1986: Jet Contrails andCirrus Cloud: A Feasibility Study Employing High-Resolution Satellite Imagery. Bull. Am. Meteorol. Soc.,67, 301-309.
Changnon, S. A. 1981: Midwestern Sunshine and TemperatureTrends Since 1901: Possible Evidence of Jet ContrailEffects. J. Appl. Meteorol., 20, pp. 496-508.
DeGrand, J. Q.; Carleton, A. M.; and Lamb, P. J. 1990: A Mid-Season Climatology of Jet Condensation Trails FromHigh-Resolution Satellite Data. Proc. of the AMS 7thConf. on Atmos. Radiation, San Francisco, CA, July 23-27, 309-311.
Engelstad, M.; Sengupta, S. K.; Lee, T.; and Welch, R. M.1992: Automated Detection of Jet Contrails Using theAVHRR Split Window. Intl. J. Remote Sensing, 13, 1391-1412.
Hahn, C. J.; Warren, S. G.; London, J.; Chervin; and Jenne, R.L., 1984: Atlas of Simultaneous Occurrence of DifferentCloud Types Over Land. NCAR Technical Note TN-241+STR, Boulder, Colorado, 212 pp.
Hahn, C. J.; Warren, S. G.; London, J.; Chervin; and Jenne, R.L., 1986: Global Distribution of Total Cloud Cover andCloud Type Amounts Over Land. NCAR Technical Note TN-273+STR, Boulder, Colorado, 288 pp.
Hahn, C. J.; Warren, S. G.; and London, J. 1995: The Effect ofMoonlight on Observation of Cloud Cover at Night, andApplication to Cloud Climatology. J. Climate, 8, pp.1429-1446.
Hanson, H. M.; and Hanson, D. M. 1995: A Reexamination ofthe Formation of Exhaust Condensation Trails by JetAircraft. J. Appl. Meteorol., 34, pp. 2400-2405.
Joseph, J. H.; Levin, Z.; Mekler, Y.; Ohring, G.; and Otterman,J. 1975. Study of Contrails From the ERTS 1 SatelliteImagery. J. Geophys. Res., 80, 366-372.
Karcher, B., 1994: Transport of Exhaust Products in the NearTrail of a Jet Engine Under Atmospheric Conditions. J.Geophys. Res., 99, pp. 14,509-14,517.
Kuhn, P. M. 1970: Airborne Observations of Contrail Effectson the Thermal Radiation Budget. J. Atmos. Sci., 27, 937-942.
Lee, T. F. 1989: Jet Contrail Identification Using the AVHRRInfrared Split Window. J. Appl. Meteorol., 28, 993-995.
Liepert, B.; Fabian, P.; and Grassl, H. 1994: Solar Radiation inGermany - Observed Trends and an Assessment of TheirCauses Part I: Regional Approach. Beitr. Phys. Atmosph.,67, 15-29.
Murcray, W. B., 1970: On the Possibility of WeatherModification by Aircraft Contrails. Mon. Wea. Rev., 98,pp. 745-748.
Sadler, J. C., 1977: The Upper Tropospheric Circulation Overthe Tropics, Part II - Statistics. University of HawaiiTechnical Report UHMET-77-02, Department ofMeteorology, University of Hawaii, Honolulu, NSF GrantNo. GA-36301, April, 24 pp.
Seaver, W. L.; and Lee, J. E. 1987: A Statistical Examinationof Sky Cover Changes in the Contiguous United States. J.Clim. Appl. Meteorol., 26, pp. 88-95.
Schumann, U. 1996: On Conditions for Contrail FormationFrom Aircraft Exhausts. Meteorol. Zeitschrift, 5, pp. 4-23.
Schumann, U.; and Wendling, P. 1993: Determination ofContrails From Satellite Data and Observational Results.Air Traffic and the Environment, Proc. of DLR Intl.Colloquium, Bonn, Germany, Nov. 15-16, Springer-Verlag, NY, 138-153.
Scorer, R. S., 1972: Clouds of the World. David & Charles(Publishers) Ltd., 176 pp.
Thompson, A. M., Friedl, R. R.; and H. L. Wesoky, 1996:Introduction and Overview. Atmospheric Effects ofAviation: First Report of the Subsonic Assessment Project,NASA RP-1385, pp. 1-14.
Weber, G.-R. 1990: Spatial and Temporal Variation ofSunshine in the Federal Republic of Germany. Theor. Appl.Climatol., 41, 1-9.

78
� � � � � # Total # Indet. Persistent Contrails (%) Contrails, not Persistent (%) No Contrails (%) Station� Location� Dates� Samples with Ci no Ci with Ci� no Ci with Ci no Ci with Ci Barksdale, LA� 32.5ûN, 93.7ûW� 1/93 - 3/94 5572 1373/471� 1.0 (1.5) 12.0 (18.0)� 1.1 (1.7) 4.2 (6.3) 20.5(30.6) 28.1(42.0)
Beale, CA� 39.1ûN,121.4ûW� 1/93 - 3/94 4829 686/304� 1.6 (2.0) 6.9 (8.7)� 0.5 (0.7) 1.4 (1.8) 39.7 (50.0) 29.4 (36.9)
Cairns, A�� 31.3ûN, 85.7ûW� 5/93 -12/93 2896 290/238� 0.4 (0.5) 5.1 (6.3)� 0.2 (0.2) 0.8 (0.9) 30.4 (37.2) 44.9 (54.9)
Edwards, CA� 34.9ûN,117.9ûW� 4/93 - 3/94 4517 133/29� 0.6 (0.7) 14.2 (14.8)� 1.0 (1.1) 2.3 (2.4) 40.8 (42.3) 37.6 (39.0)
Eglin, FL�� 30.5ûN, 86.5ûW� 3/93 - 5/94 2552 536/221� 1.1 (1.6) 2.6 (3.8)� 0.3 (0.5) 0.3 (0.4) 34.5 (49.6) 33.6 (48.4)
Fairchild, WA� 47.6ûN,117.6ûW� 5/93 - 4/94 3658 984/97� 4.4 (6.2) 4.7 (6.6)� 1.9 (2.7) 1.6 (2.3) 37.2 (52.7) 20.8 (29.5)
Griffis, NY� 43.2ûN, 75.4ûW� 3/93 - 3/94 4911 1765/94� 0.5 (0.7) 8.8 (14.2)� 1.0 (1.6) 2.5 (4.0) 24.4 (39.3) 25.0 (40.2)
Hill, UT� � 41.1ûN,112.0ûW� 4/93 - 3/94 4682 568/197� 0.8 (0.9) 10.1 (12.1)� 1.4 (1.6) 3.1 (3.8) 27.9 (33.3) 40.5 (48.4)
Kelly, TX� 28.9ûN, 97.8ûW� 3/93 - 3/94 5653 1392/187� 0.4 (0.5) 3.9 (5.4)� 0.2 (0.2) 0.4 (0.5) 31.1 (43.2) 36.3 (50.3)
Langley, VA� 37.1ûN, 76.4ûW� 3/93 - 4/94 3249 684/177� 5.1 (6.9) 9.5 (13.0)� 2.8 (3.8) 2.2 (3.0) 31.6 (43.1) 22.3 (30.3)
Loring, ME� 46.9ûN, 67.9ûW� 3/93 - 2/94 4459 2264/40� 3.2 (6.7) 0.9 (1.9)� 2.2 (4.5) 0.3 (0.7) 38.9 (80.5) 2.8 (5.8)
Luke, AZ�� 33.5ûN,112.4ûW� 3/93 -10/93 2998 41/95� 0.2 (0.2) 4.9 (5.2)� 1.1 (1.2) 7.6 (8.0) 40.5 (42.4) 41.1 (43.1)
McClellan, CA� 38.7ûN,121.4ûW� 3/93 - 3/94 3425 318/97� 1.8 (2.1) 12.4 (14.1)� 0.3 (0.4) 1.8 (2.1) 42.7 (48.6) 28.8 (32.8)
Minot, ND� 48.4ûN,101.4ûW� 3/93 - 3/94 4928 1433/462� 0.8 (1.3) 3.0 (4.9)� 0.5 (0.8) 1.3 (2.2) 25.4 (41.3) 30.5 (49.6)
Mt. Home, ID� 43.1ûN,115.9ûW� 3/93 - 3/94 4928 1167/485� 2.5 (3.7) 3.4 (5.1)� 0.9 (1.3) 1.1 (1.6) 33.0 (49.7) 25.6 (38.6)
Offut, NE�� 41.1ûN, 95.9ûW� 1/93 - 3/94 5606 1796/709� 0.6 (1.0) 9.5 (17.2)� 1.5 (2.7) 4.0 (7.2) 15.9 (28.8) 23.8 (43.1)
Tinker, OK� 35.4ûN, 97.4ûW� 4/93 - 4/94 4271 885/66� 0.7 (0.9) 7.3 (9.6)� 0.6 (0.8) 1.5 (2.0) 31.5 (41.9) 33.7 (44.8)
Whiteman. MO� 38.7ûN, 93.6ûW� 1/93 - 5/94 5856 1724/356� 0.8 (1.2) 3.7 (5.8)� 1.6 (2.5) 3.8 (6.0) 23.8 (36.9) 30.7 (47.7)
Wright-Pat., OH� 39.8ûN, 84.1ûW� 4/93 - 3/94 3696 1116/624� 3.4 (6.4) 11.7 (22.1)� 2.0 (3.7) 2.0 (3.7) 20.8 (39.2) 13.2 (24.9)
Table 1. Contrail occurence summary, numbers in parenthesis refer to percentages computed relative to total number of � � observations with indeterminate data omitted.

79
Table 2. Diurnal characteristics of total contrail occurrence without indeterminate data.
StationMaximumNumber ofSamples
Time ofPrimary
MaximumUTC(LST)
Time ofSecondaryMaximumUTC(LST)
MeanOccurrenceFrequency
of allcontrails,
M
(Max1 - Min)/2M (%) (Max2 - Min)/2M (%)
Barksdale, LA 448 23 (17) 20 (12) 0.254 23 19
Beale, CA 405 1 (17) 17 (9) 0.115 39 38
Cairns, AL 235 15 (9) 24 (18) 0.076 54 44
Edwards, CA 348 23 (15) 18 (10) 0.172 65 63
Eglin, FL 217 14 (8) 18 (12) 0.063 72 48
Fairchild, WA 320 16 (8) 19 (11) 0.177 51 46
Griffis, NY 393 13 (8) 21 (16) 0.195 35 12
Hill, UT 356 17 (10) 23 (16) 0.165 71 67
Kelly, TX 369 23 (17) 17 (10) 0.064 72 65
Langley, VA 276 14 (9) 18 (13) 0.241 38 19
Loring, ME 151 24 (19) 20 (15) 0.158 98 85
Luke, AZ 236 17 (10) 20 (13) 0.134 39 25
McClellan, CA 274 1 (17) 16 (8) 0.175 50 46
Minot, ND 393 18 (11) 22 (15) 0.087 85 66
Mt. Home, ID 395 23 (15) 20 (13) 0.107 78 51
Offut, NE 454 18 (12) 22 (16) 0.241 63 49
Tinker, OK 367 17 (10) 23 (16) 0.129 51 45
Whiteman. MO 480 16 (10) 19 (13) 0.143 54 33
Wright-Pat., OH 303 15 (9) 21 (15) 0.346 61 52

REPORT DOCUMENTATION PAGE Form ApprovedOMB No. 0704-0188
Public reporting burden for this collection of information is estimated to average 1 hour per response, including the time for reviewing instructions, searching existing data sources,gathering and maintaining the data needed, and completing and reviewing the collection of information. Send comments regarding this burden estimate or any other aspect of thiscollection of information, including suggestions for reducing this burden, to Washington Headquarters Services, Directorate for Information Operations and Reports, 1215 JeffersonDavis Highway, Suite 1204, Arlington, VA 22202-4302, and to the Office of Management and Budget, Paperwork Reduction Project (0704-0188), Washington, DC 20503.
1. AGENCY USE ONLY (Leave blank) 2. REPORT DATE
December 19973. REPORT TYPE AND DATES COVERED
Reference Publication4. TITLE AND SUBTITLE
Surface-Based Observations of Contrail Occurence Frequency Over the U.S.,April 1993 - April 1994
5. FUNDING NUMBERS
WU 538-08-12-01
6. AUTHOR(S)
Patrick Minnis, J. Kirk Ayers, and Steven P. Weaver
7. PERFORMING ORGANIZATION NAME(S) AND ADDRESS(ES)
NASA Langley Research CenterHampton, VA 23681-2199
8. PERFORMING ORGANIZATIONREPORT NUMBER
L-17633
9. SPONSORING/MONITORING AGENCY NAME(S) AND ADDRESS(ES)
National Aeronautics and Space AdministrationWashington, DC 20546-0001
10. SPONSORING/MONITORINGAGENCY REPORT NUMBER
NASA RP-1404
11. SUPPLEMENTARY NOTES
Minnis: Langley Research Center, Hampton VA; Ayers: Analytical Services and Materials, Inc., Hampton, VA;Weaver: 88th Weather Squadron, Wright-Patterson Air Force Base, OH.
12a. DISTRIBUTION/AVAILABILITY STATEMENT
Unclassified-UnlimitedSubject Category 47 Distribution: StandardAvailability: NASA CASI (301) 621-0390
12b. DISTRIBUTION CODE
13. ABSTRACT (Maximum 200 words)
Surface observers stationed at 19 U.S. Air Force Bases and Army Air Stations recorded the daytime occurrence ofcontrails and cloud fraction on an hourly basis for the period April 1993 through April 1994. Each observationuses one of four main categories to report contrails as unobserved, non-persistent, persistent, and indeterminate.Additional classification includes the co-occurrence of cirrus with each report. The data cover much of thecontinental U.S. including locations near major commercial air routes. The mean annual frequency of occurrencein unobstructed viewing conditions is 13 percent for these sites. Contrail occurrence varied substantially withlocation and season. Most contrails occurred during the winter months and least during the summer with apronounced minimum during July. Although nocturnal observations are not available, it appears that thecontrails have a diurnal variation that peaks during mid morning over most areas. Contrails were most oftenobserved in areas near major commercial air corridors and least often over areas far removed from the heaviest airtraffic. A significant correlation exists between mean contrail frequency and aircraft fuel usage above 7 kmsuggesting predictive potential for assessing future contrail effects on climate.
14. SUBJECT TERMS
Contrails, Cirrus Clouds, Surface Observation, Subsonic Assessment,15. NUMBER OF PAGES
83
Aircraft Effects, Climate Change 16. PRICE CODE
A0517. SECURITY CLASSIFICATION
OF REPORT
Unclassified
18. SECURITY CLASSIFICATIONOF THIS PAGE
Unclassified
19. SECURITY CLASSIFICATION OF ABSTRACT
Unclassified
20. LIMITATION OF ABSTRACT
NSN 7540-01-280-5500 Standard Form 298 (Rev. 2-89)Prescribed by ANSI Std. Z-39-18298-102


