267 Surface Engineering in Materials Science III Edited by A. Agarwal, N.B. Dahotre, S. Seal, J.J. Moore, C. Blue TMS (The Minerals, Metals & Materials Society), 2005 DESIGN AND TUNING OF A VACUUM MICROPLASMA SPRAY SYSTEM: PARTICLE ENTRAINMENT W. Scott Crawford 1 , Mark A. Cappelli 1 , Friedrich B. Prinz 2 1 Stanford University, Mechanical Engineering Dept. Bldg. 520 Room 520-I, Stanford, CA 94305-3032, USA 2 Stanford University, Mechanical Engineering and Materials Science & Engineering Depts. Bldg. 530 Room 220, Stanford CA 94305-3030, USA Keywords: Vacuum plasma spraying, Microplasma, System design, Metal deposition Abstract A vacuum microplasma spray system, operating on gross power levels of 1-3 kW, with powder feed rates below 1 g/min and using plasma gas mixtures of argon and hydrogen, was built and tested. In order to improve the deposition efficiency and quality of coatings, the system was analyzed and the matter of particle entrainment into the plasma jet core was identified as a critical sub-process. Particle entrainment is a strong function of carrier gas flow rate. Best carrier gas flow rates for entrainment of stainless steel, titanium, and tungsten powders, particle trajectories were determined by quantitative imaging with planar laser Mie scattering. It was found that particle distributions with greater average mass were less likely to overshoot the plasma jet core. This may be attributed to the particle accelerations within the particle injector. Introduction Motivation Plasma spraying is able to deposit coatings in a wide variety of materials and thicknesses [1, 2]. Protective coatings constitute one major class, as they are produced in commercial plasma spraying to improve the performance or lifetime of components in harsh environments of heat, corrosion, and wear. Newer applications for plasma spraying include biomedical coatings of titanium or hydroxyapatite. Strengths of the plasma spray process include the ability to deposit almost any material that has a liquid phase at moderate pressures, and the ability to independently control the temperature of the substrate’s bulk. Sprayed coatings often exhibit some porosity. Porosity can limit their use to conditions of low mechanical loading, but controlled porosity can also be advantageous for some applications, such as thermal barrier coatings, and biomedical coatings for bone ingrowth. The technology and the industry of plasma spraying have matured over several decades of effort to improve the quality and repeatability of the coatings. For the most part, these efforts have been limited to a conventional range of gross arc power (25-60 kW) and deposition rate (50-100 g/min) [1]. The success of many existing applications increases with increasing deposition rate. However, in recent years there have been increasing efforts in both research and industry to extend the process of plasma spraying into a new regime of gross arc power (approximately 500W-4kW) and deposition rate (4-40 g/min) [3-7]. This regime has typically been termed microplasma spraying, benefiting applications where small deposition spot size,
Transcript
267
Surface Engineering in Materials Science III Edited by A. Agarwal, N.B. Dahotre, S. Seal, J.J. Moore, C. Blue
TMS (The Minerals, Metals & Materials Society), 2005
DESIGN AND TUNING OF A VACUUM MICROPLASMA SPRAY SYSTEM: PARTICLE ENTRAINMENT
W. Scott Crawford1, Mark A. Cappelli1, Friedrich B. Prinz2
Bldg. 520 Room 520-I, Stanford, CA 94305-3032, USA 2Stanford University, Mechanical Engineering and Materials Science & Engineering Depts.
Bldg. 530 Room 220, Stanford CA 94305-3030, USA
Keywords: Vacuum plasma spraying, Microplasma, System design, Metal deposition
Abstract A vacuum microplasma spray system, operating on gross power levels of 1-3 kW, with powder feed rates below 1 g/min and using plasma gas mixtures of argon and hydrogen, was built and tested. In order to improve the deposition efficiency and quality of coatings, the system was analyzed and the matter of particle entrainment into the plasma jet core was identified as a critical sub-process. Particle entrainment is a strong function of carrier gas flow rate. Best carrier gas flow rates for entrainment of stainless steel, titanium, and tungsten powders, particle trajectories were determined by quantitative imaging with planar laser Mie scattering. It was found that particle distributions with greater average mass were less likely to overshoot the plasma jet core. This may be attributed to the particle accelerations within the particle injector.
Introduction Motivation Plasma spraying is able to deposit coatings in a wide variety of materials and thicknesses [1, 2]. Protective coatings constitute one major class, as they are produced in commercial plasma spraying to improve the performance or lifetime of components in harsh environments of heat, corrosion, and wear. Newer applications for plasma spraying include biomedical coatings of titanium or hydroxyapatite. Strengths of the plasma spray process include the ability to deposit almost any material that has a liquid phase at moderate pressures, and the ability to independently control the temperature of the substrate’s bulk. Sprayed coatings often exhibit some porosity. Porosity can limit their use to conditions of low mechanical loading, but controlled porosity can also be advantageous for some applications, such as thermal barrier coatings, and biomedical coatings for bone ingrowth. The technology and the industry of plasma spraying have matured over several decades of effort to improve the quality and repeatability of the coatings. For the most part, these efforts have been limited to a conventional range of gross arc power (25-60 kW) and deposition rate (50-100 g/min) [1]. The success of many existing applications increases with increasing deposition rate. However, in recent years there have been increasing efforts in both research and industry to extend the process of plasma spraying into a new regime of gross arc power (approximately 500W-4kW) and deposition rate (4-40 g/min) [3-7]. This regime has typically been termed microplasma spraying, benefiting applications where small deposition spot size,
268
reduced standoff distance from spray torch to substrate, and other small-scale characteristics are desired over high deposition rate. This work focuses on the design and operation of a vacuum microplasma (VMPS) spray system operating at gross arc power levels of ~1.4 kW and deposition rates below 1 g/min. To date, there have been no published attempts at microplasma spraying in the vacuum environment. At the conventional scale, vacuum plasma spraying (VPS) has been under development for nearly as long as has atmospheric pressure plasma spraying (APS). VPS, in which the plasma plume and the coating are produced in a sealed, reduced-pressure chamber, allows greater control than does APS over chemical reactions that may occur between the process gases or ambient gases and the coating material. The vacuum condition also reduces losses in momentum and enthalpy of the plasma jet by reducing the effect of entrained ambient gas. These features of the VPS process render it especially appropriate for deposition of metals that are easily oxidized or are difficult to melt. The vacuum process also opens opportunities of reactive plasma spraying. Furthermore, if pushed to extremely low rates of spray deposition, VMPS offers the possibility of simultaneous co-deposition of sprayed material with vapor-deposited material in order to create novel composite coatings. VMPS System Figure 1 shows a schematic of our VMPS system. It has the same elements as a conventional VPS system, with the exception of a translation stage for either the spray torch or the substrate. That is, the coatings were deposited with the torch stationary over the substrate. Also, different from many installations, the plasma jet axis was directed downward with respect to gravity.
Figure 1. System schematic of vacuum microplasma spray (VMPS) system. The key design features are as follows. The plasma torch is a modified Komatsu Fine Plasma cutting torch, with throat diameter of 1mm. The modifications are the addition of a Laval contour diverging section of exit-to-throat area ratio 4.5, the installation of a tungsten tip on the cathode, and arc operation in non-transferred mode. The nozzle has an internal powder injector of 1 mm diameter inclined at an angle of 30° to the horizontal and located such that its centerline intersects the nozzle contour 1.2 mm upstream of the exit plane. The Laval contour
269
was designed using the minimum-length algorithm of Foelsch for axisymmetric nozzles [8], for a design condition chamber pressure of 5.3 kPa (40 Torr) with a mixture of 45 mol% hydrogen and 55 mol% argon at a total plasma flow rate of 6.7 slm. In the nozzle design, a net arc power of 900W was assumed, as was a composition frozen at that resulting from thermodynamic equilibrium under adiabatic deposition of the net arc power at the nozzle’s stagnation pressure. Disturbances in the nozzle due to the added mass of carrier gas and particulate at the internal injector may negate the shock-free operation of the Laval nozzle even at its design backpressure. However, it was chosen in order to reduce swirl in the diverging section, and in practice was operated at underexpanded conditions in order to reduce entrainment of cold bath gas [9]. Underexpanded flow was confirmed by observing that the emissive plasma jet increased in diameter upon exiting the nozzle, forming a diamond shock pattern in the plume. The powder feeder was designed and built in order to achieve stable average feed rates, variable from 0.06 g/min to 0.8 g/min using 316L stainless steel powder of 5-45 µm size distribution. These feed rates occur at feed screw rotation rates of 0.5 Hz and 6 Hz, respectively. Because it utilizes a feed screw design, some fluctuation in delivery rate occurs at the frequency of the feed screw’s rotation. The ratio of pulsed to average powder flow rate was reduced by stabilizing the feed screw at both ends with vacuum-compatible dry bearings in order to eliminate procession of its tip. The design of the powder feeder has been refined to eliminate convection of powder into the injector upon initial pump-down of the vacuum chamber. The feeder pumping valve and tuned orifice are open during initial pump-down. This allows the initial outflow of air from the powder feeder to travel approximately equally in the two available directions: into the process chamber and through the rear of the powder feeder. The result is a negligible net force on the powder bed in the hopper and hence negligible amounts of unwanted powder flow. After initial pump-down and before flowing carrier gas, the powder feeder’s vacuum pumping valve is closed. Figure 1 does not illustrate much of the instrumentation of the system. All gas flow rates are metered and measured with thermal mass flow controllers. All three independent cooling water loops have flow rates measured with calibrated rotameters, and the temperature rise in each loop is measured with a K-type thermocouple circuit using the inlet temperature as reference, allowing calorimetry to be performed on the three cooled regions (anode/cathode, nozzle diverging section, and substrate). The arc current is measured with a Hall effect current sensor. Arc voltage is measured with a voltmeter protected by a 20X voltage probe and a fast-acting rectifier circuit for shunting high-voltage spikes to ground. Process chamber pressure and powder feeder manifold pressure are measured with capacitance diaphragm gauges of 15 kPa and 150 kPa ranges, respectively. Powder feeder screw rotation rate is measured by tachogenerator output, which is calibrated to average feed rate for each powder prior to running an experiment. The stability of average powder feed rate has been tested by continuous sampling during deposition of powder onto a 50-gram capacity load cell. The analog signals from all the sensors are continuously scanned and stored digitally on a PC during an experiment. National Instruments LabView software is used to sample via GPIB interface at 20Hz the output of a Fluke 8840A multimeter, whose input is scanned across all sensors with a Keithley 7001 Switch System equipped with a Keithley 7158 Scanner Card. Additionally, a planar laser scattering system, for particle trajectory imaging, was used as described below. Sub-processes in Vacuum Plasma Spraying Many design and operating choices affect the final coating in a plasma spray process. The quality of a coating has been found to depend primarily on the (enthalpy h, velocity v) “state” of droplets at the onset of impact with the substrate [10]. Plasma spraying is a complex process,
270
as an injected particle goes through a sequence of sub-processes en route to its incorporation into a coating, all of which affect the (h,v)impact state of a particle. For the collection of particles, this state could be represented by distribution functions f(h) and f(v), which we will acknowledge by denoting the vector [f(h), f(v)]impact. As will be shown below, initial coatings deposited with this system were of poor quality. It was useful to decompose (conceptually) the spray process in order to diagnose the problems and to improve spray conditions. Four sub-processes were defined in this work, as depicted in Figure 2. Sub-process 0, hereafter called “SP0”, is powder delivery to the plasma nozzle. In SP0, powder flow is metered by the screw rotation rate and is fluidized by the carrier gas flow rate. Sub-process 1 (“SP1”) is the formation of the plasma arc and the nozzle flow upstream of the injector. “SP2” comprises heat and momentum transfer to the particles by the plasma jet. “SP3” is the process of droplet impingement, flattening and solidification.
Figure 2. Schematic diagram of sub-processes as defined in the present work. One output of SP2 is the particle stream at its impact state [f(h), f(v)]impact. Thus SP2 can be considered the central sub-process. It can be further decomposed into three “sub-sub-processes”: 2ME, momentum transfer to particles in order to entrain them in the plasma jet; 2MA, axial momentum transfer to entrained particles that imparts their final axial component of velocity; and 2HT, heat transfer to and from entrained particles. The different arrows within SP2 in Figure 2 represent the range of possible particle trajectories that depend on 2ME. Particles not entrained in the plasma jet are lost to the process, which was found to be a problem at the conditions first tested for this system. The outputs of SP0 and SP1 are the inputs to SP2. The inputs to SP0 and SP1 are the material and power inputs to the process.
System Testing 316L Stainless Steel as Test Powder For system characterization, stainless steel was chosen as a test powder because, among metals, it has fairly median properties in terms of spraying difficulty. In the simplest scaling analysis, one can define a “difficulty of melting” function of a particle [11]: ρHDMOD =.".." (1) where H is the intensive enthalpy added to the powder when it reaches its fully molten state,
-
Sub-process 0
Sub-process 1
Sub-process 2: 2MA, 2ME, 2HT
Sub-process 3
271
( ) sfrefMp hTTcH ∆+−= (2) D is the particle diameter (assuming spherical particles), ρ is the particle density, cp is specific heat, and ∆hsf is the latent heat of fusion. Embedded in Eqn. (1) is the tradeoff between the required heat transfer for melting and the residence time in the plasma. The D.O.M. parameter of Eqn. (1) is proportional to the required enthalpy in the plasma jet [11]. In order to compare materials independent of particle size, Eqn. (1) can be reduced by eliminating the factor D. Table 1 shows the value of ρH for several materials of interest for VMPS deposition. 316L stainless steel has nearly the median value in all four columns, with its D.O.M. parameter within 20% of the maximum.
Table 1. “Difficulty of melting” parameters calculated for five materials of interest. Material TM (K) H (kJ kg-1) ρ (kg m-3) ρH (107 kg1/2m1/2s-2)
Initial Coatings The system was initially run under the conditions shown in Table 2. Figure 3 shows optical micrographs of a representative cross-section of the resulting coating. From Figure 3(a), it is clearly a very porous coating. Figure 3(b) shows that the splats have not flattened properly, and there is evidence of an incompletely molten particle near the center of the image. Another failing of this process condition, for most processing applications anyway, was its deposition efficiency (DE), which was only 0.16%. DE is defined as the ratio of coating mass to total mass of powder fed. Per the basic methodology mentioned above, the flaws in the coating were attributed to likely causes, and system tuning proceeded.
Table 2. Operating conditions for trial coating, after finalizing system design. Powder material 316L stainless steel, water atomized
Powder particle size range 5-44 micron Powder feed rate 0.4 g/min Substrate material OFHC copper, smooth, non-etched Standoff distance 37 mm
Plasma arc gross power 25.3 A x 50.1 V = 1.27 kW Plasma gas hydrogen fraction 44 mol%
Plasma gas argon fraction 56 mol%
Plasma gas flow rate 6.7 slm
Carrier gas flow rate and composition 500 sccm argon Substrate surface temperature 400 °C
272
a. b.
Figure 3. Cross-sectional optical micrographs of coating deposited at conditions in Table 2. (a) Low magnification (bar = 100 microns), polished but not etched: wide scale porosity is revealed. (b) High magnification of a section near the top of the coating. Aqua regia etched to reveal grain and splat boundaries.
System Tuning: Procedure, Results and Discussion Rationale The decomposed view via sub-processes was used for conceiving the following method for improving on the flawed coatings. First, identify the most probable component of SP2 to blame for a given flaw. Second, identify the inputs to SP0 and SP1 that control that component of SP2. Third, tune those inputs by measuring their effect on SP2 itself if possible. The latter step required intra-process diagnostics such as trajectory measurements by planar laser scattering. As will be shown, the carrier gas flow of 500 sccm was found to force particles trajectories to severely overshoot the plasma jet (Figure 5). Therefore the low DE was attributed mainly to sub-sub-process 2ME. The porosity and splat flaws were attributed to low values of both himpact and vimpact, hence to sub-sub-processes 2HT and 2MA, respectively. The inputs to SP0 and SP1 affect all three components of SP2, sometimes with tradeoffs in effect, so a rationale was required for choice of conditions. 2ME was taken as the process of main study, because entrainment could be measured and because 2HT and 2MA only occur to particles that are entrained. 2ME, as a balance between the axial momentum of the plasma jet and the transverse (radial) momentum of the injected gas/particle stream, depends on the proportionality of the momentum outputs of SP1 and SP0, respectively. Therefore the overshoot could be improved by an increase in the Qplasma, a decrease in the Qcg, or both. It was not known how much Qcg could be reduced without particles settling out and clogging the powder injector line. However, an increase in Qplasma was expected to be detrimental to 2HT [10]. It was concluded to do the following. First, find a near-best condition for heat transfer to particles (SP1) by varying arc properties and plasma gas composition but with little change to Qplasma. Next, tune particle trajectories (2ME) by varying Qcg. Then, deposit coatings at the conditions indicated. SP1 Tuning (Arc and Nozzle Flow) In order to seek a more effective plasma condition for heat transfer than that of Table 2, under the constraint of Qplasma ~ 6.5 slm, several types of measurements were taken with varying gas composition and arc current. Bare high temperature thermocouples (“Type C”: W-5%Re vs. W-26%Re, 0.7 mm bead diameter) were placed in the plume under reduced-current conditions. The water-cooled substrate temperature was measured, as it is a measure of heat flux to the
273
substrate. It was found that all of these temperatures, as well as the thermal efficiency of the plasma torch,
( )
( )arc
iiiwaterwaterarc
thermal IV
TQcIV ∑=
∆−=
2
1,
η , where i = torch’s water cooling loops, (3)
were increased by a slight increase in the argon fraction. Although the power supply has a maximum current of 40 A, arc current was kept around 30 A in order to provide for increases in gross arc power to be made if necessary for matching other conditions such as net arc power, to prolong cathode and nozzle life, and because thermal efficiency has been found to decrease sharply in the 35-40 A range with this system operating on some gas mixtures. Table 3 summarizes the SP1 inputs that were hence chosen for the subsequent tests in this study. The steadiness of the arc power (important) was observed to be good at these conditions as well.
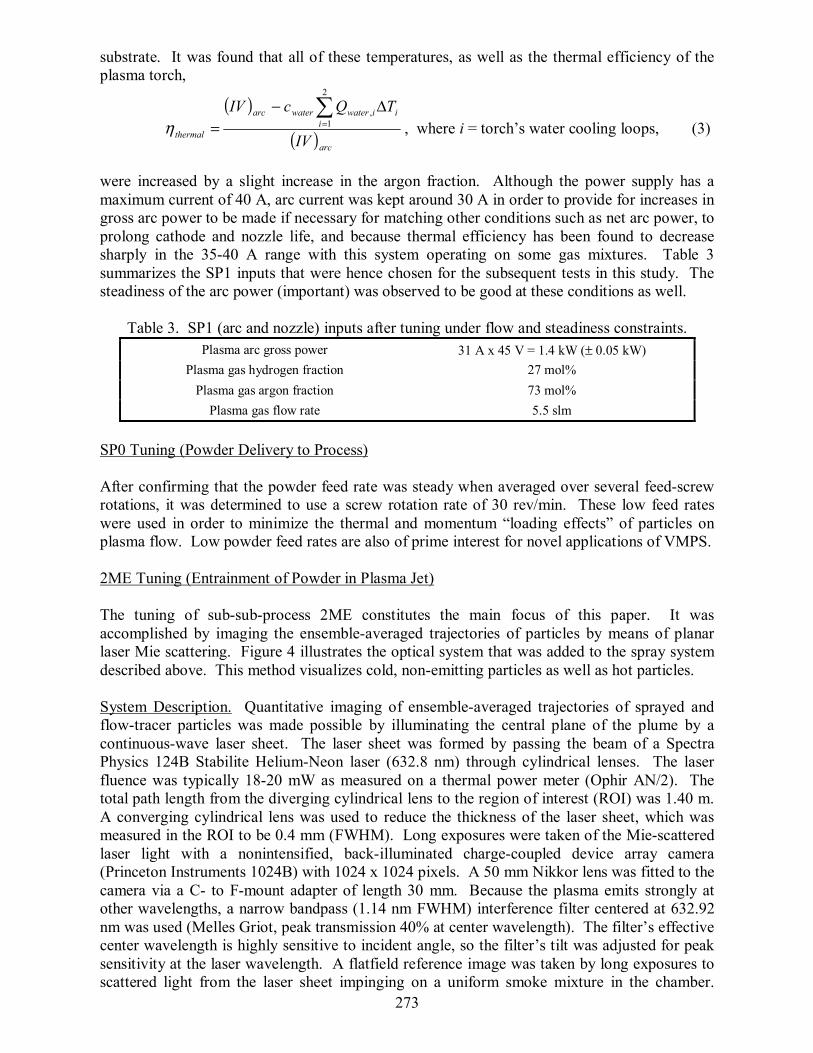
Table 3. SP1 (arc and nozzle) inputs after tuning under flow and steadiness constraints. Plasma arc gross power 31 A x 45 V = 1.4 kW (± 0.05 kW)
Plasma gas hydrogen fraction 27 mol% Plasma gas argon fraction 73 mol%
Plasma gas flow rate 5.5 slm SP0 Tuning (Powder Delivery to Process) After confirming that the powder feed rate was steady when averaged over several feed-screw rotations, it was determined to use a screw rotation rate of 30 rev/min. These low feed rates were used in order to minimize the thermal and momentum “loading effects” of particles on plasma flow. Low powder feed rates are also of prime interest for novel applications of VMPS. 2ME Tuning (Entrainment of Powder in Plasma Jet) The tuning of sub-sub-process 2ME constitutes the main focus of this paper. It was accomplished by imaging the ensemble-averaged trajectories of particles by means of planar laser Mie scattering. Figure 4 illustrates the optical system that was added to the spray system described above. This method visualizes cold, non-emitting particles as well as hot particles. System Description. Quantitative imaging of ensemble-averaged trajectories of sprayed and flow-tracer particles was made possible by illuminating the central plane of the plume by a continuous-wave laser sheet. The laser sheet was formed by passing the beam of a Spectra Physics 124B Stabilite Helium-Neon laser (632.8 nm) through cylindrical lenses. The laser fluence was typically 18-20 mW as measured on a thermal power meter (Ophir AN/2). The total path length from the diverging cylindrical lens to the region of interest (ROI) was 1.40 m. A converging cylindrical lens was used to reduce the thickness of the laser sheet, which was measured in the ROI to be 0.4 mm (FWHM). Long exposures were taken of the Mie-scattered laser light with a nonintensified, back-illuminated charge-coupled device array camera (Princeton Instruments 1024B) with 1024 x 1024 pixels. A 50 mm Nikkor lens was fitted to the camera via a C- to F-mount adapter of length 30 mm. Because the plasma emits strongly at other wavelengths, a narrow bandpass (1.14 nm FWHM) interference filter centered at 632.92 nm was used (Melles Griot, peak transmission 40% at center wavelength). The filter’s effective center wavelength is highly sensitive to incident angle, so the filter’s tilt was adjusted for peak sensitivity at the laser wavelength. A flatfield reference image was taken by long exposures to scattered light from the laser sheet impinging on a uniform smoke mixture in the chamber.
274
Incense smoke was created in the chamber and was stirred by multiple fans to make spatially uniform time-averaged particle positions. These flatfields account for relative spatial response due to nonuniformities in the laser and in the CCD-lens-filter system. All imaging was controlled by a PC running Roper Scientific’s Winview/32 software version 2.5.16.5. The aperture was set between f/8 and f/4 representing a trade-off between signal strength and saturation or smearing. Exposure times were 4 seconds, chosen because it spans two full periods of the powder feed screw and hence avoids any errors due to sensitivity to the phase of
Figure 4. Optical system for particle trajectory imaging.
the screw. In order to increase signal to noise, 8 accumulations of these exposures were taken for each stored frame of data. Therefore each frame represents the total signal over 32 seconds. For each process condition studied, between 10 and 150 frames were acquired in order to test for process steadiness. The data presented are from single frames that were representative for the condition. Experimental Procedure. The camera lens was focused on a printed target placed in the center (injection) plane of the plasma nozzle. Laser sheet was aligned using a needlepoint tip in the same plane. The position of Mirror 1 was adjusted until the beam was centered on the needlepoint. The needlepoint was then retracted. All system, plasma flow, and powder feed conditions were allowed to stabilize at conditions of interest. Powder feed was then halted momentarily by turning off the feed screw motor. One or more frames were acquired with the laser on but zero powder flow, in order to acquire a background image that included plasma emission and stray reflection of laser light from chamber surfaces. A small error is therefore induced due to extra signal from the thermal emission of hot particles. Multiple frames were acquired with powder flowing. In the case of many-frame acquisitions, background acquisition was repeated in order to correct for the inevitable small drifts in plasma and laser conditions. Flow, temperature, pressure, feed, and arc data were scanned continuously during all imaging. Images were post-processed in the following steps. A representative frame was selected by reviewing the appearance of all frames acquired under fixed conditions. This image was corrected by background subtraction and then flatfield division. The data from an ROI (radial vs. axial 251 x 457 pixel, 17.8 x 38.8 mm) was then exported to ASCII for calculation of trajectory contours. The ROI was selected such that its width encompassed all non-noise signal. Two contours were calculated and plotted to represent particle trajectories. Rectangular integral approximations were performed along successive cross sections of the image data taken normal to the nozzle axis. The nozzle axis direction is nearly but not exactly equal to the
275
plasma jet direction, as will be shown. The following two contours of radial locations were thus estimated.
Median contour, rmedian(z): ∫∫∞
=median
median
r
r
drrzSdrrzS ),(),(0
(4)
Centroid contour, rcentroid(z):
∫
∫∞
∞
=
0
0
),(
),()(
drrzS
drrzrSzrcentroid (5)
The numerical estimates of these contours were plotted versus axial position z. On the same plot was placed a contour to represent the centerline of the plasma jet, which was the locus of all maximum signal positions taken across the same cross sections but for an image acquired of only the plasma emission at equal or nearly equal conditions. The location of the jet centerline shows a slight deviation from the axial direction, away from the injector and with a dependence on the carrier gas flow rate. The difference between particle trajectory and jet centerline trajectory was presumed to be the critical parameter for determining the degree of particle entrainment into the hot core of the plasma jet. Results and Discussion. The conditions of Table 3 were held constant. The chamber pressure was always 5.33±0.2 kPa. The substrate was kept at a great enough distance not to affect particle or jet trajectories in the region of interest. The carrier gas was always argon. Only the powder and the carrier gas feed rate were varied. At constant powder feed screw rate of 30 rev/min, powder feed rates were 0.06 g/min for 316L stainless steel, 0.09 g/min for 5-45 µm Ti-6Al-4V, 0.13 g/min for 45-75 Ti-6Al-4V, and 0.22 g/min for 5-45 µm tungsten. Figure 5(a) shows a gray-scale rendering of the corrected image for 316L stainless steel powder with 500 sccm carrier gas. Figure 5(c) shows the plasma jet emission for the same conditions. Several features are visually evident. The plasma jet direction is deflected slightly into the +r direction by the effect of the injected flow. The particle stream is dispersed over a range of trajectories, much of which radially overshoots the plasma jet centerline by ∆r=1-3 mm at z=5 mm, and by ∆r=4-7 mm at z=25 mm. For comparison to this degree of overshoot, the radius of the high-temperature core of a similar plasma jet in this facility has been measured to be about 1.0 mm at z=5 mm [12]. It is important to point out the physical significance of signal level in the images of particle-scattered light. First, signal strength at location (z,r) scales linearly with the time-averaged flux of particles during the exposure time: ),(),(),( rzvrznrzS ∝ . Second, signal strength at a position scales linearly with residence time of a particle at that position during the exposure. Therefore, 1),(),( −∝ rzvrzS , thus canceling the velocity dependence above. Third, from Mie scattering theory, for particles much larger than the wavelength of light, signal strength scales linearly with the surface area of the light-scattering particle [13]. Therefore, 2),( drzS ∝ . Thus overall, ),(),(),( 2 rzdrznrzS ∝ (6)
276
Figure 5. (a) Background- and flatfield-corrected planar Mie scattering image of sprayed 316L particles at Qcg = 500 sccm. (b) Schematic illustration of framed area. (c) Plasma jet emission. Nozzle exit diameter is 2.13 mm.
It is likely that some segregation of particle sizes occurs across the range of trajectories, since both the incoming momentum at the injector, and the response time to the drag of the plasma jet, of a particle depends on its size. In the case of equal velocities at the injector, the paths of smaller particles should be deflected more dramatically by the plasma jet. The mass flux per particle is proportional to d3. Therefore, in light of the d2 term in Eqn. 6, the median contour in terms of mass flux may be expected to occur at somewhat greater r than does the median contour described in Eqn. 4. Thus the best-case value for Qcg may be one exhibiting a slight undershoot in median contour. In Figure 5(c), three local maxima of emission occur along the jet centerline between z=0 and z≈16 mm and indicate the location of shocks. At locations similar to the first two of these, local maxima occur in Figure 5(a). This could be explained by the shocks resulting in higher local number densities of particles. There is also the chance for errors in background subtraction, especially in these regions of highest emission, due to drift in the arc power. Errors due to background subtraction are at a minimum for the region z=10-25 mm. Conversely, signal-to-noise ratio becomes low in many cases for z=20-25 mm, as reflected by greater scatter in the calculated contours. Therefore it is best to consider the entire contour when evaluating entrainment. In Figures 6-10, the +z (axial) direction is to the right and the +r axis points up. Figure 6 shows the trajectory contours for water-atomized 316L stainless steel powder, 5-45 µm distribution, with three different carrier gas flow rates. As described above, the jet emission centerline is also plotted. The particles’ median and centroid contours show good alignment with the plasma jet centerline for Qcg=200 sccm, with noticeable undershoot at 120 sccm and severe overshoot at 500 sccm. Due to the expectation that the mass-based median may be shifted to slightly greater r than the Mie signal-based median, the best value of Qcg for entrainment of this powder is somewhat less than 200 sccm. Fortunately, it was found that Qcg in this range was sufficient for carrying this powder steadily without clogging. Figure 7 shows trajectories for spherical gas-atomized titanium alloy powder, again with a size distribution of 5-45 µm. Qcg was limited to the two values 120 sccm and 200 sccm. For this powder, 120 sccm shows alignment or slight undershoot whereas 200 sccm shows slight overshoot. The aligned case for this titanium powder shows a greater difference between the centroid contour and the median contour than that in the aligned case for stainless steel. The
difference between the centroid and the median at a given axial location represents the extent of asymmetry in the cross-section of signal strength at that axial location. The type of asymmetry shown in Figure 7, where the centroid contour is more greatly overshot than is the median contour, can be generated by spread in the trace of any overshot powder or by a pronounced degree of tilt of the particle trajectory from the axial direction. In all the titanium-powder cases, the former is evident but is very weak and may represent a negligible reduction in DE. Figure 8 shows trajectories for a larger size distribution of spherical titanium alloy powder, 45-75 µm. In this case, Qcg=120 sccm results in pronounced undershoot and Qcg=200 sccm has slight undershoot, so the latter is indicated as a near-best condition for spraying. Figure 9, for tungsten powder in the 5-45 µm size distribution, shows the median contour transitioning from slight undershoot at Qcg=120 sccm to overshoot at 500 sccm, while the centroid contour displays overshoot at all three values of Qcg. Indeed, tungsten trajectories display the greatest difference between median and centroid, and also the least sensitivity to varying Qcg.
5 10 15 20 25-2
-1
0
1
2 Plasma jet centerline Median contour Centroid contour
Radi
al p
ositi
on, m
m
Distance from torch exit plane, mm5 10 15 20 25
-2
-1
0
1
2 Plasma jet centerline Median contour Centroid contour
Radi
al p
ositi
on, m
m
Distance from torch exit plane, mm
5 10 15 20 250
1
2
3
4
5 Plasma jet centerline Median contour Centroid contour
The results in Figures 6-9 will be used to choose the best carrier gas flow rate for entrainment in order to improve on the spray results for these powders. Figures 6-9 show a trend of decreasing overshoot with increasing average particle mass, the latter due to increased density in comparing Figures 6, 7 and 9, or due to increased size in comparing Figures 7 and 8. This trend is counterintuitive in the sense that overshoot is expected to increase with increasing particle incoming momentum. A simple calculation was performed in order to investigate particle accelerations in the injector’s final element, which is a tube of 1 mm internal diameter and 17 mm length. The model was a highly simplified numerical integration of the instantaneous equation of motion for a single spherical particle in the tube, accounting for the change in drag coefficient with acceleration but not accounting for particle-wall interactions nor the added mass or Basset history terms found in the general equation of accelerated motion of a particle in a fluid. All particles were assumed to enter this tube at the mean carrier gas velocity upstream of the contraction, 6.4 m/s. Particle sizes of 22 µm and 57 µm were used to represent the 5-45 µm and 45-75 µm distributions, respectively.
5 10 15 20 25-2
-1
0
1
2
Plasma jet centerline Median contour Centroid contour
Rad
ial p
ositi
on, m
mDistance from torch exit plane, mm
5 10 15 20 25-3
-2
-1
0
1
2 Plasma jet centerline Median contour Centroid contour
Rad
ial p
ositi
on, m
m
Distance from torch exit plane, mm5 10 15 20 25
-3
-2
-1
0
1
2 Plasma jet centerline Median contour Centroid contour
Rad
ial p
ositi
on, m
m
Distance from torch exit plane, mm
280
The following correlation was used for drag coefficient because of its applicability over the range of Reynolds numbers calculated for particles in the tube ( )12Re1.0 <<
particled [14]. ( )38.1463.0
Re24 Re106.2Re197.01 −×++=DC (6)
Due to its many simplifications, this model is not likely to yield accurate values for particle injection velocities, but it may be adequate for predicting a basic trend in injection velocity versus particle size and density. It did predict that the injection velocity of the particles would be ranked in increasing order as follows: 45-75 µm titanium, 5-45 µm tungsten, 5-45 µm stainless steel, and 5-45 µm titanium. The injection velocities predicted for Qcg=200 sccm (ucg=23 m/s) were 8.4 m/s, 8.7 m/s, 11 m/s, and 13 m/s. Qualitatively, this ranking of velocities agrees with the ranking of overshoot in the trajectories. However, the particles’ calculated momentum of injection has the opposite ranking due to their relative mass values. Also, the characteristic time of each particle for response to the changes in fluid velocity field is given by
fluid
particleparticledµ
ρτ
18
2
= and thus has a strong ranking for these particles, opposite to the ranking of
velocities [15]. For the modeled particles, with fluid properties from Refs. 16 and 17, τ is 5-36 msec in the carrier gas and 0.9-6 msec in the plasma. The observed trend in trajectories may indicate that particle accelerations occurring in the injector over time scales less than τ may dominate those occurring in the plasma jet when determining entrainment. Figure 10 shows trajectories for a powder chosen for its ability to follow the gas streamlines rather faithfully, an alumina powder of nominal particle size 0.3 µm. Agglomeration may create slightly larger effective particles, but even for d=1 µm the characteristic time for response to step changes in plasma velocity is estimated at 1.5 µsec. This is far less than any time scales of the flow in the radial direction, so the tracer is predicted to reveal the direction traveled by the carrier gas. Even at Qcg=500 sccm (Fig. 10b) the trajectories show a high degree of undershoot. Thus it appears that the sprayed particles separate from the carrier gas stream due to their very different momentum flux values. This observation confirms that the dependence of sprayed particle entrainment upon carrier gas flow rate is only due to the impartment of injection momentum to the particles by the carrier gas, and not due to the carrier gas stream itself carrying the particles through the plasma jet. This situation is fortunate for spraying, in that the cold carrier gas need not quench the hot core of the plasma jet.
Summary and Conclusions
The vacuum microplasma spray system, like conventional plasma spray systems, operates as a complex set of sub-processes. The “sub-sub-process” of particle entrainment into the plasma jet core is central to the successful sprayed coatings. In the case of the microplasma jet, precise entrainment is extremely important, due to the high radial gradients of plasma temperature and velocity. These experiments have shown that particle entrainment is very sensitive to carrier gas flow rate, and they provide a quantitative measure of near-best carrier gas flow rates for entrainment with the powders studied at the plasma conditions studied. Two interesting trends were found for these cases. First, that the momentum of the particle stream was solely responsible for any overshoot that occurs, as the carrier gas streamlines themselves were deflected to the near-side shear layer under all carrier gas flow rates of interest. Second, that the particles more likely to overshoot were those with less average mass per particle, apparently due to their acquisition of greater velocities in the injector. For the plasma properties studied, at chamber pressure of 5.3 kPa, the following near-best carrier gas (argon) flow rates were
281
determined: for 316L stainless steel 5-45 µm, slightly less than 200 sccm; for Ti-6Al-4V 5-45 µm, 120 sccm; for Ti-6Al-4V 45-75 µm, 200 sccm; for tungsten 5-45 µm, 200 sccm.
ACKNOWLEDGEMENTS
The authors would like to thank Randy Rieger of Roper Scientific Inc., for his kind help with the camera system, and Dr. Hideki Hamatani for advice and technical help.
REFERENCES 1. Lech Pawlowski, The Science and Engineering of Thermal Spray Coatings. Chichester: John Wiley & Sons, 1995. 2. R. McIntyre, “Plasma sprayed coating versus high velocity oxy fuel processes,” Materials World, August 1996, 455-457. 3. K. Yushchenko et al., “Microplasma spraying,” Proceedings of the 14th International Thermal Spray Conference, 22-26 May 1995, Kobe, Japan, 273-274. 4. M. Breiter and G. Nutsch, “Study of operating conditions of plasma spray torch using low electric power levels,” IEEE Transactions on Plasma Science, 25 (5) (1997), 872-876. 5. K. Yushchenko et al., “Microplasma spraying,” Proceedings of the 15th International Thermal Spray Conference, 25-29 May 1998, Nice, France, 1461-1467. 6. Y. Borisov et al., “Microplasma spraying of bioceramic coatings,” Proceeding of the 2003 International Thermal Spray Conference, 5-8 May 2003, Orlando, FL, USA, 553-558. 7. C.-J. Li and B. Sun, “Microstructure and property of Al2O3 coatings microplasma-sprayed using a novel hollow cathode torch,” Materials Letters, 58 (2003), 179-183. 8. K. Foelsch, “Analytical design of an axially symmetric Laval nozzle for a parallel and uniform jet,” Journal of the Aeronautical Sciences, March, 1949, 161-188. 9. M. Rahmane et al., “Fluid dynamic study of direct current plasma jets for plasma spraying applications,” Journal of Thermal Spray Technology, 7 (3) (1998), 349-356. 10. M. Prystay, P. Gougeon, and C. Moreau, “Structure of plasma-sprayed zirconia coatings tailored by controlling the temperature and velocity of the sprayed particles,” Journal of Thermal Spray Technology, 10 (1) (2001), 67-75. 11. C.W. Marynowski, F.A. Holden, and E.P. Farley, “Variables in plasma spraying,” Electrochemical Technology, 3 (3-4) (1965) 109-115. 12. H. Hamatani, W.S. Crawford, and M.A. Cappelli, “Optical measurements of plasma velocity and temperature in a low-rate, low-power LPPS system,” Surface and Coatings Technology, 162 (1) (2003), 79-92. 13. Alan C. Eckbreth, Laser Diagnostics for Combustion Temperature and Species, 2nd Edition. Amsterdam: Gordon and Breach Publishers, 1996. p. 187.
282
14. R. Clift, J.R. Grace, and M.E. Weber, Bubbles, Drops, and Particles. New York: Academic Press, 1978. p. 111. 15. Markus Raffel, Christian E. Willert, and Jürgen Kompenhans, Particle Image Velocimetry : A Practical Guide. Berlin: Springer, 1998. 16. Robert C. Weast, ed., CRC Handbook of Chemistry and Physics, 51st Edition. Cleveland: Chemical Rubber Company, 1970. p. F-43. 17. Maher I. Boulos, Pierre Fauchais, and Emil Pfender, Thermal Plasmas: Fundamentals and Applications, Vol. 1. New York: Plenum Press, 1994. p. 433.