Surface-Enhanced Raman ScatteringHybrid Nanoprobe Multiplexing andImaging in Biological SystemsAndrea Matschulat,†,‡ Daniela Drescher,†,‡ and Janina Kneipp†,‡,*†Federal Institute for Materials Research and Testing, Richard-Willstatter-Strasse 11, 12489 Berlin, Germany, and ‡Humboldt-Universitat zu Berlin, Department ofChemistry, Brook-Taylor-Strasse 2, 12489 Berlin, Germany
The increase in Raman scattering sig-nals from molecules in close proxim-ity to a noble metal
nanostructure,1�6 known as surface-
enhanced Raman scattering (SERS), has
been made use of in a number of bioanalyt-
ical applications, ranging from immunoas-
says to intracellular studies. Apart from sen-
sitive detection of analytes, SERS enables
the construction of optical labels using en-
hanced Raman signals as a spectroscopic
signature.7�10
SERS labels are hybrids consisting of
metal nanostructures, typically combina-
tions of aggregates of gold or silver nano-
particles and reporter molecules. SERS la-
bels can be functionalized with specific
antibodies, peptides, and DNA in order to
achieve specific recognition or targeting.
With respect to their reporting capabili-
ties, there are two types of SERS labels: In a
first type, unprotected monolayers of re-
porter molecules on metal nanoparticles are
used,11�13 or the SERS label (metal nanopar-
ticle plus reporter) is covered by a protec-
tive layer of glass or polyethylene
glycol.14�17 The advantages of these coated
and uncoated SERS labels or tags include
physical robustness, stable signals, and im-
munity to their biological and chemical en-
vironment. Overall, despite these essential
technical advantages, this type of SERS la-
bel exhibits the same function as a fluores-
cence tag, that is, highlighting and imaging
a biological structure based on the optical
signature of the reporter.
The second type does not use such a
protective cover; we call them in the follow-
ing SERS hybrid probes.18,19 The main ad-
vantage of these SERS hybrid probes lies in
their multifunctionality: SERS hybrid probes
can be identified by the signature of a re-
porter molecule. Based on the surface-enhanced Raman signal generated also byother molecules present in the local opticalfields of the metal nanoaggregates, at thesame time, they deliver sensitive molecularstructural information on their (biological)nanoenvironment. Therefore, hybrid probesare different from typical SERS tags, as thelatter do not provide information fromother molecules except the reporter.7,15,20
Regarding label composition, in manycases, reporter molecules are in fact fluores-cent dyes. The advantages of SERS labelscompared to common labels used in fluo-rescence can be found in an enormous mul-tiplexing potential due to the fingerprint-like nature of the vibrational spectrum.Moreover, in SERS, excitation can be out-of-resonance with electronic transitions of areporter molecule. This prevents photode-generation and results in a high stability ofSERS labels. Additionally, it provides the free
choice of excitation wavelength (and therefore, also de-tection range) as yet another significant advantageover fluorescence labels. Additional gain in sensitivityfor a SERS label can result when excitation occurs inresonance with electronic transitions in the reportermolecules, so that an additional resonance enhance-ment, termed surface-enhanced resonant Raman scat-tering (SERRS) is employed.11,21 The high sensitivity ofSERRS labels is paid for with a limited range of excita-tion wavelengths in label detection.
Experiments relying on the detection of the SERSspectral signature of the reporter include the introduc-tion of SERS probes into organisms and attachment tothe surface of cells as targeting agents of specific sur-face markers.15,17,22 Inside the cellular interior, spectra ofspecific individual Raman labels have been imaged.23�25
In several cellular processes, simultaneous investiga-tion of different locations is favorable. To achieve this,a specific SERS hybrid probe must identify itself as be-ing of a specific type, for example, with respect to its tar-geting. Therefore, it is useful to introduce with eachprobe type a probe-specific signature that allows iden-tification. In such a multiplexing approach with differ-ent types of SERS hybrid probes, each probe also en-ables investigation of its specific cellular environment.
In previous work, we and others have generatedSERS hybrid probes for intracellular studies.18,19 Al-though the multiplexing potential of both conven-tional SERS tags and hybrid SERS probes has beenpointed out, all studies have so far used the mere vi-sual inspection of reporter spectra or intensity mappingof one band for analysis.7,8,18,20,26 Fast methods or multi-variate statistics were not applied, despite the fact thatthe greatest potential of SERS labels and probes surelylies in the efficiency provided by multivariate methodsfor their fingerprint-based imaging. Automated identifi-cation will be crucial particularly for intracellular or sens-ing applications.
Here we demonstrate the full exploitation of themultiplexing capabilities inherent to SERS nanoprobesand labels by the application of fast, multivariate meth-ods. We study the SERS spectra of five reporter mol-
ecules by multivariate methods. We have based identi-fication of the reporter spectra on both, two specificspectral positions and the intensity ratio of these bands.Hierarchical clustering and principal components analy-sis were used for separation of different reporter spec-tra both on silver and on gold nanoparticles. In a secondstep, we apply simultaneously different SERS hybridprobes in multivariate imaging experiments with cul-tured cells. Parallel to the experiments in a duplex SERSimaging approach, cytotoxicity of the SERS hybridprobes is assessed.
RESULTS AND DISCUSSIONChemical Separation of SERS Reporter Signatures. SERS spec-
tra of six different Raman reporter molecules measuredon silver and gold nanoaggregates are displayed in Fig-ure 1. Five of them, para-aminobenzenethiol (pABT),rhodamine (B) isothiocyanate (RBITC), crystal violet(CV), 2-naphthalenethiol (2-NAT), andp-mercaptobenzoic acid (pMBA) provide strong, typicalvibrational signatures with both silver and gold nano-particles. In addition, the characteristic SERS spectra offluorescein isothiocyanate (FITC) and of 5,5=-dithiobis(2-nitrobenzoic acid) (DTNB) can be used as reporter sig-natures on silver and gold nanoparticles, respectively(compare last spectra in Figure 1 panels A and B, respec-tively). For a discussion of the spectral features of allthese potential reporter molecules, also in the contextof concentration and possible interaction with differenttypes of SERS substrates, the reader is referred to previ-ous basic studies, e.g., to refs 27�32. Labels and probescontaining one of these molecules at a time as reporterhave also been applied in cells, as was the case forCV,18,25 2-NAT,33 and pMBA.23,34 In these spatially re-solved one-reporter experiments, the position of theparticular reporter was imaged by so-called chemicalmapping, that is, based on the intensity of one band orone intensity ratio that was selected from the SERSspectrum.
“Chemical” parameters in the spectrum of each ofthe six reporters used in our study here can also beused for their discrimination in a multiplex experiment.
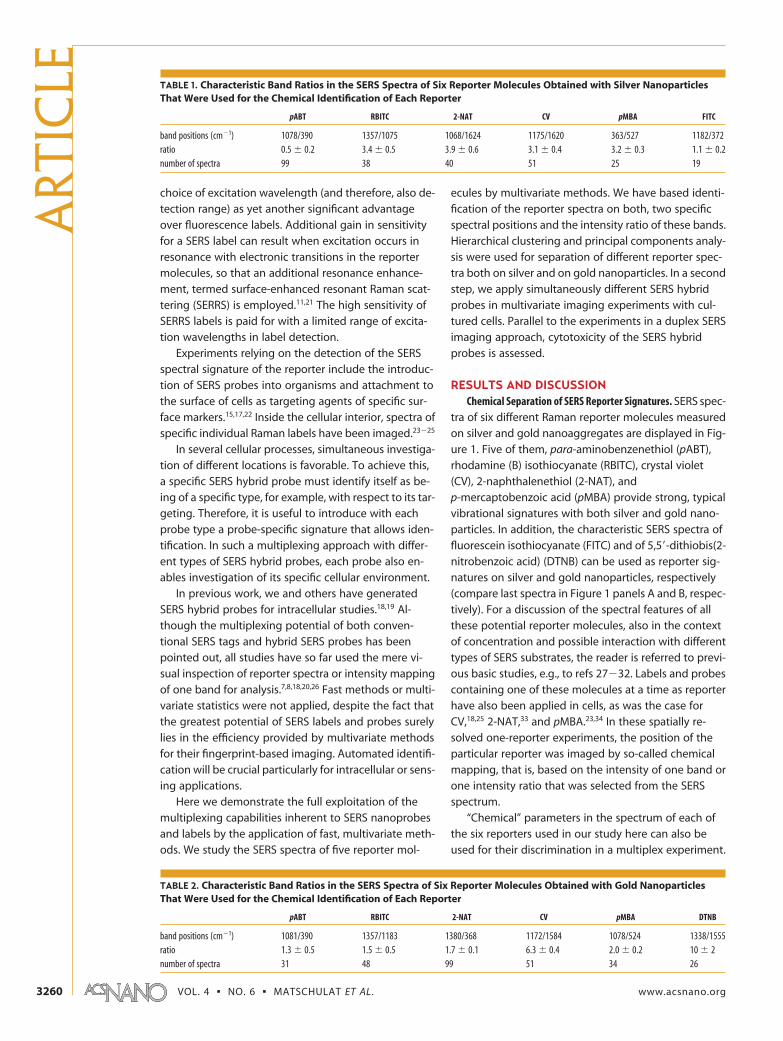
TABLE 1. Characteristic Band Ratios in the SERS Spectra of Six Reporter Molecules Obtained with Silver NanoparticlesThat Were Used for the Chemical Identification of Each Reporter
TABLE 2. Characteristic Band Ratios in the SERS Spectra of Six Reporter Molecules Obtained with Gold NanoparticlesThat Were Used for the Chemical Identification of Each Reporter
VOL. 4 ▪ NO. 6 ▪ MATSCHULAT ET AL. www.acsnano.org3260
Two data sets were generated, containing 272 and 289
SERS spectra of six different reporter molecules on silver
and gold nanoaggregates, respectively. As shown in
Tables 1 and 2, one particular ratio of two bands can
be used to identify the characteristic spectrum of each
reporter molecule in a mixed set of reporter spectra. As
the spectral intensity in a SERS experiment may fluctu-
ate considerably, utilization of a band ratio ensures the
stability of the identification parameter. The bands that
were used for calculation of the intensity ratio are high-
lighted in each of the example spectra in Figure 1.
In a common chemical imaging or identification ap-
proach, one intensity, intensity ratio, or band position
is determined for each spectrum. In a SERS experiment,
slight shifts in the position of Raman bands due to the
different local environment of the molecules can occur.
Therefore, separation based on one individual param-
eter, such as intensity ratio or band position can ham-
per distinction between different reporter spectra. Here,
we have based identification of the reporter spectra
on both, two specific spectral positions and the inten-
sity ratio of these bands. Discrimination of the very simi-
lar spectra of pABT and pMBA (compare Figure 1) by
this trivariate approach illustrates its robustness. In ana-
lytical applications with known reporters and their spe-
cific intensity ratios, for example, SERS tags in array for-
mat hybridization or immunoassays, the automated
comparison of intensity ratios of selected marker bands
could easily be applied for fast identification.
Multivariate Discrimination of Five SERS Reporter Signatures.
To achieve identification and separation of reporter
molecules in unknown mixtures or in the presence of
additional analyte molecules, for example, in the case
of SERS hybrid probes in a biological environment, mul-
tivariate methods that consider the whole spectral fin-
gerprint are clearly of advantage. Principal components
analysis (PCA) is a useful statistical technique that has
found application in fields such as pattern recognition35
and image compression,36 and has become a common
technique for finding patterns in data of high dimen-
sion, in particular in hyperspectral mapping and charac-
terization approaches.37�39 The spectral differences in
the data sets comprising 263 spectra of the reporter
molecules pABT, RBITC, CV, 2-NAT, and pMBA on gold
nanoparticles were analyzed by PCA. Briefly, the data
matrix, consisting of 263 spectra with 961 data points
(covering the spectral range 300�1700 cm�1) was pro-
jected into a new, variance-weighted coordinate sys-
Figure 1. Example SERS spectra of the five reporters pABT, RBITC, 2-NAT, CV, and pMBA (A) on silver and (B) on gold nanoaggre-gates. The sixth spectrum in panel A and B is of the fluorescent dye FITC and of DTNB, respectively. Excitation wavelength: 785 nm, ex-citation intensity �8 � 104 W/cm2, accumulation time: 1 s. Abbreviations: pABT, para-aminobenzenethiol, RBITC, rhodamine (B)isothiocyanate, CV, crystal violet, pMBA, p-mercaptobenzoic acid. The bands used for chemical analysis of the spectra (compareTables 1 and 2) are highlighted in yellow.
tem. This mathematical procedure (orthogonal linear
transformation or eigenvalue problem) transforms a
number of possibly correlated variables of the spectral
data set into a smaller number of uncorrelated variables
such that the greatest variance by any projection of
the data comes to lie on the first coordinate.40 Figure 2
shows the scores plots of the first five principal compo-
nents (PCs) against one another. These plots illustrate
that the five different reporter signatures can be sepa-
rated readily using three of the first four PCs. For ex-
ample, pABT, 2-NAT, and pMBA separate well along PC2
and PC3 and CV and RBITC separate well along PC4
(compare plot of PC2 vs PC4 in Figure 2).
Hierarchical cluster analysis (HCA) utilizing the infor-
mation over the same spectral range from 300�1700
cm�1 also provides evidence that the whole spectral fin-
gerprint can be used for discrimination of the five differ-
ent reporter signatures in the test data sets (Figure 3).
The resulting dendrograms were obtained in cluster
analyses with vector-normalized first-derivative spec-
tra. They contain five separate classes and illustrate that
variance within the group of spectra of each reporter
is much smaller than interclass variance. At this point it
should be noted that signal-to-noise ratio varied not
only between different SERS labels but in particular
within each group of particular reporter. The dendro-
Figure 3. Results of hierarchical cluster analysis of (A) 253 reporter spectra of the five reporter molecules pABT, RBITC, CV, 2-NAT, andpMBA obtained with silver and (B) 263 spectra obtained with gold nanoparticles. HCA was performed with vector-normalized first-derivative spectra in the spectral region 300�1700 cm�1 using Ward’s algorithm and Euclidean distance measure.
Figure 2. Plots of the first five principal components scores obtained in PCA with 263 spectra of the five reporter moleculespABT, RBITC, CV, 2-NAT, and pMBA on gold nanoparticles. PCA was performed with vector-normalized first derivative spec-tra over the spectral range 300�1700 cm�1.
ART
ICLE
VOL. 4 ▪ NO. 6 ▪ MATSCHULAT ET AL. www.acsnano.org3262
grams also reflect a high level of similarity of the spec-tra of pABT and pMBA with one another, compared tothe spectra of the other molecules. HCA can help to findSERS signatures of high dissimilarity. This can be impor-tant especially when more than one reporter is used inaddition to existing spectral contributions, for example,from an analyte, as in the case of SERS hybrid probesfor intracellular applications.
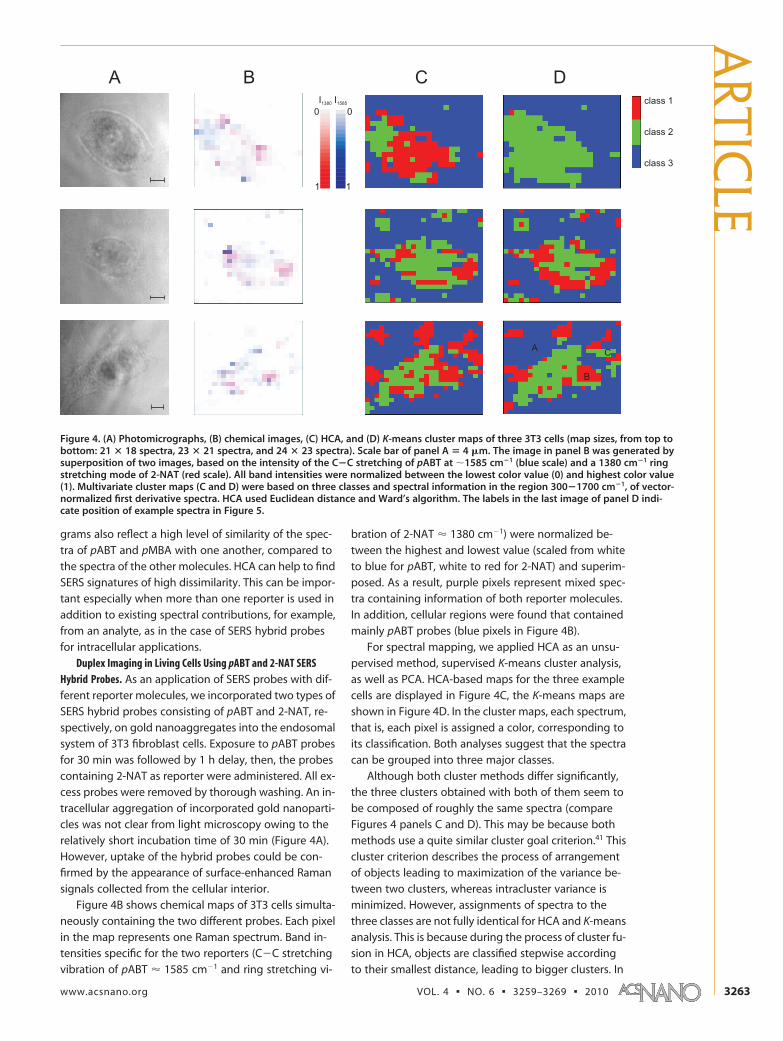
Duplex Imaging in Living Cells Using pABT and 2-NAT SERSHybrid Probes. As an application of SERS probes with dif-ferent reporter molecules, we incorporated two types ofSERS hybrid probes consisting of pABT and 2-NAT, re-spectively, on gold nanoaggregates into the endosomalsystem of 3T3 fibroblast cells. Exposure to pABT probesfor 30 min was followed by 1 h delay, then, the probescontaining 2-NAT as reporter were administered. All ex-cess probes were removed by thorough washing. An in-tracellular aggregation of incorporated gold nanoparti-cles was not clear from light microscopy owing to therelatively short incubation time of 30 min (Figure 4A).However, uptake of the hybrid probes could be con-firmed by the appearance of surface-enhanced Ramansignals collected from the cellular interior.
Figure 4B shows chemical maps of 3T3 cells simulta-neously containing the two different probes. Each pixelin the map represents one Raman spectrum. Band in-tensities specific for the two reporters (C�C stretchingvibration of pABT � 1585 cm�1 and ring stretching vi-
bration of 2-NAT � 1380 cm�1) were normalized be-tween the highest and lowest value (scaled from whiteto blue for pABT, white to red for 2-NAT) and superim-posed. As a result, purple pixels represent mixed spec-tra containing information of both reporter molecules.In addition, cellular regions were found that containedmainly pABT probes (blue pixels in Figure 4B).
For spectral mapping, we applied HCA as an unsu-pervised method, supervised K-means cluster analysis,as well as PCA. HCA-based maps for the three examplecells are displayed in Figure 4C, the K-means maps areshown in Figure 4D. In the cluster maps, each spectrum,that is, each pixel is assigned a color, corresponding toits classification. Both analyses suggest that the spectracan be grouped into three major classes.
Although both cluster methods differ significantly,the three clusters obtained with both of them seem tobe composed of roughly the same spectra (compareFigures 4 panels C and D). This may be because bothmethods use a quite similar cluster goal criterion.41 Thiscluster criterion describes the process of arrangementof objects leading to maximization of the variance be-tween two clusters, whereas intracluster variance isminimized. However, assignments of spectra to thethree classes are not fully identical for HCA and K-meansanalysis. This is because during the process of cluster fu-sion in HCA, objects are classified stepwise accordingto their smallest distance, leading to bigger clusters. In
Figure 4. (A) Photomicrographs, (B) chemical images, (C) HCA, and (D) K-means cluster maps of three 3T3 cells (map sizes, from top tobottom: 21 � 18 spectra, 23 � 21 spectra, and 24 � 23 spectra). Scale bar of panel A � 4 �m. The image in panel B was generated bysuperposition of two images, based on the intensity of the C�C stretching of pABT at �1585 cm�1 (blue scale) and a 1380 cm�1 ringstretching mode of 2-NAT (red scale). All band intensities were normalized between the lowest color value (0) and highest color value(1). Multivariate cluster maps (C and D) were based on three classes and spectral information in the region 300�1700 cm�1, of vector-normalized first derivative spectra. HCA used Euclidean distance and Ward’s algorithm. The labels in the last image of panel D indi-cate position of example spectra in Figure 5.
the next step, objects with smaller distances are com-bined. During this irreversible process, a hierarchicalgrouping is generated.41 K-means incidentally assignsn objects to K clusters calculating the Euclidean dis-tances between these objects and cluster-centers (cen-troids). Therefore, in contrast to hierarchical methods,the assignments of objects to certain clusters maychange during recalculations of the cluster centers.
Figure 5 shows an example spectrum for each of thethree clusters (compare third K-means map in Figure4D). Obviously, one class contains all spectra withoutSERS signals (Figure 5, spectrum A). The other two clus-ters consist of spectra with SERS signals. According tothe multifunctionality of the SERS probes,18 all spectracontain contributions from molecules of the cell, that is,from the endosomal environment of the probes. Ascontrol, spectra were also acquired with the probes incell culture medium, indicating no contribution frommolecules of the culture medium the probes were ad-ministered with (Supporting Information). Possible as-signments of the cellular contribution were provided inearlier papers.42 One of the clusters comprises all spec-tra that display characteristic bands of pABT alongsidethose of molecules from the cell (cf. spectrum B). Theother group of spectra shows bands of 2-NAT togetherwith those of pABT, and less contributions from cellularmolecules.
Since the different reporter contributions in thespectra of class 2 (cf. Figure 4D and 5) come from differ-ent probe types, one sampled spot must contain morethan one probe. Regarding localization of the two types
of hybrid probes with respect to cellular ultrastructure,this type of mixed reporter spectrum can in principle begenerated from two situations: (i) the fL-probed vol-ume contains different vesicles, each surrounding a dif-ferent type of hybrid probe and (ii) larger endosomalstructures, generated by endosomal fusionprocesses,43,44 that contain several hybrid probes ofboth probe types. We have observed such structuresbefore in experiments with bare SERS nanoprobes andparallel TEM studies.42 Which of the situations is thecase in the duplex experiment here cannot be resolvedwith the current data, but different targeting of differ-ent probe types in future applications will clarify thissituation. Cluster imaging is based on all signals of thehybrid probes, including those of cellular molecules inthe probes’ proximity, and takes into account also vary-ing relative intensities in different spectra of the samereporter molecule caused, for example, by varying ori-entation or concentration effects. Thereby, better con-trast can be generated than in chemical images. For ex-ample, in Figure 4 panels C and D, the filamentousbranches as characteristic morphological features of fi-broblast cells become evident.
The first derivatives of all mapping data were alsosubjected to PCA. To use overall variance for genera-tion of image contrast, an image was generated basedon the scores of each PC. Examples of such PC imagesare displayed in Figure 6 for one selected data set (samedata set as last row of Figure 4). Comparison with thecluster image results (last row of Figure 4D) reveals thatPC1, which points into the direction of greatest vari-
Figure 5. Characteristic SERS spectra for each of the three classes identified in K-means cluster analysis (cf. labels in Figure4D last row): (A) spectrum without SERS signals, obtained at a position where no nanoprobes were present; (B) spectrum con-taining SERS signals of pABT (�) and cellular molecules; (C) spectrum with SERS signatures of both reporters, pABT (�), and2-NAT (�).
ART
ICLE
VOL. 4 ▪ NO. 6 ▪ MATSCHULAT ET AL. www.acsnano.org3264
ance in the data set, can be used to image all spectra
with SERS signal (bright pixels in the first panel of Fig-
ure 6). Accordingly, the loading spectrum of PC1 con-
tains features at all frequencies where characteristic
bands of the reporter molecules pABT and 2-NAT, as
well as characteristic bands of cellular molecules, are lo-
cated. Using PC3, contrast can be generated between
spectra containing contributions from both reporter
molecules as opposed to the other spectra in the data
set. Note that the locations of high scores for PC3 corre-
spond well with the distribution of class C spectra in
the K-means cluster map (compare PC3 image of Fig-
ure 6 with Figure 4D last row). The same is the case for
PC5. In contrast, the image of PC6 indicates differences
in 2-NAT spectral contributions. High PC6 scores colo-
calize with class B spectra in the K-means cluster map
(compare PC6 image of Figure 6 with Figure 4D last
row), those with mainly pABT bands, but scarce 2-NAT
signals. It should be noted that in the case of the in-
tense band at �1002 cm�1, there occurs superposition
of a characteristic band of pABT with the ring breathing
mode of the cellular molecule phenylalanine (cf., e.g.,
Figure 5, spectrum B). Variance in the presence of phe-
nylalanine is found in almost every PC. Similar results
were found for all other data sets that have been ana-
lyzed in these experiments.
Impact of Reporter Molecules and SERS Hybrid Probes on
Cellular Viability. To obtain meaningful data using SERS
hybrid probes in live cells, more than fast data analysis
methods have to be implemented. In particular in the
Figure 6. PCA score maps of a 3T3 cell in SERS experiment with pABT and 2-NAT hybrid probes (left) and correspondingloadings spectra (right) for four PCs. The mapping data set consisted of 552 spectra (same data set as in last row of Figure4).
context of large reporter libraries, the influence of the
probes on the status of the biological system has to be
studied. Toxicity of gold45�52 and silver
nanoparticles53�56 has been extensively investigated.
All nanoprobes used in our study were internalized by
endocytosis from the cell culture medium over a time of
30 min.
The major issue, that has, however, only been rarely
addressed so far is the toxicity of probes containing the
reporter molecules, and of the reporter molecules
themselves. So far, in many cases, biocompatible dyes,
such as indocyanine green or Rose Bengal have been
applied and assumed to be nontoxic.18,19 However, cre-
ating great arsenals of different reporters for live cell
multiplex approaches will require an assessment of
their potential cytotoxicity.
The toxicity of aromatic thiols (benzenethiol and
para-aminobenzenethiol) in blood cells was shown in
early work.57 For example, oxidative stress can be in-
duced in the cells using pABT at a concentration of 0.25
mM in cell culture medium.
Although the concentration of the reporter mol-
ecules in our experiments was much lower (maximum
of 10�7 M for pABT and 10�6 M for 2-NAT), we investi-
gated cell viability for the conditions used in our SERS
imaging experiments using a standard XTT assay. This
assay enables conclusions on viability based on the ac-
tivity of intramitochondrial dehydrogenase of the
cells.58
The results of this assay, conducted for five concen-
trations of each reporter pABT and 2-NAT, and both re-
porters on gold nanoparticles at possible conditions
for a SERS imaging experiment are displayed in Figure
7. After an incubation of 24 h with both pABT and 2-NAT
in concentrations �10�4 M, the cells display �90% vi-
ability. However, reporter concentrations �10�4 M have
a significant influence on metabolic activity of the cells
(Figure 7). Control experiments also showed that the
small content in methanol used for dissolving pABT
does not have an influence on cytotoxicity. The same
24 h incubation and subsequent XTT assay was also
conducted for SERS hybrid probes containing pABT and
2-NAT in two concentrations on gold nanoparticles
(10�10 M particle concentration). After 24 h incubation
with such probes, viability of the cells was observed to
be 95% of that of control cells. This is in good agree-
ment with results for plain gold nanoparticles.45,46,48
CONCLUSIONSSpectra of different reporters were shown to be
separable by hierarchical clustering and by PCA. In a du-
plex imaging approach in live cells, hierarchical cluster
analysis, K-means clustering, and PCA were used for im-
aging the positions of two different types of SERS
probes along with the spectral information from cellu-
lar constituents. The results of cluster methods and
principal components approaches for discrimination in-
dicate the potential capabilities of SERS nanoprobes.
From the cytotoxicity experiments we can conclude
that neither free reporter molecules nor SERS hybrid
probes are toxic to standard cultured cells at concentra-
tions used in typical SERS experiments, even if incuba-
Figure 7. Viability of 3T3 cells after 24 h-exposure to different concentrations of para-aminobenzenethiol (pABT) and2-naphthalenethiol (2-NAT) in culture medium as determined by XTT assay (mean value � margin of deviation of four repli-cates). The cytotoxic effect of the gold nanoprobes with the corresponding reporter on 3T3 cells, as used in SERS experiments,was also assigned (bars are highlighted).
ART
ICLE
VOL. 4 ▪ NO. 6 ▪ MATSCHULAT ET AL. www.acsnano.org3266
tion times are of a much longer duration than in the ex-periments conducted here. The biocompatibility ofSERS hybrid probes, along with the imaging capabili-ties provided by the multivariate analyses suggests fastSERS multiplexing in complex systems. In particular,the examples used in our experiments suggest thatvarious aromatic thiols could form a basis for a largeset of different SERS hybrid nanoprobes for sensitivelive cell probing.
The results of cluster methods and principal compo-nents approaches for discrimination indicate that fast,multivariate evaluation of whole sets of multiple probesis feasible, beyond the visual inspection of individualspectra that has been practiced so far, and also for vary-ing signal-to-noise ratio. This suggests multiplexing ap-plications with SERS hybrid nanoprobes and SERS tagsin very high density sensing and biological imaging ap-plications, where fast read-out is required.
METHODSChemicals and Materials. For preparation of colloidal solutions
of gold and silver nanoparticles in water, silver nitrate (99.9999%,Sigma-Aldrich), gold(III) chloride trihydrate (99.9%, Sigma-Aldrich), and trisodium citrate dihydrate (99%, Merck) were pur-chased. Different reporter molecules such as p-mercaptobenzoicacid (95%, Chempur), 2-naphthalenethiol (�99%, Fluka), para-aminobenzenethiol (97%, Aldrich), crystal violet (�90%,J.T.Baker), fluorescein isothiocyanate (90%, Sigma), rhodamine(B) isothiocyanate (�70%, Sigma), 5,5=dithiobis(2-nitrobenzoicacid) (98%, Sigma) as well as sodium chloride (99.99%, Merck) forelectrolyte solutions and methanol (99.8%, J.T.Baker) as solventwere purchased. For all experimental procedures, ultrapure wa-ter (18 M�) was applied.
For SERS experiments, silver nanoparticles were synthesizedaccording to a modified protocol of Lee and Meisel which wasalso described by Aroca6 and Munro et al.59 Gold nanoparticleswere synthesized according to a modified protocol of Lee andMeisel.60 In electron microscopy, a size distribution of the goldnanoparticles was determined to range from 20 to 50 nm, andfor colloidal silver from 20 to 60 nm. The extinction spectra of sil-ver and gold nanoparticle solutions show characteristic posi-tions of the plasmon resonance band of the colloidal silver andgold to be at 440 and 532 nm, respectively. In our studies, silverand gold nanoparticles gave rise to a similar strong SERS en-hancement (EF � 106).
Stock solutions of the reporter molecules para-aminobenzenethiol (pABT), 2-naphthalenethiol (2-NAT),rhodamine (B) isothiocyanate (RBITC), fluorescein isothiocyan-ate (FITC), and crystal violet (CV) were prepared in methanolic so-lutions, whereas para-mercaptobenzoic acid (pMBA) and 5,5=-dithiobis(2-nitrobenzoic acid) (DTNB) stock solutions wereprepared in 0.01 M phosphate-buffered saline solution (PBS, pH� 7.3) and 0.1 M phosphate-buffered solution (PB, pH � 7.3) re-spectively. Further dilutions of reporter-containing methanolicsolutions were then performed in 0.01 M PBS buffer to providea biocompatible environment.
Delivery of SERS Hybrid Probes to Cells. Mouse fibroblast cells (3T3;DSMZ, Braunschweig, Germany) were grown on sterile cover-slips (Thermo Fisher Scientific, Waltham, U.S.A.) in 6-well cultureplates for 24 h in Dulbecco’s modified eagle medium (referred toas DMEM; Biochrom AG, Berlin, Germany) supplemented with10% fetal calf serum, 100 units/mL penicillin and 100 �g/mLstreptomycin (Biochrom AG) at a density of �104 cells/cm2 in acontrolled environment (37 °C, 5% CO2).
Prior to the experiment, the gold nanoparticle suspension (fi-nal particle concentration: 10�10 M) was mixed with the reportersolution (final concentration: pABT 10�7 M; 2-NAT 10�6 M), di-luted with cell culture medium and immediately applied to thecells. The hybrid nanoprobes were delivered to 3T3 cells in twoseparate steps by fluid phase uptake. First, the standard mediumwas replaced by culture medium including pABT hybrid probesat a concentration of 10�7 M. After an exposure time of 30 min,the cells were washed with PBS buffer solution (Biochrom AG)and continued to grow in pure culture medium for 1 h. In thesecond step, 2-NAT nanoprobes at a concentration of 10�6 M inthe culture medium were used for incubation for 30 min. The2-NAT gold pulse was followed by 1 h of incubation in standardculture medium without any nanoprobes. Thereby, endosomes
containing pATP probes were of a different age than those con-taining 2-NAT probes. Upon completion of the incubation steps,the cells were washed thoroughly with PBS buffer and immedi-ately transferred to the Raman microscope, where the SERS spec-tra were obtained from live cells in PBS buffer.
Raman Experiments. All Raman experiments were performedwith a Raman microspectroscopic setup (LabRam, Horiba-Jobin-Yvon, Bensheim, Germany). SERS spectra were measured using a60� microscope water immersion objective. A spectrographwith notch filter in the front of the entrance slit and a liquidnitrogen-cooled CCD detector were used for spectral dispersionand collection of the scattered light. An excitation wavelength of785 nm, that is, out-of-resonance with transitions in the re-porter molecules, was applied in all measurements.
The concentration of reporter molecules in the Raman ex-periments on gold and silver nanoparticles outside cells was10�5 M, except for pMBA with 10�7 M. In UV/vis control experi-ments no aggregation was observed upon addition of the re-porter molecules to the silver nanoparticles, except for CV. Ab-sorption spectra of the gold nanoparticles revealed theformation of small aggregates. All substrates remained stableeven at time intervals that were much longer than the timeframe of the Raman experiments.
For studies of eukaryotic cells, measurements were carriedout as raster scans in 2 �m steps over single living 3T3 cellswith a computer-controlled xy-stage. The laser spot size formedthrough the objective led to a spot size of �1.8 �m. Excitation in-tensity in all experiments was approximately 8 � 104 W/cm2. Ac-quisition time for all spectra was 1 s.
Data analysis. Cosmic spike removal was done with CytoSpec1.4 hyperspectral imaging software.61 CytoSpec 1.4 was alsoused to calculate ratios of the integrated areas of two bands(“chemical” analysis).
Data analysis of the reporter spectra on gold and silver wascarried out on two data sets containing 289 and 272 spectra, re-spectively, of six different reporters. Spectra of five of the report-ers, pABT, 2-NAT, RBITC, CV, and pMBA were obtained both ongold and on silver nanoparticles. To be able to compare the out-come of the multivariate analyses on the two types of nanopar-ticles, the spectra of the sixth reporter species, FITC on silvernanoparticles and NTB2� (residue of DTNB) on gold nanoparti-cles, were not included in the hierarchical cluster analysis andprincipal components analysis. This yielded two data sets of 256spectra for silver nanoparticles and 263 spectra for goldnanoparticles.
All further data analyses and image reconstruction were per-formed using MatLab 7.0 (The Mathworks Inc., Natick, MA) andPLS toolbox (Eigenvector Research, Inc.). For principal compo-nents analysis (PCA), the first derivatives of the spectra were cal-culated applying Savitzky�Golay algorithm (number of smooth-ing points: 5). Vector-normalized first derivatives of the spectrawere subjected to PCA, using a spectral range of 300�1700cm�1. Spectral mapping was based on PCA and K-means clusteranalysis.62 As input information for the construction of PCAmaps, we used the principal component scores. The number ofspectral classes contained in each data set was determined byanalyzing the cluster indexes as an output from K-means usingthe MatLab Silhouette plot tool.
For hierarchical cluster analysis, including reconstruction ofHCA maps, the cluster algorithm technique of Ward41 and Euclid-
ean distance Dj,k between the ordinate values of spectra Xji andXki as similarity measure were used. This sum is taken over all se-lected data points i:
The algorithm of Ward attempts to find groups merged sothat the result will lead to the smallest growth in heterogeneityfactor H, where n(i) is the number of spectra merged in the ob-ject I and spectral distance D:
Assessment of Cytotoxicity. Cytotoxicity of pABT and 2-NAT wasevaluated by utilization of the XTT assay (Biozol Diagnostica, Ech-ing, Germany), where cell viability is spectroscopically deter-mined as the total mitochondrial activity. For this assay, 3T3 cellswere seeded in a 96-well culture plate at a density of �104 cells/well in 200 �L of cell culture medium (DMEM with 10% fetalcalf serum) and were incubated for 48 h under controlled condi-tions (37 °C, 5% CO2). Then, the culture medium was replacedby fresh medium containing pABT or 2-NAT in a concentrationrange of 0.1�500 �M. For comparison with the conditions in theRaman experiments, the 3T3 cells were also incubated with theSERS nanoprobes in cell culture medium. Cells not exposed toanalyte served as negative controls in each experiment. Positivecontrols were exposed to 0.01 wt % Triton X-100. After 24 h of in-cubation, the cells were washed with PBS buffer once and incu-bated with 100 �L of XTT reagent in DMEM for 4 h. The absor-bance of the formed formazan salt was determined using amicroplate reader (SpectraMax M5, Molecular Devices, Sunny-vale, U.S.A.) at a wavelength of 460 nm. Cell viability is expressedas ratio of the result obtained with cells exposed to the re-porter molecules to those for untreated cells.
Acknowledgment. We thank M. Weller and R. Schneider (BAMFederal Institute for Materials Research and Testing) for use ofthe cell culture facility and P. Lasch (CytoSpec, Inc.) for provid-ing Cytospec software.
Supporting Information Available: SERS spectra of hybridprobes in cell culture medium. This material is available free ofcharge via the Internet at http://pubs.acs.org.
REFERENCES AND NOTES1. Campion, A. K., P. Surface-Enhanced Raman Scattering.
M. S. Population Pumping of Excited Vibrational States bySpontaneous Surface-Enhanced Raman Scattering. Phys.Rev. Lett. 1996, 76, 2444–2447.
3. Moskovits, M. Surface-Enhanced Spectroscopy. Rev. Mod.Phys. 1985, 57, 783–826.
4. Otto, A. Surface-Enhanced Raman Scattering: ‘Classical’and ‘Chemical’ Origins. Light Scattering in Solids IV.Electronic Scattering, Spin Effects, SERS and Morphic Effects;Cardona, M., Guntherodt, G., Eds.; Springer-Verlag: Berlin,1984; pp 289�418.
5. Persson, B. N. J. On the Theory of Surface-EnhancedRaman Scattering. Chem. Phys. Lett. 1981, 82, 561–565.
6. Aroca, R. F.; Alvarez-Puebla, R. A.; Pieczonka, N.; Sanchez-Cortez, S.; Garcia-Ramos, J. V. Surface-Enhanced RamanScattering on Colloidal Nanostructures. Adv. ColloidInterface Sci. 2005, 116, 45–61.
7. Cao, Y. W. C.; Jin, R. C.; Mirkin, C. A. Nanoparticles withRaman Spectroscopic Fingerprints for DNA and RNADetection. Science 2002, 297, 1536–1540.
8. Jin, R. C.; Cao, Y. C.; Thaxton, C. S.; Mirkin, C. A. Glass-Bead-Based Parallel Detection of DNA Using Composite RamanLabels. Small 2006, 2, 375–380.
9. Ni, J.; Lipert, R. J.; Dawson, G. B.; Porter, M. D.
Immunoassay Readout Method Using Extrinsic RamanLabels Adsorbed on Immunogold Colloids. Anal. Chem.1999, 71, 4903–4908.
10. Vo-Dinh, T.; Stokes, D. L.; Griffin, G. D.; Volkan, M.; Kim,U. J.; Simon, M. I. Surface-Enhanced Raman Scattering(SERS) Method and Instrumentation for Genomics andBiomedical Analysis. J. Raman Spectrosc. 1999, 30,785–793.
11. Graham, D.; Faulds, K. Quantitative SERRS for DNASequence Analysis. Chem. Soc. Rev. 2008, 37, 1042–1051.
12. Vo-Dinh, T.; Hsin-Neng, W.; Jonathan, S. Plasmonicnanoprobes for SERS biosensing and bioimaging.J. Biophoton. 2010, 3, 89–102.
13. Schlucker, S.; Kustner, B.; Punge, A.; Bonfig, R.; Marx, A.;Strobel, P. Immuno-Raman Microspectroscopy: in SituDetection of Antigens in Tissue Specimens by Surface-Enhanced Raman Scattering. J. Raman Spectrosc. 2006, 37,719–721.
14. Mulvaney, S. P.; Musick, M. D.; Keating, C. D.; Natan, M. J.Glass-Coated, Analyte-Tagged Nanoparticles: A NewTagging System Based on Detection with Surface-Enhanced Raman Scattering. Langmuir 2003, 19,4784–4790.
15. Qian, X. M.; Peng, X. H.; Ansari, D. O.; Yin-Goen, Q.; Chen,G. Z.; Shin, D. M.; Yang, L.; Young, A. N.; Wang, M. D.; Nie,S. M. in Vivo Tumor Targeting and Spectroscopic Detectionwith Surface-Enhanced Raman Nanoparticle Tags. Nat.Biotechnol. 2008, 26, 83–90.
16. Kustner, B; Gellner, M; Schutz, M; Schoppler, F; Marx, A;Strobel, P; Adam, P; Schmuck, C; Schlucker, S. SERS Labelsfor Red Laser Excitation: Silica-Encapsulated SAMs onTunable Gold/Silver Nanoshells. Angew. Chem., Int. Ed.2009, 48, 1950–1953.
17. Kim, J.-H.; Kim, J.-S.; Choi, H.; Lee, S.-M.; Jun, B.-H.; Yu, K.-N.;Kuk, E.; Kim, Y.-K.; Jeong, D.-H.; Cho, M.-H.; Lee, Y.-S.Nanoparticle Probes with Surface Enhanced RamanSpectroscopic Tags for Cellular Cancer Targeting. Anal.Chem. 2006, 78, 6967–6973.
18. Kneipp, J.; Kneipp, H.; Rajaduraj, A.; Redmond, R. W.;Kneipp, K. Optical Probing and Imaging of Live Cells UsingSERS Labels. J. Raman Spectrosc. 2009, 40, 1–5.
19. Kneipp, J.; Kneipp, H.; Rice, W. L.; Kneipp, K. Optical Probesfor Biological Applications Based on Surface EnhancedRaman Scattering from Indocyanine Green on GoldNanoparticles. Anal. Chem. 2005, 77, 2381–2385.
20. Gellner, M.; Koempe, K.; Schlucker, S. Multiplexing withSERS Labels Using Mixed SAMs of Raman ReporterMolecules. Anal. Bioanal. Chem. 2009, 394, 1839–1844.
21. Su, X.; Zhang, J.; Sun, L.; Koo, T. W.; Chan, S.; Sundararajan,N.; Yamakawa, M.; Berlin, A. A. CompositeOrganic�inorganic Nanoparticles (COINs) with ChemicallyEncoded Optical Signatures. Nano Lett. 2005, 5, 49–54.
22. Nithipatikom, K.; McCoy, M. J.; Hawi, S. R.; Nakamoto, K.;Adar, F.; Campbell, W. B. Characterization and Applicationof Raman Labels for Confocal Raman MicrospectroscopicDetection of Cellular Proteins in Single Cells. Anal.Biochem. 2003, 322, 198–207.
23. Kneipp, J.; Kneipp, H.; Wittig, B.; Kneipp, K. One- and Two-Photon Excited Optical pH Probing for Cells Using Surface-Enhanced Raman and Hyper-Raman Nanosensors. NanoLett. 2007, 7, 2819.
24. Stokes, R. J; McKenzie, F; McFarlane, E; Ricketts, A; Tetley, L;Faulds, K; Alexander, J; Graham, D. Rapid Cell MappingUsing Nanoparticles and SERRS. Analyst 2009, 134,170–175.
25. Wabuyele, M. B.; Yan, F.; Griffin, G. D.; Vo-Dinh, T.Hyperspectral Surface-Enhanced Raman Imaging ofLabeled Silver Nanoparticles in Single Cells. Rev. Sci.Instrum. 2005, 76.
26. Macaskill, A.; Chernonosov, A. A.; Koval, V. V.; Lukyanets,E. A.; Fedorova, O. S.; Smith, W. E.; Faulds, K.; Graham, D.Quantitative Surface-Enhanced Resonance RamanScattering of Phthalocyanine-Labelled Oligonucleotides.Nucleic Acids Res. 2007, 35, 1–6.
VOL. 4 ▪ NO. 6 ▪ MATSCHULAT ET AL. www.acsnano.org3268
27. Alvarez-Puebla, R. A.; Dos Santos, D. S.; Aroca, R. F. Surface-Enhanced Raman Scattering for Ultrasensitive ChemicalAnalysis of 1 and 2-Naphthalenethiols. Analyst 2004, 129,1251–1256.
28. Doering, W. E.; Nie, S. M. Spectroscopic Tags Using Dye-Embedded Nanoparticies and Surface-Enhanced RamanScattering. Anal. Chem. 2003, 75, 6171–6176.
29. Walt, D. R.; Biran, I. Biosensing with Live Cells Using aHigh-Density Optical Fiber Array. Radiat. Res. 2001, 156,442.
30. Michota, A.; Bukowska, J. Surface-Enhanced RamanScattering (SERS) of 4-Mercaptobenzoic Acid on Silver andGold Substrates. J. Raman Spectrosc. 2003, 34, 21–25.
31. Hildebrandt, P.; Stockburger, M. Surface EnhancedResonance Raman-Study on Fluorescein Dyes. J. RamanSpectrosc. 1986, 17, 55–58.
32. Grubisha, D. S.; Lipert, R. J.; Park, H. Y.; Driskell, J.; Porter,M. D. Femtomolar Detection of Prostate-Specific Antigen:An Immunoassay Based on Surface-Enhanced RamanScattering and Immunogold Labels. Anal. Chem. 2003, 75,5936–5943.
33. Wang, Z. Y.; Bonoiu, A.; Samoc, M.; Cui, Y. P.; Prasad, P. N.Biological pH Sensing Based on Surface Enhanced RamanScattering through a 2-Aminothiophenol-Silver Probe.Biosens. Bioelectron. 2008, 23, 886–891.
34. Talley, C. E.; Jusinski, L.; Hollars, C. W.; Lane, S. M.; Huser, T.Intracellular pH Sensors Based on Surface-EnhancedRaman Scattering. Anal. Chem. 2004, 76, 7064–7068.
35. Bereton, R. G. Pattern Recognition. In Chemometrics: DataAnalysis for the Laboratory and Chemical Plant; John Wiley& Sons Ltd: Chichester, UK, 2006; pp 183�269.
36. Clausen, C.; Wechsler, H. Color Image Compression UsingPCA and Backpropagation Learning. Pattern Recognit.2000, 33, 1555–1560.
37. Koljenovic, S.; Schut, T. C. B.; van Meerbeeck, J. P.; Maat, A.;Burgers, S. A.; Zondervan, P. E.; Kros, J. M.; Puppels, G. J.Raman Microspectroscopic Mapping Studies of HumanBronchial Tissue. J. Biomed. Opt. 2004, 9, 1187–1197.
38. Romeo, M. J.; Diem, M. Infrared Spectral Imaging of LymphNodes: Strategies for Analysis and Artifact Reduction. Vib.Spectrosc. 2005, 38, 115–119.
39. Wood, B. R.; Chernenko, T.; Matthaus, C.; Diem, M.; Chong,C.; Bernhard, U.; Jene, C.; Brandli, A. A.; McNaughton, D.;Tobin, M. J.; Trounson, A.; Lacham-Kaplan, O. SheddingNew Light on the Molecular Architecture of Oocytes Usinga Combination of Synchrotron Fourier Transform-Infrared and Raman Spectroscopic Mapping. Anal. Chem.2008, 80, 9065–9072.
40. Pearson, K. On Lines and Planes of Closest Fit to a Systemof Points in Space. London, Edinburgh, Philos. Mag. J. Sci.1901, 6, 559–572.
41. Ward, J. H. Hierarchical Grouping to Optimize an ObjectiveFunction. J. Am. Stat. Assoc. 1963, 58, 236–244.
42. Kneipp, J.; Kneipp, H.; McLaughlin, M.; Brown, D.; Kneipp,K. in Vivo Molecular Probing of Cellular Compartmentswith Gold Nanoparticles and Nanoaggregates. Nano Lett.2006, 6, 2225–2231.
43. Bright, N. A.; Reaves, B. J.; Mullock, B. M.; Luzio, J. P. DenseCore Lysosomes Can Fuse with Late Endosomes and AreRe-Formed from the Resultant Hybrid Organelles. J. CellSci. 1997, 110, 2027–2040.
44. Duclos, S.; Corsini, R.; Desjardins, M. Remodeling ofEndosomes during Lysosome Biogenesis Involves ‘Kiss andRun’ Fusion Events Regulated by rab5. J. Cell Sci. 2003,116, 907–918.
45. Connor, E. E.; Mwamuka, J.; Gole, A.; Murphy, C. J.; Wyatt,M. D. Gold Nanoparticles Are Taken up by Human Cellsbut Do Not Cause Acute Cytotoxicity. Small 2005, 1, 325–327.
46. Khan, J. A.; Pillai, B.; Das, T. K.; Singh, Y.; Maiti, S. MolecularEffects of Uptake of Gold Nanoparticles in HeLa cells.Chembiochem 2007, 8, 1237–1240.
Schmid, G.; Brandau, W.; Jahnen-Dechent, W. Size-Dependent Cytotoxicity of Gold Nanoparticles. Small2007, 3, 1941–1949.
48. Patra, H. K.; Banerjee, S.; Chaudhuri, U.; Lahiri, P.; Dasgupta,A. K. Cell Selective Response to Gold Nanoparticles.Nanomedicine 2007, 3, 111–119.
49. Pernodet, N.; Fang, X.; Sun, Y.; Bakhtina, A.; Ramakrishnan,A.; Sokolov, J.; Ulman, A.; Rafailovich, M. Adverse Effectsof Citrate/Gold Nanoparticles on Human DermalFibroblasts. Small 2006, 2, 766–773.
50. Shukla, R.; Bansal, V.; Chaudhary, M.; Basu, A.; Bhonde,R. R.; Sastry, M. Biocompatibility of gold Nanoparticles andTheir Endocytotic Fate Inside the Cellular Compartment:A Microscopic Overview. Langmuir 2005, 21,10644–10654.
51. Uboldi, C.; Bonacchi, D.; Lorenzi, G.; Hermanns, M. I.; Pohl,C.; Baldi, G.; Unger, R. E.; Kirkpatrick, C. J. GoldNanoparticles Induce Cytotoxicity in the Alveolar Type-IICell Lines A549 and NCIH441. Part. Fibre Toxicol. 2009, 6,18.
52. Wang, S. G.; Lu, W. T.; Tovmachenko, O.; Rai, U. S.; Yu, H. T.;Ray, P. C. Challenge in Understanding Size and ShapeDependent Toxicity of Gold Nanomaterials in Human SkinKeratinocytes. Chem. Phys. Lett. 2008, 463, 145–149.
53. AshaRani, P. V.; Mun, G. L. K.; Hande, M. P.; Valiyaveettil, S.Cytotoxicity and Genotoxicity of Silver Nanoparticles inHuman Cells. ACS Nano 2009, 3, 279–290.
54. Carlson, C.; Hussain, S. M.; Schrand, A. M.; Braydich-Stolle,L. K.; Hess, K. L.; Jones, R. L.; Schlager, J. J. Unique CellularInteraction of Silver Nanoparticles: Size-DependentGeneration of Reactive Oxygen Species. J. Phys. Chem. B2008, 112, 13608–13619.
55. Kawata, K.; Osawa, M.; Okabe, S. In Vitro Toxicity of SilverNanoparticles at Noncytotoxic Doses to HepG2 HumanHepatoma Cells. Environ. Sci. Technol. 2009, 43, 6046–6051.
56. Yen, H. J.; Hsu, S. H.; Tsai, C. L. Cytotoxicity andImmunological Response of Gold and Silver Nanoparticlesof Different Sizes. Small 2009, 5, 1553–1561.
57. Amrolia, P.; Sullivan, S. G.; Stern, A.; Munday, R. Toxicity ofAromatic Thiols in the Human Red Blood Cell. J ApplToxicol 1989, 9, 113–118.
58. Scudiero, D. A.; Shoemaker, R. H.; Paull, K. D.; Monks, A.;Tierney, S.; Nofziger, T. H.; Currens, M. J.; Seniff, D.; Boyd,M. R. Evaluation of a Soluble Tetrazolium Formazan Assayfor Cell-Growth and Drug Sensitivity in Culture UsingHuman and Other Tumor-Cell Lines. Cancer Res. 1988, 48,4827–4833.
59. Munro, C. H.; Smith, W. E.; Garner, M.; Clarkson, J.; White,P. C. Characterization of the Surface of a Citrate-ReducedColloid Optimized for Use as a Substrate for Surface-Enhanced Resonance Raman-Scattering. Langmuir 1995,11, 3712–3720.
60. Lee, P. C.; Meisel, D. Adsorption and Surface-EnhancedRaman of Dyes on Silver and Gold Sols. J. Phys. Chem.1982, 86, 3391–3395.
61. Lasch, P.; Haensch, W.; Naumann, D.; Diem, M. Imaging ofColorectal Adenocarcinoma Using FT-IRMicrospectroscopy and Cluster Analysis. Biochim. Biophys.Acta 2004, 1688, 176–186.
62. Macqueen, J. B. Some Methods of Classification andAnalysis of Multivariate Observations. Proc. 5th BerkeleySymp. Math. Stat. Prob. 1967, 1, 281–297.