Surface-Enhanced Raman Scattering of Rat Tissues O ¨ MER AYDIN, MEHMET KAHRAMAN, ERTUG ˘ RUL KILIC ¸, and MUSTAFA C ¸ ULHA* Yeditepe University, Faculty of Engineering and Architecture, Department of Genetics and Bioengineering, 34755 Kayisdagi-Istanbul, Turkey (O ¨ .A., M.K., M.C ¸ .); and Yeditepe University, Medical School, Department of Physiology, 34755 Kayisdagi-Istanbul, Turkey (E.K.) Surface-enhanced Raman scattering (SERS) is proven to be a powerful tool for investigation of biological structures. In this study, tissues obtained from different rat organs are examined using SERS. The tissue samples are crushed with a pestle after sudden freezing in liquid nitrogen and mixed with a concentrated colloidal silver nanoparticle suspension. The reproducibility of SERS spectra acquired from several tissue samples from different organs is demonstrated. The collected spectra are comparatively evaluated based on the physiological function of the organ from which the tissue is obtained. The spectra from the tissues show significant differences and indicate that they can be used for tissue characterization and differentiation. The identification of the origins of the bands on the spectra is also attempted. This study suggests that SERS can be used to monitor the changes at the molecular level during metabolic changes in an organ or tissue as a result of a disease or another cause. Index Headings: Surface-enhanced Raman scattering; SERS; Tissue; Differentiation; Silver nanoparticles; Disease. INTRODUCTION The animal or human organs are the higher organization of the specialized cells. The cells are complex structures composed of biochemical components and several different small and large molecules and inorganic species are confined within the cellular membrane. The majority of biological macromolecules are nucleic acids, proteins, polysaccharides, lipids, and other smaller biomolecules such as amino acids, nucleotides, and monosaccharides. The concentration and state of biochemical molecules and species are determined by a number of factors concealed in a cell’s specialization. Disease formation is one of the factors inducing changes at the cellular level. The detection of disease formation at the organ level is not always an easy task and it may require several testing procedures. Most of the time, it is not possible to detect molecular changes in an organ until the real symptoms appear. Therefore, there is a need for a technique that determines metabolic changes during the early phase of disease progres- sion. Raman spectroscopy is a powerful vibrational spectroscopic technique for characterization of biological molecules and structures. This is mostly due to its fingerprinting property, low sensitivity to water, minimum sample preparation step, and increased sensitivity with recent developments in instrumenta- tion. It has been demonstrated that Raman spectroscopy can be used to monitor disease progression and diagnosis 1–3 from tissue samples and single cells. 4,5 There are an increasing number of applications of bulk Raman spectroscopy in medical diagnostics, sensing, detection of biomolecules, and cellular and biomedical imaging. 6–15 Even with the incredible recent progress, it is thought that the utility of Raman spectroscopy in medical applications is still in its infancy; it is quickly advancing for its clinical use. 16,17 The major limitation of bulk Raman spectroscopy is inherently weak scattering. However, this limitation can be remedied by bringing a molecule or molecular structure to the close vicinity of nanostructured noble metal surfaces, which results in several orders of magnitude of enhancement in Raman scattering and is called surface-enhanced Raman scattering (SERS). 18–20 The use of SERS for a range of applications from single molecule to bacterial identification has been demonstrated and it is finding increasing applications especially in the medical sciences. 21–31 Pinzaru et al. demonstrated the feasibility of SERS for tissue characterization using sliced tissue samples after treatment with silver colloidal suspensions. 32 They also demonstrated the usefulness of the technique for possible applications in tissue differentiation. In this study, we have investigated the application of SERS for tissue characterization and differentiation. The tissue samples were obtained from seven different organs of male 6-month-old Wistar Hannover rats that were used as a model. Spectra from tissue samples from heart, liver, kidney, spleen, testicle, lung, and brain were obtained. First, the reproducibility of the SERS spectra from laser spot to spot, from spot to spot using the same sample to test the homogeneity of the sample, and from animal to animal was investigated. Finally, the SERS spectra obtained from different organs were compared and band assignments were attempted. MATERIALS AND METHODS Materials. Silver nitrate was purchased from Fluka (Seelze, Germany). Sodium chloride (NaCl) and tri-sodium citrate were purchased from Merck (Darmstadt, Germany). Rampun (Xilasine 2%) was purchased from Bayern (Istanbul, Turkey) and Alfamine (Ketamine HCl 10%) was purchased from Ege Vet (Izmir, Turkey). All chemicals were used as they were received. Preparation of Silver Nanoparticles. The silver colloidal suspension was prepared using the method of Lee and Meisel. 33 Briefly, AgNO 3 (90 mg) was dissolved in water (500 mL) and heated until boiling. An aliquot (10 mL) of sodium citrate (1%) was added to the solution, which was kept boiling until the volume reached about 250 mL. The maximum absorption of the silver colloidal solution was recorded at 420 nm. In this method, the average particle size is about 50 nm. The silver colloidal suspension was concentrated 4 times (4 3 ) by centrifugation at 5500 rpm for 30 min. Animal Experiments. Wistar Hannover rats, male and 6 months old, were used for the experiments. Their weights were in the range of 300 to 350 g. All procedures performed on the animals were approved by Yeditepe University Ethical Committee. Briefly, the rats were anesthetized with a combination of rampun (0.16 mL) and ketamine (0.34 mL). The animals were perfused with normal saline transcardially. Received 19 December 2008; accepted 25 March 2009. * Author to whom correspondence should be sent. E-mail: mculha@ yeditepe.edu.tr. 662 Volume 63, Number 6, 2009 APPLIED SPECTROSCOPY 0003-7028/09/6306-0662$2.00/0 Ó 2009 Society for Applied Spectroscopy
Transcript
Surface-Enhanced Raman Scattering of Rat Tissues
OMER AYDIN, MEHMET KAHRAMAN, ERTUGRUL KILIC, and MUSTAFA CULHA*Yeditepe University, Faculty of Engineering and Architecture, Department of Genetics and Bioengineering, 34755 Kayisdagi-Istanbul, Turkey(O.A., M.K., M.C.); and Yeditepe University, Medical School, Department of Physiology, 34755 Kayisdagi-Istanbul, Turkey (E.K.)
Surface-enhanced Raman scattering (SERS) is proven to be a powerful
tool for investigation of biological structures. In this study, tissues
obtained from different rat organs are examined using SERS. The tissue
samples are crushed with a pestle after sudden freezing in liquid nitrogen
and mixed with a concentrated colloidal silver nanoparticle suspension.
The reproducibility of SERS spectra acquired from several tissue samples
from different organs is demonstrated. The collected spectra are
comparatively evaluated based on the physiological function of the organ
from which the tissue is obtained. The spectra from the tissues show
significant differences and indicate that they can be used for tissue
characterization and differentiation. The identification of the origins of
the bands on the spectra is also attempted. This study suggests that SERS
can be used to monitor the changes at the molecular level during
metabolic changes in an organ or tissue as a result of a disease or another
cause.
Index Headings: Surface-enhanced Raman scattering; SERS; Tissue;
Differentiation; Silver nanoparticles; Disease.
INTRODUCTION
The animal or human organs are the higher organization ofthe specialized cells. The cells are complex structurescomposed of biochemical components and several differentsmall and large molecules and inorganic species are confinedwithin the cellular membrane. The majority of biologicalmacromolecules are nucleic acids, proteins, polysaccharides,lipids, and other smaller biomolecules such as amino acids,nucleotides, and monosaccharides. The concentration and stateof biochemical molecules and species are determined by anumber of factors concealed in a cell’s specialization. Diseaseformation is one of the factors inducing changes at the cellularlevel. The detection of disease formation at the organ level isnot always an easy task and it may require several testingprocedures. Most of the time, it is not possible to detectmolecular changes in an organ until the real symptoms appear.Therefore, there is a need for a technique that determinesmetabolic changes during the early phase of disease progres-sion.
Raman spectroscopy is a powerful vibrational spectroscopictechnique for characterization of biological molecules andstructures. This is mostly due to its fingerprinting property, lowsensitivity to water, minimum sample preparation step, andincreased sensitivity with recent developments in instrumenta-tion. It has been demonstrated that Raman spectroscopy can beused to monitor disease progression and diagnosis1–3 fromtissue samples and single cells.4,5 There are an increasingnumber of applications of bulk Raman spectroscopy in medicaldiagnostics, sensing, detection of biomolecules, and cellularand biomedical imaging.6–15 Even with the incredible recentprogress, it is thought that the utility of Raman spectroscopy in
medical applications is still in its infancy; it is quicklyadvancing for its clinical use.16,17
The major limitation of bulk Raman spectroscopy isinherently weak scattering. However, this limitation can beremedied by bringing a molecule or molecular structure to theclose vicinity of nanostructured noble metal surfaces, whichresults in several orders of magnitude of enhancement inRaman scattering and is called surface-enhanced Ramanscattering (SERS).18–20 The use of SERS for a range ofapplications from single molecule to bacterial identification hasbeen demonstrated and it is finding increasing applicationsespecially in the medical sciences.21–31 Pinzaru et al.demonstrated the feasibility of SERS for tissue characterizationusing sliced tissue samples after treatment with silver colloidalsuspensions.32 They also demonstrated the usefulness of thetechnique for possible applications in tissue differentiation.
In this study, we have investigated the application of SERSfor tissue characterization and differentiation. The tissuesamples were obtained from seven different organs of male6-month-old Wistar Hannover rats that were used as a model.Spectra from tissue samples from heart, liver, kidney, spleen,testicle, lung, and brain were obtained. First, the reproducibilityof the SERS spectra from laser spot to spot, from spot to spotusing the same sample to test the homogeneity of the sample,and from animal to animal was investigated. Finally, the SERSspectra obtained from different organs were compared andband assignments were attempted.
MATERIALS AND METHODS
Materials. Silver nitrate was purchased from Fluka (Seelze,Germany). Sodium chloride (NaCl) and tri-sodium citrate werepurchased from Merck (Darmstadt, Germany). Rampun(Xilasine 2%) was purchased from Bayern (Istanbul, Turkey)and Alfamine (Ketamine HCl 10%) was purchased from EgeVet (Izmir, Turkey). All chemicals were used as they werereceived.
Preparation of Silver Nanoparticles. The silver colloidalsuspension was prepared using the method of Lee andMeisel.33 Briefly, AgNO3 (90 mg) was dissolved in water(500 mL) and heated until boiling. An aliquot (10 mL) ofsodium citrate (1%) was added to the solution, which was keptboiling until the volume reached about 250 mL. The maximumabsorption of the silver colloidal solution was recorded at 420nm. In this method, the average particle size is about 50 nm.The silver colloidal suspension was concentrated 4 times (43)by centrifugation at 5500 rpm for 30 min.
Animal Experiments. Wistar Hannover rats, male and 6months old, were used for the experiments. Their weights werein the range of 300 to 350 g. All procedures performed on theanimals were approved by Yeditepe University EthicalCommittee. Briefly, the rats were anesthetized with acombination of rampun (0.16 mL) and ketamine (0.34 mL).The animals were perfused with normal saline transcardially.
Received 19 December 2008; accepted 25 March 2009.* Author to whom correspondence should be sent. E-mail: [email protected].
662 Volume 63, Number 6, 2009 APPLIED SPECTROSCOPY0003-7028/09/6306-0662$2.00/0
� 2009 Society for Applied Spectroscopy
After the dissection, the heart, lung, liver, kidney, spleen,testes, and brain components were frozen and then stored at�20 8C until the analysis.
Preparation of Tissue Samples. A tissue sample with adiameter of 1 mm was cut from the main organ stocks andplaced into 4 mL of liquid nitrogen in a container. The sampleswere crushed with a pestle. The smashed tissue samples weremixed with 43 silver colloidal suspension (200 lL). A 5 lLaliquot of this mixture was spotted on a CaF2 slide and dried atroom temperature about 10 minutes before analysis.
Raman Instrumentation. All SERS spectra were recordedwith a completely automated Renishaw InVia Reflex Ramanmicroscopy system (Renishaw Plc., New Mills, Wotton-under-Edge, UK) equipped with 830 nm diode and 514.5 argon-ionlasers. The 830 nm diode laser was used in this study. The laserpower was in the range of 3 mW, and the exposure time was 10s. A 503 (N.A. ¼ 0.75) objective was used for all measure-ments. The Raman instrument was automatically calibratedusing an internal silicon wafer by centering the band at 520cm�1.
RESULTS AND DISCUSSION
As explained in the Experimental section, the tissue samplewas crushed after sudden freezing in liquid nitrogen and mixedwith the 43 concentrated silver colloidal suspension. A 43
concentrated colloidal suspension was found to be satisfactoryto generate fairly homogeneous sample mixture upon mixingwith the crushed tissue. Upon crushing the tissue after freezingwith liquid nitrogen, it is expected that a large portion of thecells in the tissue matrix are destroyed. The addition of thesilver colloidal suspension into the crushed tissue and stirring itmore will definitely further destroy the cells in the matrix.However, all these harsh treatments may not be enough tobreak all cells down. Although it is possible that some cellsmay remain intact, we believe this is not going to influence theresults to a large extent.
A 5 lL volume of this sample was spotted on a CaF2 slide.The scanning electron microscopy (SEM) image of such asample prepared using a tissue sample from the cortex is seenin Fig. 1. As is seen, this procedure generates a fairlyhomogenous mixture of liquefied tissue and colloidal silvernanoparticles. In order to compare the bulk Raman spectrum ofthe crushed tissue to the spectrum taken after mixing thesample with colloidal silver nanoparticles, a bulk Ramanspectrum obtained from the heart tissue (see SupplementalMaterial, Figs. 1A and 1B) indicates that there is not anyinterference from bulk Raman scattering. In order to further testthe homogeneity of the spotted sample and the reproducibilityof the SERS spectra obtained, the laser spot on the samesample was arbitrarily relocated. Figure 2 shows the ten spectraobtained by moving the laser spot to ten different locations onthe sample seen in Fig. 1. The percent coefficient of variation(CV%) for the ten spectra is found to be 30 using the band at724 cm�1. In order to test the homogeneity of the originalsample and its influence on the SERS spectra, one SERSspectrum from each of ten different spots on the CaF2 slide wasacquired. Figure 3 shows the comparison of the SERS spectraobtained from ten different sample spots located on the CaF2
slide from the heart tissue sample. The CV% was found to be16. The comparison of CV% for both samples indicates that thesample preparation generates a fairly homogeneous mixture.Next, the reproducibility of the SERS spectra from the sametissue sample from animal to animal was tested. Figure 4 showsthe spectra obtained from ten different rat heart tissues. TheCV% was found as 18 using the band at 724 cm�1. The tenSERS spectra obtained from the samples were averaged andused for the comparison of the reproducibility of SERS spectrafrom sample spot to spot and from animal to animal.
Although individual differences in healthy animals are
FIG. 1. SEM image of the tissue mixed with the concentrated silvernanoparticles. The inset image shows the sample at high magnification.
FIG. 2. The reproducibility of the SERS spectra obtained from ten differentspots on the same sample prepared using the tissue from the cortex.
FIG. 3. SERS spectra obtained from ten different spotted samples preparedfrom heart tissue.
APPLIED SPECTROSCOPY 663
possible, it is evident that the spectra obtained from the sameorgan are very similar. It is clear that the SERS spectraobtained under these conditions can be used for tissuecharacterization and perhaps differentiation. In the next section,brief information about the structure and function of each organis presented to help give better understanding of the bandassignments.
The brain is an interesting organ and it has several differentcompartments with different functions. The nervous system isdivided into two main parts: the central nervous system and theperipheral nervous system. In addition to nerve cells (neurons),the central nervous system contains many non-neural supportcells such as astrocytes, oligodendrocytes, ependyma, andmicroglial. All of these cells are called simply glia. Theperipheral nervous system is composed of nerve cells andsupport cells as well. A nerve cell is made of axons supportedby support tissue containing Schwan cells, including myelin,spindle-shaped fibroblast support cells, and blood vessels.Neurons communicate with each another though the synapsesby releasing neurotransmitters. The density of granularendoplasmic reticulums or ribosomes in nerve cells is high.Since the nerve cells are metabolically very active, they areinvolved in large amounts of protein synthesis.34
Although not all brain regions are composed of only onespecialized type of cell and may house more than one type ofcell, we have obtained samples from different regions of thehealthy rats and investigated the SERS spectral differences andsimilarities. Biopsies from the cortex, brain stem, glandularlobe of the hypophysis, subcortical tissue, and cerebellum werecollected. Figure 5 shows the comparison of the spectra.Inspection of the spectra reveals that the bands in the region of500 to 700 cm�1 show significant variations, which mayindicate the differences in their molecular compositions. It isalso interesting to note the similarity of the SERS spectraobtained from different regions of the brain. This could be dueto the interaction of specific molecules with silver colloidalnanoparticles due to the fact that the molecular species must bevery close to or in interaction with the silver nanoparticles. Thisclose interaction is governed by the functional groups such as–SH, –NH2, and –COO� that are present in the structure ofseveral biomolecules. The molecular species having an affinityfor the silver metal surface preferentially interact with the silversurfaces and as a result, the SERS spectra of tissue samples aredominated by these molecular species.
Although all eukaryotic cells share common features such as
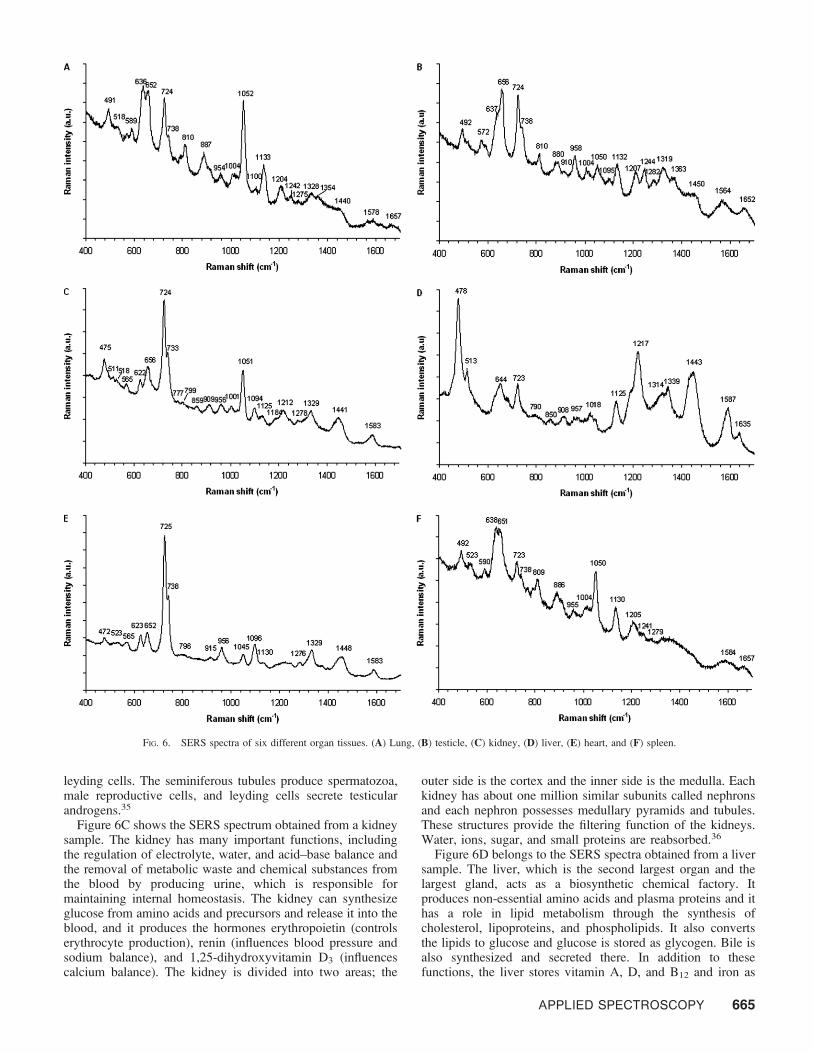
a nucleus, cellular membrane, mitochondria, and cytoskeletalsystem, their function is specialized depending on the organthey compose. Since the tissues make up organs and eachorgan has specific functions and different structures, thedifferences in their molecular composition are inevitable.Figure 6 shows the SERS spectra of six different organs. Asmentioned, the SERS spectra reflect the molecules andmolecular structures in contact with colloidal silver nanopar-ticles. Inspection of the spectrum of each tissue sample fromeach different organ reveals characteristics for the specialfunction of the organ. Even the bands at similar positions havedifferent intensities and spectral features change from tissue totissue, indicating that the concentration and composition of thespecies in contact with the silver nanoparticles changes. Theuse of a high concentration and known colloidal suspensionwith about the same size tissue for all experiments may providea standard setting in which to observe the possible concentra-tion differences in the sample tissues.
The SERS spectrum in Fig. 6A belongs to sample tissueobtained from the lung. The lungs are composed of bronchi,bronchiole, alveoli sacs, and alveoli. The alveoli are specializedstructures that increase the exchange area at the lungs. Theairways from the trachea to the alveoli are lined withrespiratory epithelium cells, which are ciliated columnar cells,mucous goblet cells, brush cell, basal cells, and small granulecells. The ciliated columnar cell is the most plentiful cell type;it possesses cilia on its surface and mitochondria, which supplyATP for ciliary movement. The mucous goblet cells secretemucus, which has a glycoprotein structure. The brush cellshave a large amount of microvilli that are responsible forsensing affairs because of the nerve endings on their surfaces.Basal cells are believed to generate stem cells that differentiatethe other cell types, and lastly small granule cells have arelationship with the neuroendocrine system.35
Figure 6B shows the SERS spectrum obtained from atesticle, which is a part of the male reproductive system andproduces hormones and spermatozoa. They influence manyorgans and tissues during the puberty and maturity period.Each testicle is in a thick capsule made of dense connectivetissue known as tunica albuginea. The testis has pyramidalstructures called the testicular lobules. These lobes are createdby seminiferous tubules enmeshed in a web of loose connectivetissue that is rich in blood, lymphatic vessels, nerves, and
FIG. 4. SERS spectra obtained from ten different animal hearts. FIG. 5. Comparison of SERS spectra obtained from different regions of thebrain. (A) Cortex, (B) brain stem, (C) glandular lobe of hypophysis, (D)subcortical tissue, and (E) cerebellum.
664 Volume 63, Number 6, 2009
leyding cells. The seminiferous tubules produce spermatozoa,male reproductive cells, and leyding cells secrete testicularandrogens.35
Figure 6C shows the SERS spectrum obtained from a kidneysample. The kidney has many important functions, includingthe regulation of electrolyte, water, and acid–base balance andthe removal of metabolic waste and chemical substances fromthe blood by producing urine, which is responsible formaintaining internal homeostasis. The kidney can synthesizeglucose from amino acids and precursors and release it into theblood, and it produces the hormones erythropoietin (controlserythrocyte production), renin (influences blood pressure andsodium balance), and 1,25-dihydroxyvitamin D3 (influencescalcium balance). The kidney is divided into two areas; the
outer side is the cortex and the inner side is the medulla. Eachkidney has about one million similar subunits called nephronsand each nephron possesses medullary pyramids and tubules.These structures provide the filtering function of the kidneys.Water, ions, sugar, and small proteins are reabsorbed.36
Figure 6D belongs to the SERS spectra obtained from a liversample. The liver, which is the second largest organ and thelargest gland, acts as a biosynthetic chemical factory. Itproduces non-essential amino acids and plasma proteins and ithas a role in lipid metabolism through the synthesis ofcholesterol, lipoproteins, and phospholipids. It also convertsthe lipids to glucose and glucose is stored as glycogen. Bile isalso synthesized and secreted there. In addition to thesefunctions, the liver stores vitamin A, D, and B12 and iron as
FIG. 6. SERS spectra of six different organ tissues. (A) Lung, (B) testicle, (C) kidney, (D) liver, (E) heart, and (F) spleen.
APPLIED SPECTROSCOPY 665
ferritin. Therefore, metabolism of the liver is highly active, it isrich in cytoplasmic organelles, and it has many mitochondria asa result of its high energy requirements. These functionalactivities should be reflected by the SERS spectra.34
Figure 6E shows the SERS spectrum obtained from hearttissue. The heart is responsible for pumping the blood to thewhole body. The cardiac muscle is the hardest working musclein the body and it contracts 60–100 times per minute untildeath without rest. Its structure is grown for pumping and itswall has three layers, which are endocardium, myocardium,and pericardium. These structures consist of dense connectivetissue with thick collagen fibers. Therefore, the cytoplasm ofheart cells is rich in mitochondria and glycogen.34
Figure 6F shows the SERS spectrum of a sample obtainedfrom the spleen. The spleen is the largest accumulation oflymphoid tissues in the body and is an important defenseweapon against microorganisms. It produces the lymphocytesT cells and B cells. Its other functions are producing bilirubinand destroying aged blood red cells.35
The bands at 472–478 cm�1 in all the SERS spectra exceptfor the spectra of brain tissues are assigned to polysaccharidesand glycogen, which helps to store energy in the form ofchemical energy. This band is not visible in the testicle andlung spectra due to the broad band around 491 cm�1, which isalso assigned to glycogen. Considering the rich glucose contentof the liver due to glycogen synthesis, it is consistent to see avery intense glycogen band in the SERS spectra of the liver(see Fig. 6D).37 The band at 511 cm�1 is assigned to collagen,which is a long fibrous protein supporting most tissue.Although it is not a significant part of the tissue samples inthis study, it might be present in all samples except for thetissues from the brain. The band at 518 cm�1 can be assigned tophosphatidylinositol and it appears only in SERS spectra of thelung and kidney, Figs. 6A and 6C, respectively. The bandsaround 522 cm�1 are assigned to the S–S disulfide stretching ofcollagen. This band does not appear in the SERS spectra ofbrain tissues.
The band at around 622 cm�1 appears only in the brain,kidney, and heart spectra, Fig. 5 and Figs. 6C and 6E,respectively, and is assigned to C–C twist from an aromaticring. This could be originating from an amino acid residue,electron transfer vehicle such as NADH, or a neurotransmitterwhen the origin of the tissue sample is considered. The bands ataround 636 and 652 cm�1 are assigned to C–S stretching andC–C twisting of proteins, mainly from tyrosine residue, and theC–S stretching mode of cysteine, respectively. The intensity ofthese bands in the lung and spleen spectra (Figs. 6A and 6F) isinteresting to note. This may indicate the increased number ofthiol-containing residues in the protein structure residing inthese tissues. These bands appear as a broad band in the testiclespectrum (Fig. 6B), only at 656 cm�1 in the kidney spectrum(Fig. 6C), and as a broad peak at around 644 cm�1 withmedium intensity compared to the same band in other spectra.
The two bands at around 724 and 736 cm�1 appear in almostall spectra with different intensities except for the liver spectra(Fig. 6D), where only the 723 cm�1 band is present. These twobands could be originating from adenine ring breathing ofDNA/RNA, C–S vibrations in proteins, and electron carrierssuch as NADH.38,39 Since it is difficult for chromosomal DNAreleased from the nucleus to come into contact with thecolloidal silver nanoparticles, it is more logical to assume thatthese two bands are originating from RNA or smaller
molecules such as DNA bases free in the cytosol, amino acidswith aromatic rings, and electron carriers released upondisrupting the cellular structure present in the cell.
The very weak bands at 777 cm�1 and around 792 cm�1 inthe kidney and liver spectra could be originating from uraciland O–P–O stretches in RNA and free DNA bases,respectively. The bands at around 810 cm�1 can also beassigned to phosphodiester.40 The band at around 908–915cm�1 could be originating from glucose,39,41 whose intensity isrelatively stronger in the spectra of the liver and kidney. Thebands at around 955 cm�1 can be assigned to carotenoids andcholesterol. This band is present in all spectra except for thespectra of the spleen. The band at 1004 cm�1 is aromatic C–Cstretching of phenylalanine.42 The band at 1050 cm�1 is C–Oor C–N stretching from proteins.43 The relative intensity of thisband is highest in the lung, then spleen, kidney, brain, heart,and testicle spectra, in decreasing order. The bands beyond1050 to 1660 cm�1 mostly belong to vibrations of proteins. Theband at 1125 cm�1 appears only in the kidney and liver spectra.It is assigned to C–C skeletal acyl backbone in lipids, C–Nstretching vibration of proteins, and C–C, C–O of disaccha-rides.37,44 Since the liver has a role in protein, lipid, andcarbohydrate metabolism, the band intensity is higher in thespectrum of the liver than the spectrum of the kidney. Thebands around at 1130 cm�1 can be assigned to phospholipidsand fatty acids.41 These bands are present in the spectra of thelung, testis, heart, and spleen as well; however, the peakintensity in the heart spectrum is the weakest.
The band at 1217 cm�1 appears only on the liver spectra andcould be originating from C–N stretching as well.45 Althoughthere are many molecules that may carry C–N bonds, when theliver is considered as the biosynthesis center of the body andhaving the responsibility of producing non-essential aminoacids and plasma proteins, the origin of this band can be freeamino acids, polypeptides, or proteins. This may indicate thepossibility of relating the SERS spectra to the function of thecells in the tissue sample. The bands between 1242 and 1363cm�1 could be assigned to amide III, collagen for all organs’spectra. This range of spectra generally belongs to proteinvibrations.
The bands at around 1443 cm�1 in the brain, lung, kidney,and liver spectra are assigned to fatty acids, cholesterol, orlipids.16 When the intensity of this band is compared betweenspectra, it is highest in the liver spectrum. This is consistentwith the fact that the synthesis of cholesterol, lipoproteins, andphospholipids takes place in this organ.
The other characteristic band is at 1448 cm�1 in the heartspectra. This band could be originating from collagen.46 Theheart muscle is structurally different from the smooth musclesin other organs. Since the heart is always in the process ofpumping blood, its structure is quite different from the structureof other organs. The collagen in the structure of the heartsmooth muscles provides the ability of the heart to functioncontinuously.
The spectra of all organs except the testicle have bands ataround 1580 cm�1. They could be assigned to guanine,adenine, C–C stretching, and C¼C olefinic stretch (proteinassignment).45,47,48 The band at 1635 cm�1 is seen only in theliver spectra and it is assigned to amide I.49 The band at 1652cm�1 appears only in the spectra of the testicle and it can beassigned to the C¼C stretch of lipid.50 The lipid structures aredominant in the testicle. Table I provides the band assignments
666 Volume 63, Number 6, 2009
of the SERS spectra of tissues obtained from different organs.Some of the band assignments were also confirmed from theSERS spectra of certain biological molecules (see Supplemen-tal Material).
In order to demonstrate the feasibility of the approach forpossible disease diagnosis, we performed additional experi-ments with human brain tumor (pilocytic astrocytoma), healthyhuman cerebellum tissue, and rat cerebellum (see SupplementalMaterial, Fig. 2). As is seen, there are significant differencesbetween human brain tumor (Supplemental Material, Fig. 2A)and healthy brain tissue (Supplemental Material, Fig. 2B). It isalso interesting to note the similarity between healthy human
and rat cerebellum (Supplemental Material, Fig. 2C) SERS
spectra.
CONCLUSION
The results of this study show that SERS spectra of tissue
can be used not only for characterization of tissue of different
origins but also for investigation of molecular changes at the
cellular level. The reproducibility of the sample preparation
and the obtained SERS spectra from different tissue sources is
reasonable for their comparison. Since the SERS spectra can be
related to the functional characteristics of the organ, it may
TABLE I. Band assignments of SERS spectra obtained from seven different rat organs (w: weak; m: medium; s: strong).
Raman shift(cm�1)
Band assignmentsBrain Lung Testicle Kidney Liver Heart Spleen
475 (m) 478 (s) 472 (w) Polysaccharides, amylose, glycogen37
491 (m) 492 (m) 492 (m) Glycogen37
511 (w) 513 (w) S–S disulfide stretching band of collagen m(S–S), gauche-gauche-gauche(aminoacid cysteine)37,44
open new venues for possible investigation of changes duringdisease progression. The inspection of SERS spectra of alltissue samples reveals that they show spectrally significantdifferences and these differences could be attributable to theirphysiological and functional differences based on theirmolecular differences.
ACKNOWLEDGMENTS
The financial support of Yeditepe University and The Scientific andTechnological Research Council of Turkey (TUBITAK) is gratefullyacknowledged.
SUPPLEMENTAL MATERIAL
The Supplemental Material mentioned in the text, includingcomparative bulk and SERS spectra obtained from heart tissueand comparison of SERS spectra obtained from human braintumor and healthy cerebellum tissue from human and rat, aswell as SERS spectra of several biological molecules, isavailable on-line in the electronic version of the journal (http://www.s-a-s.org).
1. R. Malini, K. Venkatakrishna, J. Kurien, K. M. Pai, Lakshmi Rao, V. B.Kartha, and C. M. Krishna, Biopolymers 81, 179 (2006).
2. S. K. Teh, W. Zheng, K. Y. Ho, M. Teh, K. G. Yeoh, and Z. Huang, Br. J.Cancer 98, 457 (2008).
3. R. A. B. H. S. Martinho, C. J. Tierra-Criollo, L. N. Z. Ramalho, M. M.Netto, and A. A. Martin, J. Biomed. Opt. 11, 5 (2006).
4. K. Nithipatikom, M. J. McCoy, S. R. Hawi, K. Nakamoto, F. Adar, and W.B. Campel, Anal. Biochem. 322, 198 (2003).
5. C. Krafft, T. Knetschke, A. Siegner, R. H. W. Funk, and R. Salzer, Vib.Spectrosc. 32, 75 (2003).
6. J. Sebag, S. Nie, K. Reiser, and N.-T. Yu, Proc. SPIE-Int. Soc. Opt. Eng.1877, 284 (1993).
7. S. Kaminaka, T. Ito, H. Yamazaki, E. Kohoda, and H. Hamaguchi, J.Raman Spectrosc. 33, 498 (2002).
8. U. Utzinger, D. L. Heintzelman, A. Mahadevan-Jansen, A. Malpica, M.Follen, and R. Richards-Kortum, Appl. Spectrosc. 55, 955 (2001).
9. N. Kuhnert and A. Thumser, J. Labelled Compounds Radiopharm. 47, 493(2004).
10. J. Duarte, M. T. T. Pacheco, R. Z. Machado, L. Silveira, R. A. Zangaro,and A. B. Villaverde, Cell. Mol. Biol. 48, 585 (2002).
11. D. Rohleder, W. Kiefer, and W. Petrich, Analyst (Cambridge, U.K.) 129,906 (2004).
12. C. Yu, E. Gestl, K. Eckert, D. Allara, and J. Irudayaraj, Cancer Detect.Prevent. 30, 515 (2006).
13. N. J. Kline and P. J. Treado, J. Raman Spectrosc. 28, 119 (1997).14. H.-P. Chiang, R. Song, B. Mou, K. P. Li, P. Chiang, D. Wang, W. S. Tse,
and L. T. Ho, J. Raman Spectrosc. 30, 551 (1999).15. N. Amharref, A. Beljebbar, S. Dukic, L. Venteo, L. Schneider, M. Pluot,
and M. Manfait, Biochim. Biophys. Acta 1768, 2605 (2007).16. L. Silveira, S. Sathaiah, R. A. Zangaro, M. T. Pacheco, M. C. Chavantes,
and C. A. Pasqualucci, Lasers Surg. Med. 30, 290 (2002).17. K. Maquelin, L.-P. Choo-Smith, T. van Vreeswijk, H. Endtz, B. Smith, R.
Bennett, H. A. Bruining, and G. J. Puppels, Anal. Chem. 72, 12 (2000).18. D. J. Jeanmaire and R. P. Van Duyne, J. Electroanal. Chem. 84, 1 (1977).19. M. Fleischmann, P. J. Hendra, and A. J. McQuillan, Chem. Phys. Lett. 26,
163 (1974).20. M. G. Albrecht and J. A. Creighton, J. Am. Chem. Soc. 99, 5215 (1977).21. K. Kneipp, H. Kneipp, G. Deinum, I. Itzkan, R. R. Dasari, and M. S. Feld,
Appl. Spectrosc. 52, 175 (1998).22. S. Nie and S. R. Emory, Science (Washington, D.C.) 275, 1102 (1997).23. K. Kneipp, A. S. Haka, H. Kneipp, K. Badizadegan, N. Yoshizawa, C.
Boone, K. E. Shafer-Peltier, J. T. Motz, R. R. Dasari, and M. S. Feld, Appl.Spectrosc. 56, 150 (2002).
24. M. B. Wabuyele, F. Yan, G. D. Griffin, and T. Vo-Dinh, Rev. Sci. Instrum.76, 1 (2005).
25. H. Li and B. M. Cullum, Proc. SPIE-Int. Soc. Opt. Eng. 5261, 142 (2004).26. M. H. Chowdhury, V. A. Gant, A. Trache, A. Baldwin, G. A. Meininger,
and G. L. Cote, J. Biomed. Opt. 11, 024004 (2006).27. H. Li, C. E. Baum, and B. M. Cullum, Proc. SPIE-Int. Soc. Opt. Eng. 6007,
1 (2005).28. Y. C. Cao, R. Jin, and C. A. Mirkin, Science (Washington, D.C.) 297, 1536
(2002).29. M. Kahraman, M. M. Yazıcı, F. Sahin, and M. Culha, Langmuir 24, 894
(2008).30. M. Kahraman, M. M. Yazici, F. Sahin, O. F. Bayrak, and M. Culha, Appl.
Spectrosc. 61, 479 (2007).31. M. Culha, Ahmet Adiguzel, M. M. Yazici, M. M. Kahraman, F. Sahin, and
M. Gulluce, Appl. Spectrosc. 62, 1226 (2008).32. S. C. Pinzaru, L. M. Andronie, I. Domsa, O. Cozar, and S. Astilean, J.
Raman Spectrosc. 39, 331 (2008).33. P. C. Lee and D. Meisel, J. Phys. Chem. 88, 3391 (1982).34. A. Stevens and J. Lowe, Human Histology (Elsevier Mosby, New York,
2005), 3rd ed.35. L. C. Junqueira and J. Carneiro, Basic Histology Text and Atlas (Lange
Medical Books McGraw-Hill, New York, 2003), 10th ed.36. A. Vander, J. Sherman, and D. Luciano, Human Physiology: The
Mechanism of Body Function (McGraw-Hill, New York, 2001), 8th ed.37. G. Shetty, C. Kedall, N. Shepherd, N. Stone, and H. Barr, Br. J. Cancer 94,
1460 (2006).38. S. Farguharson, C. Shende, F. E. Inscore, P. Maksymiuk, and A. Gift, J.
Raman Spectrosc. 36, 208 (2005).39. J. W. Chan, D. S. Taylor, T. Zwerdling, S. T. Lane, K. Ihara, and T. Huser,
Biophys. J. 90, 648 (2006).40. A. J. Ruiz-Chica, M. A. Medina, F. Sanchez-Jimenez, and F. J. Ramirez, J.
Raman Spectrosc. 35, 93 (2004).41. C. Krafft, L. Neudert, T. Simat, and R. Salzer, Spectrochim. Acta, Part A
61, 1529 (2005).42. E. Kateinen, M. Elomaa, U.-M. Laakkonen, E. Sippola, P. Niemela, J.
Suhonen, and K. Jarninen, J. Forensic Sci. 52, 88 (2007).43. J. W. Chan, D. S. Taylor, T. Zwerdling, S. T. Lane, K. Ihara, and T. Huser,
Biophys. J. 90, 648 (2006).44. W.-T. Cheng, M.-T. Liu, H.-N. Liu, and S.-Y. Lin, Microsc. Res. Tech. 68,
75 (2005).45. D. Naumann, Proc. SPIE-Int. Soc. Opt. Eng. 3257, 245 (1998).46. S. Kaminaka, H. Yamazaki, T. Ito, E. Kohoda, and H. Hamaguchi, J.
Raman Spectrosc. 32, 139 (2001).47. I. Notingher, C. Green, and C. Dyer, J. Roy. Soc. Interface 1, 79 (2004).48. E. O. Faolain, M. B. Hunter, J. M. Byrne, P. Kelehan, M. McNamer, H. J.
Byrne, and F. M. Lyng, Vib. Spectrosc. 38, 121 (2005).49. R. K. Dukor, Biomed. Appl. 5, 3335 (2002).50. N. Stone, C. Kendall, J. Smith, P. Crow, and H. Barr, Faraday Discuss.
126, 141 (2004).51. R. J. Lakshimi, V. B. Kartha, C. M. Krishna, J. G. R. Solomon, G. Ullas,
and P. U. Devi, Radiat. Res. 157, 175 (2002).52. M. Gniadecka, H. C. Wulf, N. N. Mortensen, O. F. Nielsen, and D. H.
Christensen, J. Raman Spectrosc. 28, 125 (1997).53. J. Binoy, J. P. Abraham, I. H. Joe, V. S. Jayakumar, G. R. Petit, and O. F.
Nielsen, J. Raman Spectrosc. 35, 939 (2004).54. L. Seballos, J. Z. Zhang, and R. Sutphen, Anal. Bioanal. Chem. 383, 763
(2005).55. S. M. Ronen, A. Stier, and H. Degani, FEBS Lett. 266, 147 (1990).56. Z. Huang, H. Lui, D. I. McLean, M. Korbelik, and H. Zeng, Photochem.
Photobiol. 81, 1219 (2005).57. D. P. Lau, Z. Huang, H. Lui, D. W. Anderson, K. Beren, M. D. Morrison,
L. Shen, and H. Zeng, Lasers Surg. Med. 37, 192 (2005).58. D. P. Lau, Z. Huang, H. Lui, C. S. Man, K. Berean, M. D. Morrison, and
H. Zeng, Lasers Surg. Med. 32, 210 (2003).59. C. J. Frank, R. L. McCreecy, and D. C. B. Redd, Anal. Chem. 67, 777