SURFACE FINISH INSPECTION OF WOOD USING 3D PROFILOMETRY
Prepared by Duanjie Li & Craig Leising
2
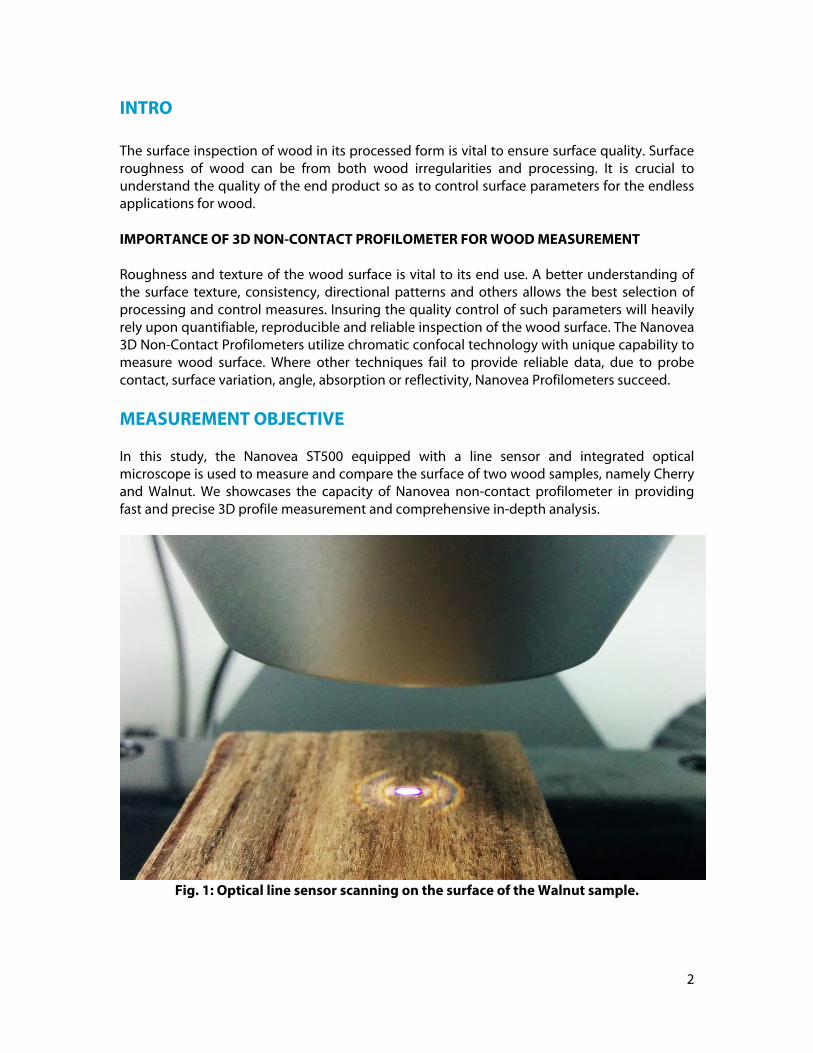
INTRO The surface inspection of wood in its processed form is vital to ensure surface quality. Surface roughness of wood can be from both wood irregularities and processing. It is crucial to understand the quality of the end product so as to control surface parameters for the endless applications for wood. IMPORTANCE OF 3D NON-CONTACT PROFILOMETER FOR WOOD MEASUREMENT Roughness and texture of the wood surface is vital to its end use. A better understanding of the surface texture, consistency, directional patterns and others allows the best selection of processing and control measures. Insuring the quality control of such parameters will heavily rely upon quantifiable, reproducible and reliable inspection of the wood surface. The Nanovea 3D Non-Contact Profilometers utilize chromatic confocal technology with unique capability to measure wood surface. Where other techniques fail to provide reliable data, due to probe contact, surface variation, angle, absorption or reflectivity, Nanovea Profilometers succeed. MEASUREMENT OBJECTIVE In this study, the Nanovea ST500 equipped with a line sensor and integrated optical microscope is used to measure and compare the surface of two wood samples, namely Cherry and Walnut. We showcases the capacity of Nanovea non-contact profilometer in providing fast and precise 3D profile measurement and comprehensive in-depth analysis.
Fig. 1: Optical line sensor scanning on the surface of the Walnut sample.
3
RESULTS AND DISCUSSION Wear track analysis of the Cherry sample Here an array of 4 × 4 images is automatically stitched, as shown in Fig. 2a, to allow for a largermicroscopic observation of the wear track area. An area of interest can then be quickly chosen for 3D scan. The 3D scan here is using the optical line sensor that generates a bright line of 192 points, as shown in Fig. 1. These 192 points scan the sample surface at the same time, leading to significantly increased scan speed. Fig. 2b and c shows the optical image and the surface topography at the area selected for 3D scan. (a)
(b) (c)
Fig. 2: Overlay of the surface topography with the optical image.
4
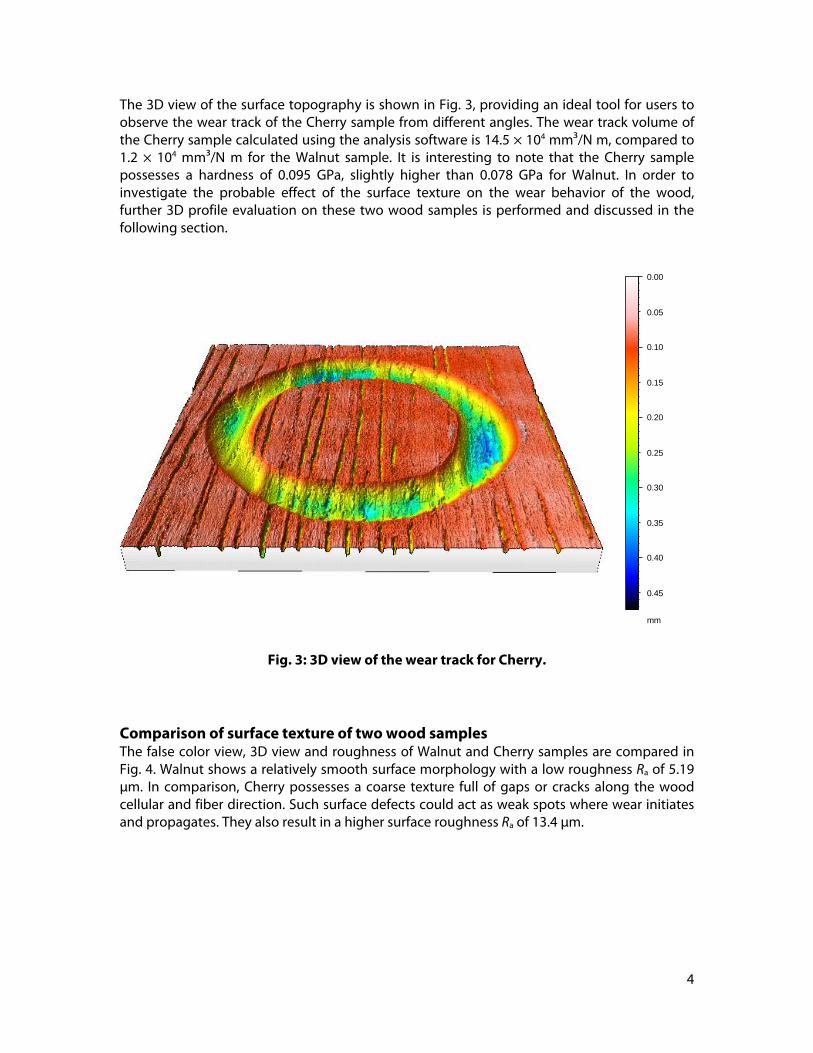
The 3D view of the surface topography is shown in Fig. 3, providing an ideal tool for users to observe the wear track of the Cherry sample from different angles. The wear track volume of the Cherry sample calculated using the analysis software is 14.5 × 104 mm3/N m, compared to 1.2 × 104 mm3/N m for the Walnut sample. It is interesting to note that the Cherry sample possesses a hardness of 0.095 GPa, slightly higher than 0.078 GPa for Walnut. In order to investigate the probable effect of the surface texture on the wear behavior of the wood, further 3D profile evaluation on these two wood samples is performed and discussed in the following section.
mm
0.00
0.05
0.10
0.15
0.20
0.25
0.30
0.35
0.40
0.45
Fig. 3: 3D view of the wear track for Cherry. Comparison of surface texture of two wood samples The false color view, 3D view and roughness of Walnut and Cherry samples are compared in Fig. 4. Walnut shows a relatively smooth surface morphology with a low roughness Ra of 5.19 μm. In comparison, Cherry possesses a coarse texture full of gaps or cracks along the wood cellular and fiber direction. Such surface defects could act as weak spots where wear initiates and propagates. They also result in a higher surface roughness Ra of 13.4 μm.
5
Walnut: Cherry:
Further Furrow analysis is performed on the cracks parallel to the wood cellular and fiber direction of the Cherry sample as displayed in Fig. 5. The mean depth and density of the cracks are 108 μm and 8.57 cm/cm2, respectively.
Fig. 4: False color view, 3D view and roughness of Walnut and Cherry samples.
6
More detailed information of the shape and depth of the cracks can be obtained by extracting 2D profiles from the 3D scan as shown in Fig. 6. In addition, from this extraction, crack volume, Roughness and many others can be automatically calculated.
Fig. 6: 2D profile analysis of the surface of Cherry.
Fig. 5: Furrow analysis of the Cherry sample.
7
CONCLUSION
In this application, we have shown how the Nanovea ST500 3D Non-Contact Profilometer equipped with an optical line sensor and an integrated optical microscope can be used to analyze the surface feature of wood samples in an effective and efficient manner.
The optical line sensor generates a bright line of 192 points that scans the sample surface at the same time, leading to significantly increased scan speed. The automatic microscope image array enables better observation of a larger surface under the microscope. Then select an area of interest for 3D scan, which also substantially reduce the time on 3D surface measurement.
The data shown here represents only a portion of the calculations available in the analysis software. Nanovea Profilometers measure virtually any surface in fields including Semiconductor, Microelectronics, Solar, Fiber Optics, Automotive, Aerospace, Metallurgy, Machining, Coatings, Pharmaceutical, Biomedical, Environmental and many others.
Learn more about the Nanovea Profilometer or Lab Services
The Chromatic Confocal technique uses a white light source, where light passes through an objective lens with a high degree of chromatic aberration. The refractive index of the objective lens will vary in relation to the wavelength of the light. In effect, each separate wavelength of the incident white light will re-focus at a different distance from the lens (different height). When the measured sample is within the range of possible heights, a single monochromatic point will be focalized to form the image. Due to the confocal configuration of the system, only the focused wavelength will pass through the spatial filter with high efficiency, thus causing all other wavelengths to be out of focus. The spectral analysis is done using a diffraction grating. This technique deviates each wavelength at a different position, intercepting a line of CCD, which in turn indicates the position of the maximum intensity and allows direct correspondence to the Z height position.
Unlike the errors caused by probe contact or the manipulative Interferometry technique, Chromatic Confocal technology measures height directly from the detection of the wavelength that hits the surface of the sample in focus. It is a direct measurement with no mathematical software manipulation. This provides unmatched accuracy on the surface measured because a data point is either measured accurately without software interpretation or not at all. The software completes the unmeasured point but the user is fully aware of it and can have confidence that there are no hidden artifacts created by software guessing.
Nanovea optical pens have zero influence from sample reflectivity or absorption. Variations require no sample preparation and have advanced ability to measure high surface angles. Capable of large Z measurement ranges. Measure any material: transparent or opaque, specular or diffusive, polished or rough. Measurement includes: Profile Dimension, Roughness Finish Texture, Shape Form Topography, Flatness Warpage Planarity, Volume Area, Step-Height Depth Thickness and many others.