Page 1
SURFACE WATER &
HYDROLOGICAL ASSESSMENT
REPORT
10MVA 132/11KV OLIFANTSHOEK
SUBSTATION
August 2017
Prepared by:
Gerhard Botha (Pri Sci Nat: Ecology & Botany)
PO Box 12500, Brandhof, 9324
Cell: 084 2073454
Email: [email protected]
Prepared for:
Savannah Environmental (Pty) Ltd
1st Floor, Block 2, 5 Woodlands Drive
Office Park
Cnr Woodlands Drive & Western Service Road
Woodmead
Page 2
10MVA 132/11KV OLIFANTSHOEK SUBSTATIONSurface Water & Hydrological Impact Assessment Report August 2017
Surface Water & Hydrological Impact Assessment Page i
TABLE OF CONTENTS
Declaration of Consultant’s Independence .................................................... iii
1 Introduction ........................................................................................1
1.1 Applicant ......................................................................................1
1.2 Project..........................................................................................1
1.3 Proposed Activity ...........................................................................1
1.4 Location........................................................................................2
1.5 Terms of reference.........................................................................2
Figure 1: Layout of the power line and substation alternatives.............4
1.6 General assumptions and limitations ................................................5
1.6.1 General assumptions ......................................................................5
1.6.2 Limitations ....................................................................................5
1.7 Conditions of this report .................................................................6
2 waterbody delineation & classification.....................................................6
3 Description of the Study area ................................................................7
3.1 Climate and rainfall ........................................................................7
3.2 Physiography and soils ...................................................................8
3.3 Existing Land Use......................................................................... 21
4 Results ............................................................................................. 21
4.1 Wetland classification, delineation and description............................ 21
4.1.1 Olifantsloop Non-Perennial Watercourse & Riparian Fringe................. 21
4.2 Site Photos.................................................................................. 24
4.3 Surface Water & Hydrological Sensitivity Analysis ............................ 27
4.3.1 Olifantsloop Non-Perennial Watercourse & Riparian Fringe................. 27
5 Impact Assessment ............................................................................ 29
Cumulative Impacts ............................................................................ 33
5.1 Preferred VS. Alternative Options................................................... 34
6 Assessment of Hydrological impacts (risk assessment) ........................... 36
6.1 Risk Assessment according to DWA Risk Matrix for General Authorisation
36
7 Discussion and Conclusion................................................................... 40
8 References ........................................................................................ 43
Page 3
10MVA 132/11KV OLIFANTSHOEK SUBSTATIONSurface Water & Hydrological Impact Assessment Report August 2017
Surface Water & Hydrological Impact Assessment Page ii
9 Appendices: ...................................................................................... 45
Appendix 1. Survey methods ................................................................. 45
Appendix 2. Assessment of Impacts ....................................................... 58
Appendix 3. Ecological Risk Assessment.................................................. 59
FIGURES
Figure 1: Layout of the power line and substation alternatives.
................................................................................................................. 4
Figure 2: Climate graph of Olifantshoek/Kathu region..................................... 8
Figure 3: Climate table of Olifantshoek/Kathu region...................................... 8
Figure 4: Elevation profile (Google) of the substation option (preferred option on
top and alternative option below). ................................................. 10
Figure 5: Conceptual west-east hydrological cross-section of the study area. .. 14
Figure 6: Lithostratigraphy of the Olifantshoek Supergroup.. ......................... 15
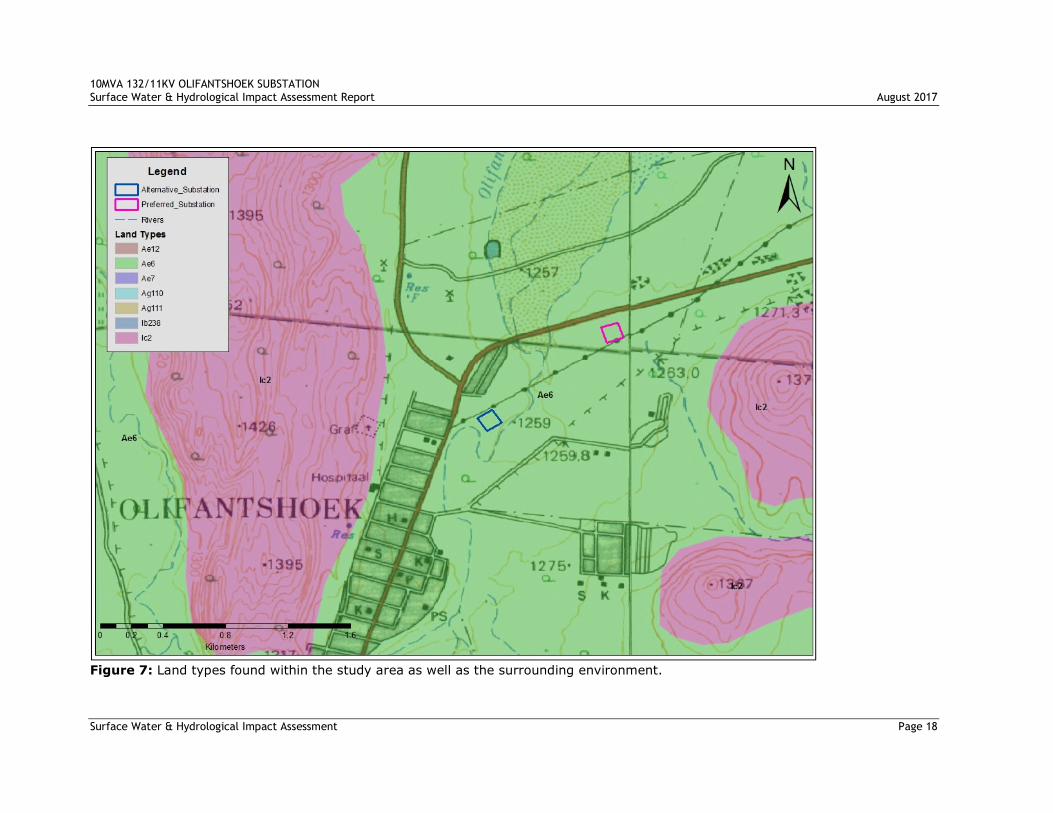
Figure 7: Land types found within the study area as well as the surrounding
environment. .............................................................................. 18
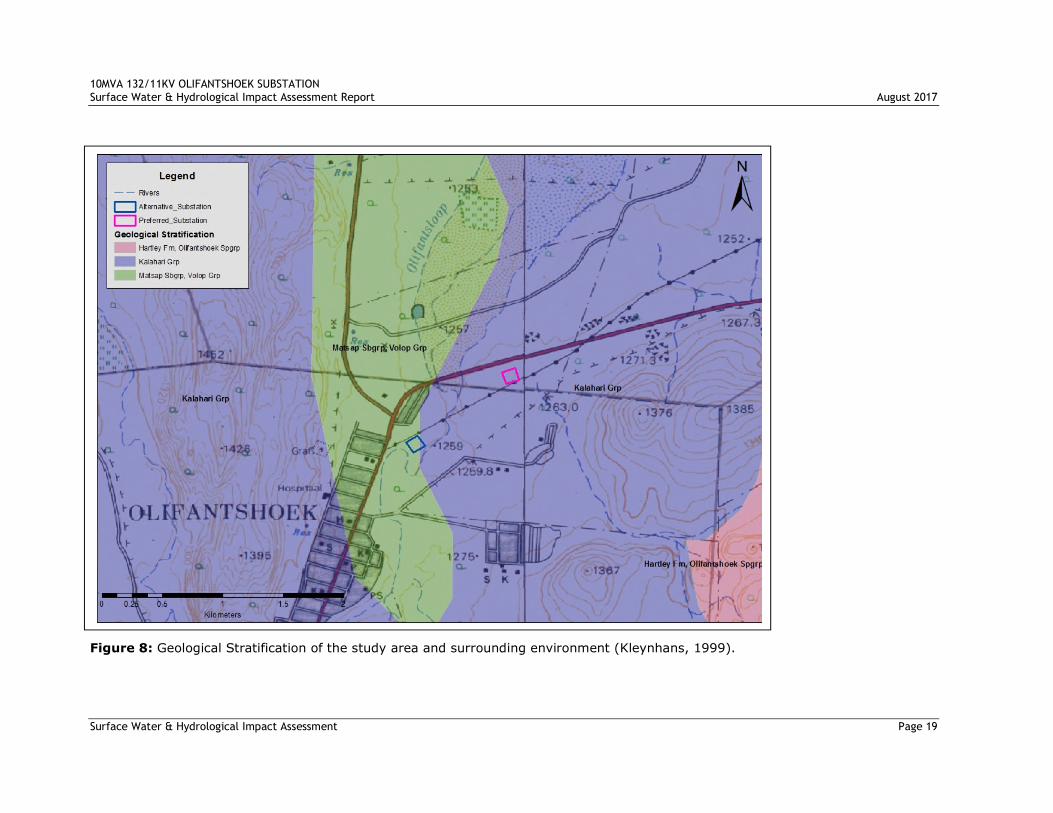
Figure 8: Geological Stratification of the study area and surrounding environment.
................................................................................................. 19
Figure 9: NFEPA wetlands and streams within the study area as well as the
surrounding environment. ............................................................ 20
Figure 10: Upper portion of the Olifantsloop non-perennial watercourse and
associated riparian fringe. ............................................................ 26
Figure 11: Surface Water & Hydrological Sensitivity Map compiled for the study
area........................................................................................... 28
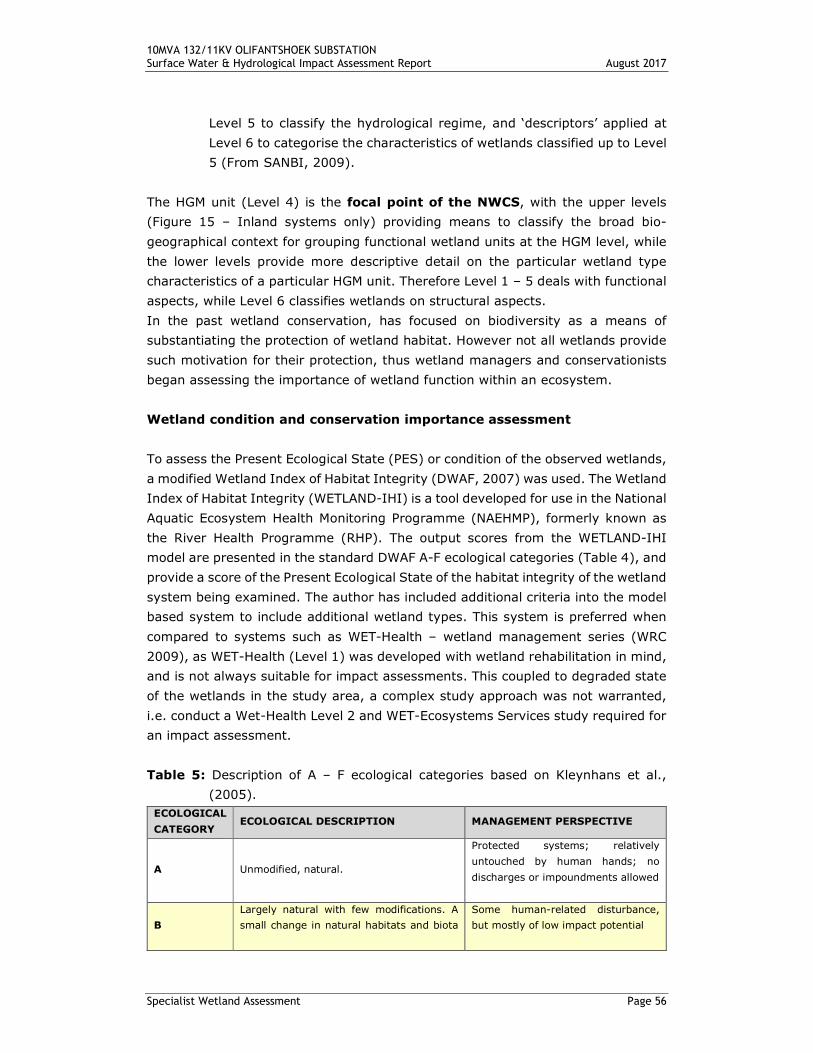
Figure 12: Basic structure of the National Wetland Classification System. ....... 55
Page 4
10MVA 132/11KV OLIFANTSHOEK SUBSTATIONSurface Water & Hydrological Impact Assessment Report August 2017
Surface Water & Hydrological Impact Assessment Page iii
DECLARATION OF CONSULTANT’S INDEPENDENCE
I, Gerhard Botha, as the appointed specialist hereby declare that I:
» act/ed as the independent specialist in this application;
» regard the information contained in this report as it relates to my specialist
input/study to be true and correct, and
» do not have and will not have any financial interest in the undertaking of
the activity, other than remuneration for work performed in terms of the
NEMA, the Environmental Impact Assessment Regulations, 2014 and any
specific environmental management Act;
» will not have any vested interest in the proposed activity proceeding;
» have disclosed, to the applicant, EAP and competent authority, any material
information that have or may have the potential to influence the decision of
the competent authority or the objectivity of any report, plan or document
required in terms of the NEMA, the Environmental Impact Assessment
Regulations, 2014 and any specific environmental management Act;
» am fully aware of and meet the responsibilities in terms of NEMA, the
Environmental Impact Assessment Regulations, 2014 (specifically in terms
of regulation 13 of GN No. R. 543) and any specific environmental
management Act, and that failure to comply with these requirements may
constitute and result in disqualification;
» have provided the competent authority with access to all information at my
disposal regarding the application, whether such information is favourable
to the applicant or not; and
» am aware that a false declaration is an offence in terms of regulation 48 of
GN No. R. 982.
Gerhard Botha Pr.Sci.Nat 400502/14 (Botanical and Ecological Science)
August 2017
Page 5
10MVA 132/11KV OLIFANTSHOEK SUBSTATIONSurface Water & Hydrological Impact Assessment Report August 2017
Surface Water & Hydrological Impact Assessment Page 1
1 INTRODUCTION
1.1 Applicant
Eskom Holdings SoC Limited.
1.2 Project
The project will be referred to as the 10MVA 132/11kV Olifantshoek 10MVA
132/11kV substation.
1.3 Proposed Activity
The Olifantshoek Substation will be comprised of the following:
» A new 10MVA on-site substation (100m X 100m) to be constructed in close
proximity to the existing 22/11kV Olifantshoek substation.
» The decommissioning of the existing 22/11kV Olifantshoek Substation.
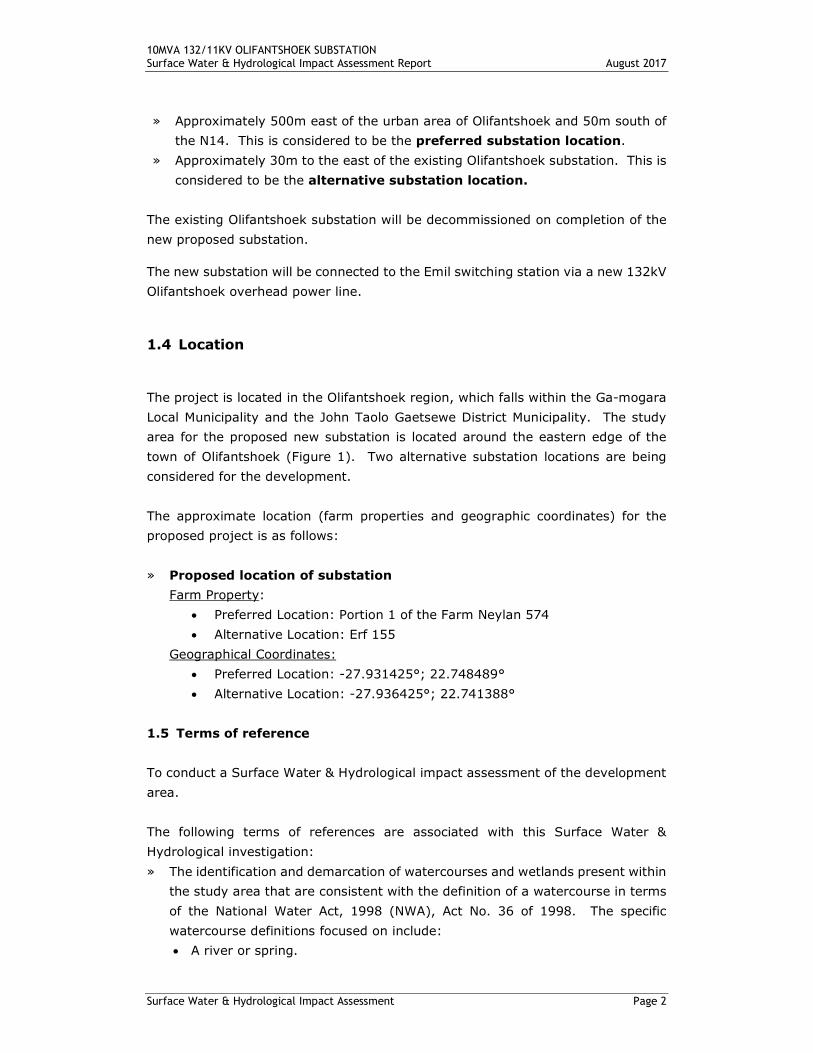
The proposed substation will have a footprint of approximately of 100m x 100m.
The footprint of the substation may include a metering station, control building,
admin building, workshop and associated infrastructure. The table below provides
an overview of the technical details of the substation components to be
constructed:
Table 1: Summary of components associated with the proposed substation.
Project Component Specification
Mega Volt Ampere 10
Size of the substation 71m x 49m within a footprint of 100m x 100m
Distance between equipment 9m
Footprint of the development 100m x 100m
Number of transformers One 10 MVA transformer
Two alternative locations have been identified for the proposed substation,
including;
Page 6
10MVA 132/11KV OLIFANTSHOEK SUBSTATIONSurface Water & Hydrological Impact Assessment Report August 2017
Surface Water & Hydrological Impact Assessment Page 2
» Approximately 500m east of the urban area of Olifantshoek and 50m south of
the N14. This is considered to be the preferred substation location.
» Approximately 30m to the east of the existing Olifantshoek substation. This is
considered to be the alternative substation location.
The existing Olifantshoek substation will be decommissioned on completion of the
new proposed substation.
The new substation will be connected to the Emil switching station via a new 132kV
Olifantshoek overhead power line.
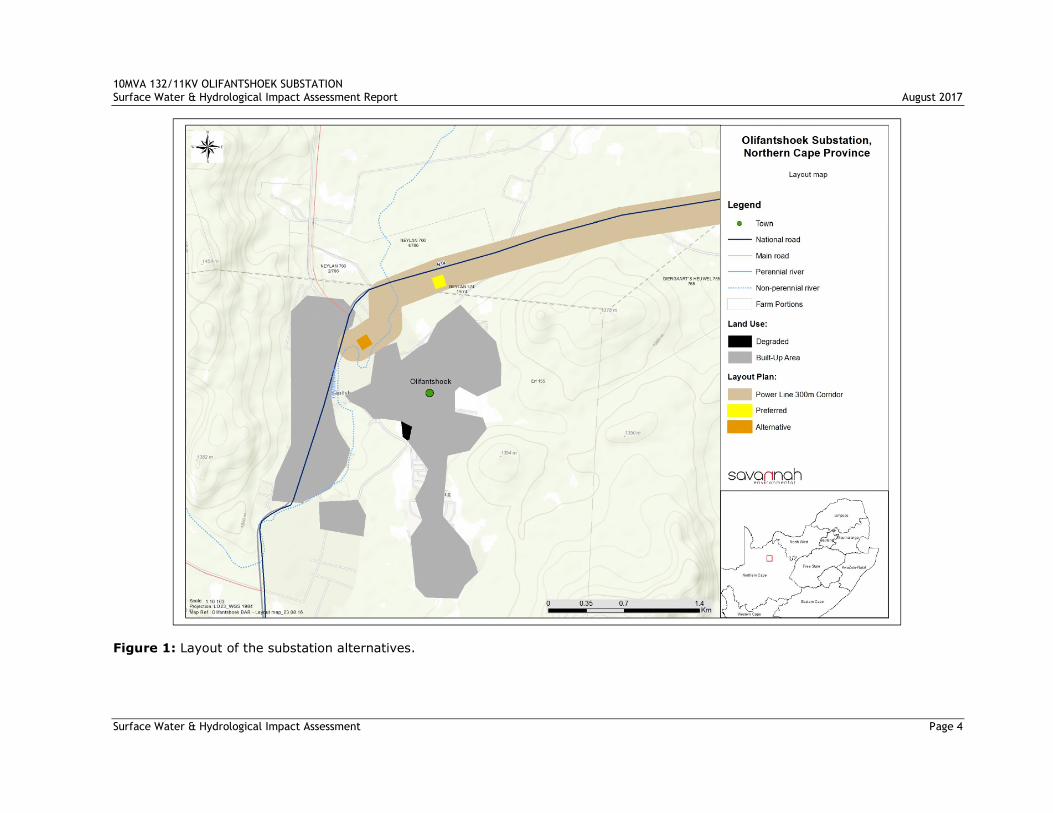
1.4 Location
The project is located in the Olifantshoek region, which falls within the Ga-mogara
Local Municipality and the John Taolo Gaetsewe District Municipality. The study
area for the proposed new substation is located around the eastern edge of the
town of Olifantshoek (Figure 1). Two alternative substation locations are being
considered for the development.
The approximate location (farm properties and geographic coordinates) for the
proposed project is as follows:
» Proposed location of substation
Farm Property:
• Preferred Location: Portion 1 of the Farm Neylan 574
• Alternative Location: Erf 155
Geographical Coordinates:
• Preferred Location: -27.931425°; 22.748489°
• Alternative Location: -27.936425°; 22.741388°
1.5 Terms of reference
To conduct a Surface Water & Hydrological impact assessment of the development
area.
The following terms of references are associated with this Surface Water &
Hydrological investigation:
» The identification and demarcation of watercourses and wetlands present within
the study area that are consistent with the definition of a watercourse in terms
of the National Water Act, 1998 (NWA), Act No. 36 of 1998. The specific
watercourse definitions focused on include:
• A river or spring.
Page 7
10MVA 132/11KV OLIFANTSHOEK SUBSTATIONSurface Water & Hydrological Impact Assessment Report August 2017
Surface Water & Hydrological Impact Assessment Page 3
• A natural channel in which water flows regularly or intermittently.
• A wetland, lake or dam into which, or from which water flows.
Page 8
10MVA 132/11KV OLIFANTSHOEK SUBSTATIONSurface Water & Hydrological Impact Assessment Report August 2017
Surface Water & Hydrological Impact Assessment Page 4
Figure 1: Layout of the substation alternatives.
Page 9
10MVA 132/11KV OLIFANTSHOEK SUBSTATIONSurface Water & Hydrological Impact Assessment Report August 2017
Surface Water & Hydrological Impact Assessment Page 5
1.6 General assumptions and limitations
1.6.1 General assumptions
» This study assumes that the project proponent will always strive to avoid,
mitigate and/or offset potentially negative project related impacts on the
environment, with impact avoidance being considered the most successful
approach, followed by mitigation and offset. It is further assumed that the
project proponent will seek to enhance potential positive impacts on the
environment.
» GIS spatial datasets used as part of the field surveys (site demarcation) and
analyses are accurate.
» The project proponent will commission an additional study to assess the
impact(s) if there is a change in the size, location and/or extent of the study
area that is likely to have a potentially highly significant and/ or unavoidable
impact on the natural environment
1.6.2 Limitations
The following refers to general limitations that affect the applicability of information
represented within this report (also refer to the conditions of the Report):
» This report specifically focuses on the identification, delineation, and
classification of the various hydrological features characterising the study area.
» Accuracy of the maps, routes and desktop assessments is based on the current
1:50 000 topographical map series of South Africa;
» Accuracy of Global Positioning System (GPS) coordinates was limited to 8m
accuracy in the field.
» A single survey limited the amount of flora identified at the site;
» While every care is taken to ensure that the data presented are qualitatively
adequate, inevitably conditions are never such that that is possible. The nature
of the vegetation, seasonality, human intervention etc. limits the veracity of the
material presented.
» Hydrological assessments are based on a selection of available techniques that
have been developed through the Department of Water and Sanitation (DWS)
as well as the Water Research Council (WRC) based on site conditions and
applicability. These techniques are however largely qualitative in nature with
associated limitations due to the range of interdisciplinary aspects that have to
be taken into consideration.
» Most of the wetland and watercourse systems located within the study area
form part of larger systems expanding well beyond the focus area. Although
their extent and down- / upstream nature and functions were taken into
Page 10
10MVA 132/11KV OLIFANTSHOEK SUBSTATIONSurface Water & Hydrological Impact Assessment Report August 2017
Surface Water & Hydrological Impact Assessment Page 6
account, the focus of the study was restricted to the affected farm properties
and the immediate surrounding landscape.
» This specific study area is affected by a variety of disturbances (historic and
active) which restricts the use of available wetland indicators such as
hydrophytic vegetation or soil indicators. Hence, a wide range of available
indicators including historic aerial photographs are considered to help determine
boundaries as accurately as possible.
1.7 Conditions of this report
Findings, recommendations and conclusions provided in this report are based on
the authors’ best scientific and professional knowledge and information available at
the time of compilation. No form of this report may be amended or extended
without the prior written consent of the author. Any recommendations, statements
or conclusions drawn from or based on this report must clearly cite or make
reference to this report. Whenever such recommendations, statements or
conclusions form part of a main report relating to the current investigation, this
report must be included in its entirety.
2 WATERBODY DELINEATION & CLASSIFICATION
The water body delineation and classification was conducted using the standards
and guidelines produced by the DWA (DWAF, 2005 & 2007) and the South African
National Biodiversity Institute (SANBI, 2009). These methods are contained in the
attached Appendix 1, which also includes wetland definitions, wetland conservation
importance and Present Ecological State (PES) assessment methods used in this
report.
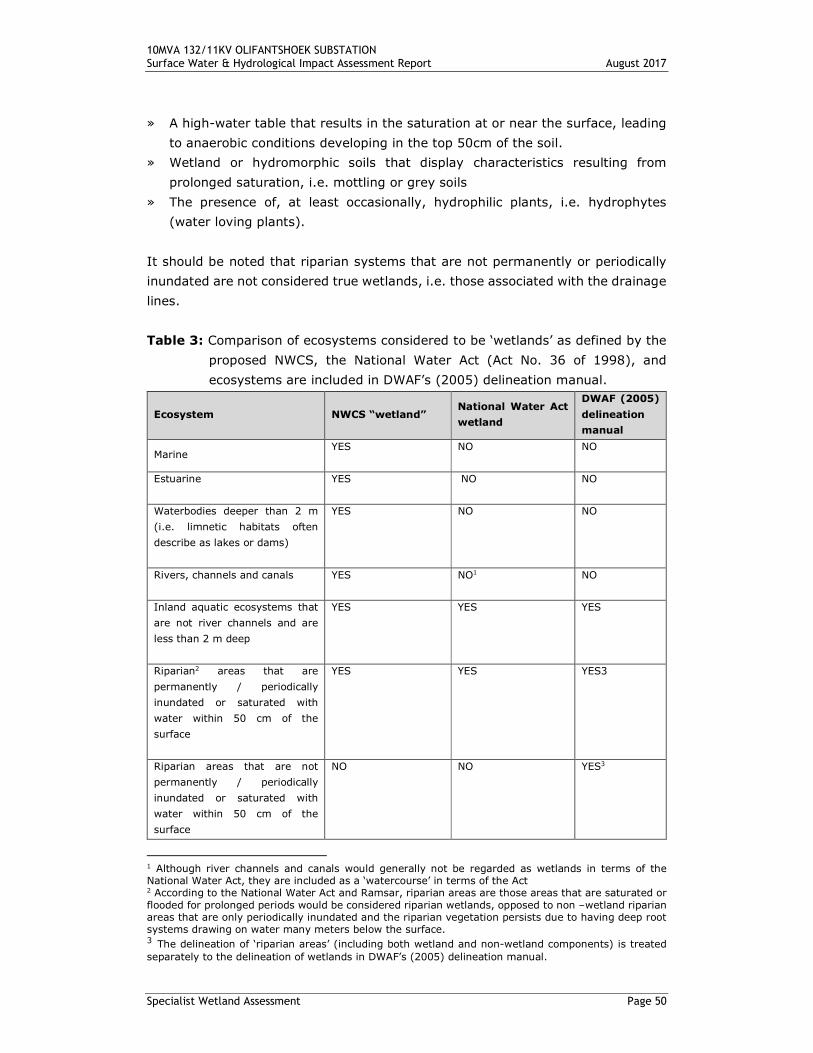
For reference the following definitions are applicable:
» Drainage line: A drainage line is a lower category or order of watercourse that
does not have a clearly defined bed or bank. It carries water only during or
immediately after periods of heavy rainfall i.e. non-perennial, and riparian
vegetation may not be present.
» Perennial and non-perennial: Perennial systems contain flow or standing
water for all or a large proportion of any given year, while non-perennial
systems are episodic or ephemeral and therefore contain flows for short periods,
such as a few hours or days in the case of drainage lines.
» Riparian: The area of land adjacent to a stream or river that is influenced by
stream-induced or related processes. Riparian areas which are saturated or
flooded for prolonged periods would be considered as wetlands and could be
described as riparian wetlands. However, some riparian areas are not wetlands
Page 11
10MVA 132/11KV OLIFANTSHOEK SUBSTATIONSurface Water & Hydrological Impact Assessment Report August 2017
Surface Water & Hydrological Impact Assessment Page 7
(e.g. an area where alluvium is periodically deposited by a stream during floods
but which is well drained).
» Wetland: Land which is transitional between terrestrial and aquatic systems
where the water table is usually at or near the surface, or the land is periodically
covered with shallow water, and which under normal circumstances supports or
would support vegetation typically adapted to life in saturated soil (Water Act
36 of 1998); land where an excess of water is the dominant factor determining
the nature of the soil development and the types of plants and animals living at
the soil surface (Cowardin et al., 1979).
» Watercourse: as per the National Water Act means -
(a) a river or spring;
(b) a natural channel in which water flows regularly or intermittently;
(c) a wetland, lake or dam into which, or from which, water flows; and
(d) any collection of water which the Minister may, by notice in the Gazette,
declare to be a watercourse, and a reference to a watercourse includes,
where relevant, its bed and banks
3 DESCRIPTION OF THE STUDY AREA
3.1 Climate and rainfall
The Olifantshoek/Kathu area is characterised by an arid summer rainfall climate
with an average annual temperature of 18.6°C and an average rainfall of 395mm
falling predominantly in late summer (highest in March: 74mm). The driest month
is July with only 3mm of precipitation. With an average temperature of 25.3°C,
January is the warmest month, whilst July is the coldest month with an average of
10.8°C (https://en.climate-data.org/location/27075/).
Page 12
10MVA 132/11KV OLIFANTSHOEK SUBSTATIONSurface Water & Hydrological Impact Assessment Report August 2017
Surface Water & Hydrological Impact Assessment Page 8
Figure 2: Climate graph of the Olifantshoek/Kathu region (https://en.climate-
data.org/location/27075/).
Figure 3: Climate table of the Olifantshoek/Kathu region (https://en.climate-
data.org/location/27075/).
3.2 Physiography and soils
Landscape Features
According to Mucina and Rutherford (2006) the region can be described as a largely
flat (to very slightly undulating) sandy plain usually covered with open tree and
shrub layers, for example, Acacia luederitzii, Boscia albitrunca and Rhus tenuinervis
and with a usually sparse grass layer.
According to AGIS, 2007 the bulk of the affected landscape is classified as A2 terrain
type (>80% has a slope less than 8% with a local relief of 30 – 90m) and is situated
Page 13
10MVA 132/11KV OLIFANTSHOEK SUBSTATIONSurface Water & Hydrological Impact Assessment Report August 2017
Surface Water & Hydrological Impact Assessment Page 9
within a footlsope/valley bottom landscape setting with a straight slope shape (Z).
Percentage slope is generally between 0 and 2%.
At a finer scale using a Google elevation profile for the study area and immediate
surroundings the area can be described as a largely flat (to very slightly undulating)
sandy plain. According to site geomorphology and slope direction, the study area
and surrounding landscape can be described as follows:
» The typographical position of the greater area is regarded as a footslope region,
largely sloping in a south to north direction. To the west the Langeberg
Mountains stretch in narrow south to north band. The southern portion is
situated between a maximum elevation of 1281m and 1222m with the highest
portion being the section crossing the andesitic lava outcroppings of Harley Hill.
The average slope is between 1.6 and 2% with a maximum slope of 11%. The
undulating nature can be attributed to the moderate to steep dipping Quartzite
footslopes of the Langeberg Mountains to the west as well the hills and
outcroppings located to the south (including the slopes of Harley Hill), the
upper slopes of Harvey Hill as well as the Olifantsloop River with its moderately
deep (eroded) active channels and associated riparian fringe. The site for the
proposed alternative substation is situated just west (~45m) of this channel
with the riparian fringe at an elevation between 1264m and 1261m and slightly
sloping in a south-eastern and eastern direction (avg slope: 0.9%; max slope:
1.9%). The preferred site for the substation is located within a flat portion of
landscape (elevation: 1265 - 1264; avg slope: 1.7% & max slope: 2.2%) and
more than 320m west of the riparian fringe.
Page 14
10MVA 132/11KV OLIFANTSHOEK SUBSTATIONSurface Water & Hydrological Impact Assessment Report August 2017
Surface Water & Hydrological Impact Assessment Page 10
Figure 4: Elevation profile (Google) of the substation option (preferred option on top and alternative option below).
Page 15
10MVA 132/11KV OLIFANTSHOEK SUBSTATIONSurface Water & Hydrological Impact Assessment Report August 2017
Surface Water & Hydrological Impact Assessment Page 11
Geology
Regional Geology
The basement consists of porphyritic granite. The Ventersdorp Super Group
overlies the porphyritic granite and consists of green andesitic lava with
amygdaloids in places, occurs in the north east and attains a geologically estimated
thickness of 60m. Griqualand West Super Group: At its base is the Vryburg
Formation consisting of arkose (occasionally mica rich) and quartzite and lies
unconformable on either the granite or the Ventersdorp Super Group rocks.
The Schmidsdrift Formation overlies the Vryburg Formation and forms the lowest
unit of the Campbell Group. It is divided into 3 members each being approximately
10m thick. The lowest member consists of alternating layers of oolitic and
stromatolitic dolomite with thin interbedded layers of shale and quartzite. The
shale becomes more prominent higher up in the succession with the result that the
middle member consists mainly of ferruginous shale with siltstone and interbedded
thin dolomite. The upper member consists mainly of calcitic dolomite with few
stromatolites and thin interbedded shale and siltstone.
The Ghaap Plateau Formation: Very similar to the Schmidsdrift Formation and there
is a gradational contact between the Ghaap Plateau Formation and the underlying
Schmidsdrift Formation and can only be distinguished where the quartzite is
present on the latter. A brown ferruginous jasper layer, up to 12m thick, separates
the lowest part of the formation from the overlying grey coarse-grained dolomite.
The upper part, contains lenses and breccia of chert and a prominent layer of chert
which tops the succession.
The Asbestos Hills Formation forms part of the Griquatown Group and lies
conformably on the Ghaap Plateau Formation. The formation is subdivided into the
Kuruman and Danielskuil Members. The uppermost chert of the Ghaap Plateau
Formation grades into banded iron stone of the Kuruman Member which varies in
thickness from 180 to 240m. It consists of a succession of thin alternating layers
of light coloured chert and jasper and dark-coloured ferruginous jaspilite. The
jaspilite contains mainly magnetite, haematite and limonite. The rock also contains
several crocidolite-bearing zones. The “blinkklip breccia”, a basal layer of banded
iron stone, lies on the Ghaap Plateau Formation in the Maremane Anticline. The
Danielskuil Member has an undulating structure and consists of brown jaspilite with
thin magnetite layers and lenticular breccia and chert nodules. The overlying
jaspilite attains a thickness of 150m and several marker layers.
The Gamagara Formation was deposited on the Maremane Anticline and rests
unconformable on dolomite and banded iron stone of the underlying formations. It
Page 16
10MVA 132/11KV OLIFANTSHOEK SUBSTATIONSurface Water & Hydrological Impact Assessment Report August 2017
Surface Water & Hydrological Impact Assessment Page 12
consists of a basal conglomerate with pebbles of jasper, ironstone, shale with lenses
of conglomerate, iron-rich flagstone and quartzite. The formation has a thickness
of 300m and when resting on banded ironstone are ferruginised and manganised
where they lie on dolomite.
The Makganyane Formation lies unconformable on the Gamagara Formation, where
the latter is developed and elsewhere it overlies the Asbestos Hills Formation
conformably. The maximum thickness is less than 470m. A tillite occurs at the
base of the formation and contains fragments of chert and jasper. Higher up in the
succession alternating layers of grit, tillite, silicified mudstone and felspathic
quartzite occur. Dolomite or limestone occurs interbedded in the mudstone.
The Ongeluk Formation forms the lower part of the Olifantshoek Group. Andesitic
lava belonging to this formation crops out in the Dimoten Syncline and west of the
Maremane Anticline and disappears under the sand cover further north. The
formation consists of grey-green lava with jasper amygdales and lenses of red
jasper.
The Voëlwater Formation overlies the Ongeluk Formation and has a thickness of
450m. The lower beds are banded ironstone and banded red jasper with chert,
dolomite and lava. In the north, there is a manganiferous jaspilite near the base
of the formation. The upper portion of the succession consists predominantly of
dolomite with chert, banded jasper and lava.
The Lucknow Formation occurs east of Olifantshoek and also in the Koranaberg
where the strata are disturbed by a number of faults. It lies unconformable on the
Voëlwater Formation. The formation has a maximum thickness of 1500 m. The
lower portion consists of mainly shale with subordinate layers of quartzite and lava
and the upper portion of whitish quartzite with lenses of flagstone and dolomitic
limestone.
The bedrock geology is mainly covered by Tertiary and younger deposits known as
Kalahari Group sediments. The pre-tertiary topography of the area controlled
deposition of these sediments. The total thickness of the Kalahari Beds was
reported by Smit (1977) to exceed 100m.
Several sub-outcropping dykes (mainly magnetic with some low to non-magnetic)
occur in the area. These dyke structures are mainly visible on aerial photos and
remote sensing images where the soil or sediment cover is less than 15 metres.
These linear structures mostly represent intrusive dykes, which are generally near
vertical (85 to 90 degrees) and have strike lengths in excess of 100 km. The
general strike directions are WSW – ENE, SSW –NNE, and ESE – WNW.
Page 17
10MVA 132/11KV OLIFANTSHOEK SUBSTATIONSurface Water & Hydrological Impact Assessment Report August 2017
Surface Water & Hydrological Impact Assessment Page 13
Local Geology and Hydrogeology
The local geology consists mainly of the Banded Iron Formation of the Asbestos
Hills Formation and Andesitic Lava of the Ongeluks Formation. The bulk of the
basement geology is concealed beneath the partially consolidated sediments of the
Kalahari Group (Figure 8). South of the N14, within and around the proposed
substation locations, the Kalahari sediments becomes thin and patchy and large
areas of bedrock are exposed belonging to the Olifantshoek Subergroup (refer to
Figure 5).
Outcroppings and hills (e.g. Hartley Hill to the west of the preferred substation
location) comprise of this supergroup and can be divided into two unconformity-
bounded sequences. The oldest of these sequences is named the Elim Group and
consists of the Mapedi and Lucknow formations, an upward coarsening shale to
quartzite succession with interbedded carbonate rocks. The second sequence is
taken from the regional unconformity at the base of the overlying Harley Formation,
which is composed of basal conglomerate and quartzite, followed by dominantly
volcanic rocks. The Hartley Formation is overlain conformably by light grey to white
sandstone, forming the top of the Volop Group.
The Kalahari Group Sediments is subdivided into 4 formations, i.e. Wessels Gravel
Formation, overlain by the Budin Clay Formation and the Eden Sandstone
Formation and followed by the Mokalanen Limestone Formation at the top.
» Wessels Gravel Formation
The Wessels Formation consists of brown clayey gravel with gravel beds, which
as a rule contains a large percentage of clay (30%). It occupies some of the
deeper troughs and channels of the pre-Kalahari surface, and reaches a
maximum thickness of 100m.
» Budin Clay Formation
The Budin Formation reaches a maximum thickness of 100m and consists
predominantly of red and brown clay, marl and micaceous shale. The clay often
contains fine grained (<2mm) gravel material. Cross-bedded gravels occur
near the base, where they apparently grade into the Wessels Formation. The
environment of deposition is probably lacustrine or low-energy fluvial.
» Eden Sandstone Formation
The Eden Formation consists of greenish generally rather loosely consolidated
sandstones, grits and minor intra-formational conglomerates. The sediments
show a gradation downwards into the Budin Formation, and upwards into sandy
limestone. The maximum thickness is about 80m.
Page 18
10MVA 132/11KV OLIFANTSHOEK SUBSTATIONSurface Water & Hydrological Impact Assessment Report August 2017
Surface Water & Hydrological Impact Assessment Page 14
» Mokalanen Calcrete Formation
The calcrete of the Mokalanen Formation forms the boundary between the
Tertiary and Quaternary rocks. It occurs extensively on the Dwyka Formation.
The formation consists of hardpan calcrete (generally thick and of Quaternary
Age) with underlying white diatomaceous limestone (fossiliferous), loosely
consolidated with a very low density. The maximum thickness of the formation
is 50m. The depositional environment is probably one of a sluggish flowing
river or a still freshwater lake.
» Intrusive diabase and dolerite dykes (mainly magnetic with some low magnetic
to non-magnetic) represent the youngest rocks in the study area. The dykes
generally intruded along major faults, are mostly impervious (with low to
impervious hydraulic conductivity) and compartmentalise the dolomite aquifer
into sub-units. These dykes are only present in the bedrock below the Kalahari
sediments.
Figure 5: Conceptual west-east hydrological cross-section of the study area
provided by Vivier (2016).
Page 19
10MVA 132/11KV OLIFANTSHOEK SUBSTATIONSurface Water & Hydrological Impact Assessment Report August 2017
Surface Water & Hydrological Impact Assessment Page 15
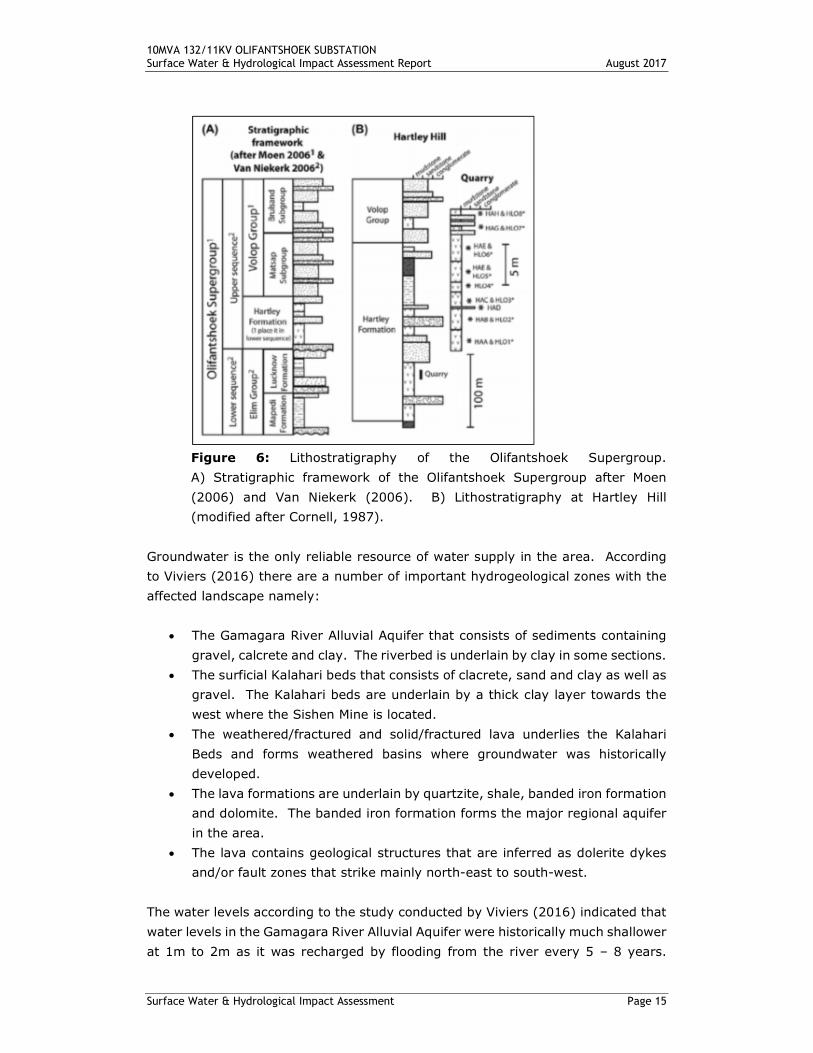
Figure 6: Lithostratigraphy of the Olifantshoek Supergroup.
A) Stratigraphic framework of the Olifantshoek Supergroup after Moen
(2006) and Van Niekerk (2006). B) Lithostratigraphy at Hartley Hill
(modified after Cornell, 1987).
Groundwater is the only reliable resource of water supply in the area. According
to Viviers (2016) there are a number of important hydrogeological zones with the
affected landscape namely:
• The Gamagara River Alluvial Aquifer that consists of sediments containing
gravel, calcrete and clay. The riverbed is underlain by clay in some sections.
• The surficial Kalahari beds that consists of clacrete, sand and clay as well as
gravel. The Kalahari beds are underlain by a thick clay layer towards the
west where the Sishen Mine is located.
• The weathered/fractured and solid/fractured lava underlies the Kalahari
Beds and forms weathered basins where groundwater was historically
developed.
• The lava formations are underlain by quartzite, shale, banded iron formation
and dolomite. The banded iron formation forms the major regional aquifer
in the area.
• The lava contains geological structures that are inferred as dolerite dykes
and/or fault zones that strike mainly north-east to south-west.
The water levels according to the study conducted by Viviers (2016) indicated that
water levels in the Gamagara River Alluvial Aquifer were historically much shallower
at 1m to 2m as it was recharged by flooding from the river every 5 – 8 years.
Page 20
10MVA 132/11KV OLIFANTSHOEK SUBSTATIONSurface Water & Hydrological Impact Assessment Report August 2017
Surface Water & Hydrological Impact Assessment Page 16
These water levels are now around 6m to 8m deep. The cause of the deeper water
levels in the Gamagara River Alluvial Aquifer has been confirmed to be due to
leakage of the river into the Sishen Compartment that is partially dewatered by
mining. Concerns were also raised within the study that the Olifantsloop drainage
could also be affected by the impact on the Gamagara River.
The same situation was recorded for water levels in the lava formation which
declined from 10m to 15m deep in the hand dug wells in the 1960’s to around 20m
to 40m since around 2005.
Soil and Land Types
Detailed soil information is not available for broad areas of the country. A surrogate
land type data was used to provide a general description of soil in the study area
(land types are areas with largely uniform soils, typography and climate). Both
substation options are situated within the Ae6 land type with the Ic2 land type
found to the east and west where the landscape becomes more undulating and
rugged.
» Ae land type refers to areas characterised by red-yellow apedal, freely drained
soils (Red, high base status soils, deeper than 300mm without dunes). These
moderately deep red, freely drained apedal soils occur in areas associated with
low to moderate rainfall (300-700mm per annum) in the interior of South Africa
and have a high fertility status. A wide range of texture occurs (usually sandy
loam to sandy clay loam). Dominant soil forms include Hutton and Oakleaf.
Isolated areas with shallow soils are characterised by the Mispah soil form.
» The Ic group of land types refers to land types with a soil pattern difficult to
accommodate elsewhere. Diagnostic of this land type is that 60-80% of the
surface is occupied by exposed rock and stones/boulders and the slopes are
usually steep. The rest of the area comprises mostly shallow soils, directly
underlain by hard or weathered rock. Dominant soil forms include Hutton (deep
soils), Mispah (shallow soils) and exposed rock where soil is largely absent.
Hydrology
The study area is located within the Lower Vaal River Water Management Area and
within the D41J quaternary catchment area. The most prominent river system
within the region is the ephemeral (non-perennial) Gamagara River which is a
tributary of the Kuruman River (also non-perennial). According to the Present
Ecological State (DWS PES, 1999) the condition of the Gamagara River is classified
as Class B, which indicates that the river is still largely in a natural state. The same
PES classification (Class B) was provided for the Olifantsloop River, a non-perennial
tributary of the Gamagara River.
Page 21
10MVA 132/11KV OLIFANTSHOEK SUBSTATIONSurface Water & Hydrological Impact Assessment Report August 2017
Surface Water & Hydrological Impact Assessment Page 17
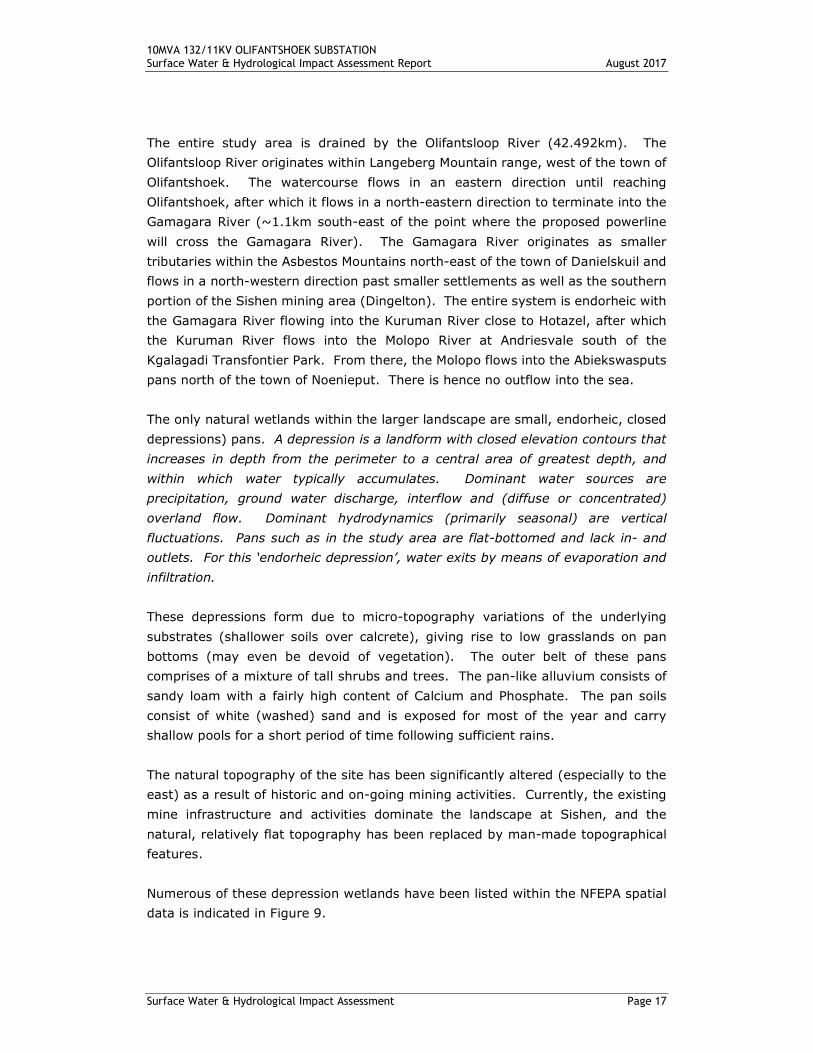
The entire study area is drained by the Olifantsloop River (42.492km). The
Olifantsloop River originates within Langeberg Mountain range, west of the town of
Olifantshoek. The watercourse flows in an eastern direction until reaching
Olifantshoek, after which it flows in a north-eastern direction to terminate into the
Gamagara River (~1.1km south-east of the point where the proposed powerline
will cross the Gamagara River). The Gamagara River originates as smaller
tributaries within the Asbestos Mountains north-east of the town of Danielskuil and
flows in a north-western direction past smaller settlements as well as the southern
portion of the Sishen mining area (Dingelton). The entire system is endorheic with
the Gamagara River flowing into the Kuruman River close to Hotazel, after which
the Kuruman River flows into the Molopo River at Andriesvale south of the
Kgalagadi Transfontier Park. From there, the Molopo flows into the Abiekswasputs
pans north of the town of Noenieput. There is hence no outflow into the sea.
The only natural wetlands within the larger landscape are small, endorheic, closed
depressions) pans. A depression is a landform with closed elevation contours that
increases in depth from the perimeter to a central area of greatest depth, and
within which water typically accumulates. Dominant water sources are
precipitation, ground water discharge, interflow and (diffuse or concentrated)
overland flow. Dominant hydrodynamics (primarily seasonal) are vertical
fluctuations. Pans such as in the study area are flat-bottomed and lack in- and
outlets. For this ‘endorheic depression’, water exits by means of evaporation and
infiltration.
These depressions form due to micro-topography variations of the underlying
substrates (shallower soils over calcrete), giving rise to low grasslands on pan
bottoms (may even be devoid of vegetation). The outer belt of these pans
comprises of a mixture of tall shrubs and trees. The pan-like alluvium consists of
sandy loam with a fairly high content of Calcium and Phosphate. The pan soils
consist of white (washed) sand and is exposed for most of the year and carry
shallow pools for a short period of time following sufficient rains.
The natural topography of the site has been significantly altered (especially to the
east) as a result of historic and on-going mining activities. Currently, the existing
mine infrastructure and activities dominate the landscape at Sishen, and the
natural, relatively flat topography has been replaced by man-made topographical
features.
Numerous of these depression wetlands have been listed within the NFEPA spatial
data is indicated in Figure 9.
Page 22
10MVA 132/11KV OLIFANTSHOEK SUBSTATIONSurface Water & Hydrological Impact Assessment Report August 2017
Surface Water & Hydrological Impact Assessment Page 18
Figure 7: Land types found within the study area as well as the surrounding environment.
Page 23
10MVA 132/11KV OLIFANTSHOEK SUBSTATIONSurface Water & Hydrological Impact Assessment Report August 2017
Surface Water & Hydrological Impact Assessment Page 19
Figure 8: Geological Stratification of the study area and surrounding environment (Kleynhans, 1999).
Page 24
10MVA 132/11KV OLIFANTSHOEK SUBSTATIONSurface Water & Hydrological Impact Assessment Report August 2017
Surface Water & Hydrological Impact Assessment Page 20
Figure 9: NFEPA wetlands and streams within the study area as well as the surrounding environment.
Page 25
10MVA 132/11KV OLIFANTSHOEK SUBSTATIONSurface Water & Hydrological Impact Assessment Report August 2017
Surface Water & Hydrological Impact Assessment Page 21
3.3 Existing Land Use
The preferred substation location is situated just outside of the urban boundary of
the town of Olifantshoek on land used mostly for farming. Farming practises consist
mainly of livestock farming (cattle and goats). The preferred location is
furthermore located just south of the N14.
The alternative substation is located within an open space between the formal part
of the town to the west and the informal part to the east. This location is adjacent
to the existing substation to be decommissioned.
4 RESULTS
4.1 Wetland classification, delineation and description
4.1.1 Olifantsloop Non-Perennial Watercourse & Riparian Fringe
(a) Upstream Portion (Deep channel & Riparian Fringe)
The Olifantsloop River is a non-perennial or ephemeral system (42.492km long)
which originates in the Langeberg Mountains west of the town of Olifantshoek and
terminates into the Gamagara River (also non-perennial). The portion of the
watercourse flowing through the urban area is characterised by a developed
channel which may become relatively deep in areas (over 3m). These deep
channels normally consist out of fine sand and silt and are normally devoid of
vegetation (unstable conditions due to high velocity streamflow during rainfall
events and the effects of erosion). Where flow velocities are not so intense the
channels are normally shallower and may not even be prominent. These areas are
normally vegetated with a mixed grass and herb layer with numerous exotic plant
species.
Plant species within these channels include:
• Weeds & exotics: Chenopodium album, Chenopodium carinatum,
Verbesina encelioides, Datura stramonium, Tribulus terrestris, Argemone
ochroleuca
• Herbs: Heliotropium ciliatum, Acrotome inflate, Limeum agute-carinatum,
Hybiscus spp., Chrysocoma ciliate & Pentzia incana,
• Seges: Kylinga alba, Schoenoplectus muricinux, Cyperus laevigatus
• Grasses: Chloris virgata, Cynodon dactylon, Eragrostis curvula, Tragus
berteronianus, Tragus koelerioides, Urochloa panicoides, Leptochloa fusca,
Aristida congesta, A. adscensionis, Enneapogon desvauxii, Eragrostis
echinochloidea and E. lehmanniana
Page 26
10MVA 132/11KV OLIFANTSHOEK SUBSTATIONSurface Water & Hydrological Impact Assessment Report August 2017
Surface Water & Hydrological Impact Assessment Page 22
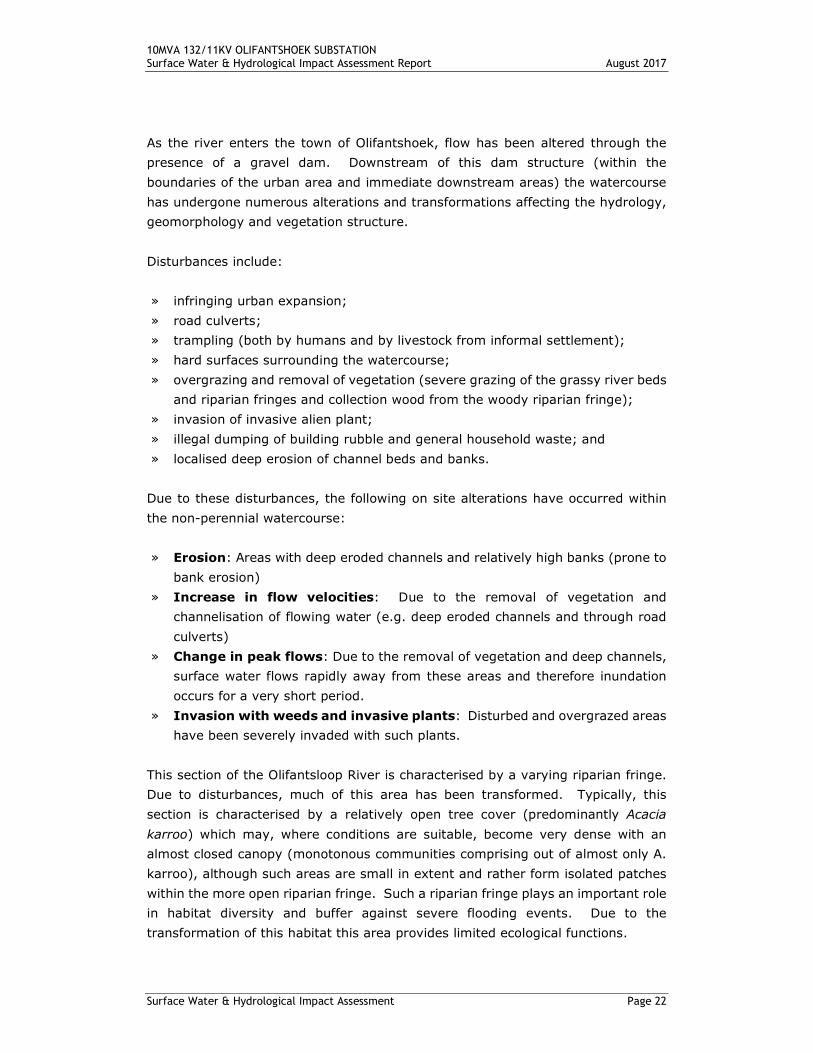
As the river enters the town of Olifantshoek, flow has been altered through the
presence of a gravel dam. Downstream of this dam structure (within the
boundaries of the urban area and immediate downstream areas) the watercourse
has undergone numerous alterations and transformations affecting the hydrology,
geomorphology and vegetation structure.
Disturbances include:
» infringing urban expansion;
» road culverts;
» trampling (both by humans and by livestock from informal settlement);
» hard surfaces surrounding the watercourse;
» overgrazing and removal of vegetation (severe grazing of the grassy river beds
and riparian fringes and collection wood from the woody riparian fringe);
» invasion of invasive alien plant;
» illegal dumping of building rubble and general household waste; and
» localised deep erosion of channel beds and banks.
Due to these disturbances, the following on site alterations have occurred within
the non-perennial watercourse:
» Erosion: Areas with deep eroded channels and relatively high banks (prone to
bank erosion)
» Increase in flow velocities: Due to the removal of vegetation and
channelisation of flowing water (e.g. deep eroded channels and through road
culverts)
» Change in peak flows: Due to the removal of vegetation and deep channels,
surface water flows rapidly away from these areas and therefore inundation
occurs for a very short period.
» Invasion with weeds and invasive plants: Disturbed and overgrazed areas
have been severely invaded with such plants.
This section of the Olifantsloop River is characterised by a varying riparian fringe.
Due to disturbances, much of this area has been transformed. Typically, this
section is characterised by a relatively open tree cover (predominantly Acacia
karroo) which may, where conditions are suitable, become very dense with an
almost closed canopy (monotonous communities comprising out of almost only A.
karroo), although such areas are small in extent and rather form isolated patches
within the more open riparian fringe. Such a riparian fringe plays an important role
in habitat diversity and buffer against severe flooding events. Due to the
transformation of this habitat this area provides limited ecological functions.
Page 27
10MVA 132/11KV OLIFANTSHOEK SUBSTATIONSurface Water & Hydrological Impact Assessment Report August 2017
Surface Water & Hydrological Impact Assessment Page 23
Dominant vegetation of the riparian zone includes:
» Trees: Acacia karroo, Searsia lancea, Ziziphus mucronate, Diospyros lycioides
» Weeds & Invading Plants: Eucalyptus camaldulensis, Nicotiana gluaca,
Bidens pilosa
» Shrubs: Grewia flava, Asparagus suaveolens
» Dwaf Shrubs: Lycium hirsutum
» Herbs: Asclepias fruticose, Amaranthus spp., Chrysocoma ciliate & Pentzia
incana
» Grasses: Cynodon dactylon, Setaria verticillata, Chloris virgata, Sporobolus
fimbriatus, Tragus koelerioides, Urochloa panicoides, Aristida congesta,
Eragrostis echinochloidea and E. lehmanniana
Disturbances within the riparian habitat include:
» Severe trampling and overgrazing with numerous footpaths traversing the
area;
» Collection of wood;
» Invasion with invasive alien plant species;
» Removal of vegetation exposing areas to erosion;
» The existing Olifantshoek substation is situated right on the border of this
riparian habitat
» Infringing urban expansion.
The Present Ecological State scores (PES) for this portion of the watercourse and
associated riparian fringe were rated as C/D (Largely modified) due to activities
described above.
This portion of the Olifantsloop non-perennial watercourse as well as its associated
riparian fringe will only be impacted on by the project if the alternative substation
is selected as the final position. The preferred location for the substation is located
outside these habitats and is therefore considered to be preferred. Due to the fact
that further construction and development within the riparian habitat will lead to
further degradation of this habitat type it is suggested that the alternative
substation option should not be considered as the final location. Furthermore, even
though the watercourse and riparian fringe in this section are highly degraded and
transformed, these areas do still provide some valuable functions, such as habitat
diversity, flow attenuation (although limited), grazing etc. and are subsequently
regarded as High sensitivity areas.
Page 28
10MVA 132/11KV OLIFANTSHOEK SUBSTATIONSurface Water & Hydrological Impact Assessment Report August 2017
Surface Water & Hydrological Impact Assessment Page 24
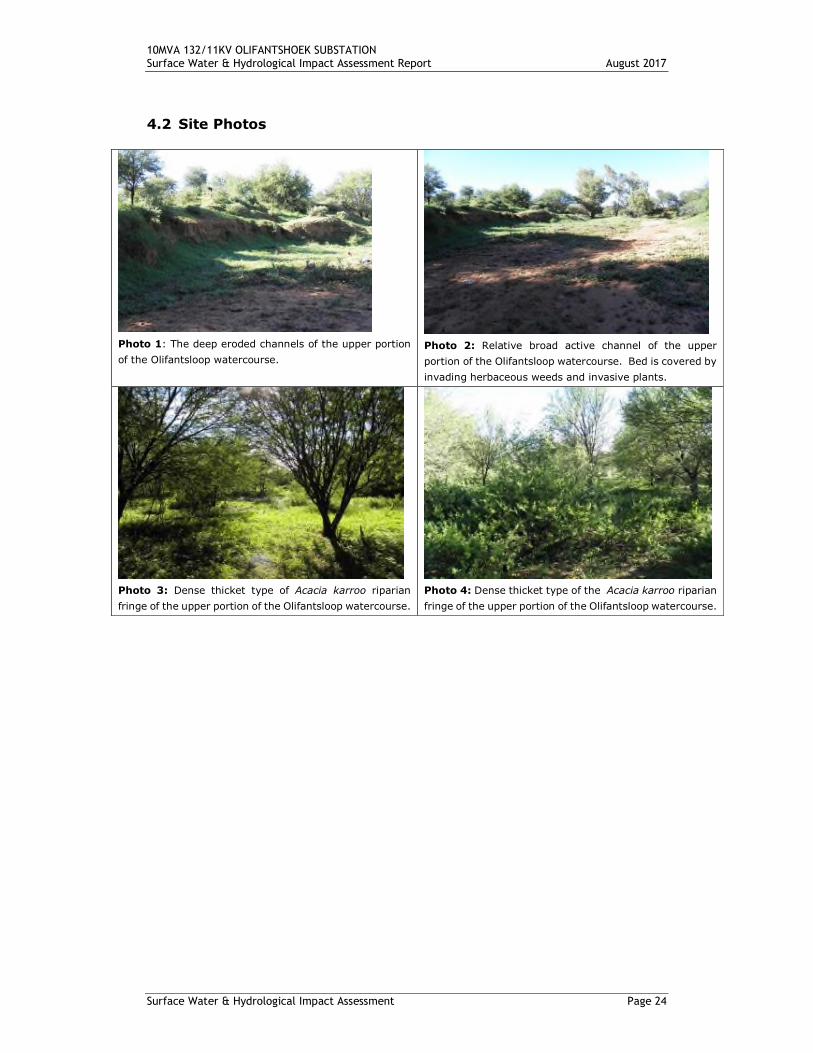
4.2 Site Photos
Photo 1: The deep eroded channels of the upper portion
of the Olifantsloop watercourse.
Photo 2: Relative broad active channel of the upper
portion of the Olifantsloop watercourse. Bed is covered by
invading herbaceous weeds and invasive plants.
Photo 3: Dense thicket type of Acacia karroo riparian
fringe of the upper portion of the Olifantsloop watercourse.
Photo 4: Dense thicket type of the Acacia karroo riparian
fringe of the upper portion of the Olifantsloop watercourse.
Page 29
10MVA 132/11KV OLIFANTSHOEK SUBSTATIONSurface Water & Hydrological Impact Assessment Report August 2017
Surface Water & Hydrological Impact Assessment Page 25
Photo 5: Highly altered channel bank and bed (south of
the proposed alternative substation location).
Photo 6: Section of the riparian fringe that has been
cleared and invaded within numerous invasive alien
plants including Opuntia (a portion of riparian fringe just
east of the proposed alternative substation location).
Photo 7: Some pools of standing water remaining after a rainfall event.
Page 30
10MVA 132/11KV OLIFANTSHOEK SUBSTATIONSurface Water & Hydrological Impact Assessment Report August 2017
Surface Water & Hydrological Impact Assessment Page 26
Figure 10: Upper portion of the Olifantsloop non-perennial watercourse and associated riparian fringe.
Page 31
10MVA 132/11KV OLIFANTSHOEK SUBSTATIONSurface Water & Hydrological Impact Assessment Report August 2017
Surface Water & Hydrological Impact Assessment Page 27
4.3 Surface Water & Hydrological Sensitivity Analysis
4.3.1 Olifantsloop Non-Perennial Watercourse & Riparian Fringe
Upstream Portion (Deep channel & Riparian Fringe)
Conservation status » Moderate-High
» Relatively moderate diversity, presence of keystone
species/individual trees
» Niche habitats
» Some are species restricted to these areas
Ecosystem function » Limited absorption and reduction of occasional flash floods
» Important corridor for abiotic and biotic material transfer
» Keystone species maintain habitat and create specific
microhabitats for a multitude of organisms
» Herbaceous vegetation helps slow down floods, ‘catch’
sediments, and retain nutrients
» Vegetation filters out possible pollutants to prevent their
discharge into the Orange River
» A permanent vegetation cover is necessary to maintain
the functionality and stability of this ecosystem
Stability » Medium if the habitat is kept intact, despite the potential
effect of occasional flash floods
» Excessive erosion, loss of seed resources, high
undesirable invisibility and slow regeneration of natural
vegetation will result from clearing this vegetation
Reversibility of
degradation
» Limited, slow and will be subject to high inputs of erosion
control and invasive species management
Levels of acceptable
Change
» Minimal change in the riparian fringe may be allowed and
may only include the decommissioning of the exisiting
Olifantshoek substation. Appart from the
decommissioning no additional activities and changes may
be allowed within this riparian section. Therefore, the
alternative substation option should be excluded and the
preferred substation option should form part of the final
layout as this option is located outside of the riparian
fringe.
Rating » High sensitivity
Page 32
10MVA 132/11KV OLIFANTSHOEK SUBSTATIONSurface Water & Hydrological Impact Assessment Report August 2017
Surface Water & Hydrological Impact Assessment Page 28
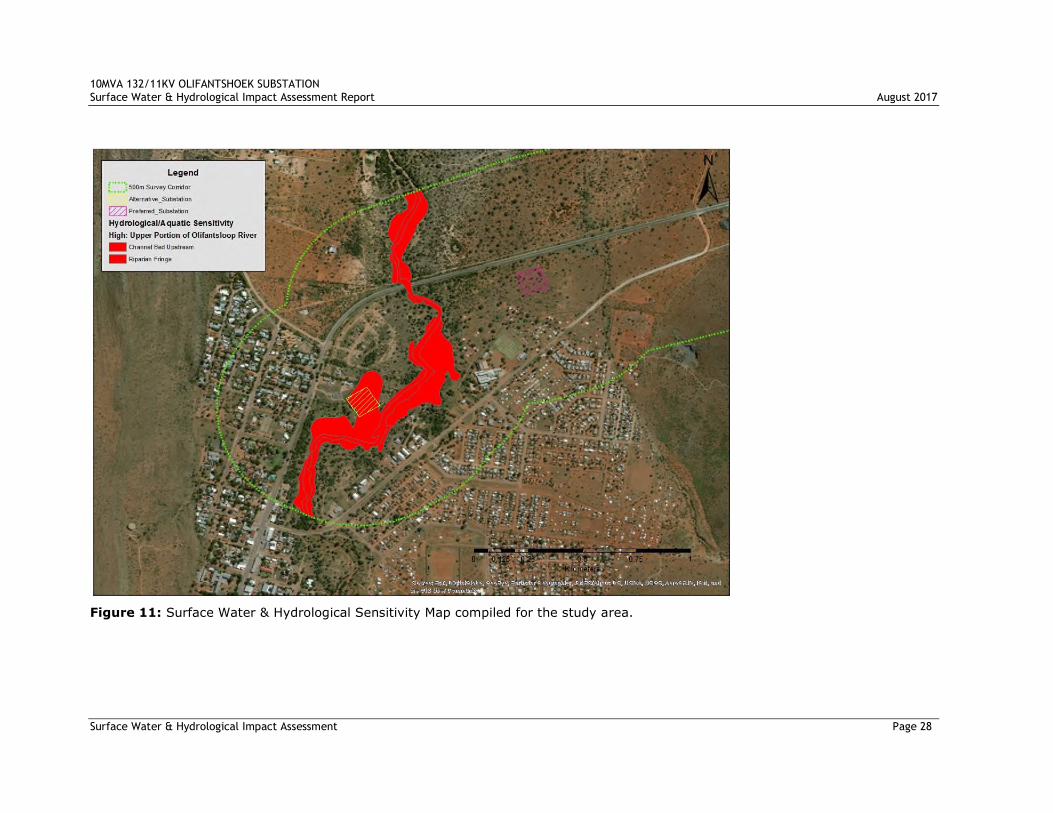
Figure 11: Surface Water & Hydrological Sensitivity Map compiled for the study area.
Page 33
10MVA 132/11KV OLIFANTSHOEK SUBSTATIONSurface Water & Hydrological Impact Assessment Report August 2017
Surface Water & Hydrological Impact Assessment Page 29
5 IMPACT ASSESSMENT
During the impact assessment study a number of potential key issues / impacts
were identified and these were assessed based on the methodology supplied by
Savannah Environmental (Pty) Ltd.
The following direct and indirect impacts were assessed with regard to construction,
operation and decommissioning impacts on the riparian areas and watercourses:
» Impact 1: Loss of riparian systems and alluvial water courses
» Impact 2: Potential impact on localised surface water quality
» Impact 3: Impact on riparian systems through the possible increase in surface
water runoff on riparian form and function
» Impact 4: Increase in sedimentation and erosion
The impacts were assessed as follows:
PROPOSED SUBSTATION OPTIONS
Take note that the existing substation is located outside of any watercourse or riparian zone and as such
will not impact on the identified watercourses and riparian zones, subsequently no assessment was
deemed necessary. Furthermore, the preferred substation option is located well beyond the boundaries
of any watercourse and/or riparian zone and therefore no impacts have been assessed for this option.
Subsequently, potential impacts assessed are only applicable to the alternative substation option
Construction & Decommissioning Phase Impacts
Impact Nature: Impact 1 – Loss of riparian systems and alluvial watercourses
The physical removal of riparian zones within the footprint area and disturbance of any
alluvial watercourses, being replaced by hard engineered surfaces during construction.
Without Mitigation With Mitigation
Extent Local (1) Local (1)
Duration Long-term (4) Long-term (4)
Magnitude Low (4) Low (4)
Probability Definite (5) Highly Probable (4)
Significance Medium (45) Medium (36)
Status Negative Negative
Reversibility Low Low
Irreplaceable loss of
resourcesYes Yes
Page 34
10MVA 132/11KV OLIFANTSHOEK SUBSTATIONSurface Water & Hydrological Impact Assessment Report August 2017
Surface Water & Hydrological Impact Assessment Page 30
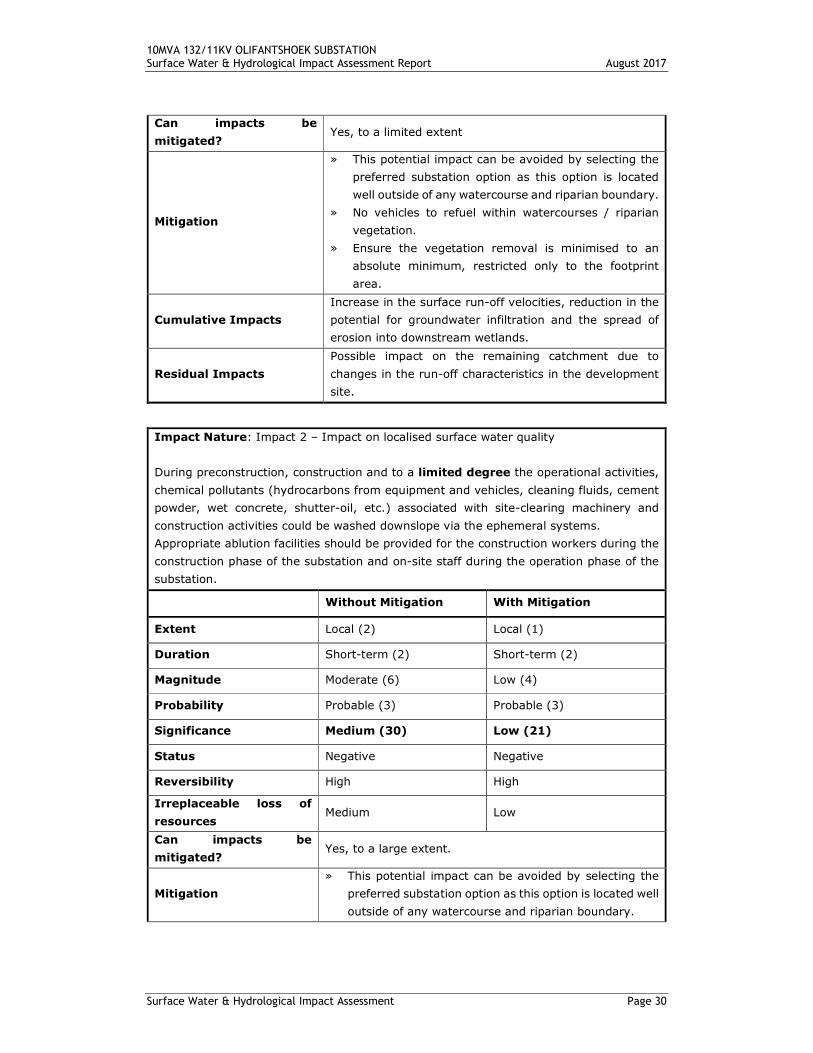
Can impacts be
mitigated?Yes, to a limited extent
Mitigation
» This potential impact can be avoided by selecting the
preferred substation option as this option is located
well outside of any watercourse and riparian boundary.
» No vehicles to refuel within watercourses / riparian
vegetation.
» Ensure the vegetation removal is minimised to an
absolute minimum, restricted only to the footprint
area.
Cumulative Impacts
Increase in the surface run-off velocities, reduction in the
potential for groundwater infiltration and the spread of
erosion into downstream wetlands.
Residual Impacts
Possible impact on the remaining catchment due to
changes in the run-off characteristics in the development
site.
Impact Nature: Impact 2 – Impact on localised surface water quality
During preconstruction, construction and to a limited degree the operational activities,
chemical pollutants (hydrocarbons from equipment and vehicles, cleaning fluids, cement
powder, wet concrete, shutter-oil, etc.) associated with site-clearing machinery and
construction activities could be washed downslope via the ephemeral systems.
Appropriate ablution facilities should be provided for the construction workers during the
construction phase of the substation and on-site staff during the operation phase of the
substation.
Without Mitigation With Mitigation
Extent Local (2) Local (1)
Duration Short-term (2) Short-term (2)
Magnitude Moderate (6) Low (4)
Probability Probable (3) Probable (3)
Significance Medium (30) Low (21)
Status Negative Negative
Reversibility High High
Irreplaceable loss of
resourcesMedium Low
Can impacts be
mitigated?Yes, to a large extent.
Mitigation
» This potential impact can be avoided by selecting the
preferred substation option as this option is located well
outside of any watercourse and riparian boundary.
Page 35
10MVA 132/11KV OLIFANTSHOEK SUBSTATIONSurface Water & Hydrological Impact Assessment Report August 2017
Surface Water & Hydrological Impact Assessment Page 31
» Implement appropriate measures to ensure strict use
and management of all hazardous materials used on
site.
» Implement appropriate measures to ensure strict
management of potential sources of pollutants (e.g.
litter hydrocarbons from vehicles and machinery,
cement during construction etc.).
» Implement appropriate measures to ensure the
containment of all contaminated water by means of
careful run-off management on the development site.
» Implement appropriate measures to ensure strict
control over the behavior of construction workers.
» Working protocols incorporating pollution control
measures (including approved method statements by
the contractor) should be clearly set out in the
Construction Environmental Management Plan (CEMP)
for the project and strictly enforced.
Cumulative Impacts None
Residual ImpactsResidual impacts will be negligible after appropriate
mitigation.
Impact Nature: Impact 3 - Increase in sedimentation and erosion within the
development footprint. This may alter the local watercourse morphology and influence
water quality downstream.
Without Mitigation With Mitigation
Extent Local (1) Local (1)
Duration Long-term (4) Very Short (1)
Magnitude Low (2) Small (0)
Probability Probable (3) Improbable (2)
Significance Low (21) Low (4)
Status Negative Negative
Reversibility High High
Irreplaceable loss of
resourcesNo No
Can impacts be
mitigated?Yes, to a large extent
Mitigation
» This potential impact can be avoided by selecting the
preferred substation option as this option is located well
outside of any watercourse and riparian boundary.
» Any erosion problems observed to be associated with
the project infrastructure should be rectified as soon as
Page 36
10MVA 132/11KV OLIFANTSHOEK SUBSTATIONSurface Water & Hydrological Impact Assessment Report August 2017
Surface Water & Hydrological Impact Assessment Page 32
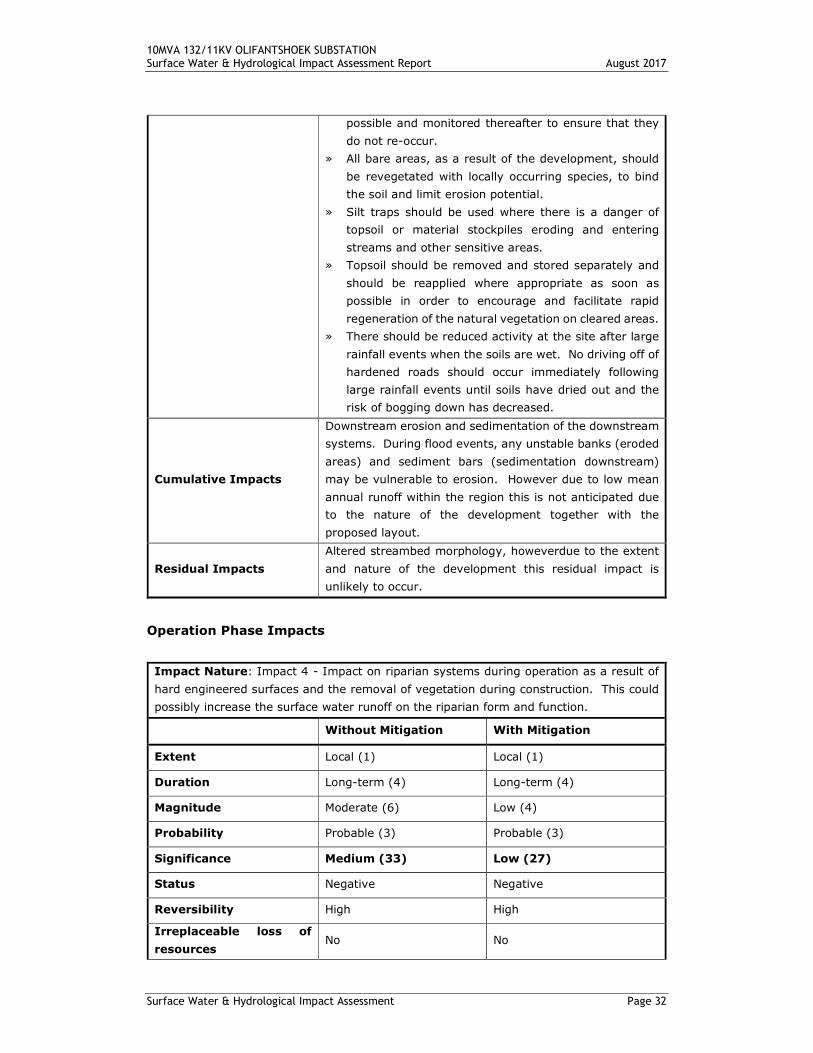
possible and monitored thereafter to ensure that they
do not re-occur.
» All bare areas, as a result of the development, should
be revegetated with locally occurring species, to bind
the soil and limit erosion potential.
» Silt traps should be used where there is a danger of
topsoil or material stockpiles eroding and entering
streams and other sensitive areas.
» Topsoil should be removed and stored separately and
should be reapplied where appropriate as soon as
possible in order to encourage and facilitate rapid
regeneration of the natural vegetation on cleared areas.
» There should be reduced activity at the site after large
rainfall events when the soils are wet. No driving off of
hardened roads should occur immediately following
large rainfall events until soils have dried out and the
risk of bogging down has decreased.
Cumulative Impacts
Downstream erosion and sedimentation of the downstream
systems. During flood events, any unstable banks (eroded
areas) and sediment bars (sedimentation downstream)
may be vulnerable to erosion. However due to low mean
annual runoff within the region this is not anticipated due
to the nature of the development together with the
proposed layout.
Residual Impacts
Altered streambed morphology, howeverdue to the extent
and nature of the development this residual impact is
unlikely to occur.
Operation Phase Impacts
Impact Nature: Impact 4 - Impact on riparian systems during operation as a result of
hard engineered surfaces and the removal of vegetation during construction. This could
possibly increase the surface water runoff on the riparian form and function.
Without Mitigation With Mitigation
Extent Local (1) Local (1)
Duration Long-term (4) Long-term (4)
Magnitude Moderate (6) Low (4)
Probability Probable (3) Probable (3)
Significance Medium (33) Low (27)
Status Negative Negative
Reversibility High High
Irreplaceable loss of
resourcesNo No
Page 37
10MVA 132/11KV OLIFANTSHOEK SUBSTATIONSurface Water & Hydrological Impact Assessment Report August 2017
Surface Water & Hydrological Impact Assessment Page 33
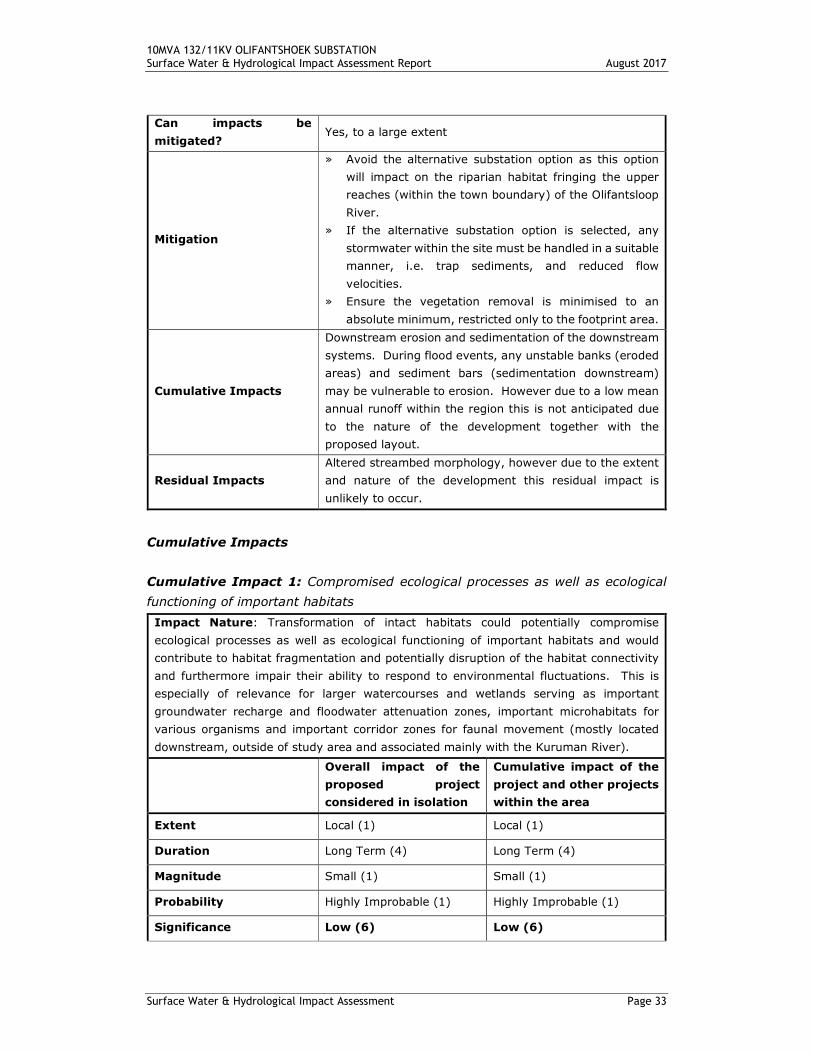
Can impacts be
mitigated?Yes, to a large extent
Mitigation
» Avoid the alternative substation option as this option
will impact on the riparian habitat fringing the upper
reaches (within the town boundary) of the Olifantsloop
River.
» If the alternative substation option is selected, any
stormwater within the site must be handled in a suitable
manner, i.e. trap sediments, and reduced flow
velocities.
» Ensure the vegetation removal is minimised to an
absolute minimum, restricted only to the footprint area.
Cumulative Impacts
Downstream erosion and sedimentation of the downstream
systems. During flood events, any unstable banks (eroded
areas) and sediment bars (sedimentation downstream)
may be vulnerable to erosion. However due to a low mean
annual runoff within the region this is not anticipated due
to the nature of the development together with the
proposed layout.
Residual Impacts
Altered streambed morphology, however due to the extent
and nature of the development this residual impact is
unlikely to occur.
Cumulative Impacts
Cumulative Impact 1: Compromised ecological processes as well as ecological
functioning of important habitats
Impact Nature: Transformation of intact habitats could potentially compromise
ecological processes as well as ecological functioning of important habitats and would
contribute to habitat fragmentation and potentially disruption of the habitat connectivity
and furthermore impair their ability to respond to environmental fluctuations. This is
especially of relevance for larger watercourses and wetlands serving as important
groundwater recharge and floodwater attenuation zones, important microhabitats for
various organisms and important corridor zones for faunal movement (mostly located
downstream, outside of study area and associated mainly with the Kuruman River).
Overall impact of the
proposed project
considered in isolation
Cumulative impact of the
project and other projects
within the area
Extent Local (1) Local (1)
Duration Long Term (4) Long Term (4)
Magnitude Small (1) Small (1)
Probability Highly Improbable (1) Highly Improbable (1)
Significance Low (6) Low (6)
Page 38
10MVA 132/11KV OLIFANTSHOEK SUBSTATIONSurface Water & Hydrological Impact Assessment Report August 2017
Surface Water & Hydrological Impact Assessment Page 34
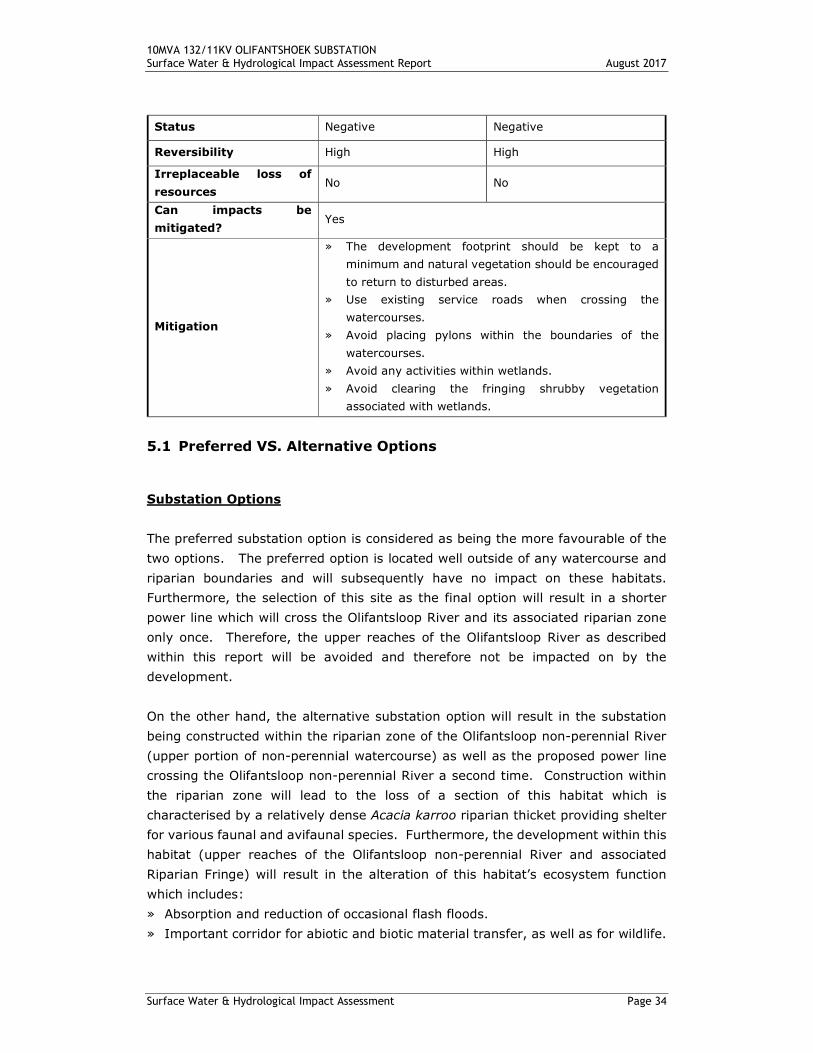
Status Negative Negative
Reversibility High High
Irreplaceable loss of
resourcesNo No
Can impacts be
mitigated?Yes
Mitigation
» The development footprint should be kept to a
minimum and natural vegetation should be encouraged
to return to disturbed areas.
» Use existing service roads when crossing the
watercourses.
» Avoid placing pylons within the boundaries of the
watercourses.
» Avoid any activities within wetlands.
» Avoid clearing the fringing shrubby vegetation
associated with wetlands.
5.1 Preferred VS. Alternative Options
Substation Options
The preferred substation option is considered as being the more favourable of the
two options. The preferred option is located well outside of any watercourse and
riparian boundaries and will subsequently have no impact on these habitats.
Furthermore, the selection of this site as the final option will result in a shorter
power line which will cross the Olifantsloop River and its associated riparian zone
only once. Therefore, the upper reaches of the Olifantsloop River as described
within this report will be avoided and therefore not be impacted on by the
development.
On the other hand, the alternative substation option will result in the substation
being constructed within the riparian zone of the Olifantsloop non-perennial River
(upper portion of non-perennial watercourse) as well as the proposed power line
crossing the Olifantsloop non-perennial River a second time. Construction within
the riparian zone will lead to the loss of a section of this habitat which is
characterised by a relatively dense Acacia karroo riparian thicket providing shelter
for various faunal and avifaunal species. Furthermore, the development within this
habitat (upper reaches of the Olifantsloop non-perennial River and associated
Riparian Fringe) will result in the alteration of this habitat’s ecosystem function
which includes:
» Absorption and reduction of occasional flash floods.
» Important corridor for abiotic and biotic material transfer, as well as for wildlife.
Page 39
10MVA 132/11KV OLIFANTSHOEK SUBSTATIONSurface Water & Hydrological Impact Assessment Report August 2017
Surface Water & Hydrological Impact Assessment Page 35
» Keystone species maintain habitat and create specific microhabitats for a
multitude of organisms.
» Herbaceous vegetation helps slow down floods, ‘catch’ sediments, and retain
nutrients.
» Vegetation filters out possible pollutants to prevent their discharge into the
Orange River.
» A permanent vegetation cover is necessary to maintain the functionality and
stability of this ecosystem.
Therefore, from a surface water and hydrological perspective the alternative option
should not be considered within the final layout and the position of the preferred
substation option is considered as being the only viable option.
Page 40
10MVA 132/11KV OLIFANTSHOEK SUBSTATIONSurface Water & Hydrological Impact Assessment Report August 2017
Surface Water & Hydrological Impact Assessment Page 36
6 ASSESSMENT OF HYDROLOGICAL IMPACTS (RISK ASSESSMENT)
6.1 RISK ASSESSMENT ACCORDING TO DWA RISK MATRIX FOR GENERAL AUTHORISATIONS
The impacts identified above are assessed according to the activities and aspects that may cause them. This is done for the construction
and operation phase of the development.
Activities: Construction of the new proposed Olifantshoek substation and decommissioning of the existing substation (Alternative
substation option).
Phase: During the construction and operation phases.
Environmental Aspect: Generation of waste during construction and maintenance.
Environmental impact: This may lead to the pollution, eutrophication and general reduction in water quality and may potentially
threaten downstream habitats and biota.
Aspect
Impact Risk
Rating
Borderline
LOW
MODERATE
rating
classes
Severity Consequence Likelihood Significance
Hazardous wastes (Hydrocarbons and other
chemicals)
2 7 7 49 L N/A
Page 41
10MVA 132/11KV OLIFANTSHOEK SUBSTATIONSurface Water & Hydrological Impact Assessment Report August 2017
Specialist Wetland Assessment Page 37
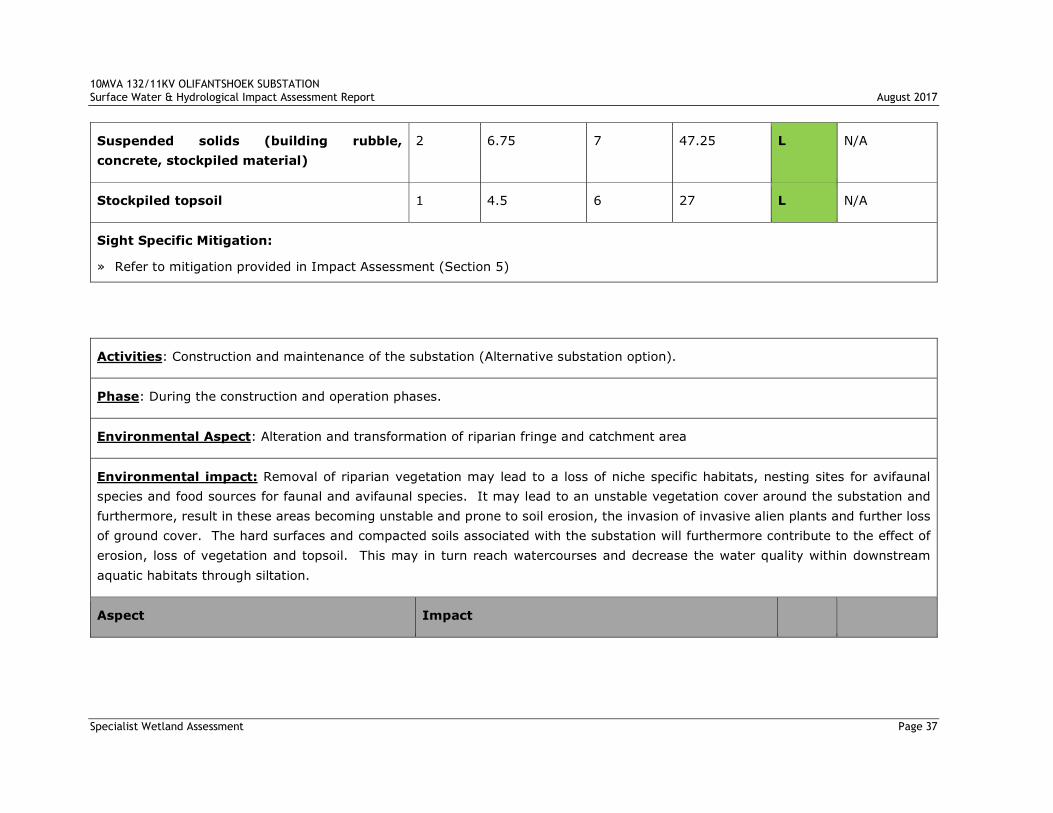
Suspended solids (building rubble,
concrete, stockpiled material)
2 6.75 7 47.25 L N/A
Stockpiled topsoil 1 4.5 6 27 L N/A
Sight Specific Mitigation:
» Refer to mitigation provided in Impact Assessment (Section 5)
Activities: Construction and maintenance of the substation (Alternative substation option).
Phase: During the construction and operation phases.
Environmental Aspect: Alteration and transformation of riparian fringe and catchment area
Environmental impact: Removal of riparian vegetation may lead to a loss of niche specific habitats, nesting sites for avifaunal
species and food sources for faunal and avifaunal species. It may lead to an unstable vegetation cover around the substation and
furthermore, result in these areas becoming unstable and prone to soil erosion, the invasion of invasive alien plants and further loss
of ground cover. The hard surfaces and compacted soils associated with the substation will furthermore contribute to the effect of
erosion, loss of vegetation and topsoil. This may in turn reach watercourses and decrease the water quality within downstream
aquatic habitats through siltation.
Aspect Impact
Page 42
10MVA 132/11KV OLIFANTSHOEK SUBSTATIONSurface Water & Hydrological Impact Assessment Report August 2017
Specialist Wetland Assessment Page 38
Severity Consequence Likelihood Significance Risk
Rating
Borderline
LOW
MODERATE
rating
classes
Removal of riparian vegetation 2.75 7.75 6 46.5 L N/A
Creation of hard surfaces & compacted soils 2.5 7.5 6 45 L N/A
Sight Specific Mitigation:
» Refer to mitigation provided in Impact Assessment (Section 5)
Activities: Construction and maintenance of the substation (Preferred substation option)
Phase: During the construction and operation phases.
Environmental Aspect: Alteration and transformation of the riparian fringe and catchment area.
Environmental impact: Removal of vegetation may lead to an unstable vegetation cover around the substation and furthermore,
result in these areas becoming unstable and prone to soil erosion, the invasion of invasive alien plants and further loss of ground
cover. The hard surfaces and compacted soils associated with the substation will furthermore contribute to the effect of erosion, loss
Page 43
10MVA 132/11KV OLIFANTSHOEK SUBSTATIONSurface Water & Hydrological Impact Assessment Report August 2017
Specialist Wetland Assessment Page 39
of vegetation and topsoil. This may in turn reach watercourses and decrease the water quality within downstream aquatic habitats
through siltation.
Aspect
Impact Risk
Rating
Borderline
LOW
MODERATE
rating
classes
Severity Consequence Likelihood Significance
Removal of vegetation 1.25 5.25 4 21 L N/A
Creation of hard surfaces & compacted
soils
1.25 5.25 4 21 L N/A
Sight Specific Mitigation:
» Refer to mitigation provided in Impact Assessment (Section 5)
Page 44
10MVA 132/11KV OLIFANTSHOEK SUBSTATIONSurface Water & Hydrological Impact Assessment Report August 2017
Surface Water & Hydrological Impact Assessment Page 40
7 DISCUSSION AND CONCLUSION
Based on the results obtained during this study the following conclusions can be
drawn:
» The entire study area is drained by a non-perennial watercourse namely the
Olifantsloop River (42.492km) which in turns drains into the Gamagara River
(88.037km).
» The Olifantsloop river originates within the Langeberg Mountain range, west of
the town of Olifantshoek. The watercourse flows in an eastern direction until
reaching Olifantshoek, after which it flows in a north-eastern direction to
terminate into the Gamagara River.
» The entire system is endorheic with the Gamagara River flowing into the
Kuruman River close to Hotazel, after which the Kuruman River flows into the
Molopo River at Andriesvale south of the Kgalagadi Transfontier Park. From
there, the Molopo River flows into the Abiekswasputs pans north of the town
of Noenieput. There is hence no outflow into the sea.
» The only natural wetlands within the larger environment are small, endorheic
(closed depressions) pans. These depressions form due to micro-topography
variations of the underlying substrates (shallower soils over calcrete), giving
rise to low grasslands on pan bottoms (may even be devoid of vegetation).
None of these depression (pan) structure were identified within the study area
of the proposed substation.
» An upstream portion (within the urban area of Olifantshoek) of the Olifantsloop
watercourse may be affected if the alternative substation option is chosen as
the final position for the new substation. The preferred option for the
substation is located outside of the boundaries of the watercourse as well as
its riparian fringe. This portion of the Olifantsloop watercourse as well as its
associated riparian fringe (dominated by Acacia karroo) has been severely
altered and transformed due to:
• Severe trampling and overgrazing with numerous footpaths traversing the
area;
• Collection of wood;
• Invasion with invasive alien plant species;
• Removal of vegetation exposing areas to erosion;
• The existing Olifantshoek substation is situated right on the border of this
riparian habitat
• Infringing urban expansion.
» The Present Ecological State scores (PES) for this portion of the watercourse
and associated riparian fringe were rated as C/D (Largely modified) due to the
activities described above.
Page 45
10MVA 132/11KV OLIFANTSHOEK SUBSTATIONSurface Water & Hydrological Impact Assessment Report August 2017
Specialist Wetland Assessment Page 41
» Even though in a state of transformation and disturbance this portion of the
Olifantsloop watercourse and associated riparian fringe still provide valuable
habitat and other ecosystem functions.
» This portion of the Olifantsloop watercourse and its associated riparian fringe
is regarded as High Sensitivity due to the following:
• Conservation status
Moderate-High
Relatively high diversity, presence of keystone species/individual trees
Niche habitats
Some species restricted to these areas
and
• Ecosystem function
Limited absorption and reduction of occasional flash floods.
Important corridor for abiotic and biotic material transfer.
Keystone species maintain habitat and create specific microhabitats
for a multitude of organisms.
Herbaceous vegetation helps slow down floods, ‘catch’ sediments, and
retain nutrients.
Vegetation filters out possible pollutants to prevent their discharge into
the Orange River.
A permanent vegetation cover is necessary to maintain the
functionality and stability of this ecosystem
» Regarding the two substation options, there is a clear difference between the
alternative and the preferred option. The alternative option is situated within
a portion of the riparian thicket fringing the upper portion of the Olifantsloop
watercourse and therefore poses a potential threat to the watercourse and the
riparian habitat itself (e.g. create disturbed areas which may be prone to
erosion, invasion with invasive species and subsequently results in these
impacts spreading into the watercourse). The preferred option is located in a
relatively flat terrestrial habitat, well beyond the boundaries of this watercourse
and its associated riparian fringe. Therefore, it is clear from these results that
the preferred location for the new substation is the best option from a
hydrological perspective.
» From the Risk Assessment, the following results were obtained:
Page 46
10MVA 132/11KV OLIFANTSHOEK SUBSTATIONSurface Water & Hydrological Impact Assessment Report August 2017
Specialist Wetland Assessment Page 42
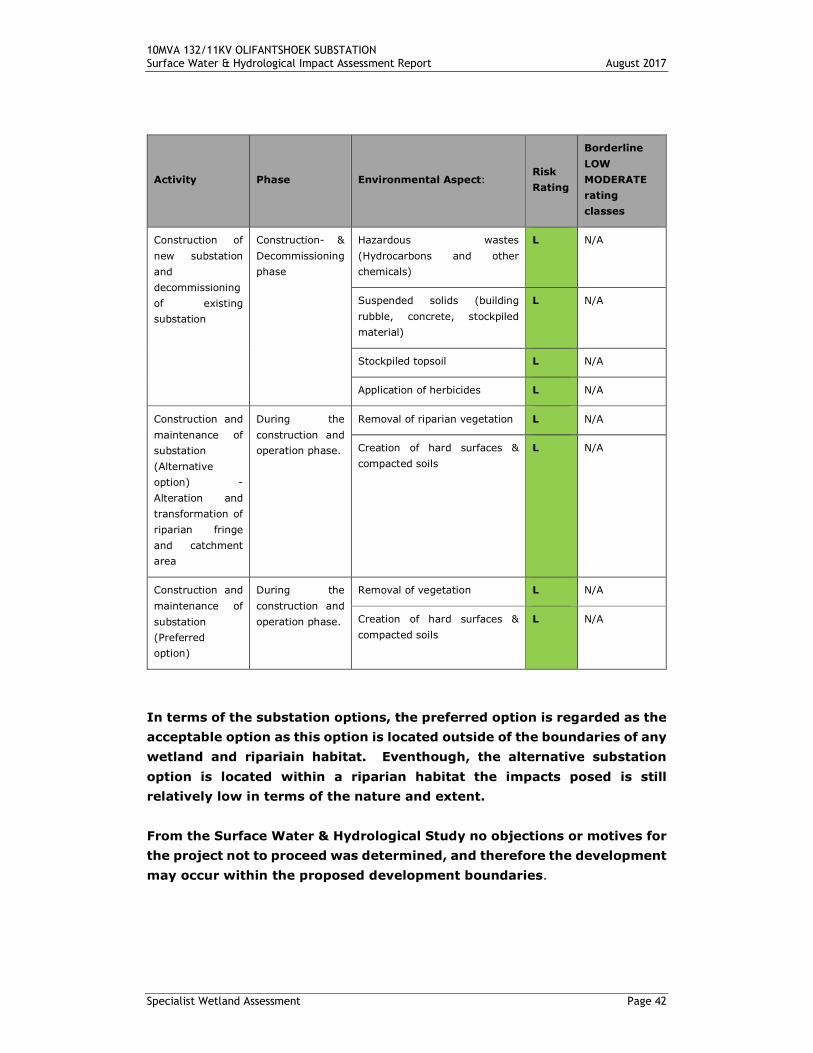
Activity Phase Environmental Aspect:Risk
Rating
Borderline
LOW
MODERATE
rating
classes
Construction of
new substation
and
decommissioning
of existing
substation
Construction- &
Decommissioning
phase
Hazardous wastes
(Hydrocarbons and other
chemicals)
L N/A
Suspended solids (building
rubble, concrete, stockpiled
material)
L N/A
Stockpiled topsoil L N/A
Application of herbicides L N/A
Construction and
maintenance of
substation
(Alternative
option) -
Alteration and
transformation of
riparian fringe
and catchment
area
During the
construction and
operation phase.
Removal of riparian vegetation L N/A
Creation of hard surfaces &
compacted soils
L N/A
Construction and
maintenance of
substation
(Preferred
option)
During the
construction and
operation phase.
Removal of vegetation L N/A
Creation of hard surfaces &
compacted soils
L N/A
In terms of the substation options, the preferred option is regarded as the
acceptable option as this option is located outside of the boundaries of any
wetland and ripariain habitat. Eventhough, the alternative substation
option is located within a riparian habitat the impacts posed is still
relatively low in terms of the nature and extent.
From the Surface Water & Hydrological Study no objections or motives for
the project not to proceed was determined, and therefore the development
may occur within the proposed development boundaries.
Page 47
10MVA 132/11KV OLIFANTSHOEK SUBSTATIONSurface Water & Hydrological Impact Assessment Report August 2017
Specialist Wetland Assessment Page 43
8 REFERENCES
Anhaeusser, C.R., Johnson, M.R., Thomas, R.J. (2008). The Geology of South
Africa. Council for Geosciences.
Department of Water Affairs and Forestry. 1996. Aquatic ecosystems. Volume 7.
South African Water quality guidelines. Department of Water Affairs and Forestry,
Pretoria.
Department of Water Affairs and Forestry (DWAF). 1999. Resource Directed
Measures for Protection of Water Resources. Wetland Ecosystems. Version 1.0,
September 1999.
Department of Water Affairs and Forestry. 2005. A practical field procedure for
identification and delineation of wetlands and riparian areas. Edition 1.
Department of Water Affairs and Forestry, Pretoria.
Ewart-Smith, J.L., Ollis, D.J., Day, J.A. and Malan, H.L. 2006. National wetland
inventory: development of a wetland classification system for South Africa. WRC
Report No. KV 174/06.
Macfarlane, D.M., Bredin, I.P., Adams, J.B., Zungu, M.M., Bate, G.C. and Dickens,
C.W.S. 2014. Buffer zone toll for the determination of aquatic buffers and additional
setback requirements for wetland ecosystems. Version 1.0. Prepared for the Water
Research Commission, Pretoria.
Middleton B.J. & Bailey A.K. 2008. Water Resources of South Africa, 2005 Study
(WR2005). Water Research Commission (WRC) Report TT380/08, Pretoria.
Mucina, L. and Rutherford, M.C. (Eds). 2006. The vegetation of South Africa,
Lesotho and Swaziland. Strelitzia 19, South African National Biodiversity Institute,
Pretoria.
Pfab M. 2009. GDACE Requirements for Biodiversity Assessments. Directorate of
Nature Conservation, Johannesburg.
Ramsar Convention Secretariat. 2007a. Wise use of wetlands: A conceptual
framework for the wise use of wetlands. Ramsar handbooks for the wise use of
wetlands. 3rd Edition. Volume 1. Ramsar Convention Secretariat, Gland,
Switzerland.) (see http://www.ramsar.org/).
Ramsar Convention Secretariat. 2007b. Designating Ramsar sites: The strategic
framework and guidelines for the future development of the List of Wetlands of
Page 48
10MVA 132/11KV OLIFANTSHOEK SUBSTATIONSurface Water & Hydrological Impact Assessment Report August 2017
Specialist Wetland Assessment Page 44
International Importance. Ramsar handbooks for the wise use of wetlands. 3rd
Edition. Volume 14. Ramsar Convention Secretariat, Gland, Switzerland.
Page 49
10MVA 132/11KV OLIFANTSHOEK SUBSTATIONSurface Water & Hydrological Impact Assessment Report August 2017
Specialist Wetland Assessment Page 45
9 APPENDICES:
Appendix 1. Survey methods
The assessment was initiated with a survey of the pertinent literature, past reports
and the various conservation plans that exist for the study region. Maps and
Geographical Information Systems (GIS) were then employed to ascertain, which
portions of the proposed development, could have the greatest impact on the
wetlands and associated habitats.
A two-day site visit was then conducted (24th & 25th of January) to ground-truth
the above findings, thus allowing critical comment of the development when
assessing the possible impacts and delineating the wetland areas.
» The following equipment were utilized during field work.
• Canon EOS 450D Camera
• Garmin Etrex Legend GPS Receiver
• Bucket Soil Auger
• Munsell Soil Colour Chart (2000)
• Braun-Blanquet Data Form (for vegetation recording and general
environmental recordings).
Wetland and riparian areas were then assessed on the following basis:
» Identification and delineation of wetlands and riparian areas according to the
the procedures specified by DWAF (2005a)
» Vegetation type – verification of type and its state or condition based, supported
by species identification using Germishuizen and Meyer (2003), Vegmap
(Mucina and Rutherford, 2006 as amended) and the South African Biodiversity
Information Facility (SABIF) database.
» Plant species were further categorised as follows:
• Terrestrial: species are not directly related to any surface or groundwater
base-flows and persist solely on rainfall
• Facultative: species usually found in wetlands (inclusive of riparian systems)
(67 – 99% of occurrences), but occasionally found in terrestrial systems
(non-wetland) (DWAF, 2005)
• Obligate: species that are only found within wetlands (>99% of
occurrences) (DWAF, 2005)
» Assessment of the wetland type based on the NWCS method discussed below
and the required buffers
» Mitigation or recommendations required
Page 50
10MVA 132/11KV OLIFANTSHOEK SUBSTATIONSurface Water & Hydrological Impact Assessment Report August 2017
Specialist Wetland Assessment Page 46
Data sources consulted
The following date sources and GIS spatial information provided in the table below
was consulted to inform the assessment. The data type, relevance to the project
and source of the information has been provided.
Table 2: Information and data coverage’s used to inform the wetland assessment
Data/Coverage Type Relevence Source
Colour Aerial Photography (2009)
Mapping of wetlands and
other features
National Geo-Spatial
Information
Latest Google EarthTM imagery To supplement available
aerial photography
Google EarthTM On-line
Proposed power line routes and
substation locations.
Shows location to the
porposed powerline routes
and impacted zone
Client
NFEPA wetland Coverage Shows location fo FEPA river
and wetland sites.
CSIR (2011)
National Land-Cover Shows the land-use and
disturbances/transformations
within and around the
impacted zone.
DEA (2015)
SA National Land-Cover Shows the expected land
caracteristics including land
form & shape, geology, soil
types and slope gradients.
AGIS (2014)
Quaternary Drainage Regions Indicates the drainage region
and major tributaries and
water sources.
DWS (2009)
Present Ecological State of
watersources
Shows the present ecological
state of the affected non-
perennial watercourses
Kleynhans (1999)
National Wetland Classification System (NWCS 2010)
Since the late 1960’s, wetland classification systems have undergone a series of
international and national revisions. These revisions allowed for the inclusion of
additional wetland types, ecological and conservation rating metrics, together with
a need for a system that would allude to the functional requirements of any given
wetland (Ewart-Smith et al., 2006). Wetland function is a consequence of biotic
and abiotic factors, and wetland classification should strive to capture these
aspects.
Page 51
10MVA 132/11KV OLIFANTSHOEK SUBSTATIONSurface Water & Hydrological Impact Assessment Report August 2017
Specialist Wetland Assessment Page 47
The South African National Biodiversity Institute (SANBI) in collaboration with a
number of specialists and stakeholders developed the newly revised and now
accepted National Wetland Classification Systems (NWCS 2010). This system
comprises a hierarchical classification process of defining a wetland based on the
principles of the Hydrogeomorphic (HGM) approach at higher levels, with including
structural features at the finer or lower levels of classification (SANBI 2009).
Wetlands develop in a response to elevated water tables, linked either to rivers,
groundwater flows or seepage from aquifers (Parsons, 2004). These water levels
or flows then interact with localised geology and soil forms, which then determines
the form and function of the respective wetlands. Water is thus the common driving
force, in the formation of wetlands (DWAF, 2005). It is significant that the HGM
approach has now been included in wetland classification as the HGM approach has
been adopted throughout the water resources management realm with regard the
determination of the Present Ecological State (PES) and Ecological Importance and
Sensitivity (EIS) and WET-Health assessments for aquatic environments. All of
these systems are then easily integrated using the HGM approach in line with the
Eco-classification process of river and wetland reserve determinations used by the
Department of Water Affairs.
The NWCS process is provided in more detail in the methods section of the report,
but some of the terms and definitions used in this document are present below:
Definition Box Present
Ecological State is a term for the current ecological condition of the resource.
This is assessed relative to the deviation from the Reference State. Reference
State/Condition is the natural or pre-impacted condition of the system. The
reference state is not a static condition, but refers to the natural dynamics (range
and rates of change or flux) prior to development. The PES is determined per
component - for rivers and wetlands this would be for the drivers: flow, water
quality and geomorphology; and the biotic response indicators: fish,
macroinvertebrates, riparian vegetation and diatoms. PES categories for every
component would be integrated into an overall PES for the river reach or wetland
being investigated. This integrated PES is called the EcoStatus of the reach or
wetland.
EcoStatus is the overall PES or current state of the resource. It represents the
totality of the features and characteristics of a river and its riparian areas or
wetland that bear upon its ability to support an appropriate natural flora and
fauna and its capacity to provide a variety of goods and services. The EcoStatus
value is an integrated ecological state made up of a combination of various PES
Page 52
10MVA 132/11KV OLIFANTSHOEK SUBSTATIONSurface Water & Hydrological Impact Assessment Report August 2017
Specialist Wetland Assessment Page 48
findings from component EcoStatus assessments (such as for invertebrates, fish,
riparian vegetation, geomorphology, hydrology and water quality).
Reserve: The quantity and quality of water needed to sustain basic human needs
and ecosystems (e.g. estuaries, rivers, lakes, groundwater and wetlands) to
ensure ecologically sustainable development and utilisation of a water resource.
The Ecological Reserve pertains specifically to aquatic ecosystems.
Reserve requirements: The quality, quantity and reliability of water needed to
satisfy the requirements of basic human needs and the Ecological Reserve
(inclusive of instream requirements).
Ecological Reserve determination study: The study undertaken to determine
Ecological Reserve requirements.
Licensing applications: Water users are required (by legislation) to apply for
licenses prior to extracting water resources from a water catchment.
Ecological Water Requirements: This is the quality and quantity of water
flowing through a natural stream course that is needed to sustain instream
functions and ecosystem integrity at an acceptable level as determined during
an EWR study. These then form part of the conditions for managing achievable
water quantity and quality conditions as stipulated in the Reserve Template.
Water allocation process (compulsory licensing): This is a process where all
existing and new water users are requested to reapply for their licenses,
particularly in stressed catchments where there is an over-allocation of water or
an inequitable distribution of entitlements.
Ecoregions are geographic regions that have been delineated in a top-down
manner on the basis of physical/abiotic factors. • NOTE: For purposes of the
classification system, the ‘Level I Ecoregions’ for South Africa, Lesotho and
Swaziland (Kleynhans et al. 2005), which have been specifically developed by
the Department of Water Affairs & Forestry (DWAF) for rivers but are used for
the management of inland aquatic ecosystems more generally, are applied at
Level 2A of the classification system. These Ecoregions are based on
physiography, climate, geology, soils and potential natural vegetation.
Wetland definition
Although the National Wetland Classification System (SANBI, 2009) is used to
classify wetland types it is still necessary to understand the definition of a wetland.
Wetland definitions as with classification systems have changed over the years.
Terminology currently strives to characterise a wetland not only on its structure
(visible form), but also to relate this to the function and value of any given wetland.
The Ramsar Convention definition of a wetland is widely accepted as “areas of
marsh, fen, peatland or water, whether natural or artificial, permanent or
temporary, with water that is static or flowing, fresh, brackish or salt,
including areas of marine water the depth of which at low tide does not
Page 53
10MVA 132/11KV OLIFANTSHOEK SUBSTATIONSurface Water & Hydrological Impact Assessment Report August 2017
Specialist Wetland Assessment Page 49
exceed six metres” (Davis 1994). South Africa is a signatory to the Ramsar
Convention and therefore its extremely broad definition of wetlands has been
adopted for the proposed NWCS, with a few modifications.
Whereas the Ramsar Convention included marine water to a depth of six metres,
the definition used for the NWCS extends to a depth of ten metres at low tide, as
this is recognised seaward boundary of the shallow photic zone (Lombard et al.,
2005). An additional minor adaptation of the definition is the removal of the term
‘fen’ as fens are considered a type of peatland. The adapted definition for the
NWCS is, therefore, as follows (SANBI, 2009):
WETLAND: an area of marsh, peatland or water, whether natural or artificial,
permanent or temporary, with water that is static or flowing, fresh, brackish or salt,
including areas of marine water the depth of which at low tide does not exceed ten
metres.
This definition encompasses all ecosystems characterised by the permanent or
periodic presence of water other than marine waters deeper than ten metres. The
only legislated definition of wetlands in South Africa, however, is contained within
the National Water Act (Act No. 36 of 1998) (NWA), where wetlands are defined as
“land which is transitional between terrestrial and aquatic systems, where the water
table is usually at, or near the surface, or the land is periodically covered with
shallow water and which land in normal circumstances supports, or would support,
vegetation adapted to life in saturated soil.” This definition is consistent with more
precise working definitions of wetlands and therefore includes only a subset of
ecosystems encapsulated in the Ramsar definition. It should be noted that the
NWA definition is not concerned with marine systems and clearly distinguishes
wetlands from estuaries, classifying the later as a water course (SANBI, 2009).
The DWA is however reconsidering this position with regard the management of
estuaries due to the ecological needs of these systems with regard to water
allocation. Table 3 provides a comparison of the various wetlands included within
the main sources of wetland definition used in South Africa.
Although a subset of Ramsar-defined wetlands was used as a starting point for the
compilation of the first version of the National Wetland Inventory (i.e. “wetlands”,
as defined by the National Water Act, together with open waterbodies), it is
understood that subsequent versions of the Inventory include the full suite of
Ramsar-defined wetlands in order to ensure that South Africa meets its wetland
inventory obligations as a signatory to the Convention (SANBI, 2009).
Wetlands must therefore have one or more of the following attributes to meet the
above definition (DWAF, 2005):
Page 54
10MVA 132/11KV OLIFANTSHOEK SUBSTATIONSurface Water & Hydrological Impact Assessment Report August 2017
Specialist Wetland Assessment Page 50
» A high-water table that results in the saturation at or near the surface, leading
to anaerobic conditions developing in the top 50cm of the soil.
» Wetland or hydromorphic soils that display characteristics resulting from
prolonged saturation, i.e. mottling or grey soils
» The presence of, at least occasionally, hydrophilic plants, i.e. hydrophytes
(water loving plants).
It should be noted that riparian systems that are not permanently or periodically
inundated are not considered true wetlands, i.e. those associated with the drainage
lines.
Table 3: Comparison of ecosystems considered to be ‘wetlands’ as defined by the
proposed NWCS, the National Water Act (Act No. 36 of 1998), and
ecosystems are included in DWAF’s (2005) delineation manual.
Ecosystem NWCS “wetland”National Water Act
wetland
DWAF (2005)
delineation
manual
MarineYES NO NO
Estuarine YES NO NO
Waterbodies deeper than 2 m
(i.e. limnetic habitats often
describe as lakes or dams)
YES NO NO
Rivers, channels and canals YES NO1 NO
Inland aquatic ecosystems that
are not river channels and are
less than 2 m deep
YES YES YES
Riparian2 areas that are
permanently / periodically
inundated or saturated with
water within 50 cm of the
surface
YES YES YES3
Riparian areas that are not
permanently / periodically
inundated or saturated with
water within 50 cm of the
surface
NO NO YES3
1 Although river channels and canals would generally not be regarded as wetlands in terms of theNational Water Act, they are included as a ‘watercourse’ in terms of the Act2 According to the National Water Act and Ramsar, riparian areas are those areas that are saturated orflooded for prolonged periods would be considered riparian wetlands, opposed to non –wetland riparianareas that are only periodically inundated and the riparian vegetation persists due to having deep rootsystems drawing on water many meters below the surface.3 The delineation of ‘riparian areas’ (including both wetland and non-wetland components) is treated
separately to the delineation of wetlands in DWAF’s (2005) delineation manual.
Page 55
10MVA 132/11KV OLIFANTSHOEK SUBSTATIONSurface Water & Hydrological Impact Assessment Report August 2017
Specialist Wetland Assessment Page 51
Wetland importance and function
South Africa is a Contracting Party to the Ramsar Convention on Wetlands, signed
in Ramsar, Iran, in 1971, and has thus committed itself to this intergovernmental
treaty, which provides the framework for the national protection of wetlands and
the resources they could provide. Wetland conservation is now driven by the South
African National Biodiversity Institute, a requirement under the National
Environmental Management: Biodiversity Act (No 10 of 2004).
Wetlands are among the most valuable and productive ecosystems on earth,
providing important opportunities for sustainable development (Davies and Day,
1998). However, wetlands in South Africa are still rapidly being lost or degraded
through direct human induced pressures (Nel et al., 2004).
The most common attributes or goods and services provided by wetlands include:
» Improve water quality;
» Impede flow and reduce the occurrence of floods;
» Reeds and sedges used in construction and traditional crafts;
» Bulbs and tubers, a source of food and natural medicine;
» Store water and maintain base flow of rivers;
» Trap sediments; and
» Reduce the number of water borne diseases.
In the past wetland conservation, has focused on biodiversity as a means of
substantiating the protection of wetland habitat. However not all wetlands provide
such motivation for their protection, thus wetland managers and conservationists
began assessing the importance of wetland function within an ecosystem.
Table 4 summarises the importance of wetland function when related to ecosystem
services or ecoservices (Kotze et al., 2008). One such example is emergent reed
bed wetlands that function as transformers converting inorganic nutrients into
organic compounds (Mitsch and Gosselink, 2000).
Page 56
10MVA 132/11KV OLIFANTSHOEK SUBSTATIONSurface Water & Hydrological Impact Assessment Report August 2017
Specialist Wetland Assessment Page 52
Table 4: Summary of direct and indirect ecoservices provided by wetlands from
Kotze et al., 2008.
Wetl
an
db
en
efi
ts
(g
oo
ds
an
dserv
ices)
In
dir
ect
ben
efi
ts
Hydrological
benefits
Water purification
Sustained stream flow
Flood reduction
Ground water recharge/discharge
Erosion control
Biodiversity conservation – integrity & irreplaceability
Chemical cycling
Dir
ect
ben
efi
ts
Water supply
Provision of harvestable resources
Socio-cultural significance
Tourism and recreation
Education and research
Relevant wetland legislation and policy
Locally the South African Constitution, seven (7) Acts and two (2) international
treaties allow for the protection of wetlands and rivers. These systems are
protected from the destruction or pollution by the following:
» Section 24 of The Constitution of the Republic of South Africa;
» Agenda 21 – Action plan for sustainable development of the Department of
Environmental Affairs and Tourism (DEAT) 1998;
» The Ramsar Convention, 1971 including the Wetland Conservation Programme
(DEAT) and the National Wetland Rehabilitation Initiative (DEAT, 2000);
» National Environmental Management Act (NEMA), 1998 (Act No. 107 of 1998)
inclusive of all amendments, as well as the NEM: Biodiversity Act;
» National Water Act, 1998 (Act No. 36 of 1998);
» Conservation of Agricultural Resources Act, 1983 (Act No. 43 of 1983); and
» Minerals and Petroleum Resources Development Act, 2002 (Act No. 28 of 2002).
» Nature and Environmental Conservation Ordinance (No. 19 of 1974)
» National Forest Act (No. 84 of 1998)
» National Heritage Resources Act (No. 25 of 1999)
Apart from NEMA, the Conservation of Agricultural Resources Act (CARA), 1983
(Act No. 43 of 1983) will also apply to this project. The CARA has categorised a
large number of invasive plants together with associated obligations of the land
owner. A number of Category 1 & 2 plants were found at all of the sites
investigated, thus the contractors must take extreme care further spread of these
plants doesn’t occur. This should be done through proper stockpile management
(topsoil) and suitable rehabilitation of disturbed areas after construction.
Page 57
10MVA 132/11KV OLIFANTSHOEK SUBSTATIONSurface Water & Hydrological Impact Assessment Report August 2017
Specialist Wetland Assessment Page 53
An amendment of the National Environmental Management was promulgated late
December 2011, namely the Biodiversity Act or NEM:BA (Act No 10 of 2004), which
lists 225 threatened ecosystems based on vegetation type (Vegmap, 2006 as
amended). Should a vegetation type or ecosystem be listed, actions in terms of
NEM:BA are triggered.
Other policies that are relevant include:
» Provincial Nature Conservation Ordinance (PNCO) – Protected Flora. Any plants
found within the sites are described in the ecological assessment.
» National Freshwater Ecosystems Priority Areas – CSIR 2011 draft. This mapping
product highlights potential rivers and wetlands that should be earmarked for
conservation on a national basis.
National Wetland Classification System method
During this study, due to the nature of the wetlands and watercourses observed, it
was decided that the newly accepted National Wetlands Classification System
(NWCS) be adopted. This classification approach has integrated aspects of the
HGM approached used in the WET-Health system as well as the widely accepted
eco-classification approach used for rivers.
The NWCS (SANBI, 2009) as stated previously, uses hydrological and
geomorphological traits to distinguish the primary wetland units, i.e. direct factors
that influence wetland function. Other wetland assessment techniques, such as the
DWAF (2005) delineation method, only infer wetland function based on abiotic and
biotic descriptors (size, soils & vegetation) stemming from the Cowardin approach
(SANBI, 2009).
The classification system used in this study is thus based on SANBI (2009) and is
summarised below:
The NWCS has a six-tiered hierarchical structure, with four spatially nested primary
levels of classification (Figure 15). The hierarchical system firstly distinguishes
between Marine, Estuarine and Inland ecosystems (Level 1), based on the degree
of connectivity the particular systems has with the open ocean (greater than 10 m
in depth). Level 2 then categorises the regional wetland setting using a
combination of biophysical attributes at the landscape level, which operate at a
broad bioregional scale. This is opposed to specific attributes such as soils and
vegetation. Level 2 has adopted the following systems:
» Inshore bioregions (marine)
» Biogeographic zones (estuaries)
» Ecoregions (Inland)
Page 58
10MVA 132/11KV OLIFANTSHOEK SUBSTATIONSurface Water & Hydrological Impact Assessment Report August 2017
Specialist Wetland Assessment Page 54
Level 3 of the NWCS assess the topographical position of inland wetlands as this
factor broadly defines certain hydrological characteristics of the inland systems.
Four landscape units based on topographical position are used in distinguishing
between Inland systems at this level. No subsystems are recognised for Marine
systems, but estuaries are grouped according to their periodicity of connection with
the marine environment, as this would affect the biotic characteristics of the
estuary.
Level 4 classifies the hydrogeomorphic (HGM) units discussed earlier. The HGM
units are defined as follows:
(i) Landform – shape and localised setting of wetland
(ii) Hydrological characteristics – nature of water movement into, through and
out of the wetland
(iii) Hydrodynamics – the direction and strength of flow through the wetland.
These factors characterise the geomorphological processes within the wetland, such
as erosion and deposition, as well as the biogeochemical processes.
Level 5 of the assessment pertains to the classification of the tidal regime within
the marine and estuarine environments, while the hydrological and inundation
depth classes are determined for the inland wetlands. Classes are based on
frequency and depth of inundation, which are used to determine the functional unit
of the wetlands and are considered secondary discriminators within the NWCS.
Level 6 uses of six descriptors to characterise the wetland types on the basis of
biophysical features. As with Level 5, these are non-hierarchal in relation to each
other and are applied in any order, dependent on the availability of information.
The descriptors include:
(i) Geology;
(ii) Natural vs. Artificial;
(iii) Vegetation cover type;
(iv) Substratum;
(v) Salinity; and
(vi) Acidity or Alkalinity.
It should be noted that where sub-categories exist within the above descriptors,
hierarchical systems are employed, thus are nested in relation to each other.
The HGM unit (Level 4) is the focal point of the NWCS, with the upper levels
(Figure 15 – Inland systems only) providing means to classify the broad bio-
geographical context for grouping functional wetland units at the HGM level, while
Page 59
10MVA 132/11KV OLIFANTSHOEK SUBSTATIONSurface Water & Hydrological Impact Assessment Report August 2017
Specialist Wetland Assessment Page 55
the lower levels provide more descriptive detail on the particular wetland type
characteristics of a particular HGM unit. Therefore Level 1 – 5 deals with functional
aspects, while Level 6 classifies wetlands on structural aspects.
In the past wetland conservation, has focused on biodiversity as a means of
substantiating the protection of wetland habitat. However not all wetlands provide
such motivation for their protection, thus wetland managers and conservationists
began assessing the importance of wetland function within an ecosystem.
Figure 12: Basic structure of the National Wetland Classification System, showing
how ‘primary discriminators’ are applied up to Level 4 to classify
Hydrogeomorphic (HGM) Units, with ‘secondary discriminators’ applied at
Level 1:
System
» Connectivity to open ocean
WETLAND/AQUATIC ECOSYSTEM CONTEXT
LEVEL 2:
REGIONAL SETTING
LEVEL 3:
LANDSCAPE UNIT
DWA Level 1 Ecoregions
or
NFEPA WetVeg Groups
or
Other spatial frameworks
Valley floor
Slope
Plain
Bench (Hilltop/Saddle/Shelf)
FUNCTIONAL UNIT
LEVEL 4:
HYDROGEOMORPHIC (HGM) UNIT
LEVEL 5:
HYDROLOGICAL REGIME
River Perenniality
Floodplain wetland
Period and depth of inundation
and
Period of saturation
Channelled valley-bottom wetland
Unchannelled valley-bottom wetland
Depression
Seep
Wetland flat
WETLAND/AQUATIC ECOSYSTEM CHARACTERISTICS
LEVEL 6:
DESCRIPTORS
Natural vs. Artificial
Salinity
Ph
Substratum type
Vegetation type
Geology
Page 60
10MVA 132/11KV OLIFANTSHOEK SUBSTATIONSurface Water & Hydrological Impact Assessment Report August 2017
Specialist Wetland Assessment Page 56
Level 5 to classify the hydrological regime, and ‘descriptors’ applied at
Level 6 to categorise the characteristics of wetlands classified up to Level
5 (From SANBI, 2009).
The HGM unit (Level 4) is the focal point of the NWCS, with the upper levels
(Figure 15 – Inland systems only) providing means to classify the broad bio-
geographical context for grouping functional wetland units at the HGM level, while
the lower levels provide more descriptive detail on the particular wetland type
characteristics of a particular HGM unit. Therefore Level 1 – 5 deals with functional
aspects, while Level 6 classifies wetlands on structural aspects.
In the past wetland conservation, has focused on biodiversity as a means of
substantiating the protection of wetland habitat. However not all wetlands provide
such motivation for their protection, thus wetland managers and conservationists
began assessing the importance of wetland function within an ecosystem.
Wetland condition and conservation importance assessment
To assess the Present Ecological State (PES) or condition of the observed wetlands,
a modified Wetland Index of Habitat Integrity (DWAF, 2007) was used. The Wetland
Index of Habitat Integrity (WETLAND-IHI) is a tool developed for use in the National
Aquatic Ecosystem Health Monitoring Programme (NAEHMP), formerly known as
the River Health Programme (RHP). The output scores from the WETLAND-IHI
model are presented in the standard DWAF A-F ecological categories (Table 4), and
provide a score of the Present Ecological State of the habitat integrity of the wetland
system being examined. The author has included additional criteria into the model
based system to include additional wetland types. This system is preferred when
compared to systems such as WET-Health – wetland management series (WRC
2009), as WET-Health (Level 1) was developed with wetland rehabilitation in mind,
and is not always suitable for impact assessments. This coupled to degraded state
of the wetlands in the study area, a complex study approach was not warranted,
i.e. conduct a Wet-Health Level 2 and WET-Ecosystems Services study required for
an impact assessment.
Table 5: Description of A – F ecological categories based on Kleynhans et al.,
(2005).
ECOLOGICAL
CATEGORYECOLOGICAL DESCRIPTION MANAGEMENT PERSPECTIVE
A Unmodified, natural.
Protected systems; relatively
untouched by human hands; no
discharges or impoundments allowed
B
Largely natural with few modifications. A
small change in natural habitats and biota
Some human-related disturbance,
but mostly of low impact potential
Page 61
10MVA 132/11KV OLIFANTSHOEK SUBSTATIONSurface Water & Hydrological Impact Assessment Report August 2017
Specialist Wetland Assessment Page 57
may have taken place but the ecosystem
functions are essentially unchanged.
C
Moderately modified. Loss and change of
natural habitat and biota have occurred, but
the basic ecosystem functions are still
predominantly unchanged.
Multiple disturbances associated with
need for socio-economic
development, e.g. impoundment,
habitat modification and water
quality degradation
DLargely modified. A large loss of natural
habitat, biota and basic ecosystem
functions has occurred.
E
Seriously modified. The loss of natural
habitat, biota and basic ecosystem
functions is extensive.
Often characterized by high human
densities or extensive resource
exploitation. Management
intervention is needed to improve
health, e.g. to restore flow patterns,
river habitats or water quality
F
Critically / Extremely modified.
Modifications have reached a critical level
and the system has been modified
completely with an almost complete loss of
natural habitat and biota. In the worst
instances the basic ecosystem functions
have been destroyed and the changes are
irreversible.
The WETLAND-IHI model is composed of four modules. The “Hydrology”,
“Geomorphology” and “Water Quality” modules all assess the contemporary driving
processes behind wetland formation and maintenance. The last module,
“Vegetation Alteration”, provides an indication of the intensity of human land use
activities on the wetland surface itself and how these may have modified the
condition of the wetland. The integration of the scores from these 4 modules
provides an overall Present Ecological State (PES) score for the wetland system
being examined. The WETLAND-IHI model is an MS Excel-based model, and the
data required for the assessment are generated during a rapid site visit.
Additional data may be obtained from remotely sensed imagery (aerial photos;
maps and/or satellite imagery) to assist with the assessment. The interface of the
WETLAND-IHI has been developed in a format which is similar to DWAF’s River
EcoStatus models which are currently used for the assessment of PES in riverine
environments.
Conservation importance of the individual wetlands was based on the following
criteria:
» Habitat uniqueness
» Species of conservation concern
Page 62
10MVA 132/11KV OLIFANTSHOEK SUBSTATIONSurface Water & Hydrological Impact Assessment Report August 2017
Specialist Wetland Assessment Page 58
» Habitat fragmentation with regard ecological corridors
» Ecosystem service (social and ecological)
The presence of any or a combination of the above criteria would result in a HIGH
conservation rating if the wetland was found in a near natural state (high PES).
Should any of the habitats be found modified the conservation importance would
rate as MEDIUM, unless a Species of conservation concern was observed (HIGH).
Any systems that was highly modified (low PES) or had none of the above criteria,
received a LOW conservation importance rating.
Appendix 2. Assessment of Impacts
The Environmental Impact Assessment methodology assists in the evaluation of
the overall effect of a proposed activity on the environment. This includes an
assessment of the significant direct, indirect, and cumulative impacts. The
significance of environmental impacts is to be assessed by means of the criteria of
extent (scale), duration, magnitude (severity), probability (certainty) and direction
(negative, neutral or positive).
» The nature, which includes a description of what causes the effect, what will
be affected and how it will be affected.
» The extent, wherein it is indicated whether the impact will be local (limited to
the immediate area or site of development) or regional, and a value between 1
and 5 was assigned as appropriate (with 1 being low and 5 being high).
» The duration, wherein it was indicated whether:
» the lifetime of the impact will be of a very short duration (0 – 1 years) –
assigned a score of 1;
» the lifetime of the impact will be of a short duration (2 – 5 years) – assigned
a score of 2;
» medium-term (5 -15 years) – assigned a score of 3;
» long term (> 15 years) – assigned a score of 4; or
» permanent – assigned a score of 5;
» The magnitude, quantified on a scale from 0 – 10, where 0 is small and will
have no effect on the environment, 2 is minor and will not result in an impact
on processes, 4 is low and will cause a slight impact on processes, 6 is moderate
and will result in processes continuing but in a modified way, 8 is high
(processes are altered to the extent that they temporarily cease), and 10 is
very high and results in complete destruction of patterns and permanent
cessation of processes.
» The probability of occurrence, which describes the likelihood of the impact
actually occurring. Probability was estimated on a scale of 1 -5, where 1 is very
improbable (probably will not happen), 2 is improbable (some possibility, but
low likelihood), 3 is probable (distinct possibility), 4 is highly probable (most
Page 63
10MVA 132/11KV OLIFANTSHOEK SUBSTATIONSurface Water & Hydrological Impact Assessment Report August 2017
Specialist Wetland Assessment Page 59
likely) and 5 is definite (impact will occur regardless of any prevention
measures).
» The significance, was determined through a synthesis of the characteristics
described above and can be assessed as LOW, MEDIUM or HIGH; and
» the status, which was described as either positive, negative or neutral.
» the degree of which the impact can be reversed,
» the degree to which the impact may cause irreplaceable loss of resources,
» the degree to which the impact can be mitigated.
The significance was calculated by combining the criteria in the following formula:
S=(E+D+M)P where;
» S = Significance weighting
» E = Extent
» D = Duration
» M = Magnitude
» P = Probability
The significance weightings for each potential impact are as follows;
» < 30 points: LOW (i.e. where the impact would not have a direct influence on
the decision to develop in the area),
» 30 – 60 points: MEDIUM (i.e. where the impact could influence the decision to
develop in the area unless it is effectively mitigated),
» > 60 points: HIGH (i.e. where the impact must have an influence on the
decision process to develop in the area).
Appendix 3. Ecological Risk Assessment
The National Water Act (Act 36 of 1998) and its regulations call for the issue of a
Water Use Licence under certain conditions where a development or other activity
may impact on a water resource. Two key Sections in this regard are Section 21(c)
which covers activities which may “impede or divert” the flow of water in a
watercourse. The key trigger distances for consideration of an activity are 32m for
a watercourse and 500m for a wetland.
In order for the potential ecological impacts of the proposed development to be
assessed use was made of the Department of Water and Sanitation’s Risk
Assessment model to determine whether any streams of wetlands were likely to be
placed at risk as a result of the construction process. This tool is a spread sheet-
based model which considers the possible impacts of any activity on a water
resource. Risks or other relevant conditions are assigned a numeric score and
Page 64
10MVA 132/11KV OLIFANTSHOEK SUBSTATIONSurface Water & Hydrological Impact Assessment Report August 2017
Specialist Wetland Assessment Page 60
these scores are then manipulated to produce a final rating. See next few
paragraphs for a brief description of this scoring system and how it is applied to
the final rating. The ratings vary in value from 1 to 300 and are divided into three
classes as shown in Table 9.
» Risk Assessment Matrix (Based on DWS 2015 publication: Section
21(c) and (1) water use Risk Assessment Protocol)
The Risk Rating Table (Table 6) takes into account the nature of an impact and the
potential severity of the described impact on the resource quality of the affected
system expressed in terms of a combination of the following features: Flow Regime,
Water Quality (Physiological & Chemical), Habitat (Geomorphological & Vegetation)
and Biota.
The potential Consequence, Likelihood and finally Significance scores are then
automatically calculated with the rest of the parameters according to respective
Risk Rating Tables
» The Risk Assessment Key (Based on DWS 2015 publication: Section
21(c) and 1 water use Risk Assessment Protocol).
The severity is an expression of how the mentioned aspects will impact on
the quality (flow regime, water quality, geomorphology, biota and habitat)
and a value of 1 to 5 is assigned as appropriate (with 1 being
Insignificant/non-harmful and 5 being Disastrous/extremely harmful and/or
wetland(s) involved)
Table 6: The Risk Rating Table.Severity
No
.
Ph
ases
Activ
ity
Asp
ect
Im
pact
Flo
w
Reg
ime
Ph
ysic
o&
Ch
em
ical
(W
ate
r
Qu
ality
)
Hab
itat
(G
eom
orp
h
+
Vegeta
tion
)
Bio
ta
Sen
sitiv
ity
Severity
Sp
atia
lS
cale
Du
ratio
n
Co
nsequ
en
ce
Fre
qu
en
cy
of
activ
ity
Fre
qu
en
cy
of
imp
act
Leg
alis
su
es
Dete
ctio
n
Lik
elih
oo
d
Sig
nific
an
ce
Ris
kra
ting
Con
fiden
ce
Level
Con
trol
Measu
res
Bord
erlin
e
LO
W/M
OD
ER
ATE
Ratin
g
Cla
sses
PES
&EIS
of
Wate
rcou
rse
Page 65
10MVA 132/11KV OLIFANTSHOEK SUBSTATIONSurface Water & Hydrological Impact Assessment Report August 2017
Specialist Wetland Assessment Page 61
* Where “or wetland(s) are involved” it means that the activity is located
within the delineated boundary of any wetland. The score of 5 is only
compulsory for the significance rating.
The spatial scale is an estimation of how big the area is that is impacted
on by the relevant aspect. A value of 1 to 5 is assigned as appropriate,
where 1 is indicative of an area specific impact (at impact site) and 5
indicates that the impact is of a Global size (impacting beyond SA
boundary).
The duration, wherein the aspect’s proposed impact on the environment
and resource quality is:
• On day to one month, PES, EIS and/or REC not impacted – assigned a
score of 1;
• One month to one year, PES, EIS and/or REC impacted but no change in
status – assigned a score of 2;
• One year to 10 years, PES, EIS and/or REC impacted to a lower status
but can be improved over this period through mitigation – assigned a
score of 3;
• Life of the activity, PES, EIS and/or REC permanently lowered – assigned
a score of 4; and
• More than life of the organisation/facility, PES and EIS scores, an E or F
– assigned a score of 5.
* PES and EIS (Sensitivity) must be considered.
The frequency of the activity (how often is the activity executed?) is
estimated on a scale of 1 to 5, where 1 is annually or less, 2 is six monthly,
3 is monthly, 4 is weekly and 5 is daily.
Frequency of the incident/impact (how often does the activity impact
on the environment?) is estimated on a scale of 1 to 5 where 1 is almost
never / almost impossible / >20%; 2 is very seldom / highly unlikely /
>40%; 3 is infrequent / unlikely / seldom / 60%; 4 is often / regularly /
likely / possible / 80% and 5 is daily / highly likely / definitely / >100%.
Legal issues refer to any activities which are governed by legislation.
Where no legislation is applicable a value of 1 is assigned, whereas in the
case where any form of legislation is applicable for the specified activity, a
value of 5 should be assigned.
The detection of an impact/risk refers to the time / degree of difficulty
required to identify the impacts/risk (on resource quality etc.) caused by the
specified activity. A value of 1 to 5 is assigned, depending on the time and
difficulty, where:
• 1 is immediately;
• 2 is without much effort;
• 3 is with some effort;
• 4 is where observation is remote and difficult; and
• 5 is for Covered
Page 66
10MVA 132/11KV OLIFANTSHOEK SUBSTATIONSurface Water & Hydrological Impact Assessment Report August 2017
Specialist Wetland Assessment Page 62
» The Risk Assessment Calculations and Formulas (Based on DWS 2015
publication: Section 21(c) and 1 water use Risk Assessment Protocol).
Consequence
= Severity + Spatial Scale + Duration
Likelihood
= frequency of Activity + Frequency of Incident + Legal Issues + Detection
Significance/Risk
= Consequence X Likelihood
» The Calculated Risk/Significance (Based on DWS 2015 publication:
Section 21(c) and 1 water use Risk Assessment Protocol).
As mentioned the ratings vary in value from 1 to 300 and are divided into three
classes, as shown in Table 7.
* In the case where a LOW risk class have been obtained for all mentioned activities
a GA can be considered.
Table 7: Department of Water and Sanitation rating table for impacts on water
resources.
RATING CLASS MANAGEMENT DESCRIPTION
1 - 55 (L) Low Risk
Acceptable as is or consider requirement for mitigation. Impact to
watercourses and resource quality small and easily mitigated. Wetlands may
be excluded.
56 - 169 (M) Moderate Risk
Risk and impact on watercourses are notably and require mitigation
measures on a higher level, which cost more and require specialist input.
Wetlands are excluded.
170 - 300 (H) High Risk
Always involves wetlands. Watercourse(s) impacts by the activity are such
that they impose a long-term threat on a large scale and lowering of the
Reserve.