37
Surface Water Conversion Surface Water Conversion and CMAR and CMAR SuEllen Staggs SuEllen Staggs - - Director of Utilities Director of Utilities
| Date post: | 23-Jan-2015 |
| Category: |
Documents |
| Upload: | southeast-chapter-of-texas-awwa |
| View: | 1,110 times |
| Download: | 5 times |

Surface Water Conversion Surface Water Conversion
and CMARand CMARSuEllen Staggs SuEllen Staggs -- Director of UtilitiesDirector of Utilities
Presentation OutlinePresentation Outline
�� BackgroundBackground
�� Surface Water Treatment PlantSurface Water Treatment Plant
�� Water Quality Process DecisionsWater Quality Process Decisions
�� Project Delivery Project Delivery –– CMARCMAR
�� Next StepsNext Steps

Project BackgroundProject Background�� Fort Bend Subsidence District Regulation Fort Bend Subsidence District Regulation
in 2002in 2002
-- 30% conversion by 2013 (Phase I)30% conversion by 2013 (Phase I)
-- 60% conversion by 2025 (Phase II)60% conversion by 2025 (Phase II)
�� Road Map Road Map -- GRP approved 2007 GRP approved 2007
�� 18 Participants18 Participants
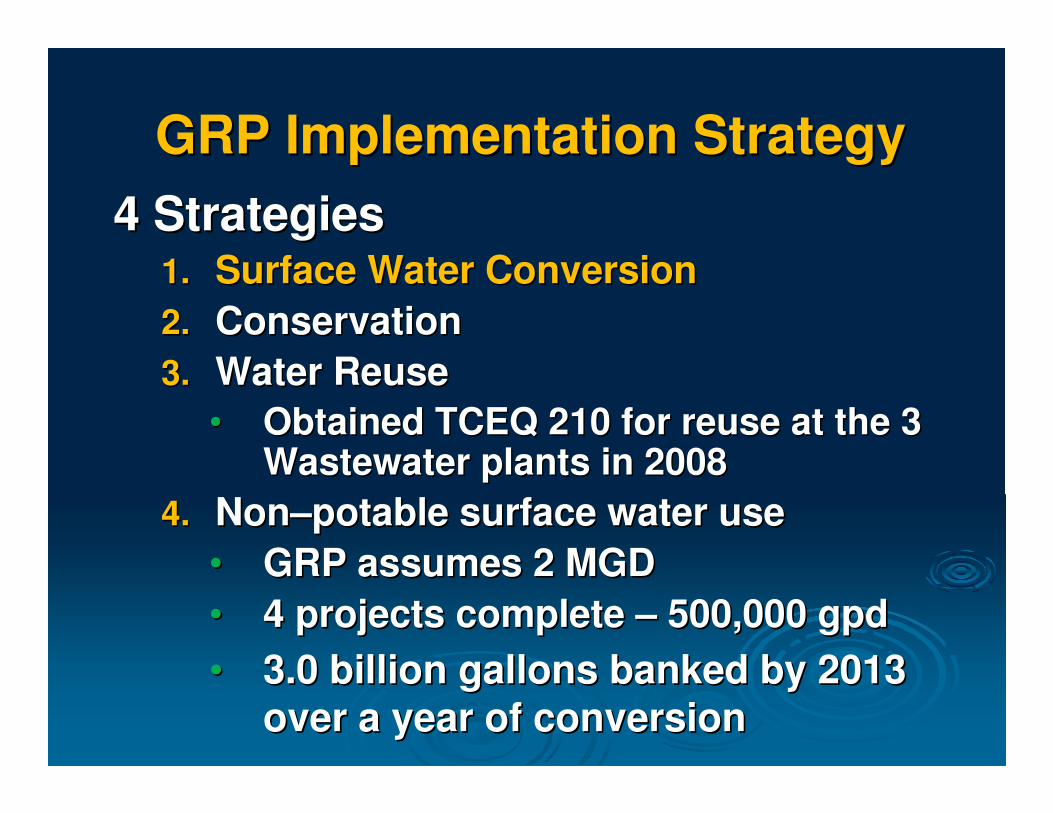
GRP Implementation StrategyGRP Implementation Strategy
4 Strategies 4 Strategies 1.1. Surface Water ConversionSurface Water Conversion
2.2. ConservationConservation
3.3. Water Reuse Water Reuse
•• Obtained TCEQ 210 for reuse at the 3 Obtained TCEQ 210 for reuse at the 3 Wastewater plants in 2008Wastewater plants in 2008
4.4. NonNon––potable surface water use potable surface water use
•• GRP assumes 2 MGD GRP assumes 2 MGD
•• 4 projects complete 4 projects complete –– 500,000 gpd500,000 gpd
•• 3.0 billion gallons banked by 2013 3.0 billion gallons banked by 2013
over a year of conversionover a year of conversion
Surface Water Surface Water
Treatment PlantTreatment Plant

SWTP Implementation StrategySWTP Implementation Strategy
�� Surface Water Plant Size Surface Water Plant Size �� 9 MGD operational in 20139 MGD operational in 2013
�� Expand to 22 MGD in 2025Expand to 22 MGD in 2025
�� MF/UF Membrane Filtration (RO provision 2025)MF/UF Membrane Filtration (RO provision 2025)
�� Build base load plant Build base load plant -- 9 mgd 365 days year9 mgd 365 days year
�� Over convert dense areas Over convert dense areas –– minimize minimize transmission lines transmission lines
�� Surface water delivered to groundwater Surface water delivered to groundwater plants for distribution and blending to plants for distribution and blending to minimize changes in taste minimize changes in taste
�� Peak water demands met from groundwater Peak water demands met from groundwater
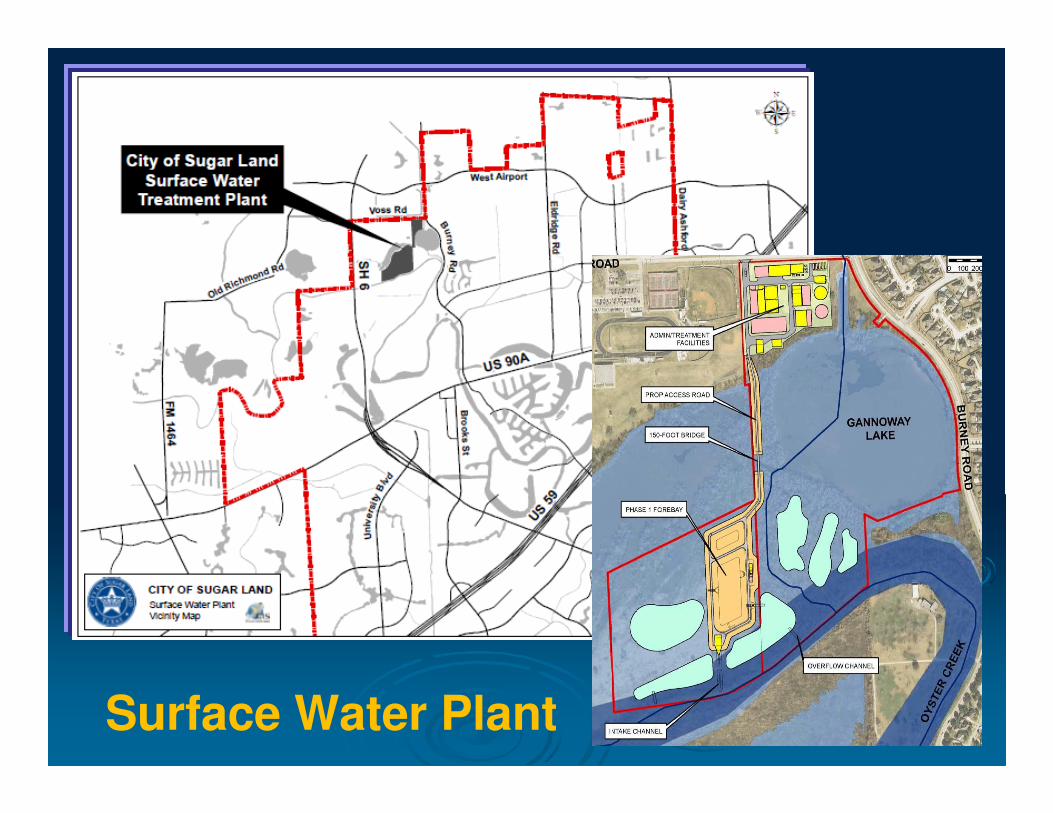
Surface Water Plant Surface Water Plant
Surface Water Plant

FullFull--scale Plant Locationscale Plant Location
Voss RoadBurney Road
Gannoway Lake
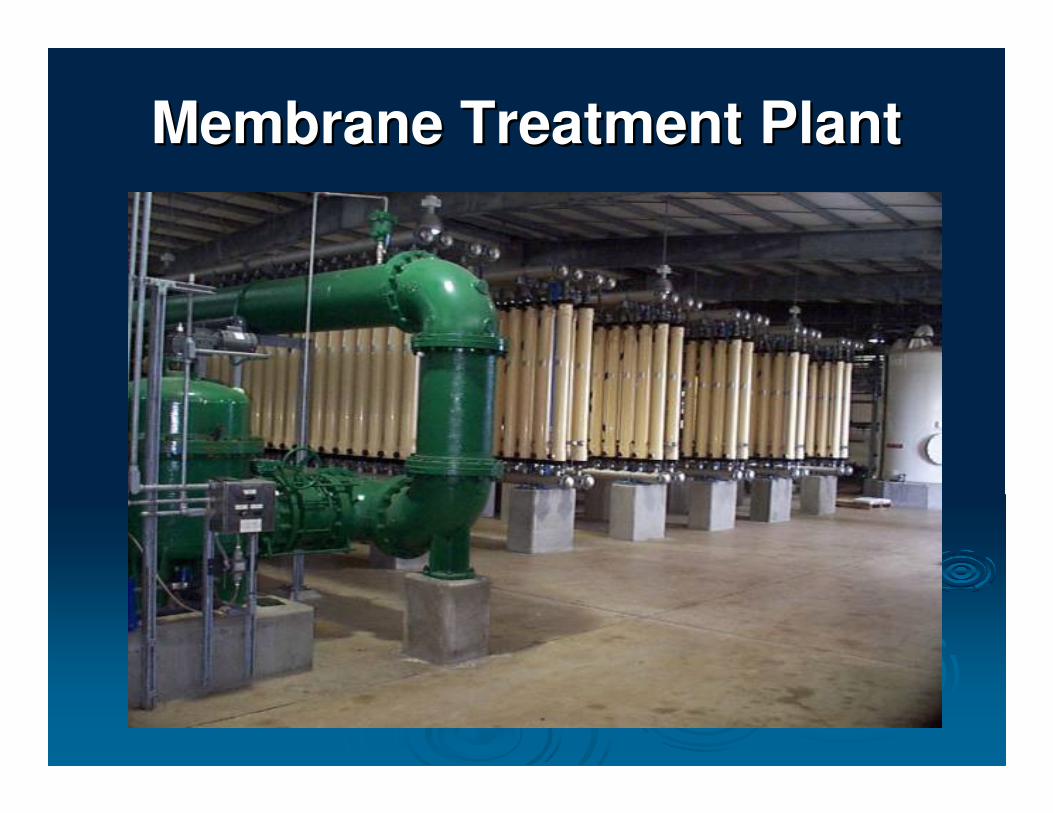
Membrane Treatment PlantMembrane Treatment Plant

Transmission Transmission
LinesLines�� Take points Take points
are Cityare City’’s s
water plantswater plants
�� Phase I Phase I –– 20132013
�� Solid LinesSolid Lines
�� Phase II Phase II -- 20252025
�� Dashed LinesDashed Lines
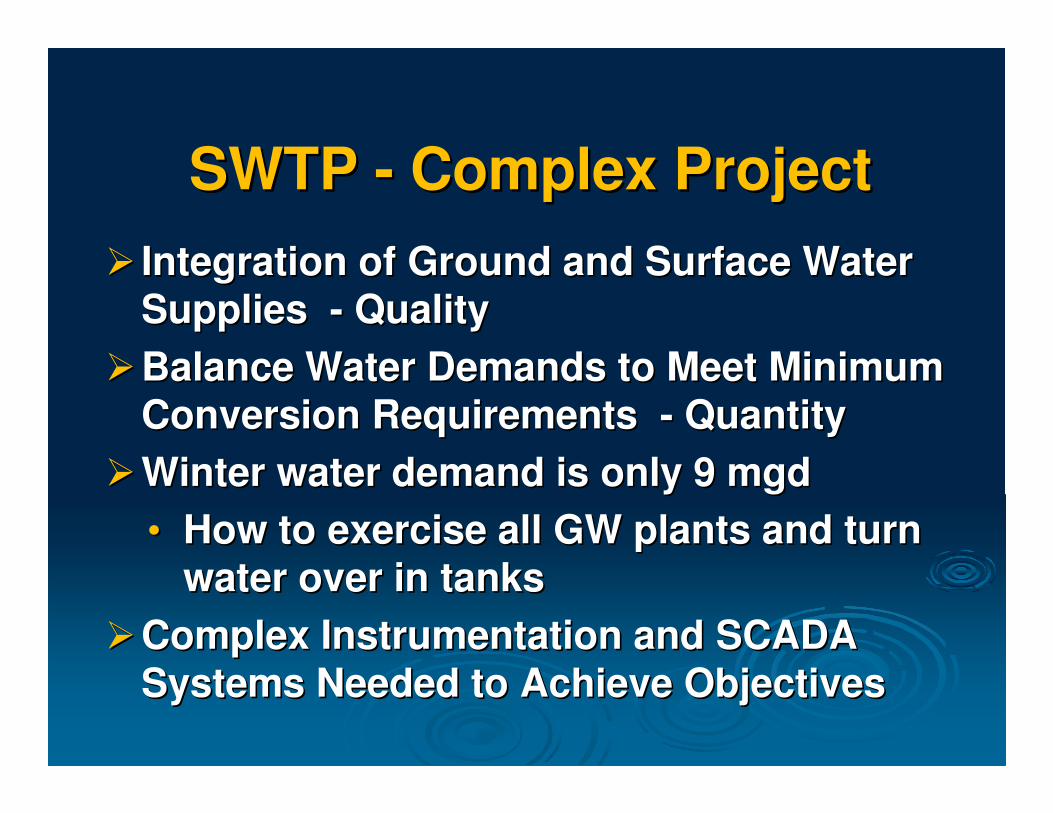
SWTP SWTP -- Complex ProjectComplex Project
�� Integration of Ground and Surface Water Integration of Ground and Surface Water
Supplies Supplies -- QualityQuality
��Balance Water Demands to Meet Minimum Balance Water Demands to Meet Minimum
Conversion Requirements Conversion Requirements -- QuantityQuantity
��Winter water demand is only 9 mgdWinter water demand is only 9 mgd
•• How to exercise all GW plants and turn How to exercise all GW plants and turn
water over in tankswater over in tanks
��Complex Instrumentation and SCADA Complex Instrumentation and SCADA
Systems Needed to Achieve ObjectivesSystems Needed to Achieve Objectives

Water QualityWater Quality
Process DecisionsProcess Decisions
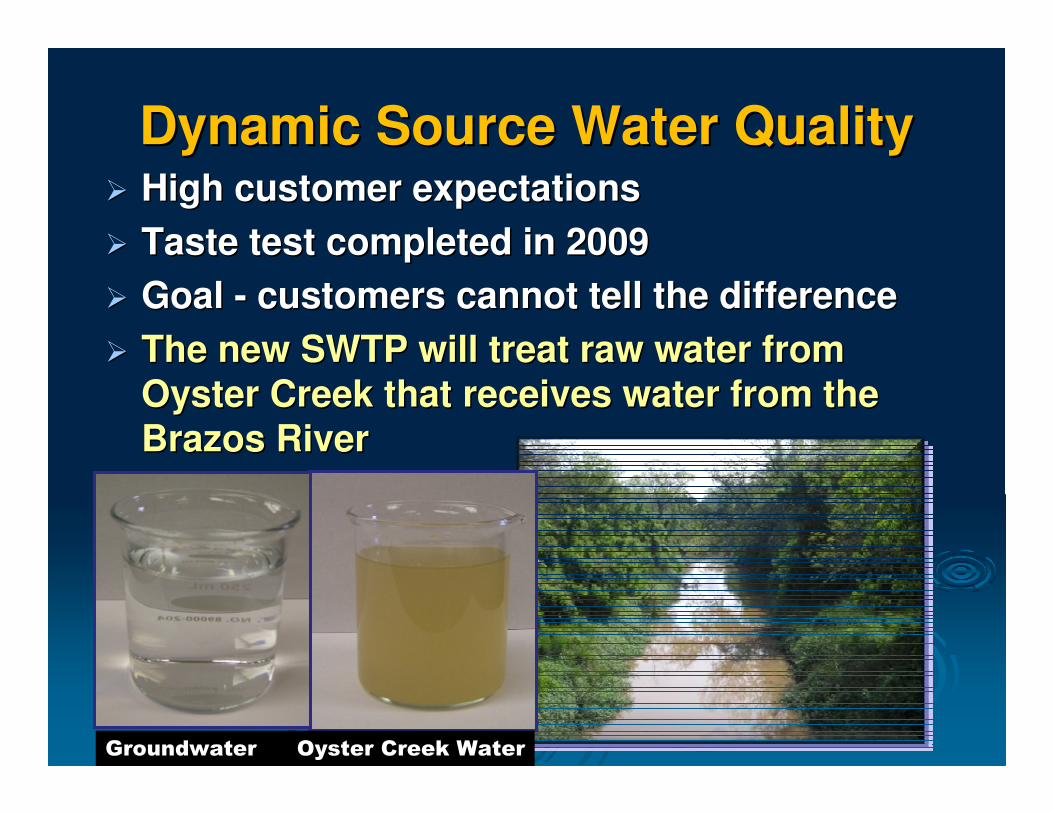
Dynamic Source Water QualityDynamic Source Water Quality�� High customer expectationsHigh customer expectations
�� Taste test completed in 2009Taste test completed in 2009
�� Goal Goal -- customers cannot tell the differencecustomers cannot tell the difference
�� The new SWTP will treat raw water from The new SWTP will treat raw water from
Oyster Creek that receives water from the Oyster Creek that receives water from the
Brazos RiverBrazos River
Oyster Creek WaterGroundwater

Water Quality GoalsWater Quality Goals
�� Meet and exceed all regulatory Meet and exceed all regulatory
requirementsrequirements�� Bromate < 5 Bromate < 5 µµg/Lg/L
�� THMs/HAAs < 64/48 THMs/HAAs < 64/48 µµg/L for LRAAsg/L for LRAAs
�� CryptosporidiumCryptosporidium �������� 44--log removallog removal
�� Aesthetic quality goalsAesthetic quality goals�� MIB/geosmin < 5 ng/L (most); < 10 ng/L (peak)MIB/geosmin < 5 ng/L (most); < 10 ng/L (peak)
�� Chloride < 180 mg/L (most); < 250 mg/L (peak)Chloride < 180 mg/L (most); < 250 mg/L (peak)

Finished Water Quality GoalsWater Quality
Parameter Regulation Goals
Turbidity < 0.3 NTU in 95% of time <= 0.05 NTU in 95% of time
Giardia 2 log removal 4 log removal
Cryptosporidium Based -Raw Water Quality 4 log removal
Viruses Inactivation > 1 ratio >1 ratioChloramine Residual 0.5 mg/L - 4.0 mg/L 2.5 mg/L - 4.0 mg/LTOC Removal 25% - 45% > 45%
Total (TTHM) < 80 mg/L < 64 mg/LTotal (HAA5) < 60 mg/L < 48 mg/L
Color (color units) < 15 color units < 5 true color unitsTaste and Odor < 3 TON < 3 TON
Geosmin/MIB < 10 ng/L
pH > 7.07.0 - 7.9 as dictated by the corrosion control strategy
Fluoride < 4 mg/L 0.8 mg/L
Chloride <300 mg/L < 200 mg/LManganese < 0.05 mg/L < 0.015 mg/L
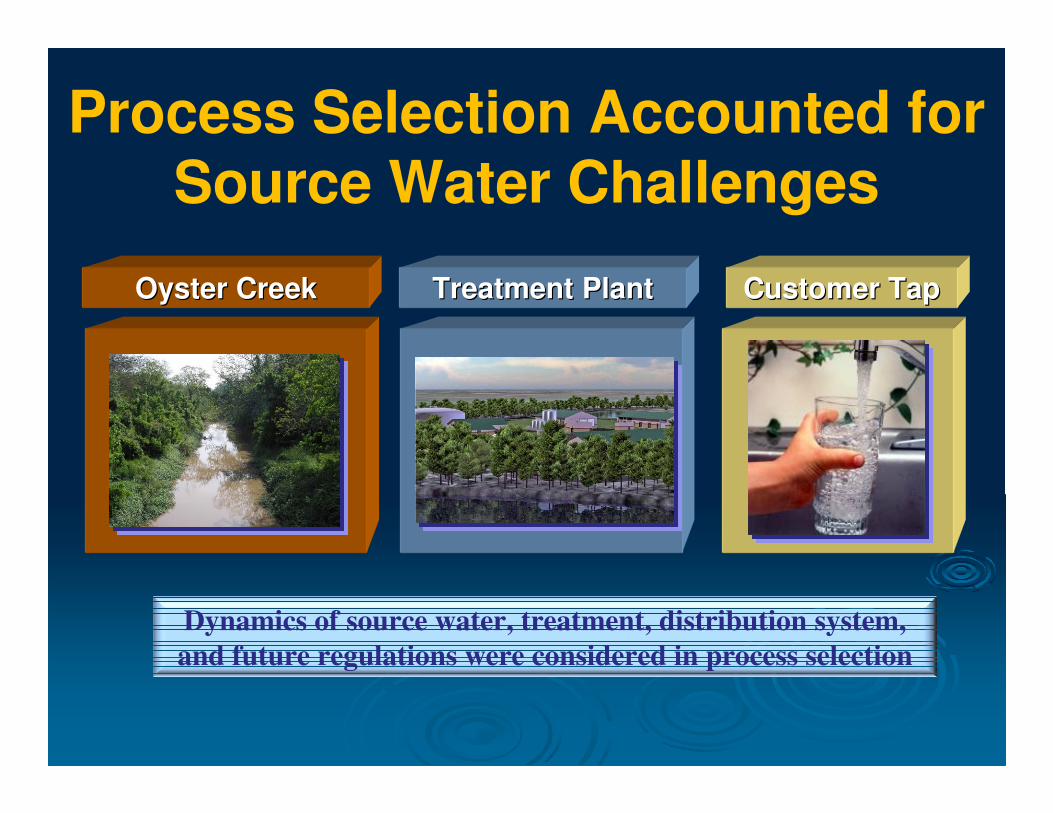
Oyster CreekOyster Creek Treatment PlantTreatment Plant Customer TapCustomer Tap
Process Selection Accounted for Source Water Challenges
Dynamics of source water, treatment, distribution system,
and future regulations were considered in process selection
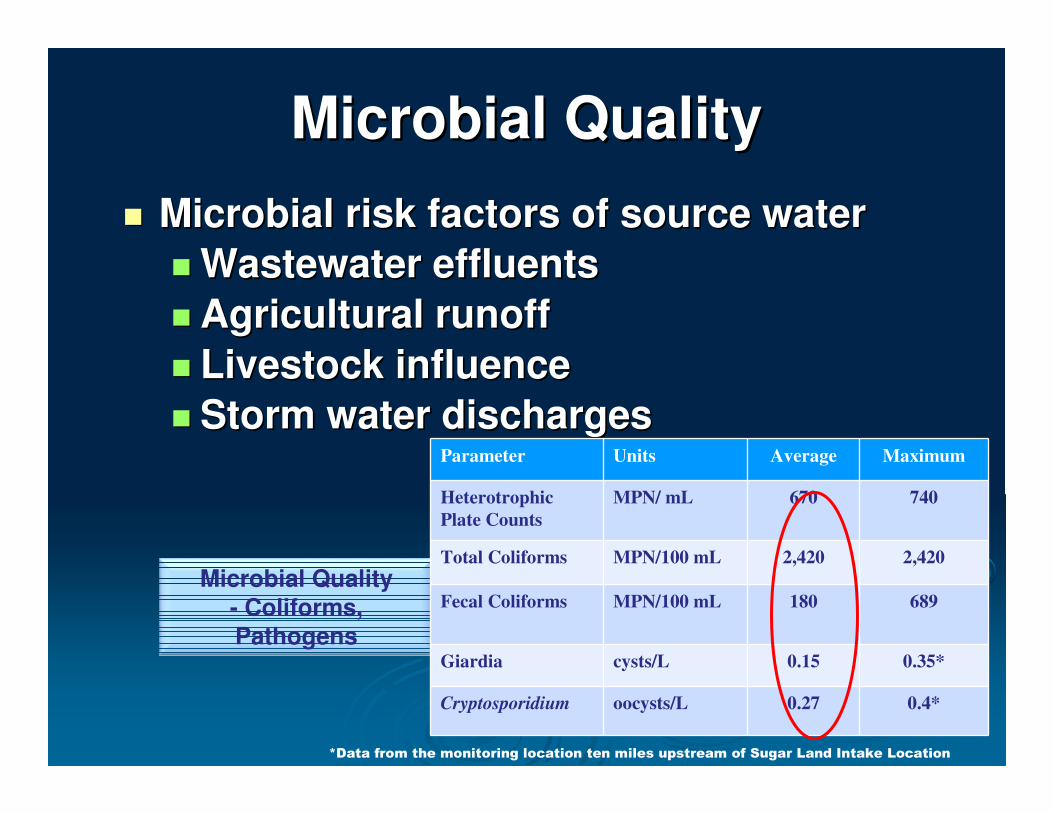
Microbial QualityMicrobial Quality
Microbial Quality- Coliforms, Pathogens
�� Microbial risk factors of source waterMicrobial risk factors of source water
�� Wastewater effluentsWastewater effluents
�� Agricultural runoffAgricultural runoff
�� Livestock influenceLivestock influence
�� Storm water dischargesStorm water dischargesParameter Units Average Maximum
Heterotrophic
Plate Counts
MPN/ mL 670 740
Total Coliforms MPN/100 mL 2,420 2,420
Fecal Coliforms MPN/100 mL 180 689
Giardia cysts/L 0.15 0.35*
Cryptosporidium oocysts/L 0.27 0.4*
*Data from the monitoring location ten miles upstream of Sugar Land Intake Location
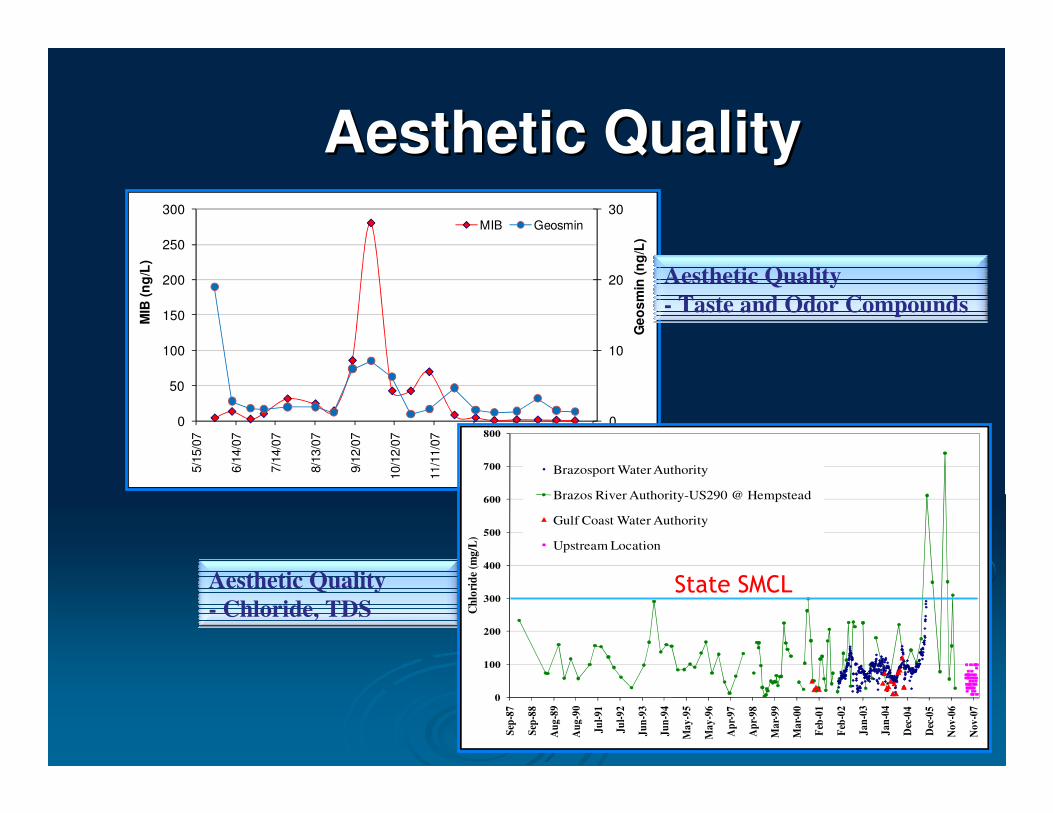
Aesthetic QualityAesthetic Quality
Aesthetic Quality
- Chloride, TDS
0
10
20
30
0
50
100
150
200
250
3005/1
5/0
7
6/1
4/0
7
7/1
4/0
7
8/1
3/0
7
9/1
2/0
7
10/1
2/0
7
11/1
1/0
7
12/1
1/0
7
1/1
0/0
8
2/9
/08
3/1
0/0
8
Ge
os
min
(n
g/L
)
MIB
(n
g/L
)
MIB Geosmin
0
100
200
300
400
500
600
700
800
Sep
-87
Sep
-88
Au
g-8
9
Au
g-9
0
Ju
l-9
1
Ju
l-9
2
Ju
n-9
3
Ju
n-9
4
Ma
y-9
5
Ma
y-9
6
Ap
r-9
7
Ap
r-9
8
Ma
r-9
9
Ma
r-0
0
Feb
-01
Feb
-02
Ja
n-0
3
Ja
n-0
4
Dec
-04
Dec
-05
No
v-0
6
No
v-0
7
Ch
lori
de
(mg
/L)
Brazosport Water Authority
Brazos River Authority-US290 @ Hempstead
Gulf Coast Water Authority
Upstream Location
State SMCL
Aesthetic Quality
- Taste and Odor Compounds

Alternatives for T&O Removal Alternatives for T&O Removal
�� Alternative 1 Alternative 1 –– TwoTwo--stage GACstage GAC
�� Lead/lag GACLead/lag GAC
�� Alternative 2 Alternative 2 –– Ozone followed by GACOzone followed by GAC
�� Alternative 3 Alternative 3 –– SingleSingle--stage GACstage GAC
• PAC was considered and eliminated during process short listing phase

T&O Process SelectionT&O Process Selection
LifeLife
CycleCycle
AssessmentAssessment
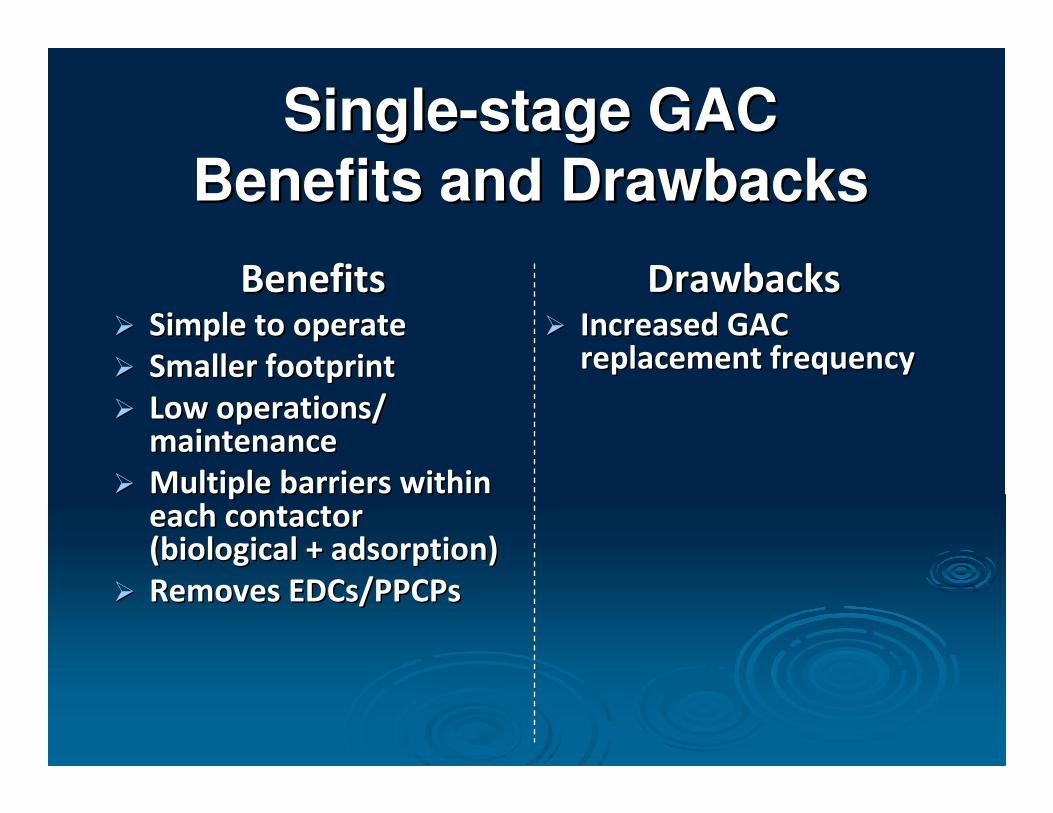
SingleSingle--stage GAC stage GAC
Benefits and DrawbacksBenefits and Drawbacks
BenefitsBenefits�� Simple to operateSimple to operate
�� Smaller footprintSmaller footprint
�� Low operations/ Low operations/ maintenancemaintenance
�� Multiple barriers within Multiple barriers within each contactor each contactor (biological + adsorption)(biological + adsorption)
�� Removes EDCs/PPCPsRemoves EDCs/PPCPs
DrawbacksDrawbacks�� Increased GAC Increased GAC
replacement frequencyreplacement frequency
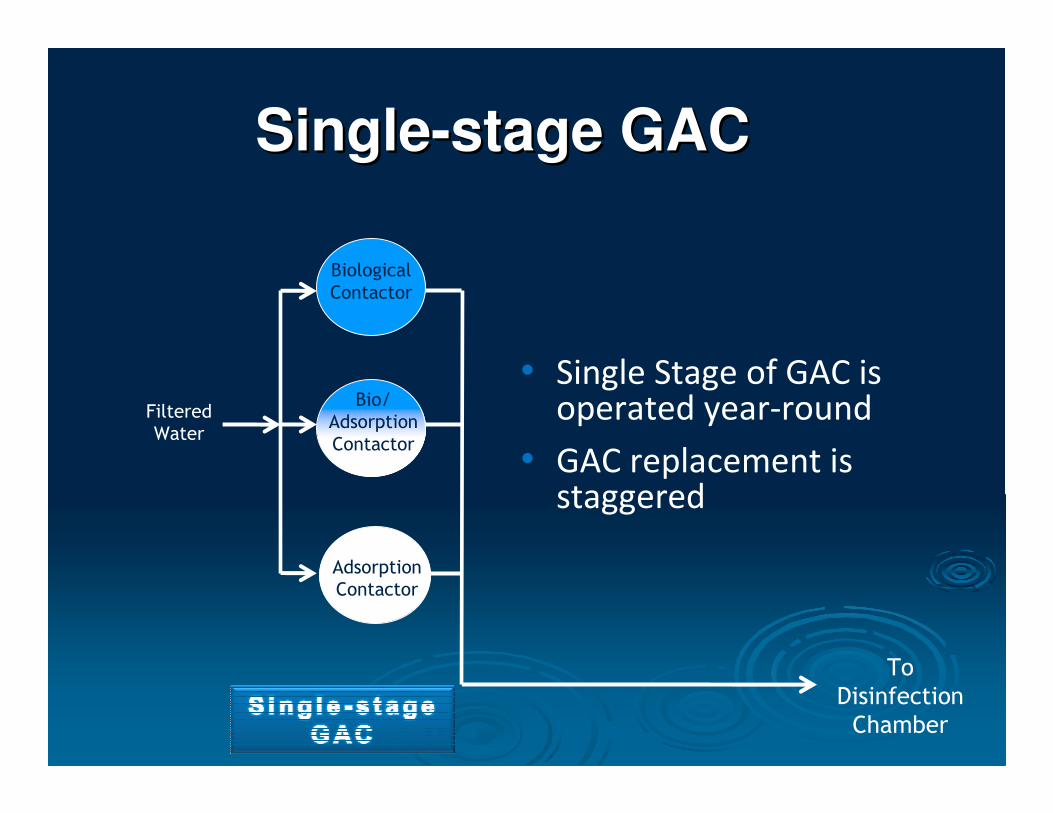
SingleSingle--stage GACstage GAC
Bio/
Adsorption
Contactor
Biological
Contactor
Filtered
Water
To
Disinfection
Chamber
• Single Stage of GAC is operated year-round
• GAC replacement is staggered
Adsorption
Contactor
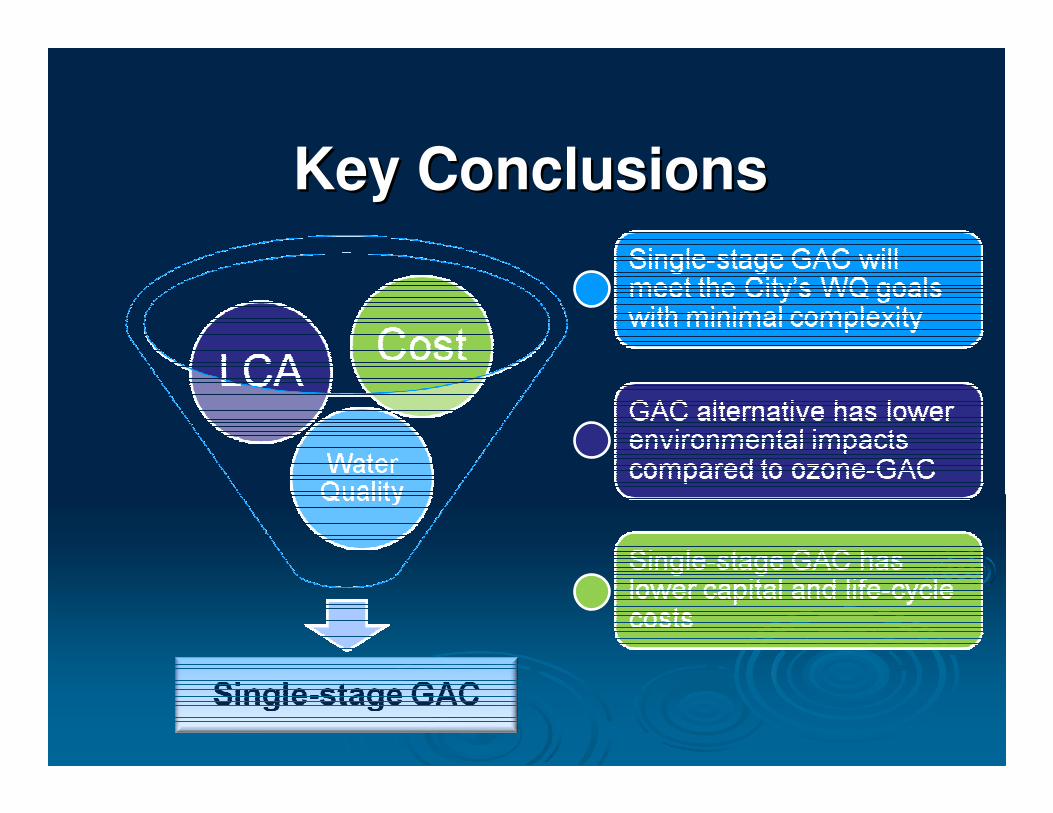
Key ConclusionsKey Conclusions
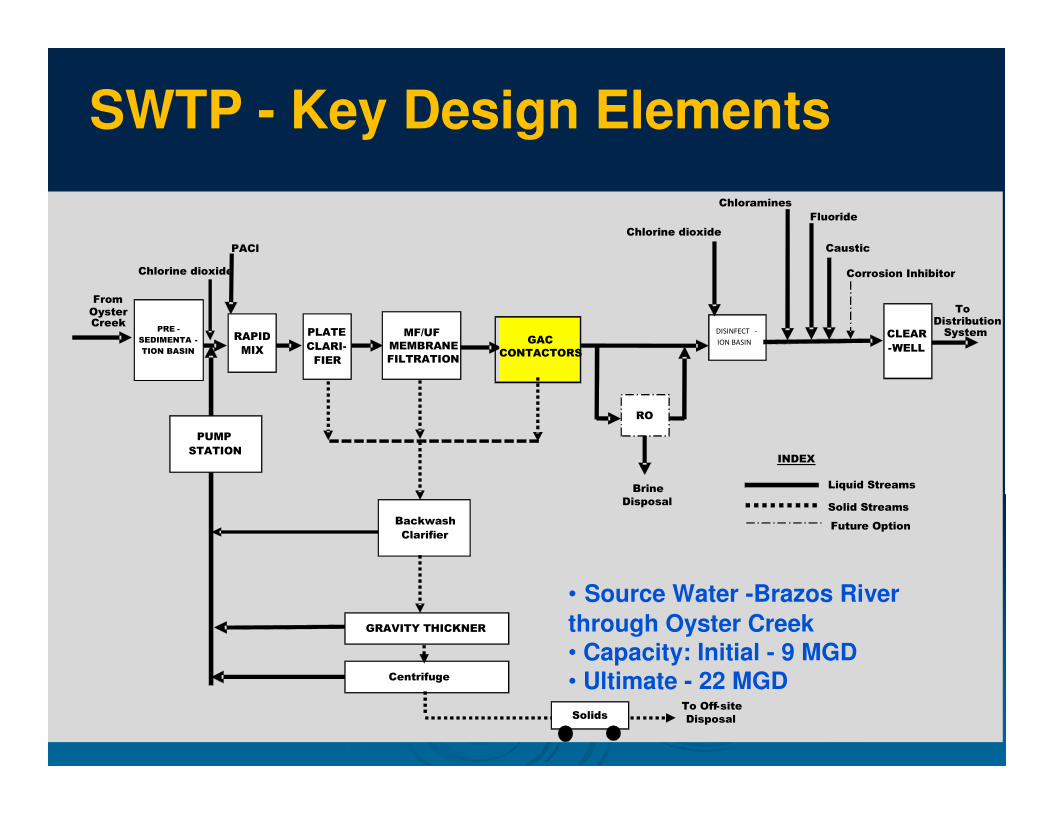
PLATE
CLARI-
FIER
MF/UF
MEMBRANE
FILTRATION
GRAVITY THICKNER
PUMP
STATIONINDEX
Solid Streams
Liquid Streams
PRE -
SEDIMENTA -
TION BASIN
CLEAR
-WELLRAPID
MIX
Chlorine dioxide
GAC
CONTACTORS
Fluoride
Caustic
RO
PACl
Centrifuge
SolidsTo Off-site
Disposal
Brine
Disposal
DISINFECT -
ION BASIN
From Oyster Creek
Chlorine dioxide
Chloramines
To Distribution System
Future Option
Corrosion Inhibitor
Backwash
Clarifier
SWTP - Key Design Elements
• Source Water -Brazos River
through Oyster Creek• Capacity: Initial - 9 MGD• Ultimate - 22 MGD

Project DeliveryProject Delivery
Construction Manager at Risk Construction Manager at Risk
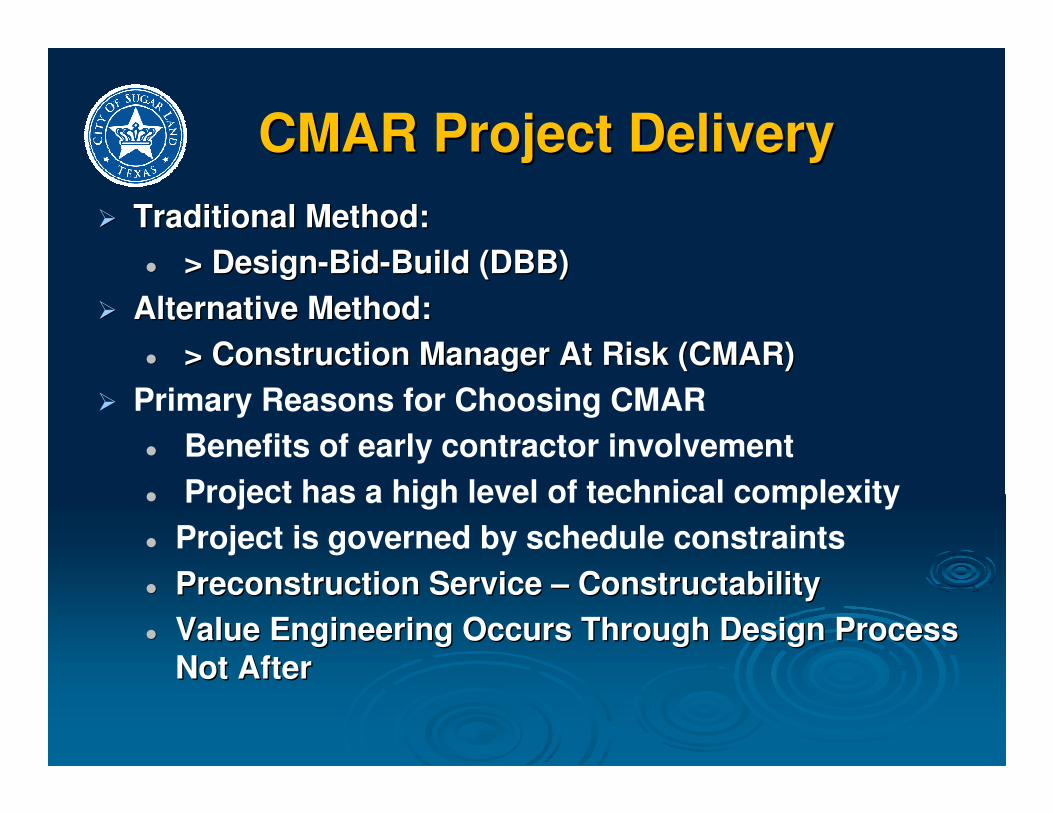
CMAR Project DeliveryCMAR Project Delivery
�� Traditional Method: Traditional Method:
�� > Design> Design--BidBid--Build (DBB)Build (DBB)
�� Alternative Method:Alternative Method:
�� > Construction Manager At Risk (CMAR)> Construction Manager At Risk (CMAR)
� Primary Reasons for Choosing CMAR
� Benefits of early contractor involvement
� Project has a high level of technical complexity
� Project is governed by schedule constraints
�� Preconstruction Service Preconstruction Service –– ConstructabilityConstructability
�� Value Engineering Occurs Through Design Process Value Engineering Occurs Through Design Process
Not AfterNot After
Why CMAR? Why CMAR?
Define Goals & Desires:Define Goals & Desires:�� Well functioned, long lasting, & lowest lifecycle Well functioned, long lasting, & lowest lifecycle
cost plantcost plant
�� Value engineering during design constructabilityValue engineering during design constructability
�� Operable facility testedOperable facility tested
�� Selected a builder during designSelected a builder during design
�� Open book accountingOpen book accounting
�� Owner can provide input in vendor & Owner can provide input in vendor &
subcontractor selection subcontractor selection
�� Select subs and vendors based on bids and City Select subs and vendors based on bids and City
approvalapproval
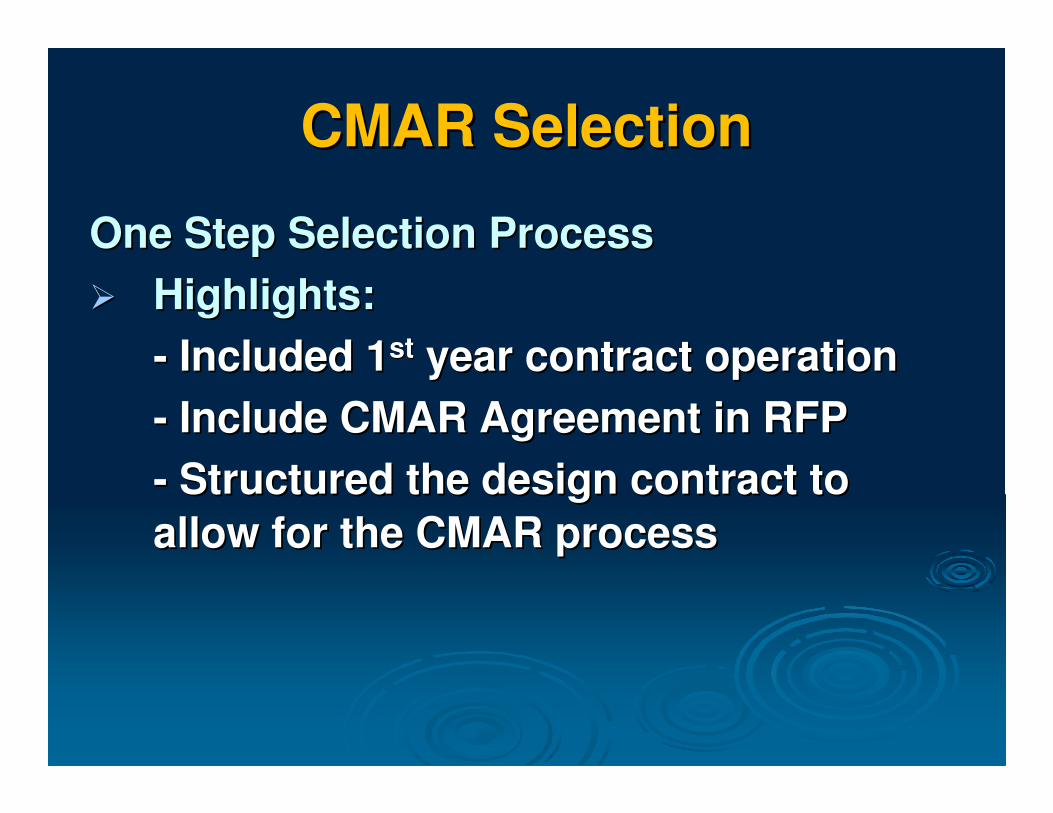
CMAR SelectionCMAR Selection
One Step Selection Process One Step Selection Process
�� Highlights:Highlights:
-- Included 1Included 1stst year contract operationyear contract operation
-- Include CMAR Agreement in RFPInclude CMAR Agreement in RFP
-- Structured the design contract to Structured the design contract to
allow for the CMAR processallow for the CMAR process

Sugar LandSugar Land’’s CMAR Contracts CMAR Contract
Three distinct phases that are authorized Three distinct phases that are authorized
separatelyseparately
�� CMAR Contract 3/10 CMAR Contract 3/10 –– 3/143/14
1.1. Pre Construction services Pre Construction services -- VEVE
2.2. Construction Phase ServicesConstruction Phase Services
•• CMAR becomes general contractorCMAR becomes general contractor
3.3. First Year OperationsFirst Year Operations
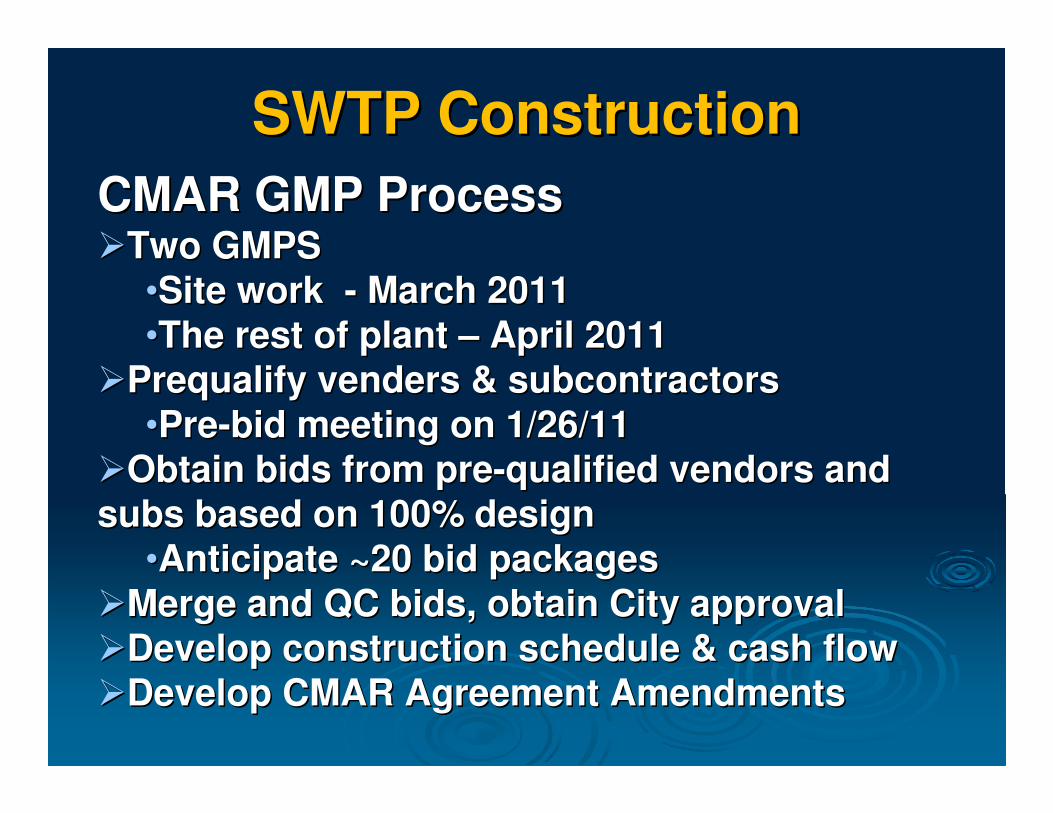
SWTP ConstructionSWTP Construction
CMAR GMP ProcessCMAR GMP Process��Two GMPS Two GMPS
••Site work Site work -- March 2011March 2011
••The rest of plant The rest of plant –– April 2011April 2011
��Prequalify venders & subcontractorsPrequalify venders & subcontractors
••PrePre--bid meeting on 1/26/11bid meeting on 1/26/11
��Obtain bids from preObtain bids from pre--qualified vendors and qualified vendors and
subs based on 100% design subs based on 100% design
••Anticipate ~20 bid packagesAnticipate ~20 bid packages
��Merge and QC bids, obtain City approvalMerge and QC bids, obtain City approval
��Develop construction schedule & cash flowDevelop construction schedule & cash flow
��Develop CMAR Agreement AmendmentsDevelop CMAR Agreement Amendments
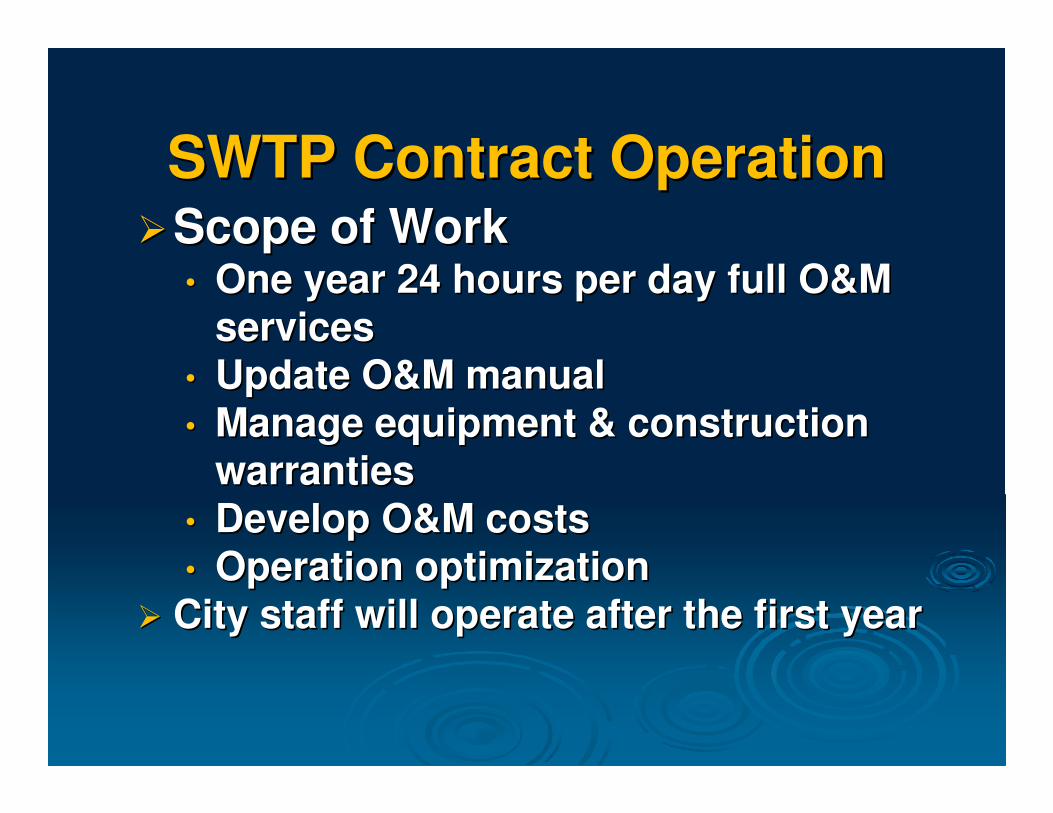
SWTP Contract OperationSWTP Contract Operation��Scope of Work Scope of Work
•• One year 24 hours per day full O&M One year 24 hours per day full O&M
servicesservices
•• Update O&M manualUpdate O&M manual
•• Manage equipment & construction Manage equipment & construction
warrantieswarranties
•• Develop O&M costs Develop O&M costs
•• Operation optimizationOperation optimization
�� City staff will operate after the first yearCity staff will operate after the first year
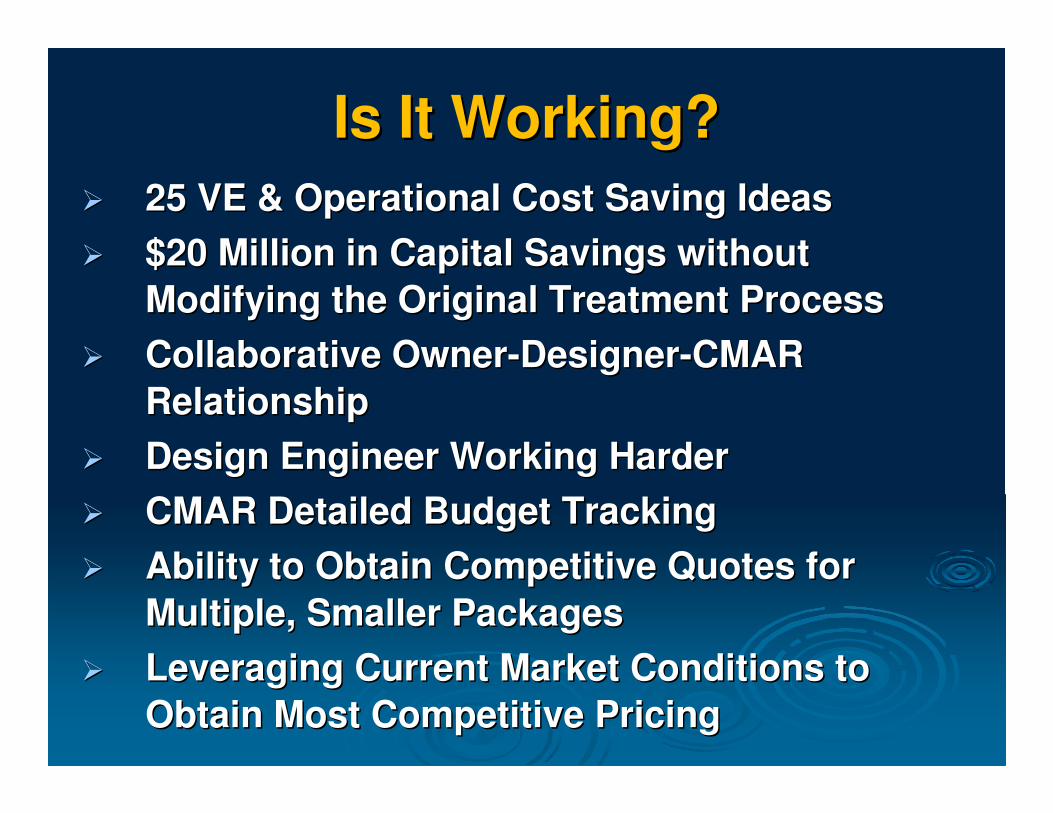
Is It Working?Is It Working?
�� 25 VE & Operational Cost Saving Ideas25 VE & Operational Cost Saving Ideas
�� $20 Million in Capital Savings without $20 Million in Capital Savings without
Modifying the Original Treatment ProcessModifying the Original Treatment Process
�� Collaborative OwnerCollaborative Owner--DesignerDesigner--CMAR CMAR
RelationshipRelationship
�� Design Engineer Working HarderDesign Engineer Working Harder
�� CMAR Detailed Budget TrackingCMAR Detailed Budget Tracking
�� Ability to Obtain Competitive Quotes for Ability to Obtain Competitive Quotes for
Multiple, Smaller PackagesMultiple, Smaller Packages
�� Leveraging Current Market Conditions to Leveraging Current Market Conditions to
Obtain Most Competitive PricingObtain Most Competitive Pricing

Surface Water Capital Surface Water Capital
Improvement ProjectsImprovement Projects
�� Surface Water Plant Surface Water Plant $69,000,000$69,000,000
�� Transmission LinesTransmission Lines $19,700,000$19,700,000
�� Groundwater plant upgrades $8,800,000Groundwater plant upgrades $8,800,000
�� CIP Construction Estimate $97,500,000CIP Construction Estimate $97,500,000�� Challenging site constraintsChallenging site constraints
�� Expandability Expandability -- Some components sized for 2025 Some components sized for 2025
expansion or ease of expansionexpansion or ease of expansion

Raw Water Intake DesignRaw Water Intake Design
Dam Safety
Financial CapacityFinancial Capacity
�� City determined that Certificates of City determined that Certificates of
Obligation with pledge of GRP fees more Obligation with pledge of GRP fees more
cost effective than revenue bondscost effective than revenue bonds
�� Lower cost of borrowingLower cost of borrowing
�� No bond coverage requiredNo bond coverage required
�� No debt service reserve requirementNo debt service reserve requirement
�� Anticipated GRP rate in 2013 Anticipated GRP rate in 2013
�� ~$1.50 per 1,000 gallons of water produced~$1.50 per 1,000 gallons of water produced

SWTP SWTP -- Project MilestonesProject Milestones
�� Process Pilot Study: Process Pilot Study: November 2008November 2008
�� Preliminary Engineering:Preliminary Engineering: June 2009June 2009
�� Final Design: Final Design: February 2011 February 2011
�� CMAR: CMAR: March 2010 March 2010 -- March 2014March 2014
�� GMP Package #1: March 2011GMP Package #1: March 2011
�� GMP Package #2 :GMP Package #2 : April 2011April 2011
�� Construction: Construction: March 2011 March 2011 –– March 2013March 2013
�� Plant Operational: Plant Operational: March 2013March 2013
�� CMAR firm to operate plant first CMAR firm to operate plant first yearyear
�� City Staff operations beginning 2014City Staff operations beginning 2014
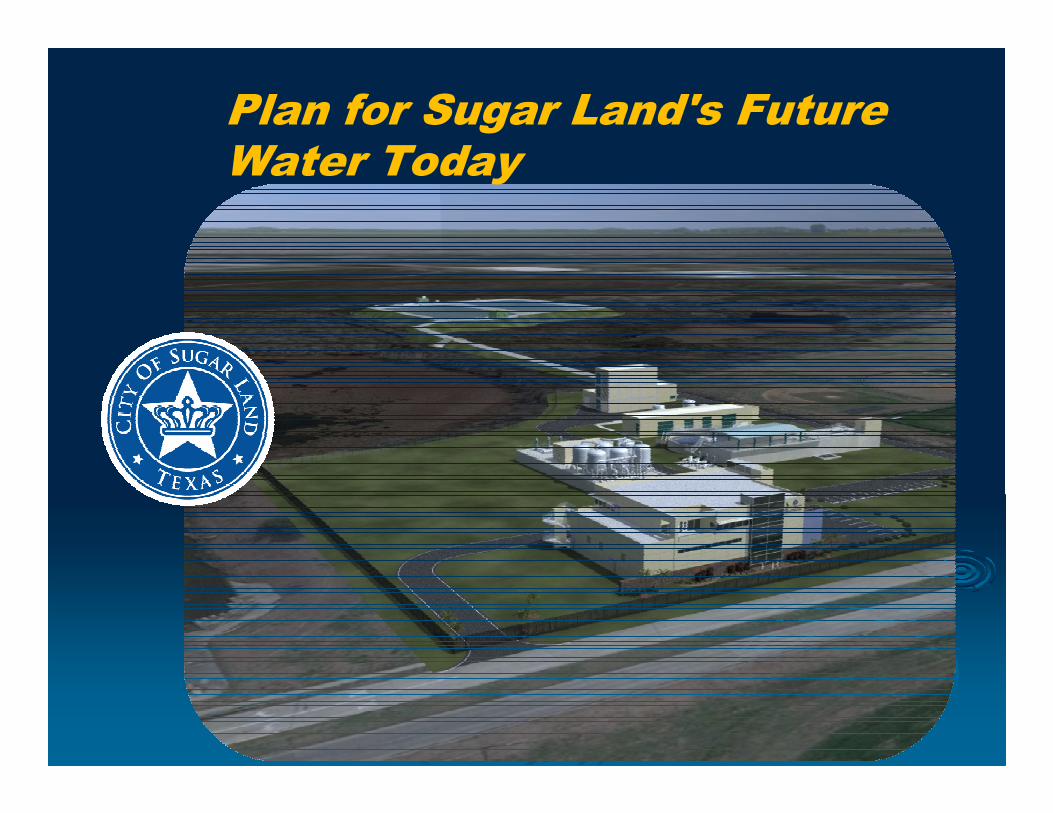
Plan for Sugar Land's Future Water Today


