1 www.eurosurveillance.org Surveillance and outbreak reports e new automated daily mortality surveillance system in Portugal P J Nogueira ([email protected]) 1,2 , A Machado 1 , E Rodrigues 1 , B Nunes 1 , L Sousa 1 , M Jacinto 3 , A Ferreira 3 , J M Falcão 1 , P Ferrinho 4 1. Department of Epidemiology, National Institute of Health Dr. Ricardo Jorge, Lisbon, Portugal 2. Unit of Epidemiology, Institute of Preventive Medicine, Faculty of Medicine, University of Lisbon, Lisbon, Portugal 3. Institute of Information Technologies in Justice, Ministry of Justice, Lisbon, Portugal 4. Institute of Hygiene and Tropical Medicine, New University of Lisbon, Lisbon, Portugal Citation style for this article: Citation style for this article: Nogueira PJ, Machado A, Rodrigues E, Nunes B, Sousa L, Jacinto M, Ferreira A, Falcão JM, Ferrinho P. The new automated daily mortality surveillance system in Portugal. Euro Surveill. 2010;15(13):pii=19529. Available online: http://www.eurosurveillance.org/ViewArticle. aspx?ArticleId=19529 This article has been published on 1 April 2010 The experience reported in an earlier Eurosurveillance issue on a fast method to evaluate the impact of the 2003 heatwave on mortality in Portugal, gen- erated a daily mortality surveillance system (VDM) that has been operating ever since jointly with the Portuguese Heat Health Watch Warning System. This work describes the VDM system and how it evolved to become an automated system operating year-round, and shows briefly its potential using mortality data from January 2006 to June 2009 collected by the sys- tem itself. The new system has important advantages such as: rapid information acquisition, completeness (the entire population is included), lightness (very lit- tle information is exchanged, date of death, age, sex, place of death registration). It allows rapid detection of impacts (within five days) and allows a quick pre- liminary quantification of impacts that usually took several years to be done. These characteristics make this system a powerful tool for public health action. The VDM system also represents an example of inter- institutional cooperation, bringing together organisa- tions from two different ministries, Health and Justice, aiming at improving knowledge about the mortality in the population. Introduction The ongoing surveillance of mortality to detect and estimate the magnitude of deaths caused by epidem- ics, emergence of new diseases, or other relevant public health events or threats is envisaged as an important tool. Current efforts are in place to develop such a system at the European level [1]. In Portugal, heatwaves have been demonstrated to be an important health problem [2] and since 1999, a Portuguese Heat Health Watch Warning system (HHWW) has been operating, known as the ICARO Surveillance System (the acronym stands for Importância do Calor: Repercussão nos Óbitos – importance of heat and its repercussion on mortality) [3,4]. This ICARO system was based on models that forecast increases in mor- tality related to observed high temperatures [8,4] three days before the real occurrence. Originally, the HHWW system was based on statistical models that correlated the heat occurrence with the observed mortality in the Lisbon district. Risk was con- veyed to system partners in the form of a simple index called the ICARO-Index [3,5], where 0 (zero) means absence of risk and positive values added risk of mor- tality related with heat. Basically this index accounted for maximum temperatures above a fixed threshold of 32 0 C and the number of consecutive days on which such occurrences were observed. The Lisbon ICARO- index was updated later to integrate the experience of the 2003 heatwave [4], and it is currently referred to as ICARO-Index 2005. In the time following the first ICARO alert in 2000, public health mitigation actions tended to wait for con- firmation of an impact on the population (e.g. excess mortality), and once this evidence was obtained, it was too late to act. Given that there was no rapid method available to obtain that evidence, a tool that could pro- vide it was needed. It was within this framework that a first mortality moni- toring system was tested in the hot summer of 2003. This early version (hereafter referred as ad-hoc VDM: Vigilância Diária da Mortalidade – Surveillance of Daily Mortality) was based on the daily number of death registrations in a set of Civil Registrar Offices (CROs) that accounted for about 40% of all Portuguese mor- tality [6]. In fact, this early version allowed the confir- mation of the excess mortality predicted by the ICARO Surveillance System in the summer 2003 [3,7]. Generation of a routine daily mortality monitoring system – the original VDM system (2004-2007) The ad-hoc system tested during the heatwave of 2003 used a sample of 31 CROs representing all capital cities of all districts of mainland Portugal [2]. In the summer of 2004, the routine daily surveillance was launched (original VDM system). This version differed from the ad-hoc system in the set of CROs, which consisted now
Transcript
1www.eurosurveillance.org
Surveillance and outbreak reports
The new automated daily mortality surveillance system in Portugal
P J Nogueira ([email protected])1,2, A Machado1, E Rodrigues1, B Nunes1, L Sousa1, M Jacinto3, A Ferreira3,J M Falcão1, P Ferrinho4
1. Department of Epidemiology, National Institute of Health Dr. Ricardo Jorge, Lisbon, Portugal2. Unit of Epidemiology, Institute of Preventive Medicine, Faculty of Medicine, University of Lisbon, Lisbon, Portugal3. Institute of Information Technologies in Justice, Ministry of Justice, Lisbon, Portugal4. Institute of Hygiene and Tropical Medicine, New University of Lisbon, Lisbon, Portugal
Citation style for this article: Citation style for this article: Nogueira PJ, Machado A, Rodrigues E, Nunes B, Sousa L, Jacinto M, Ferreira A, Falcão JM, Ferrinho P. The new automated daily mortality surveillance system in Portugal. Euro Surveill. 2010;15(13):pii=19529. Available online: http://www.eurosurveillance.org/ViewArticle.aspx?ArticleId=19529
This article has been published on 1 April 2010
The experience reported in an earlier Eurosurveillance issue on a fast method to evaluate the impact of the 2003 heatwave on mortality in Portugal, gen-erated a daily mortality surveillance system (VDM) that has been operating ever since jointly with the Portuguese Heat Health Watch Warning System. This work describes the VDM system and how it evolved to become an automated system operating year-round, and shows briefly its potential using mortality data from January 2006 to June 2009 collected by the sys-tem itself. The new system has important advantages such as: rapid information acquisition, completeness (the entire population is included), lightness (very lit-tle information is exchanged, date of death, age, sex, place of death registration). It allows rapid detection of impacts (within five days) and allows a quick pre-liminary quantification of impacts that usually took several years to be done. These characteristics make this system a powerful tool for public health action. The VDM system also represents an example of inter-institutional cooperation, bringing together organisa-tions from two different ministries, Health and Justice, aiming at improving knowledge about the mortality in the population.
IntroductionThe ongoing surveillance of mortality to detect and estimate the magnitude of deaths caused by epidem-ics, emergence of new diseases, or other relevant public health events or threats is envisaged as an important tool. Current efforts are in place to develop such a system at the European level [1].
In Portugal, heatwaves have been demonstrated to be an important health problem [2] and since 1999, a Portuguese Heat Health Watch Warning system (HHWW) has been operating, known as the ICARO Surveillance System (the acronym stands for Importância do Calor: Repercussão nos Óbitos – importance of heat and its repercussion on mortality) [3,4]. This ICARO system was based on models that forecast increases in mor-tality related to observed high temperatures [8,4] three days before the real occurrence.
Originally, the HHWW system was based on statistical models that correlated the heat occurrence with the observed mortality in the Lisbon district. Risk was con-veyed to system partners in the form of a simple index called the ICARO-Index [3,5], where 0 (zero) means absence of risk and positive values added risk of mor-tality related with heat. Basically this index accounted for maximum temperatures above a fixed threshold of 320C and the number of consecutive days on which such occurrences were observed. The Lisbon ICARO-index was updated later to integrate the experience of the 2003 heatwave [4], and it is currently referred to as ICARO-Index 2005.
In the time following the first ICARO alert in 2000, public health mitigation actions tended to wait for con-firmation of an impact on the population (e.g. excess mortality), and once this evidence was obtained, it was too late to act. Given that there was no rapid method available to obtain that evidence, a tool that could pro-vide it was needed.
It was within this framework that a first mortality moni-toring system was tested in the hot summer of 2003. This early version (hereafter referred as ad-hoc VDM: Vigilância Diária da Mortalidade – Surveillance of Daily Mortality) was based on the daily number of death registrations in a set of Civil Registrar Offices (CROs) that accounted for about 40% of all Portuguese mor-tality [6]. In fact, this early version allowed the confir-mation of the excess mortality predicted by the ICARO Surveillance System in the summer 2003 [3,7].
Generation of a routine daily mortality monitoring system – the original VDM system (2004-2007)The ad-hoc system tested during the heatwave of 2003 used a sample of 31 CROs representing all capital cities of all districts of mainland Portugal [2]. In the summer of 2004, the routine daily surveillance was launched (original VDM system). This version differed from the ad-hoc system in the set of CROs, which consisted now
2 www.eurosurveillance.org
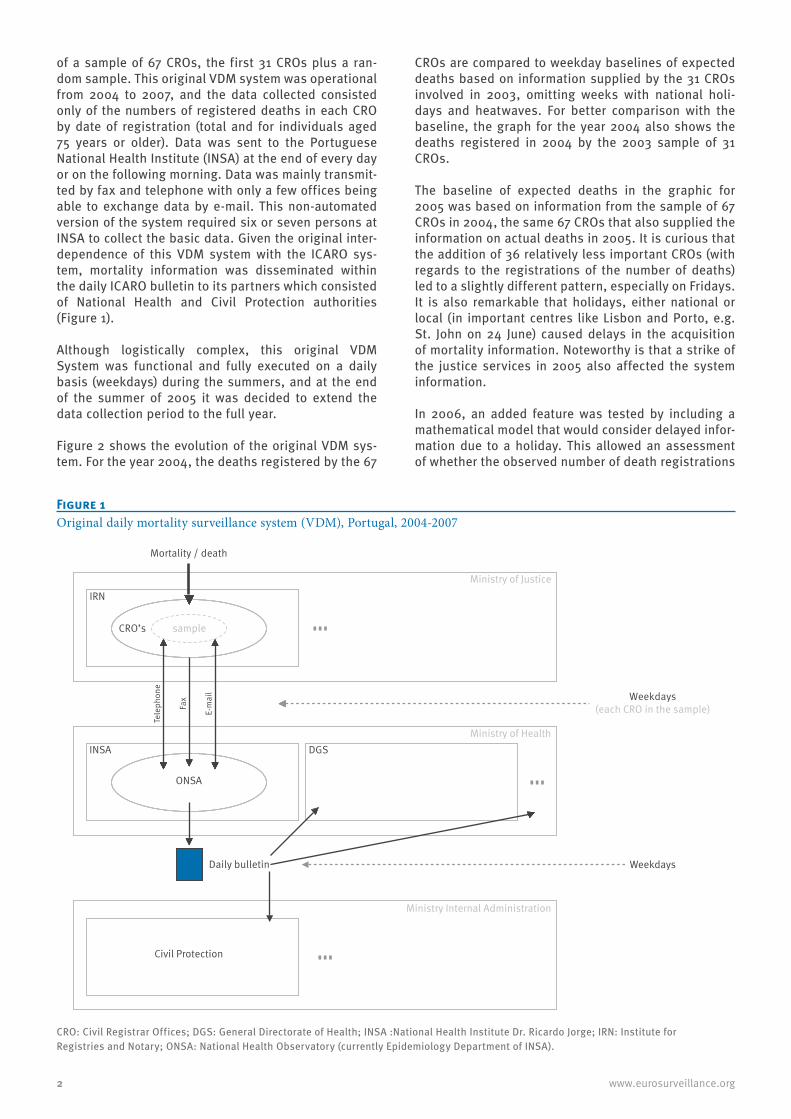
of a sample of 67 CROs, the first 31 CROs plus a ran-dom sample. This original VDM system was operational from 2004 to 2007, and the data collected consisted only of the numbers of registered deaths in each CRO by date of registration (total and for individuals aged 75 years or older). Data was sent to the Portuguese National Health Institute (INSA) at the end of every day or on the following morning. Data was mainly transmit-ted by fax and telephone with only a few offices being able to exchange data by e-mail. This non-automated version of the system required six or seven persons at INSA to collect the basic data. Given the original inter-dependence of this VDM system with the ICARO sys-tem, mortality information was disseminated within the daily ICARO bulletin to its partners which consisted of National Health and Civil Protection authorities (Figure 1).
Although logistically complex, this original VDM System was functional and fully executed on a daily basis (weekdays) during the summers, and at the end of the summer of 2005 it was decided to extend the data collection period to the full year.
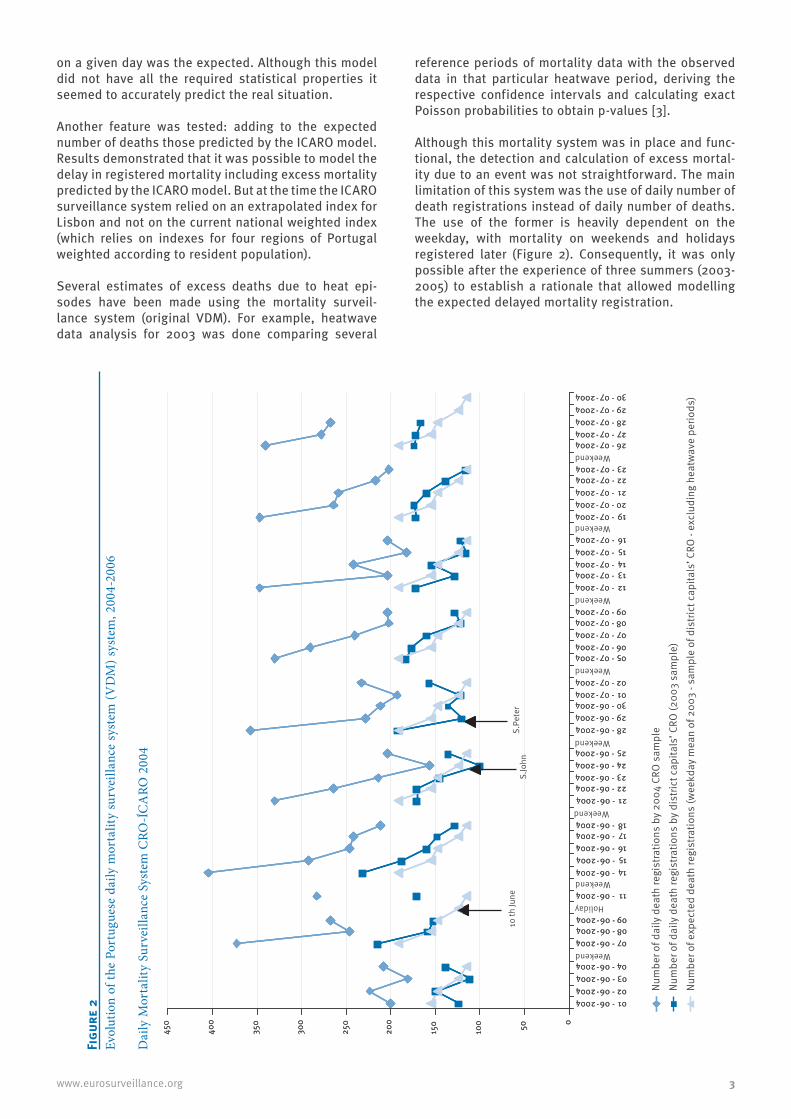
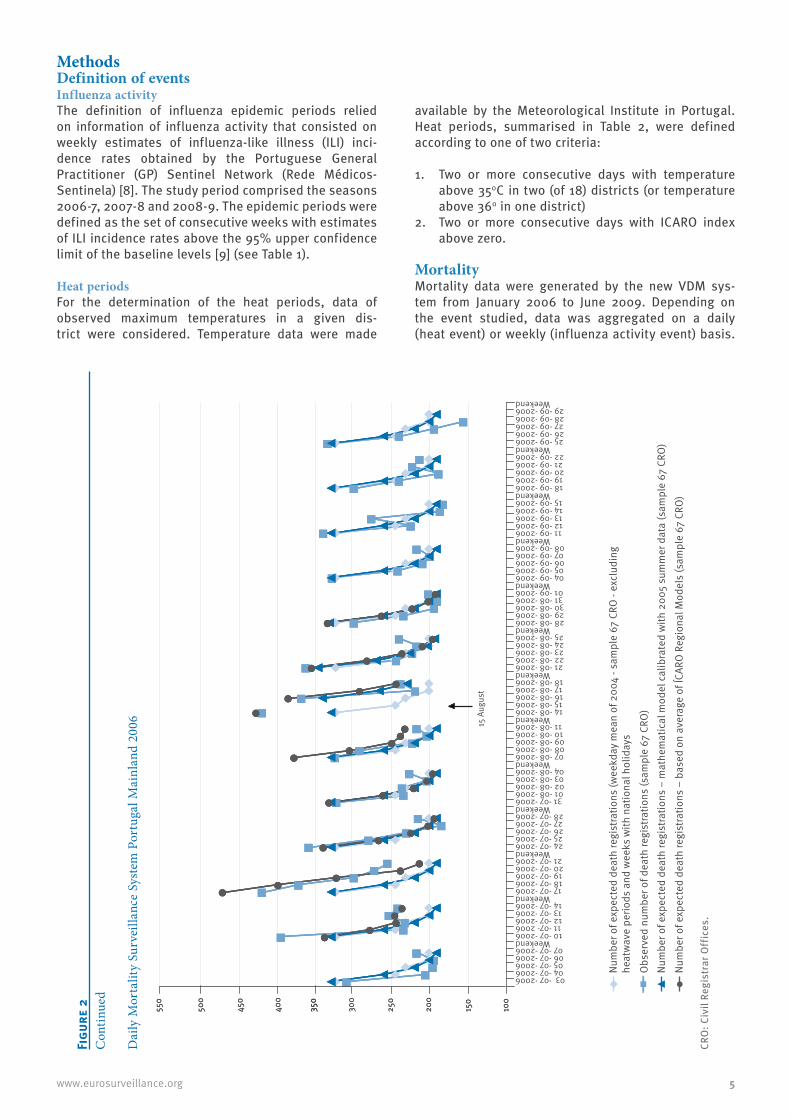
Figure 2 shows the evolution of the original VDM sys-tem. For the year 2004, the deaths registered by the 67
CROs are compared to weekday baselines of expected deaths based on information supplied by the 31 CROs involved in 2003, omitting weeks with national holi-days and heatwaves. For better comparison with the baseline, the graph for the year 2004 also shows the deaths registered in 2004 by the 2003 sample of 31 CROs.
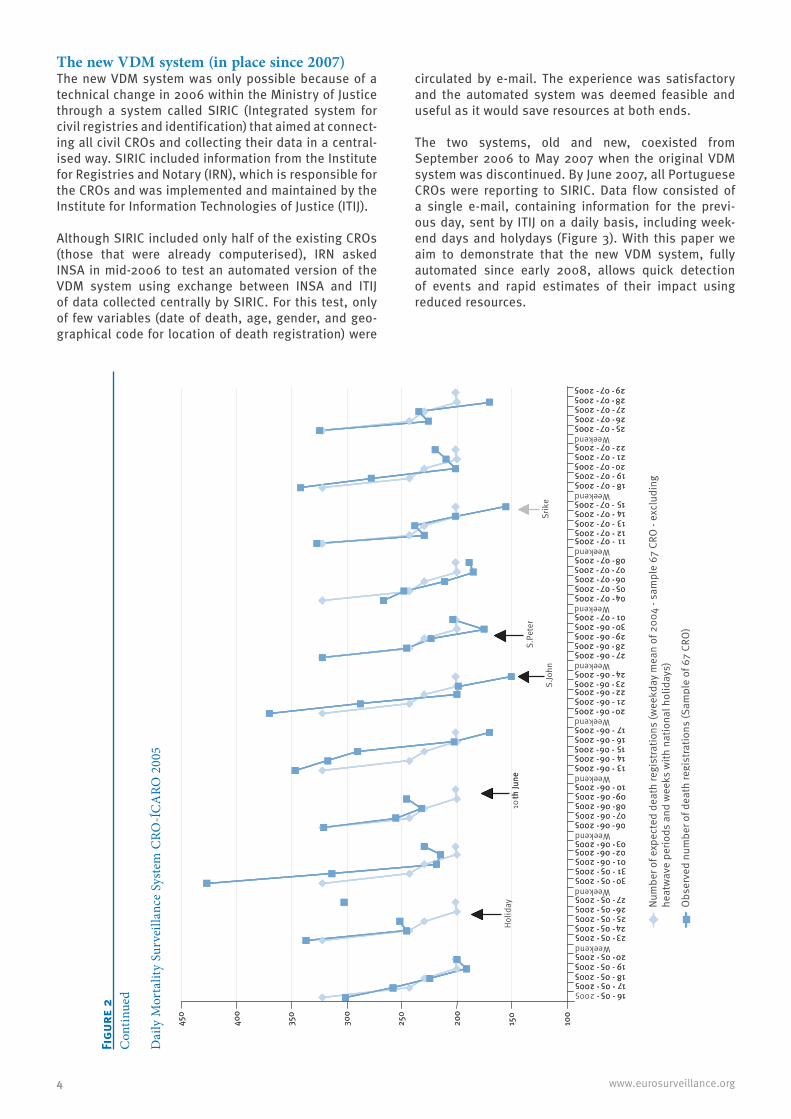
The baseline of expected deaths in the graphic for 2005 was based on information from the sample of 67 CROs in 2004, the same 67 CROs that also supplied the information on actual deaths in 2005. It is curious that the addition of 36 relatively less important CROs (with regards to the registrations of the number of deaths) led to a slightly different pattern, especially on Fridays. It is also remarkable that holidays, either national or local (in important centres like Lisbon and Porto, e.g. St. John on 24 June) caused delays in the acquisition of mortality information. Noteworthy is that a strike of the justice services in 2005 also affected the system information.
In 2006, an added feature was tested by including a mathematical model that would consider delayed infor-mation due to a holiday. This allowed an assessment of whether the observed number of death registrations
Figure 1Original daily mortality surveillance system (VDM), Portugal, 2004-2007
Weekdays(each CRO in the sample)
Daily bulletin Weekdays
sample
Tele
phon
e
Fax
E-m
ail
DGSINSA
ONSA
CRO’s
Mortality / death
Civil Protection
Ministry of Justice
Ministry of Health
Ministry Internal Administration
IRN
CRO: Civil Registrar Offices; DGS: General Directorate of Health; INSA :National Health Institute Dr. Ricardo Jorge; IRN: Institute for Registries and Notary; ONSA: National Health Observatory (currently Epidemiology Department of INSA).
3www.eurosurveillance.org
on a given day was the expected. Although this model did not have all the required statistical properties it seemed to accurately predict the real situation.
Another feature was tested: adding to the expected number of deaths those predicted by the ICARO model. Results demonstrated that it was possible to model the delay in registered mortality including excess mortality predicted by the ICARO model. But at the time the ICARO surveillance system relied on an extrapolated index for Lisbon and not on the current national weighted index (which relies on indexes for four regions of Portugal weighted according to resident population).
Several estimates of excess deaths due to heat epi-sodes have been made using the mortality surveil-lance system (original VDM). For example, heatwave data analysis for 2003 was done comparing several
reference periods of mortality data with the observed data in that particular heatwave period, deriving the respective confidence intervals and calculating exact Poisson probabilities to obtain p-values [3].
Although this mortality system was in place and func-tional, the detection and calculation of excess mortal-ity due to an event was not straightforward. The main limitation of this system was the use of daily number of death registrations instead of daily number of deaths. The use of the former is heavily dependent on the weekday, with mortality on weekends and holidays registered later (Figure 2). Consequently, it was only possible after the experience of three summers (2003-2005) to establish a rationale that allowed modelling the expected delayed mortality registration.
The new VDM system (in place since 2007)The new VDM system was only possible because of a technical change in 2006 within the Ministry of Justice through a system called SIRIC (Integrated system for civil registries and identification) that aimed at connect-ing all civil CROs and collecting their data in a central-ised way. SIRIC included information from the Institute for Registries and Notary (IRN), which is responsible for the CROs and was implemented and maintained by the Institute for Information Technologies of Justice (ITIJ).
Although SIRIC included only half of the existing CROs (those that were already computerised), IRN asked INSA in mid-2006 to test an automated version of the VDM system using exchange between INSA and ITIJ of data collected centrally by SIRIC. For this test, only of few variables (date of death, age, gender, and geo-graphical code for location of death registration) were
circulated by e-mail. The experience was satisfactory and the automated system was deemed feasible and useful as it would save resources at both ends.
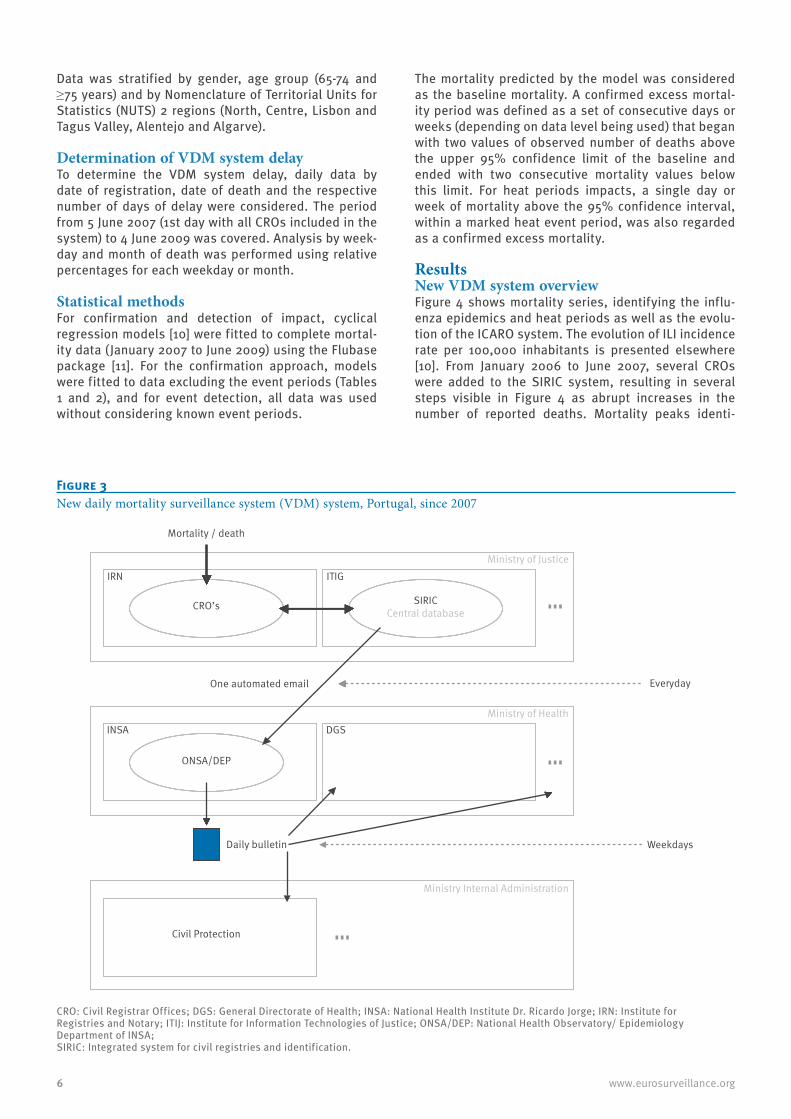
The two systems, old and new, coexisted from September 2006 to May 2007 when the original VDM system was discontinued. By June 2007, all Portuguese CROs were reporting to SIRIC. Data flow consisted of a single e-mail, containing information for the previ-ous day, sent by ITIJ on a daily basis, including week-end days and holydays (Figure 3). With this paper we aim to demonstrate that the new VDM system, fully automated since early 2008, allows quick detection of events and rapid estimates of their impact using reduced resources.
MethodsDefinition of events Influenza activityThe definition of influenza epidemic periods relied on information of influenza activity that consisted on weekly estimates of influenza-like illness (ILI) inci-dence rates obtained by the Portuguese General Practitioner (GP) Sentinel Network (Rede Médicos-Sentinela) [8]. The study period comprised the seasons 2006-7, 2007-8 and 2008-9. The epidemic periods were defined as the set of consecutive weeks with estimates of ILI incidence rates above the 95% upper confidence limit of the baseline levels [9] (see Table 1).
Heat periodsFor the determination of the heat periods, data of observed maximum temperatures in a given dis-trict were considered. Temperature data were made
available by the Meteorological Institute in Portugal. Heat periods, summarised in Table 2, were defined according to one of two criteria:
1. Two or more consecutive days with temperature above 350C in two (of 18) districts (or temperature above 360 in one district)
2. Two or more consecutive days with ICARO index above zero.
Mortality Mortality data were generated by the new VDM sys-tem from January 2006 to June 2009. Depending on the event studied, data was aggregated on a daily (heat event) or weekly (influenza activity event) basis.
Data was stratified by gender, age group (65-74 and ≥75 years) and by Nomenclature of Territorial Units for Statistics (NUTS) 2 regions (North, Centre, Lisbon and Tagus Valley, Alentejo and Algarve).
Determination of VDM system delayTo determine the VDM system delay, daily data by date of registration, date of death and the respective number of days of delay were considered. The period from 5 June 2007 (1st day with all CROs included in the system) to 4 June 2009 was covered. Analysis by week-day and month of death was performed using relative percentages for each weekday or month.
Statistical methodsFor confirmation and detection of impact, cyclical regression models [10] were fitted to complete mortal-ity data (January 2007 to June 2009) using the Flubase package [11]. For the confirmation approach, models were fitted to data excluding the event periods (Tables 1 and 2), and for event detection, all data was used without considering known event periods.
The mortality predicted by the model was considered as the baseline mortality. A confirmed excess mortal-ity period was defined as a set of consecutive days or weeks (depending on data level being used) that began with two values of observed number of deaths above the upper 95% confidence limit of the baseline and ended with two consecutive mortality values below this limit. For heat periods impacts, a single day or week of mortality above the 95% confidence interval, within a marked heat event period, was also regarded as a confirmed excess mortality.
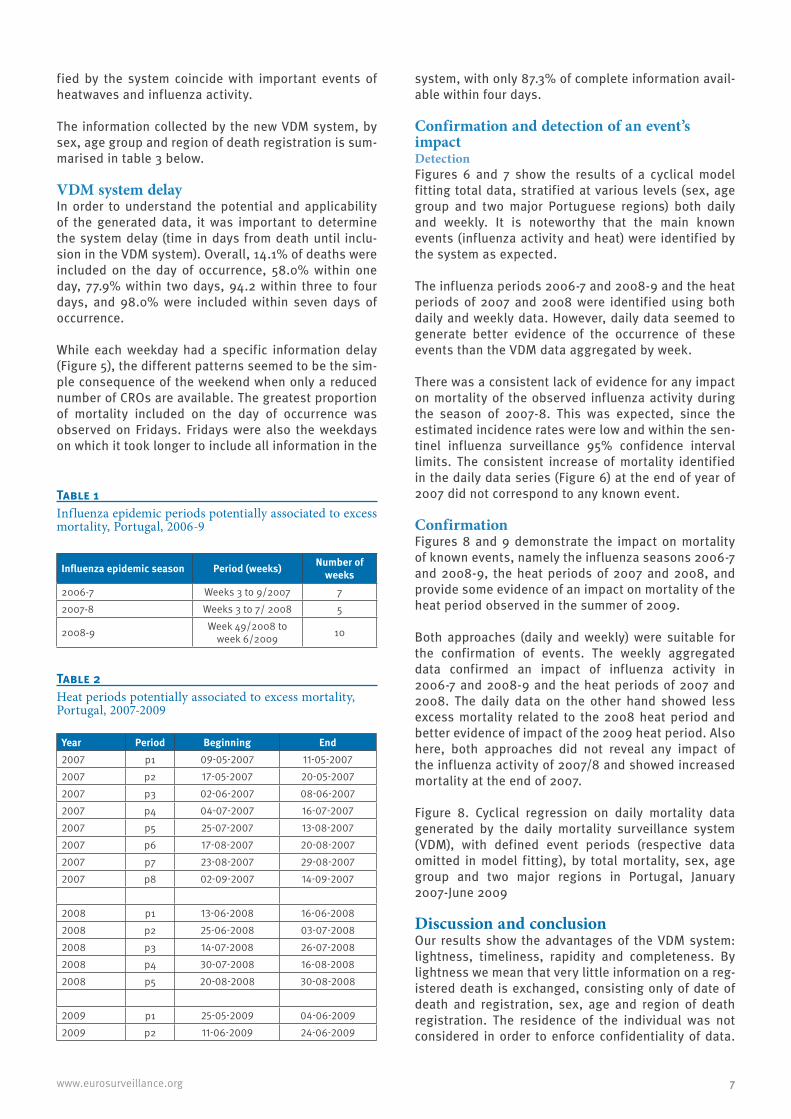
Results New VDM system overviewFigure 4 shows mortality series, identifying the influ-enza epidemics and heat periods as well as the evolu-tion of the ICARO system. The evolution of ILI incidence rate per 100,000 inhabitants is presented elsewhere [10]. From January 2006 to June 2007, several CROs were added to the SIRIC system, resulting in several steps visible in Figure 4 as abrupt increases in the number of reported deaths. Mortality peaks identi-
Figure 3New daily mortality surveillance system (VDM) system, Portugal, since 2007
CRO: Civil Registrar Offices; DGS: General Directorate of Health; INSA: National Health Institute Dr. Ricardo Jorge; IRN: Institute for Registries and Notary; ITIJ: Institute for Information Technologies of Justice; ONSA/DEP: National Health Observatory/ Epidemiology Department of INSA;SIRIC: Integrated system for civil registries and identification.
Everyday
Daily bulletin Weekdays
DGSINSA
ONSA/DEP
CRO’s
Mortality / death
Civil Protection
Ministry of Justice
Ministry of Health
Ministry Internal Administration
SIRICCentral database
IRN ITIG
One automated email
7www.eurosurveillance.org
fied by the system coincide with important events of heatwaves and influenza activity.
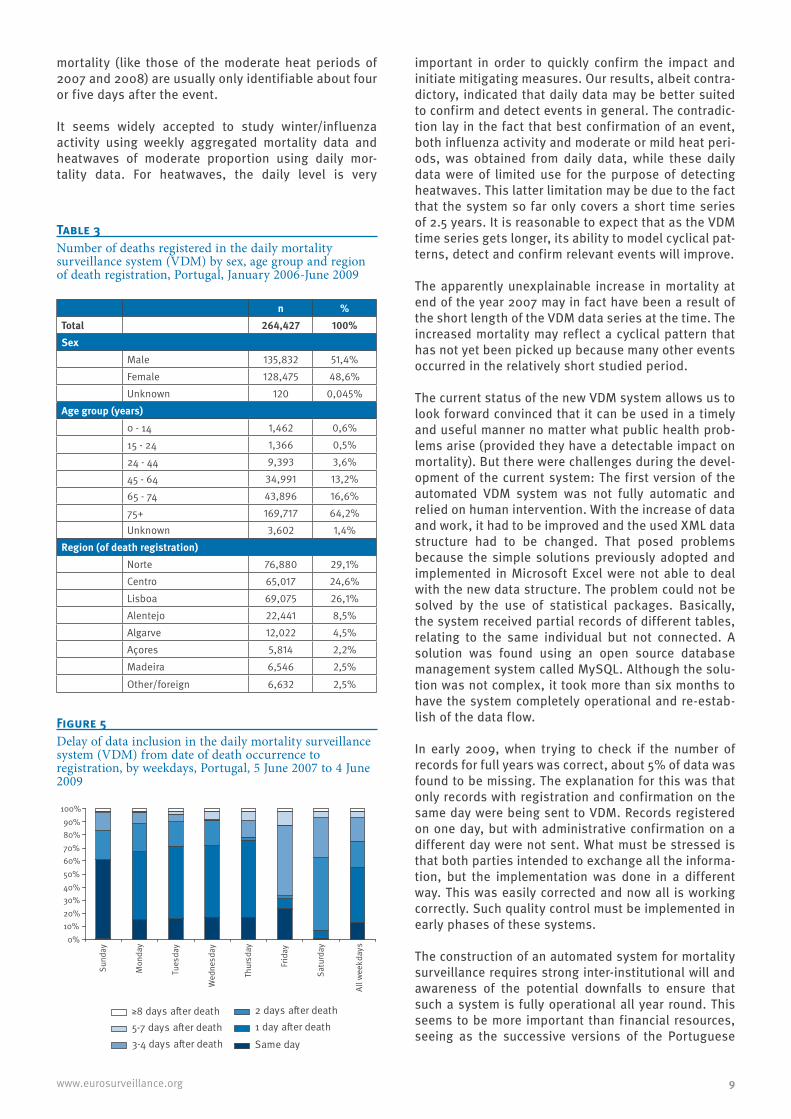
The information collected by the new VDM system, by sex, age group and region of death registration is sum-marised in table 3 below.
VDM system delayIn order to understand the potential and applicability of the generated data, it was important to determine the system delay (time in days from death until inclu-sion in the VDM system). Overall, 14.1% of deaths were included on the day of occurrence, 58.0% within one day, 77.9% within two days, 94.2 within three to four days, and 98.0% were included within seven days of occurrence.
While each weekday had a specific information delay (Figure 5), the different patterns seemed to be the sim-ple consequence of the weekend when only a reduced number of CROs are available. The greatest proportion of mortality included on the day of occurrence was observed on Fridays. Fridays were also the weekdays on which it took longer to include all information in the
system, with only 87.3% of complete information avail-able within four days.
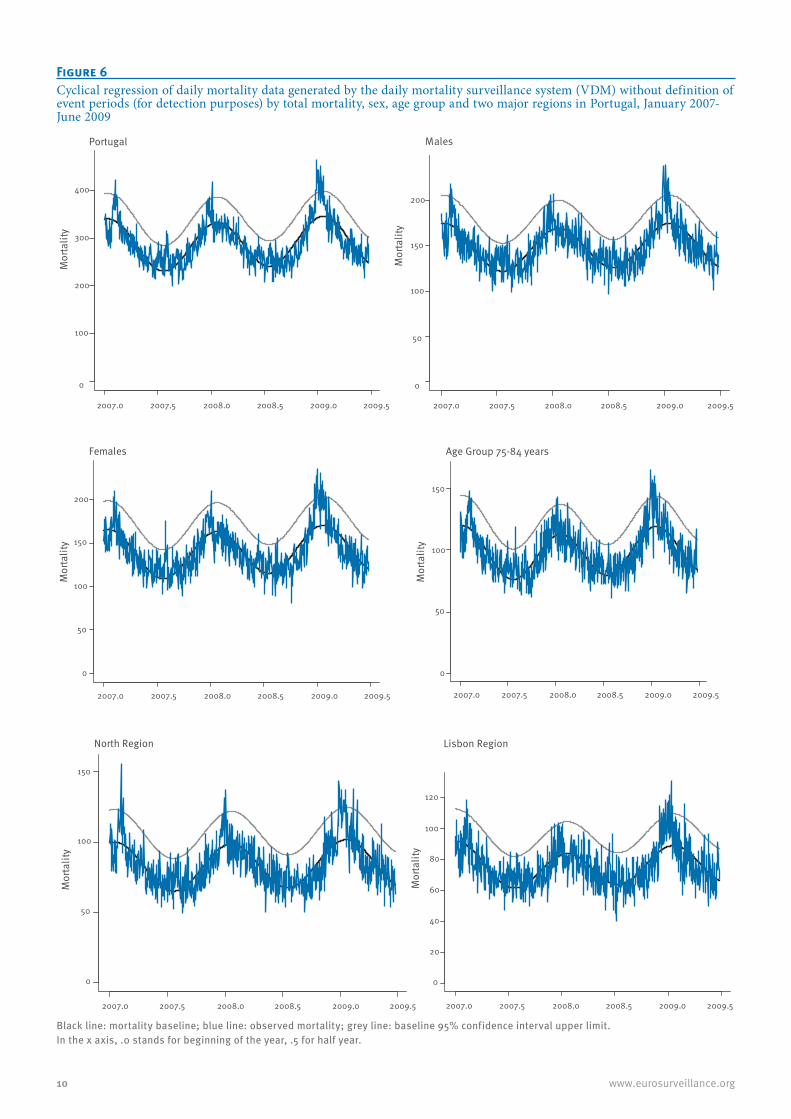
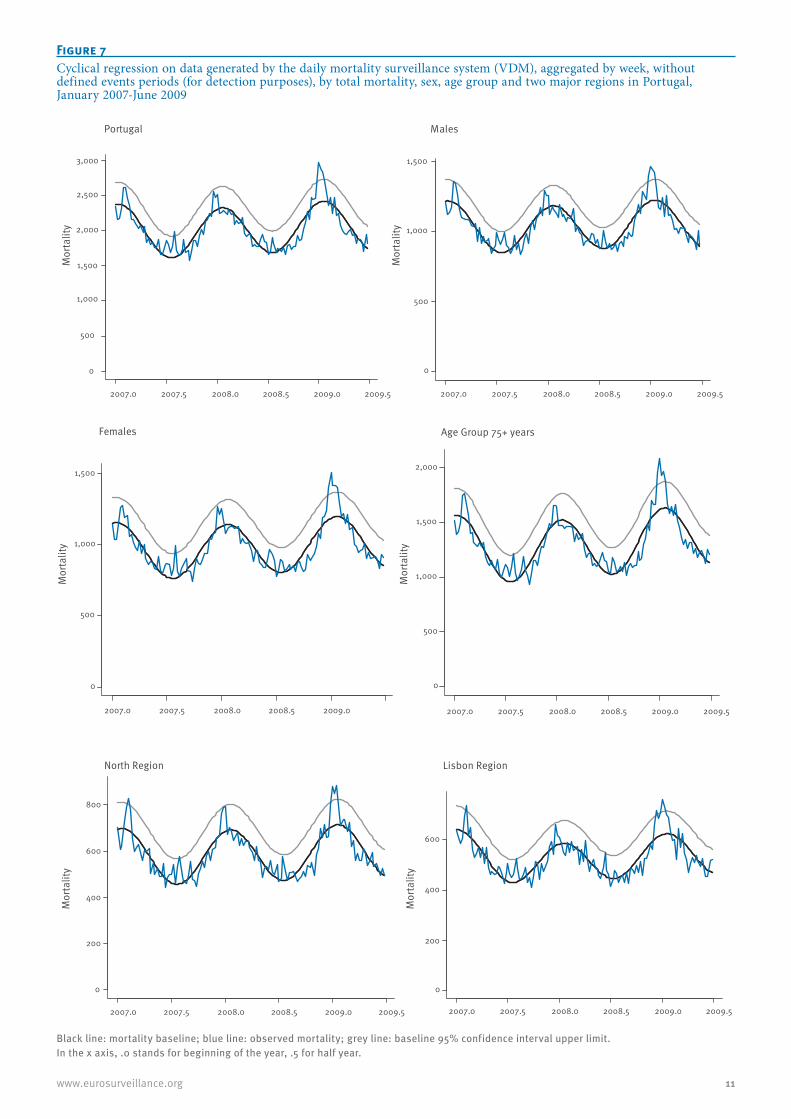
Confirmation and detection of an event’s impact DetectionFigures 6 and 7 show the results of a cyclical model fitting total data, stratified at various levels (sex, age group and two major Portuguese regions) both daily and weekly. It is noteworthy that the main known events (influenza activity and heat) were identified by the system as expected.
The influenza periods 2006-7 and 2008-9 and the heat periods of 2007 and 2008 were identified using both daily and weekly data. However, daily data seemed to generate better evidence of the occurrence of these events than the VDM data aggregated by week.
There was a consistent lack of evidence for any impact on mortality of the observed influenza activity during the season of 2007-8. This was expected, since the estimated incidence rates were low and within the sen-tinel influenza surveillance 95% confidence interval limits. The consistent increase of mortality identified in the daily data series (Figure 6) at the end of year of 2007 did not correspond to any known event.
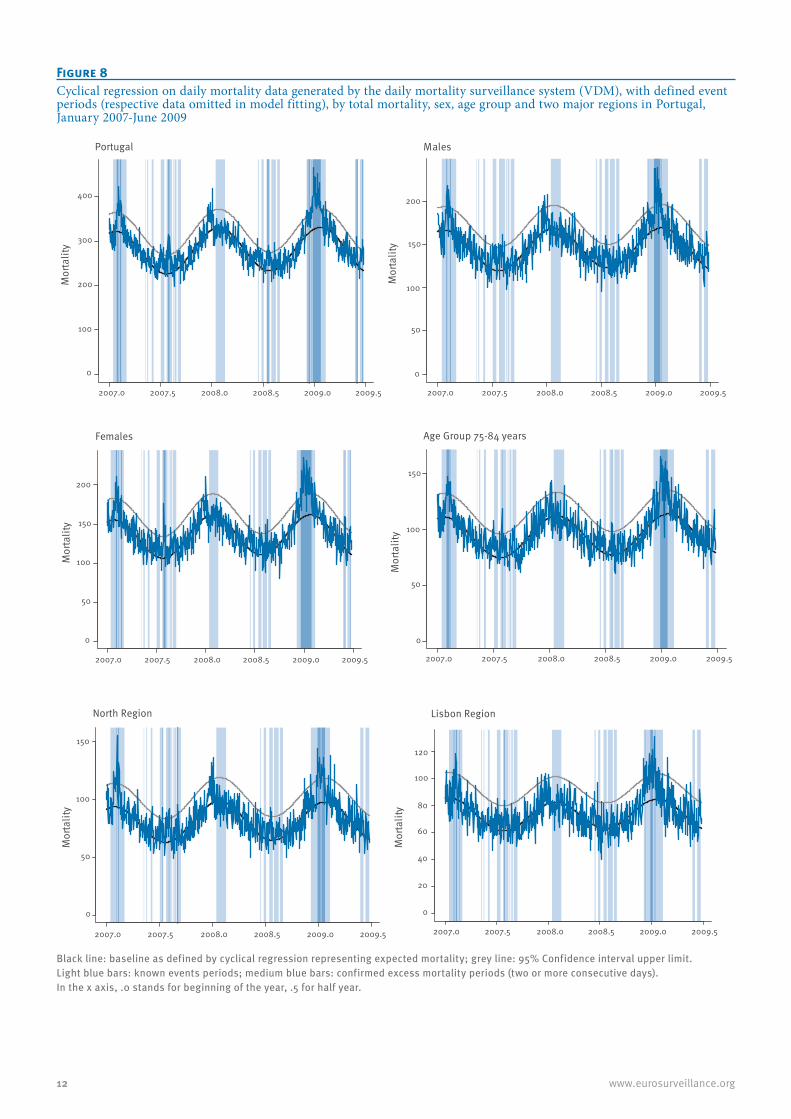
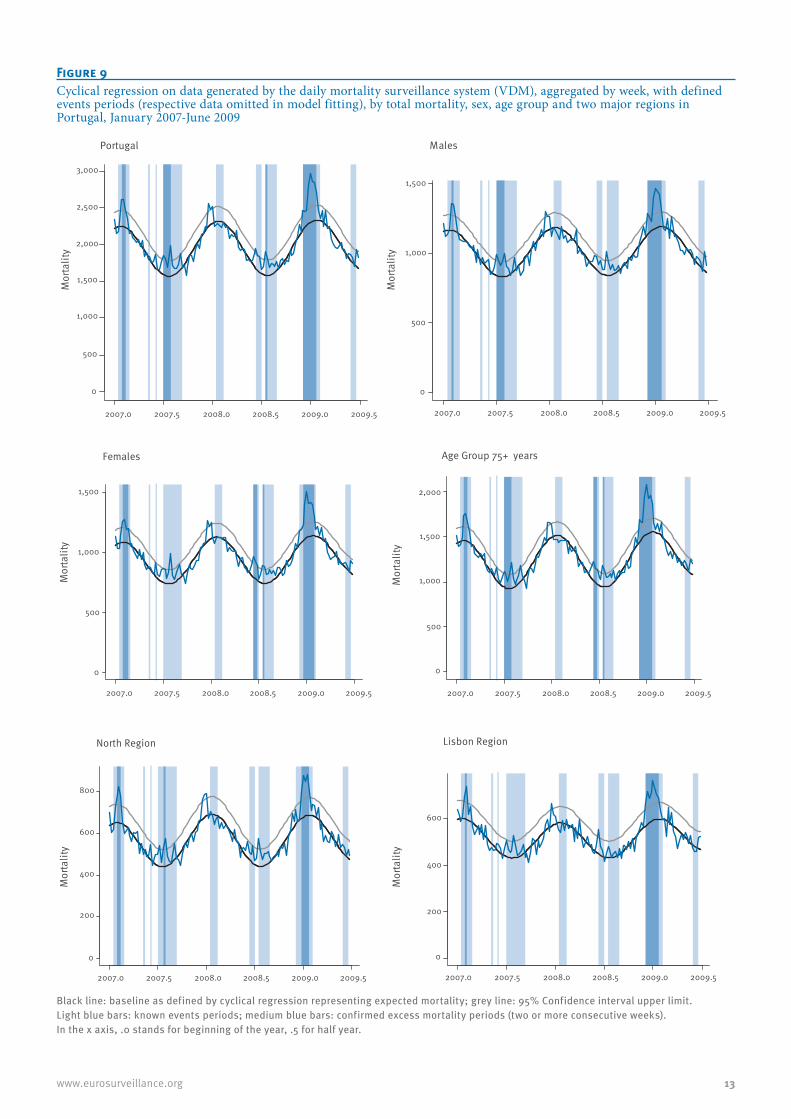
ConfirmationFigures 8 and 9 demonstrate the impact on mortality of known events, namely the influenza seasons 2006-7 and 2008-9, the heat periods of 2007 and 2008, and provide some evidence of an impact on mortality of the heat period observed in the summer of 2009.
Both approaches (daily and weekly) were suitable for the confirmation of events. The weekly aggregated data confirmed an impact of influenza activity in 2006-7 and 2008-9 and the heat periods of 2007 and 2008. The daily data on the other hand showed less excess mortality related to the 2008 heat period and better evidence of impact of the 2009 heat period. Also here, both approaches did not reveal any impact of the influenza activity of 2007/8 and showed increased mortality at the end of 2007.
Figure 8. Cyclical regression on daily mortality data generated by the daily mortality surveillance system (VDM), with defined event periods (respective data omitted in model fitting), by total mortality, sex, age group and two major regions in Portugal, January 2007-June 2009
Discussion and conclusionOur results show the advantages of the VDM system: lightness, timeliness, rapidity and completeness. By lightness we mean that very little information on a reg-istered death is exchanged, consisting only of date of death and registration, sex, age and region of death registration. The residence of the individual was not considered in order to enforce confidentiality of data.
Table 1Influenza epidemic periods potentially associated to excess mortality, Portugal, 2006-9
Influenza epidemic season Period (weeks) Number of weeks
2006-7 Weeks 3 to 9/2007 72007-8 Weeks 3 to 7/ 2008 5
2008-9 Week 49/2008 to week 6/2009 10
Table 2Heat periods potentially associated to excess mortality, Portugal, 2007-2009
The system obtains information very quickly and in a very complete way. It collects 94.2% of the total number of deaths within four days of their occurrence and 98% within seven days; it allows detecting impacts on mor-tality in a very timely manner; and it seems to be sensi-tive to phenomena that are generically considered for the construction of such mortality surveillance sys-tems, i.e. it is sensitive to extreme weather events and to winter influenza activity [7,10]. In fact, in a year with moderate summer temperatures as in 2007, the VDM system data without additional information could point out even some of the events with low impact in mor-tality within a framework of event detection (Figures 6 and 7).
We showed that the reporting delay was dependent on the weekday, with deaths occurring on Fridays entered into the VDM system with the greatest delay (three or more days), although mortality registration on the same day of death occurrence was highest on Fridays. This pattern might indicate that mortality monitoring is least influenced by delay on Thursdays, when most of the weekend mortality is already integrated. This would probably be the optimal day for monitoring of mortality data from the preceding week.
Mortality data delay also showed some dependence on the month of registration (data not shown). January to March had the minimum delay with at least 14.7% of the data registered on the day of the mortality event and more than 80% within two days. Greater delays occurred in April, August and December, which was expected because these months are associated with holiday periods. The minimum mortality registered on the day of death occurrence was 12.2% in December, followed by the summer months with about 13%. In months associated with holidays (April, August and December), arrival of data within two days was always below 75%, with December reaching only 71.5%.
The system delays related to weekdays and months are basically a reflection of society’s organisation of time. This time structure remains unaltered through the years, therefore detection and determination of event impacts should be done using within-system data for the definition of baselines and thresholds. Overall, the identified system delays are not expected to dra-matically change monitoring or surveillance schemes using VDM system information. Empirically, past expe-rience of VDM system management, both in the old and the new version, showed that residual impacts on
Figure 4Daily observed mortality data collected by the new daily mortality surveillance system (VDM) and ICARO Index, Portugal, 2006-2009
Blue line: new VDM system; grey line: ICARO Index; light blue bars: heat periods; medium blue bars: influenza epidemic periods.
TimeTime
Daily
num
ber o
f dea
ths
2006 2007 2008 2009
2006 2007 2008 2009
0
50
100
150
200
250
300
350
400
0
0.4
0.8
1.2
1.6
2
Natio
nal w
eigh
ted
ÍCAR
O in
dex
9www.eurosurveillance.org
mortality (like those of the moderate heat periods of 2007 and 2008) are usually only identifiable about four or five days after the event.
It seems widely accepted to study winter/influenza activity using weekly aggregated mortality data and heatwaves of moderate proportion using daily mor-tality data. For heatwaves, the daily level is very
important in order to quickly confirm the impact and initiate mitigating measures. Our results, albeit contra-dictory, indicated that daily data may be better suited to confirm and detect events in general. The contradic-tion lay in the fact that best confirmation of an event, both influenza activity and moderate or mild heat peri-ods, was obtained from daily data, while these daily data were of limited use for the purpose of detecting heatwaves. This latter limitation may be due to the fact that the system so far only covers a short time series of 2.5 years. It is reasonable to expect that as the VDM time series gets longer, its ability to model cyclical pat-terns, detect and confirm relevant events will improve.
The apparently unexplainable increase in mortality at end of the year 2007 may in fact have been a result of the short length of the VDM data series at the time. The increased mortality may reflect a cyclical pattern that has not yet been picked up because many other events occurred in the relatively short studied period.
The current status of the new VDM system allows us to look forward convinced that it can be used in a timely and useful manner no matter what public health prob-lems arise (provided they have a detectable impact on mortality). But there were challenges during the devel-opment of the current system: The first version of the automated VDM system was not fully automatic and relied on human intervention. With the increase of data and work, it had to be improved and the used XML data structure had to be changed. That posed problems because the simple solutions previously adopted and implemented in Microsoft Excel were not able to deal with the new data structure. The problem could not be solved by the use of statistical packages. Basically, the system received partial records of different tables, relating to the same individual but not connected. A solution was found using an open source database management system called MySQL. Although the solu-tion was not complex, it took more than six months to have the system completely operational and re-estab-lish of the data flow.
In early 2009, when trying to check if the number of records for full years was correct, about 5% of data was found to be missing. The explanation for this was that only records with registration and confirmation on the same day were being sent to VDM. Records registered on one day, but with administrative confirmation on a different day were not sent. What must be stressed is that both parties intended to exchange all the informa-tion, but the implementation was done in a different way. This was easily corrected and now all is working correctly. Such quality control must be implemented in early phases of these systems.
The construction of an automated system for mortality surveillance requires strong inter-institutional will and awareness of the potential downfalls to ensure that such a system is fully operational all year round. This seems to be more important than financial resources, seeing as the successive versions of the Portuguese
Figure 5Delay of data inclusion in the daily mortality surveillance system (VDM) from date of death occurrence to registration, by weekdays, Portugal, 5 June 2007 to 4 June 2009
0%10%20%30%40%50%60%70%80%90%
100%
Sund
ay
Mon
day
Tues
day
Wed
nesd
ay
Thur
sday
Frid
ay
Satu
rday
All
wee
kday
s
≥8 days after death5-7 days after death3-4 days after death
2 days after death1 day after deathSame day
Table 3Number of deaths registered in the daily mortality surveillance system (VDM) by sex, age group and region of death registration, Portugal, January 2006-June 2009
Figure 6Cyclical regression of daily mortality data generated by the daily mortality surveillance system (VDM) without definition of event periods (for detection purposes) by total mortality, sex, age group and two major regions in Portugal, January 2007-June 2009
Mor
talit
y
2007.0 2007.5 2008.0 2008.5 2009.0 2009.5
0
100
200
300
400
Portugal
Mor
talit
y2007.0 2007.5 2008.0 2008.5 2009.0 2009.5
0
50
100
150
200
Males
2007.0 2007.5 2008.0 2008.5 2009.0 2009.5
Females
Mor
talit
y
0
50
100
150
200
2007.0 2007.5 2008.0 2008.5 2009.0 2009.5
Age Group 75-84 years
Mor
talit
y
0
50
100
150
2007.0 2007.5 2008.0 2008.5 2009.0 2009.5
North Region
Mor
talit
y
0
50
100
150
2007.0 2007.5 2008.0 2008.5 2009.0 2009.5
0
20
40
60
80
100
120
Lisbon Region
Mor
talit
y
Black line: mortality baseline; blue line: observed mortality; grey line: baseline 95% confidence interval upper limit.In the x axis, .0 stands for beginning of the year, .5 for half year.
11www.eurosurveillance.org
Figure 7Cyclical regression on data generated by the daily mortality surveillance system (VDM), aggregated by week, without defined events periods (for detection purposes), by total mortality, sex, age group and two major regions in Portugal, January 2007-June 2009
2007.0 2007.5 2008.0 2008.5 2009.0 2009.5
0
500
1,000
1,500
2,000
2,500
3,000
Portugal
2007.0 2007.5 2008.0 2008.5 2009.0 2009.5
Males
2007.0 2007.5 2008.0 2008.5 2009.0
Females
2007.0 2007.5 2008.0 2008.5 2009.0 2009.5
Age Group 75+ years
2007.0 2007.5 2008.0 2008.5 2009.0 2009.5
0
200
400
600
800
North Region
2007.0 2007.5 2008.0 2008.5 2009.0 2009.5
Lisbon Region
0
500
1,000
1,500
0
500
1,000
1,500
0
500
1,000
1,500
2,000
0
200
400
600
Mor
talit
yM
orta
lity
Mor
talit
yM
orta
lity
Mor
talit
y
Mor
talit
y
Black line: mortality baseline; blue line: observed mortality; grey line: baseline 95% confidence interval upper limit.In the x axis, .0 stands for beginning of the year, .5 for half year.
12 www.eurosurveillance.org
Figure 8Cyclical regression on daily mortality data generated by the daily mortality surveillance system (VDM), with defined event periods (respective data omitted in model fitting), by total mortality, sex, age group and two major regions in Portugal, January 2007-June 2009
Black line: baseline as defined by cyclical regression representing expected mortality; grey line: 95% Confidence interval upper limit.Light blue bars: known events periods; medium blue bars: confirmed excess mortality periods (two or more consecutive days).In the x axis, .0 stands for beginning of the year, .5 for half year.
Mor
talit
y
2007.0 2007.5 2008.0 2008.5 2009.0 2009.5
0
100
200
300
400
Portugal
2007.0 2007.5 2008.0 2008.5 2009.0 2009.5
0
50
100
150
200
Males
2007.0 2007.5 2008.0 2008.5 2009.0 2009.5
Females
2007.0 2007.5 2008.0 2008.5 2009.0 2009.5
Age Group 75-84 years
2007.0 2007.5 2008.0 2008.5 2009.0 2009.5
North Region
2007.0 2007.5 2008.0 2008.5 2009.0 2009.5
0
20
40
60
80
100
120
Lisbon Region
Mor
talit
y
Mor
talit
yM
orta
lity
Mor
talit
y
Mor
talit
y
0
50
100
150
200
0
50
100
150
0
50
100
150
13www.eurosurveillance.org
Figure 9Cyclical regression on data generated by the daily mortality surveillance system (VDM), aggregated by week, with defined events periods (respective data omitted in model fitting), by total mortality, sex, age group and two major regions in Portugal, January 2007-June 2009
Black line: baseline as defined by cyclical regression representing expected mortality; grey line: 95% Confidence interval upper limit.Light blue bars: known events periods; medium blue bars: confirmed excess mortality periods (two or more consecutive weeks).In the x axis, .0 stands for beginning of the year, .5 for half year.
Mor
talit
y
2007.0 2007.5 2008.0 2008.5 2009.0 2009.5
0
500
1,000
1,500
2,000
2,500
3,000
Portugal
2007.0 2007.5 2008.0 2008.5 2009.0 2009.5
Males
2007.0 2007.5 2008.0 2008.5 2009.0 2009.5
Females
2007.0 2007.5 2008.0 2008.5 2009.0 2009.5
Age Group 75+ years
2007.0 2007.5 2008.0 2008.5 2009.0 2009.5
0
200
400
600
800
North Region
2007.0 2007.5 2008.0 2008.5 2009.0 2009.5
Lisbon Region
Mor
talit
yM
orta
lity
Mor
talit
yM
orta
lity
Mor
talit
y0
500
1,000
1,500
0
500
1,000
1,500
2,000
0
500
1,000
1,500
0
200
400
600
14 www.eurosurveillance.org
VDM system were developed without any specific budget using only the available manpower and com-puter technology. It should be possible to establish a timely mortality surveillance system such as the VDM at European level. It would probably need goodwill and coordination between institutions within and among the countries rather than resources, and faces poten-tial technical pitfalls that would need to be solved.
Currently, the new version of the VDM system has been separated from the ICARO surveillance system, hav-ing its own bulletin that is sent on every weekday to national and regional health authorities and also to the Portuguese civil protection authorities. Some prod-ucts based on this system are being studied for future application. A system for surveillance of infant mortal-ity is currently being tested with promising results.
References1. Mazick A, Participants of a workshop on mortality monitoring
in Europe. Monitoring excess mortality for public health action: potential for a future European network. Euro Surveill. 2007; 12(1). pii=3107. Available from: http://www.eurosurveillance.org/ViewArticle.aspx?ArticleId=3107
2. Falcão JM, Castro MJ, Falcão MLM. Efeitos de uma onda de calor na mortalidade da população de Lisboa. [Effects of an heatwave on mortality of Lisbon’s popullation]. Saúde em Números. [Health in numbers]. 1998; 3(2):10-12.
3. Nogueira P. Examples of Heat Health Warning Systems: Lisbon’s ICARO’s surveillance system, summer of 2003. Kirch W, Menne B, Bertollini R, editors. Extreme weather events and Public Health Responses: European Public Health Association. Berlin: Springer; 2005. p. 141-159.
4. Nogueira PJ, Nunes B, Dias CM, Falcão JM. Um sistema de vigilância e alerta de ondas de calor com efeitos na mortalidade: o índice Ícaro. [A surveillance and warning system for heatwaves with effects on mortality: the ÍCARO Index]. Revista Portuguesa de Saúde Pública. [Portuguese Journal of Public Health]. 1999; 1:79-84.
5. Nogueira P, Paixão E. Models for mortality associated with heatwaves: update of the Portuguese heat health warning system. Int J Climatol. 2008; 28(4):545-562.
6. Nogueira PJ, Falcão JM, Contreiras MT, Paixão E, Brandão J, Batista I. Mortality in Portugal associated with the heat wave of August 2003: Early estimation of effect, using a rapid method. Euro Surveill. 2005;10(7). pii=553. Available from: http://www.eurosurveillance.org/ViewArticle.aspx?ArticleId=553
7. Koppe C, Kovats S, Jendritzky G, Menne B. Heat-Waves: risk and responses. Health and Global Environmental Change. Series No.2; Copenhagen: WHO Regional Office for Europe; 2004.
8. Aguilera JF, Paget WJ, Manuguerra, JC on behalf of EISS and EuroGROG. Survey of Influenza Surveillance Systems in Europe. EISS-EuroGROG Report, December 2001.
9. Médicos–Sentinela. O que se fez em 2007. [Portuguese GP Network. What was done in 2007] Lisbon: Instituto Nacional de Saúde Dr. Ricardo Jorge; 2009. Médicos-Sentinela No. 21. Available from: http://www.insa.pt/sites/INSA/Portugues/Publicacoes/Outros/Documents/Epidemiologia/Relat%C3%B3rioMS_21_2007.PDF. Portuguese.
10. Nogueira P J, Nunes B , Machado A, Rodrigues E, Gómez V, Sousa L, Falcão J M. Early estimates of the excess mortality associated with the 2008-9 influenza season in Portugal. Euro Surveill. 2009; 14 (18). Available from: http://www.eurosurveillance.org/ViewArticle.aspx?ArticleId=19194
11. Nunes B, Natario I, Carvalho L. Flubase: Baseline of mortality free of influenza epidemics. R package version 1.0. 2009. Available from: http://cran.r-project.org/web/packages/flubase/index.html