INSIDE 48 Progress in Immunization Information Systems — United States, 2011 52 Infant Meningococcal Vaccination: Advisory Committee on Immunization Practices (ACIP) Recommendations and Rationale 55 Notes from the Field: Emergence of New Norovirus Strain GII.4 Sydney — United States, 2012 56 Notes from the Field: Emergency Department Visits and Hospitalizations for Buprenorphine Ingestion by Children — United States, 2010–2011 58 QuickStats Continuing Education examination available at http://www.cdc.gov/mmwr/cme/conted_info.html#weekly. Surveillance for Foodborne Disease Outbreaks — United States, 2009–2010 Known pathogens cause an estimated 9.4 million foodborne illnesses annually in the United States (1). CDC collects data on foodborne disease outbreaks submitted by all states, the District of Columbia, and Puerto Rico through CDC’s Foodborne Disease Outbreak Surveillance System. Data reported for each outbreak include the number of illnesses, hospitalizations, and deaths; the etiologic agent; the implicated food vehicle; and other factors involved in food preparation and consump- tion. During 2009–2010, a total of 1,527 foodborne disease outbreaks (675 in 2009 and 852 in 2010) were reported, resulting in 29,444 cases of illness, 1,184 hospitalizations, and 23 deaths. Among the 790 outbreaks with a single laboratory- confirmed etiologic agent, norovirus was the most commonly reported, accounting for 42% of outbreaks. Salmonella was second, accounting for 30% of outbreaks. Among the 299 outbreaks attributed to a food composed of ingredients from one of 17 predefined, mutually exclusive food commodities (2), those most often implicated were beef (13%), dairy (12%), fish (12%), and poultry (11%). The commodities in the 299 outbreaks associated with the most illnesses were eggs (27% of illnesses), beef (11%), and poultry (10%). Public health, regulatory, and food industry professionals can use this infor- mation when creating targeted control strategies along the farm-to-table continuum for specific agents, specific foods, and specific pairs of agents and foods. This information also supports efforts to promote safe food-handling practices among food workers and the public. CDC defines a foodborne disease outbreak as the occurrence of two or more similar illnesses resulting from ingestion of a common food. State, local, tribal, and territorial health depart- ment officials voluntarily submit reports of outbreaks inves- tigated by their agency to the Foodborne Disease Outbreak Surveillance System on a standard, Internet-based form.* This report analyzes outbreaks that were reported by August 2, 2012, in which the first illness occurred during 2009–2010. Data reported for each outbreak include the number of illnesses, hospitalizations, and deaths; the etiologic agent (confirmed or suspected † ); the implicated food vehicle; factors contributing to food contamination; and the settings of food preparation and consumption. Foods were assigned to one of 17 commodi- ties § if a single contaminated ingredient was identified or if all ingredients belonged to that commodity (2). Outbreaks identifying foods that could not be assigned to one of the 17 commodities, or for which the report contained insufficient information for commodity assignment, were not attributed to any commodity. Population-based outbreak reporting rates were calculated for each state using U.S. Census estimates of the 2009 and 2010 state populations. ¶ * The reporting form and guidance for reporting via the National Outbreak Reporting System are available at http://www.cdc.gov/nors. † If at least one etiology was laboratory-confirmed, the outbreak was considered to have a confirmed etiology. If no etiology was laboratory-confirmed, but an etiology was reported based on clinical or epidemiologic features, the outbreak was considered to have a suspected etiology. A guide to confirming foodborne disease diagnoses in outbreaks is available at http://www.cdc.gov/outbreaknet/ references_resources/guide_confirming_diagnosis.html. § The 17 mutually exclusive food commodities are as follows: fish, crustaceans, mollusks, dairy, eggs, beef, game, pork, poultry, grains-beans, oils-sugars, fruits- nuts, fungi, sprouts, and leafy, root, and vine-stalk vegetables. ¶ Available at http://www.census.gov/popest. U.S. Department of Health and Human Services Centers for Disease Control and Prevention Morbidity and Mortality Weekly Report Weekly / Vol. 62 / No. 3 January 25, 2013
Transcript
INSIDE48 Progress in Immunization Information Systems
— United States, 2011 52 Infant Meningococcal Vaccination: Advisory
Committee on Immunization Practices (ACIP) Recommendations and Rationale
55 Notes from the Field: Emergence of New Norovirus Strain GII.4 Sydney — United States, 2012
56 Notes from the Field: Emergency Department Visits and Hospitalizations for Buprenorphine Ingestion by Children — United States, 2010–2011
58 QuickStats
Continuing Education examination available at http://www.cdc.gov/mmwr/cme/conted_info.html#weekly.
Surveillance for Foodborne Disease Outbreaks — United States, 2009–2010
Known pathogens cause an estimated 9.4 million foodborne illnesses annually in the United States (1). CDC collects data on foodborne disease outbreaks submitted by all states, the District of Columbia, and Puerto Rico through CDC’s Foodborne Disease Outbreak Surveillance System. Data reported for each outbreak include the number of illnesses, hospitalizations, and deaths; the etiologic agent; the implicated food vehicle; and other factors involved in food preparation and consump-tion. During 2009–2010, a total of 1,527 foodborne disease outbreaks (675 in 2009 and 852 in 2010) were reported, resulting in 29,444 cases of illness, 1,184 hospitalizations, and 23 deaths. Among the 790 outbreaks with a single laboratory-confirmed etiologic agent, norovirus was the most commonly reported, accounting for 42% of outbreaks. Salmonella was second, accounting for 30% of outbreaks. Among the 299 outbreaks attributed to a food composed of ingredients from one of 17 predefined, mutually exclusive food commodities (2), those most often implicated were beef (13%), dairy (12%), fish (12%), and poultry (11%). The commodities in the 299 outbreaks associated with the most illnesses were eggs (27% of illnesses), beef (11%), and poultry (10%). Public health, regulatory, and food industry professionals can use this infor-mation when creating targeted control strategies along the farm-to-table continuum for specific agents, specific foods, and specific pairs of agents and foods. This information also supports efforts to promote safe food-handling practices among food workers and the public.
CDC defines a foodborne disease outbreak as the occurrence of two or more similar illnesses resulting from ingestion of a common food. State, local, tribal, and territorial health depart-ment officials voluntarily submit reports of outbreaks inves-tigated by their agency to the Foodborne Disease Outbreak Surveillance System on a standard, Internet-based form.* This report analyzes outbreaks that were reported by August 2, 2012, in which the first illness occurred during 2009–2010. Data
reported for each outbreak include the number of illnesses, hospitalizations, and deaths; the etiologic agent (confirmed or suspected†); the implicated food vehicle; factors contributing to food contamination; and the settings of food preparation and consumption. Foods were assigned to one of 17 commodi-ties§ if a single contaminated ingredient was identified or if all ingredients belonged to that commodity (2). Outbreaks identifying foods that could not be assigned to one of the 17 commodities, or for which the report contained insufficient information for commodity assignment, were not attributed to any commodity. Population-based outbreak reporting rates were calculated for each state using U.S. Census estimates of the 2009 and 2010 state populations.¶
* The reporting form and guidance for reporting via the National Outbreak Reporting System are available at http://www.cdc.gov/nors.
† If at least one etiology was laboratory-confirmed, the outbreak was considered to have a confirmed etiology. If no etiology was laboratory-confirmed, but an etiology was reported based on clinical or epidemiologic features, the outbreak was considered to have a suspected etiology. A guide to confirming foodborne disease diagnoses in outbreaks is available at http://www.cdc.gov/outbreaknet/references_resources/guide_confirming_diagnosis.html.
§ The 17 mutually exclusive food commodities are as follows: fish, crustaceans, mollusks, dairy, eggs, beef, game, pork, poultry, grains-beans, oils-sugars, fruits-nuts, fungi, sprouts, and leafy, root, and vine-stalk vegetables.
¶ Available at http://www.census.gov/popest.
U.S. Department of Health and Human ServicesCenters for Disease Control and Prevention
Morbidity and Mortality Weekly ReportWeekly / Vol. 62 / No. 3 January 25, 2013
The MMWR series of publications is published by the Office of Surveillance, Epidemiology, and Laboratory Services, Centers for Disease Control and Prevention (CDC), U.S. Department of Health and Human Services, Atlanta, GA 30333.Suggested citation: Centers for Disease Control and Prevention. [Article title]. MMWR 2013;62:[inclusive page numbers].
Centers for Disease Control and PreventionThomas R. Frieden, MD, MPH, Director
Harold W. Jaffe, MD, MA, Associate Director for ScienceJames W. Stephens, PhD, Director, Office of Science Quality
Denise M. Cardo, MD, Acting Deputy Director for Surveillance, Epidemiology, and Laboratory ServicesStephanie Zaza, MD, MPH, Director, Epidemiology and Analysis Program Office
MMWR Editorial and Production StaffRonald L. Moolenaar, MD, MPH, Editor, MMWR Series
John S. Moran, MD, MPH, Deputy Editor, MMWR SeriesTeresa F. Rutledge, Managing Editor, MMWR Series
Douglas W. Weatherwax, Lead Technical Writer-EditorDonald G. Meadows, MA, Jude C. Rutledge, Writer-Editors
Martha F. Boyd, Lead Visual Information Specialist
Maureen A. Leahy, Julia C. Martinroe, Stephen R. Spriggs, Terraye M. Starr
Visual Information SpecialistsQuang M. Doan, MBA, Phyllis H. King
Information Technology Specialists
MMWR Editorial BoardWilliam L. Roper, MD, MPH, Chapel Hill, NC, Chairman
Matthew L. Boulton, MD, MPH, Ann Arbor, MIVirginia A. Caine, MD, Indianapolis, INBarbara A. Ellis, PhD, MS, Atlanta, GA
Jonathan E. Fielding, MD, MPH, MBA, Los Angeles, CADavid W. Fleming, MD, Seattle, WA
William E. Halperin, MD, DrPH, MPH, Newark, NJKing K. Holmes, MD, PhD, Seattle, WA
Timothy F. Jones, MD, Nashville, TN
Rima F. Khabbaz, MD, Atlanta, GADennis G. Maki, MD, Madison, WI
Patricia Quinlisk, MD, MPH, Des Moines, IAPatrick L. Remington, MD, MPH, Madison, WI
John V. Rullan, MD, MPH, San Juan, PRWilliam Schaffner, MD, Nashville, TN
Dixie E. Snider, MD, MPH, Atlanta, GA
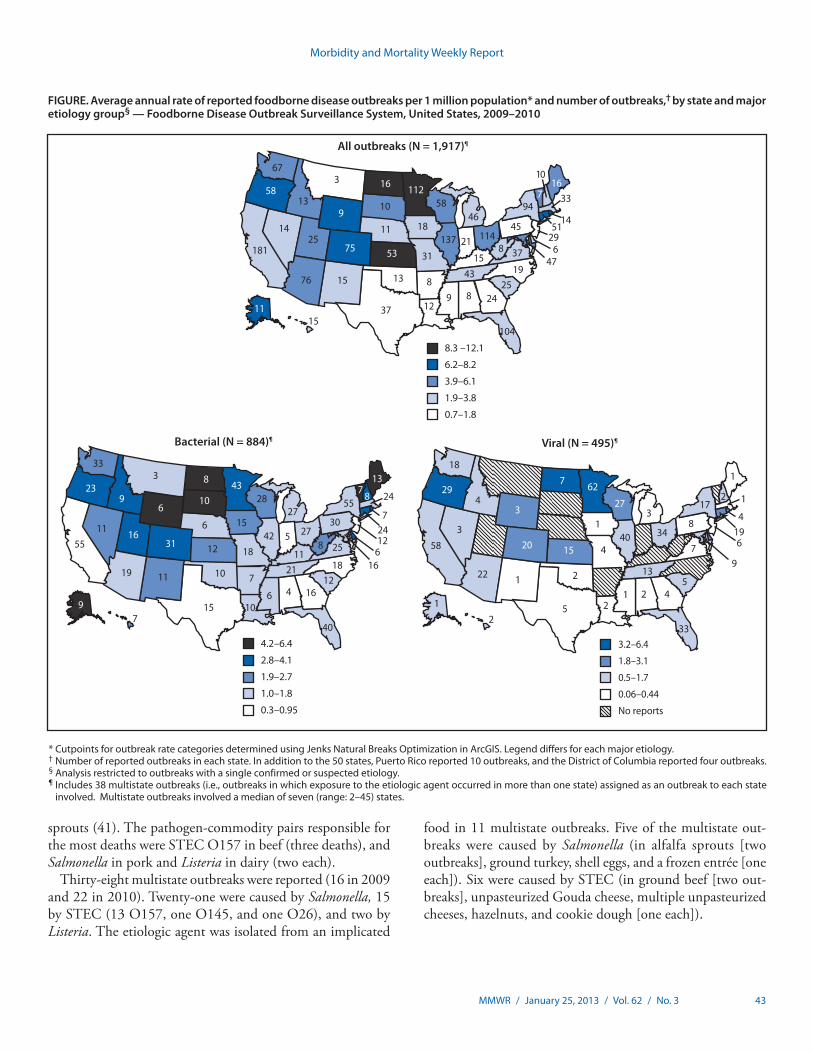
Public health officials from all 50 states, the District of Columbia, and Puerto Rico reported 1,527 outbreaks, includ-ing 675 in 2009 and 852 in 2010. For the period 2009–2010, the median average annual rate of foodborne outbreaks among states was 3.2 per 1 million population (Figure).
A single confirmed or suspected etiologic agent was identified in 1,022 (67%) outbreaks (790 confirmed and 232 suspected) (Table 1). Among the 790 outbreaks with a single confirmed etiologic agent, bacteria caused 413 (52%) outbreaks, viruses caused 336 (42%), chemicals and toxins caused 39 (5%), and parasites caused 2 (0.2%). Norovirus was the most common cause of outbreaks and illnesses, accounting for 331 (42%) of the confirmed, single-etiology outbreaks and 7,332 (37%) ill-nesses. Salmonella was next, causing 234 (30%) of confirmed, single-etiology outbreaks and 7,039 (36%) illnesses. Among the 225 confirmed Salmonella outbreaks with a serotype reported, Enteritidis was the most common serotype with 76 outbreaks (34%). Shiga toxin–producing Escherichia coli (STEC) caused 58 confirmed, single-etiology outbreaks, of which 53 were caused by serogroup O157.
Of the 29,444 outbreak-related illnesses, 1,184 (4%) resulted in hospitalization. Salmonella caused the most outbreak-related hospitalizations with 583 (49%), followed by STEC with 190 (16%) and norovirus with 109 (9%). Outbreaks caused by Listeria resulted in the highest proportion of persons hospital-ized (82%), followed by Clostridium botulinum (67%), and paralytic shellfish poisoning outbreaks (67%). Among the
23 deaths, 22 were attributed to bacterial etiologies (nine to Listeria monocytogenes, five Salmonella, four STEC O157, three Clostridium perfringens, and one Shigella), and one to norovirus.
A food vehicle was reported for 653 (43%) outbreaks; in 299 (46%) of these outbreaks the vehicle could be assigned to one of the 17 predefined commodities (Table 2). The commodi-ties most commonly implicated were beef, with 39 outbreaks (13%), followed by dairy and fish with 37 (13%) each, and poultry with 33 (11%). Among the 36 dairy-associated out-breaks for which pasteurization information was reported, 26 (81%) involved unpasteurized products. The commodities associated with the most outbreak-related illnesses were eggs with 2,231 illnesses (27%), beef with 928 (11%), and poultry with 826 (10%). The pathogen-commodity pairs responsible for the most outbreaks were Campylobacter in unpasteurized dairy (17 outbreaks), Salmonella in eggs and STEC O157 in beef (15 each), ciguatoxin in fish (12), and scombroid toxin (histamine fish poisoning) in fish (10). The pathogen-commodity pairs responsible for the most outbreak-related illnesses were Salmonella in eggs (2,231 illnesses), Salmonella in sprouts (493), and Salmonella in vine-stalk vegetables** (422). The pathogen-commodity pairs responsible for the most hospitalizations were Salmonella in vine-stalk vegetables (88 hospitalizations), STEC O157 in beef (46), and Salmonella in
** Defined as those vegetables that grow on either a vine or a stalk, such as tomatoes, corn, cucumbers, eggplant, green beans, peppers, pumpkin, zucchini, okra, peas, and squash.
Morbidity and Mortality Weekly Report
MMWR / January 25, 2013 / Vol. 62 / No. 3 43
sprouts (41). The pathogen-commodity pairs responsible for the most deaths were STEC O157 in beef (three deaths), and Salmonella in pork and Listeria in dairy (two each).
Thirty-eight multistate outbreaks were reported (16 in 2009 and 22 in 2010). Twenty-one were caused by Salmonella, 15 by STEC (13 O157, one O145, and one O26), and two by Listeria. The etiologic agent was isolated from an implicated
food in 11 multistate outbreaks. Five of the multistate out-breaks were caused by Salmonella (in alfalfa sprouts [two outbreaks], ground turkey, shell eggs, and a frozen entrée [one each]). Six were caused by STEC (in ground beef [two out-breaks], unpasteurized Gouda cheese, multiple unpasteurized cheeses, hazelnuts, and cookie dough [one each]).
FIGURE. Average annual rate of reported foodborne disease outbreaks per 1 million population* and number of outbreaks,† by state and major etiology group§ — Foodborne Disease Outbreak Surveillance System, United States, 2009–2010
* Cutpoints for outbreak rate categories determined using Jenks Natural Breaks Optimization in ArcGIS. Legend differs for each major etiology.† Number of reported outbreaks in each state. In addition to the 50 states, Puerto Rico reported 10 outbreaks, and the District of Columbia reported four outbreaks.§ Analysis restricted to outbreaks with a single confirmed or suspected etiology.¶ Includes 38 multistate outbreaks (i.e., outbreaks in which exposure to the etiologic agent occurred in more than one state) assigned as an outbreak to each state
involved. Multistate outbreaks involved a median of seven (range: 2–45) states.
All outbreaks (N = 1,917)¶
8.3 –12.1
6.2–8.2
3.9–6.1
1.9–3.8
0.7–1.8
67
58
76
137 114
10
75
16 11258
46
15
218 37
1925
18
24
43
8912
8
10
11
3
25
13
14
181
37
1315
94
45
167
31
9
53
33
47
1451
296
1511
104
4.2–6.4
2.8–4.1
1.9–2.7
1.0–1.8
0.3–0.95
Bacterial (N = 884)¶
923
31
8 4328
137
8 24
724
16
12
55
30
1812
16
40
7
6
21
2742
11
5
27
18
15
15
12
19
55
7
25
104
8
1011
11 16
3
6
9
6
10
6
33
3.2–6.4
1.8–3.1
0.5–1.7
0.06–0.44
No reports
Viral (N = 495)¶
18
429
20
7 62
27
1
2
419
9
6
17
8
54
33
13
3440
31
5 2
2
15
22
58
2
3
3
1
1
4
1 2
7
1
1
Morbidity and Mortality Weekly Report
44 MMWR / January 25, 2013 / Vol. 62 / No. 3
TABLE 1. Number and percentage of reported foodborne disease outbreaks, outbreak-associated illnesses, and hospitalizations, by etiology (confirmed or suspected)* — Foodborne Disease Outbreak Surveillance System, 2009–2010
Etiology
Outbreaks Illnesses Hospitalizations
2009 2010Total 2009 and
2010 2009 2010Total 2009 and
2010 2009 2010Total 2009 and
2010
CE SE CE SE No. (%) CE SE CE SE No. (%) CE SE CE SE No (%)
Abbreviations: CE = confirmed etiology; SE = suspected etiology. * If at least one etiology was laboratory-confirmed, the outbreak was considered to have a confirmed etiology. If no etiology was laboratory-confirmed, but an etiology was reported based
on clinical or epidemiologic features, the outbreak was considered to have a suspected etiology. † Salmonella serotypes causing more than five outbreaks are Enteriditis (76 outbreaks), Newport (29), Typhimurium (27), Heidelberg (15), Montevideo (nine), Javiana (eight), Oranienburg
O26:H11 (one confirmed outbreak). ¶ Campylobacter jejuni (31 confirmed outbreaks, four suspected outbreaks) , Campylobacter unknown (three confirmed outbreaks, two suspected outbreaks). ** Bacillus cereus (12 confirmed outbreaks, 12 suspected outbreaks), Bacillus unknown (one suspected outbreak). †† Staphylococcus aureus (nine confirmed outbreaks, 10 suspected outbreaks). §§ Shigella sonnei (eight confirmed outbreaks). ¶¶ Listeria monocytogenes (nine confirmed outbreaks). *** The denominator for the total etiology percentages is the known etiology total. The denominator for the known etiology, unknown etiology, and multiple etiologies percentages is the total (all etiologies). ††† An etiologic agent was not confirmed or suspected based on clinical, laboratory, or epidemiologic information. §§§ Because of rounding, numbers might not add up to the etiology category total or the known etiology total.
Morbidity and Mortality Weekly Report
MMWR / January 25, 2013 / Vol. 62 / No. 3 45
TABLE 2. Number of reported foodborne disease outbreaks and outbreak-associated illnesses, by etiology (confirmed or suspected)* and food commodity status — United States, 2009–2010
Etiology
No. of outbreaks (No. of illnesses)
Attributed to a single commodity
Attributed to food vehicle containing >1 commodity
* If at least one etiology was laboratory-confirmed, the outbreak was considered to have a confirmed etiology. If no etiology was lab-confirmed, but an etiology was reported based on clinical or epidemiologic features, the outbreak was considered to have a suspected etiology.
† Salmonella serotypes causing more than five outbreaks are Enteriditis (76 outbreaks), Newport (29), Typhimurium (27), Heidelberg (15), Montevideo (nine), Javiana (eight), Oranienburg (seven), Saintpaul (six) and Infantis (six).
¶ Campylobacter jejuni (31 confirmed outbreaks, four suspected outbreaks), Campylobacter unknown (three confirmed outbreaks, two suspected outbreaks). ** Bacillus cereus (12 confirmed outbreaks, 12 suspected outbreaks), Bacillus unknown (one suspected outbreak). †† Staphylococcus aureus (nine confirmed outbreaks, 10 suspected outbreaks). §§ Shigella sonnei (eight confirmed outbreaks). ¶¶ Listeria monocytogenes (nine confirmed outbreaks). *** The denominator for the total etiology percentages is the known etiology total. The denominator for the known etiology, unknown etiology, and multiple etiologies
percentages is total (all etiologies). ††† An etiologic agent was not confirmed or suspected based on clinical, laboratory, or epidemiologic information. §§§ Because of rounding, numbers might not add up to the etiology category total or the known etiology total.
Morbidity and Mortality Weekly Report
46 MMWR / January 25, 2013 / Vol. 62 / No. 3
Among the 766 outbreaks with a known single setting where food was consumed, 48% were caused by food consumed in a restaurant or deli, and 21% were caused by food consumed in a private home. Forty-three outbreaks resulted in product recalls.†† The recalled foods were ground beef (eight out-breaks), sprouts (seven), cheese and cheese-containing products (six), oysters (five), raw milk (three), eggs (three), and salami (ground pepper), bison, sirloin steak, unpasteurized apple cider, cookie dough, frozen mamey fruit, hazelnuts, Romaine lettuce, ground turkey burger, tuna steak, and a frozen entrée (one each).
Reported by
L. Hannah Gould, PhD, Elisabeth A. Mungai, MS, MPH, Shacara D. Johnson, MSPH, LaTonia C. Richardson, MS, Ian T. Williams, PhD, Patricia M. Griffin, MD, Dana J. Cole, DVM, PhD, Div of Foodborne, Waterborne, and Environmental Diseases, National Center for Emerging and Zoonotic Infectious Diseases; Aron J. Hall, DVM, Div of Viral Diseases, National Center for Immunization and Respiratory Diseases, CDC. Corresponding contributor: L. Hannah Gould, [email protected], 404-639-3315.
Editorial Note
In 2009, the Foodborne Disease Outbreak Surveillance System transitioned to the use of a new reporting form and online data entry interface, the National Outbreak Reporting System (NORS). NORS receives reports of outbreaks of enteric disease transmitted through water, person-to-person contact, contact with animals, environmental contamination, and indeterminate means, as well as through food. Before 2009, only foodborne and waterborne outbreaks were reported to CDC. Following the transition to the new system, the number of foodborne disease outbreaks reported in 2009 and 2010 declined 32% compared with the mean of the preceding 5 years (4).
The decline in foodborne disease outbreak reporting was largely observed among norovirus outbreaks. Norovirus can be transmitted through a variety of routes, including direct contact between persons, through contact with contaminated surfaces, and ingestion of contaminated food or water (5,6). Distinguishing among these modes of transmission in an outbreak can be challenging; some outbreaks involve multiple transmission routes. The advent of NORS, which for the first time enables electronic reporting of nonfoodborne norovirus outbreaks, might have led to more appropriate classification of outbreaks previously reported as foodborne, resulting in
†† Additional information on product recalls is available at http://www.fda.gov/safety/recalls/default.htm and http://www.fsis.usda.gov/fsis_recalls/index.asp.
fewer reports of foodborne norovirus outbreaks. Other pos-sible explanations for the fewer foodborne disease outbreaks in 2009 and 2010 include resource limitations and competing priorities (e.g., the influenza A [H1N1] virus pandemic in 2009) for state epidemiologic and laboratory resources (7,8).
For STEC O157 and Salmonella serotype Enteritidis, the number of outbreaks reported was not lower than previous years. For STEC O157, the 33 outbreaks in 2009 and 20 in 2010 exceeded the Healthy People 2010 yearly target of 11, and for Salmonella serotype Enteritidis, the 39 outbreaks in 2009 and 37 outbreaks in 2010 exceeded the Healthy People 2010 yearly target of 22 (9).
During 2009–2010, beef, dairy, fish, and poultry were associ-ated with the largest number of foodborne disease outbreaks. During the preceding 11 years, beef, fish, and poultry were consistently among the commodities most commonly associ-ated with outbreaks (4). The large number of outbreaks caused by unpasteurized dairy products is consistent with findings that more outbreaks occur in states that permit the sale of unpasteurized dairy products (10); 60% of states permit sales of raw milk in some form, according to a 2011 survey by the National Association of State Departments of Agriculture.§§
The findings in this report are subject to at least four limi-tations. First, only a small proportion of foodborne illnesses reported each year are identified as associated with outbreaks.
§§ Available at http://www.nasda.org/file.aspx?id=3916.
What is already known about this topic?
Surveillance for foodborne disease outbreaks can identify opportunities to prevent foodborne diseases, which cause millions of illnesses in the United States each year.
What is added by this report?
Among the 1,527 foodborne disease outbreaks reported in 2009 and 2010, most outbreak-associated illnesses were caused by norovirus or Salmonella. Among outbreaks in which both an etiologic agent and single-commodity food vehicle were identified, most outbreaks were attributed to Campylobacter in unpasteurized dairy products, Salmonella in eggs, and Shiga toxin–producing Escherichia coli O157 in beef. The pathogen-commodity pairs responsible for the most outbreak-related illnesses were Salmonella in eggs (2,231 illnesses), in sprouts (493), and in vine-stalk vegetables (422).
What are the implications for public health practice?
Public health, regulatory, and food industry professionals can use this information when creating targeted control strategies along the farm-to-table continuum for specific agents and foods, and specific pairs of agents and foods. This information also supports efforts to promote safe food-handling practices among food workers and the public.
The extent to which the distributions of food vehicles and set-tings implicated in foodborne disease outbreaks reflect the same vehicles and settings as sporadic foodborne illnesses is unknown (4). Similarly, not all outbreaks are identified, investigated, or reported. Second, many reported outbreaks had an unknown etiology, an unknown food vehicle, or both, and conclusions drawn from outbreaks with a confirmed or suspected etiology or food vehicle might not apply to outbreaks with an unknown etiology or food vehicle. Even when a food is identified, the point of contamination is not always known or reported. Third, CDC’s outbreak surveillance system is dynamic; agencies can submit new reports and can change or delete previous reports as new information becomes available. Therefore, the results of this analysis might differ from those published earlier or from future reports. Finally, because of changes in the surveillance system implemented in 2009, comparisons with preceding years should be made with caution.
Public health, regulatory, and food industry professionals use foodborne disease outbreak surveillance data to target preven-tion efforts related to pathogens and foods that cause foodborne disease outbreaks. Additional information on outbreaks and the Foodborne Outbreak Online Database are available at http://www.cdc.gov/outbreaknet/surveillance_data.html.
References 1. Scallan E, Hoekstra RM, Angulo FJ, et al. Foodborne illness acquired in
the United States—major pathogens. Emerg Infect Dis 2011;17:7–15. 2. Painter JA, Ayers T, Woodruff R, et al. Recipes for foodborne outbreaks:
a scheme for categorizing and grouping implicated foods. Foodborne Pathog Dis 2009;6:1259–64.
3. Neil KP, Biggerstaff G, MacDonald JK, et al. A novel vehicle for transmission of Escherichia coli O157:H7 to humans: multistate outbreak of E. coli O157:H7 infections associated with consumption of ready-to-bake commercial prepackaged cookie dough—United States, 2009. Clin Infect Dis 2012;54:511–8.
6. Hall AJ, Eisenbart VG, Etingue AL, Gould LH, Lopman B, Parashar UD. Epidemiology of foodborne norovirus outbreaks, United States, 2001–2008. Emerg Infect Dis 2012;18:1566–73.
7. American Public Health Association. The public health workforce shortage: left unchecked, will we be protected? Washington, DC: American Public Health Association; 2006.
8. National Association of County and City Health Officials. Local health department job losses and program cuts: findings from January/February 2010 survey. Washington, DC: National Association of County and City Health Official; 2012.
9. US Department of Health and Human Services. Food safety. Healthy people 2010 (midcourse review). Washington, DC: US Department of Health and Human Services; 2000.
10. Langer AJ, Ayers T, Grass J, Lynch M, Angulo FJ, Mahon BE. Nonpasteurized dairy products, disease outbreaks, and state laws—United States, 1993–2006. Emerg Infect Dis 2012;18:385–91.
Progress in Immunization Information Systems — United States, 2011
Immunization information systems (IIS) are confidential, computerized, population-based systems that collect and consolidate vaccination data from vaccination providers and provide important tools for designing and sustaining effective immunization strategies (1,2). A Healthy People 2020 objective (IID-18) is to increase to 95% the proportion of children aged <6 years whose immunization records are in fully operational, population-based IIS (3). The National Vaccine Advisory Committee (NVAC) has published goals for IIS, including required and optional core data elements for which IIS should collect information (4,5). Two of the required core data elements are vaccine manufacturer and vaccine lot number. To monitor progress toward achieving these and other program goals, CDC annually surveys 56 immunization program grantees using the IIS Annual Report (IISAR). Results from the 2011 IISAR (com-pleted by 54 grantees) indicate that 84% (19.2 million) of U.S. children aged <6 years participated in IIS, as defined by having at least two recorded vaccinations, an increase from 82% (18.8 million) in 2010 (1). Grantees reported that an average of 63% of vaccination records for these children contained data in the field for vaccine manufacturer and 60% contained data in the field for lot number. A new project under way to capture vac-cine product information, expiration date, and lot number on two-dimensional (2D) barcodes on vaccine vials might increase completeness, accuracy, and availability of these data elements in patient medical records and IIS, which in turn might enhance vaccine safety and support vaccine inventory management.
Of the 56 immunization program grantees (50 states, five cities,* and the District of Columbia), 2011 IISAR data† were available for 54 grantees. Connecticut did not report, and New Hampshire was not eligible because it did not have an IIS in 2011. The self-administered survey asked about par-ticipation in IIS, data quality indicators, and IIS functionality (e.g., interoperability with electronic health records, vaccine inventory management, and use of IIS data).
Child Participation in IIS Child participation was defined as having two or more vac-
cinations documented in an IIS. Participation was calculated by dividing the number of children aged <6 years in an IIS who met this criteria by the 2011 U.S. Census estimate for the number of children of the same age group in the grantee’s
geographic area (6). Demographic data in IIS initially are obtained from birth certificates and birth hospital records, which often also contain records of the birth dose of hepatitis B vaccine. Defining participation in IIS as having ≥2 recorded vaccine doses makes it highly likely that the child received at least one vaccination from a provider other than the birth hospital who participates in IIS.
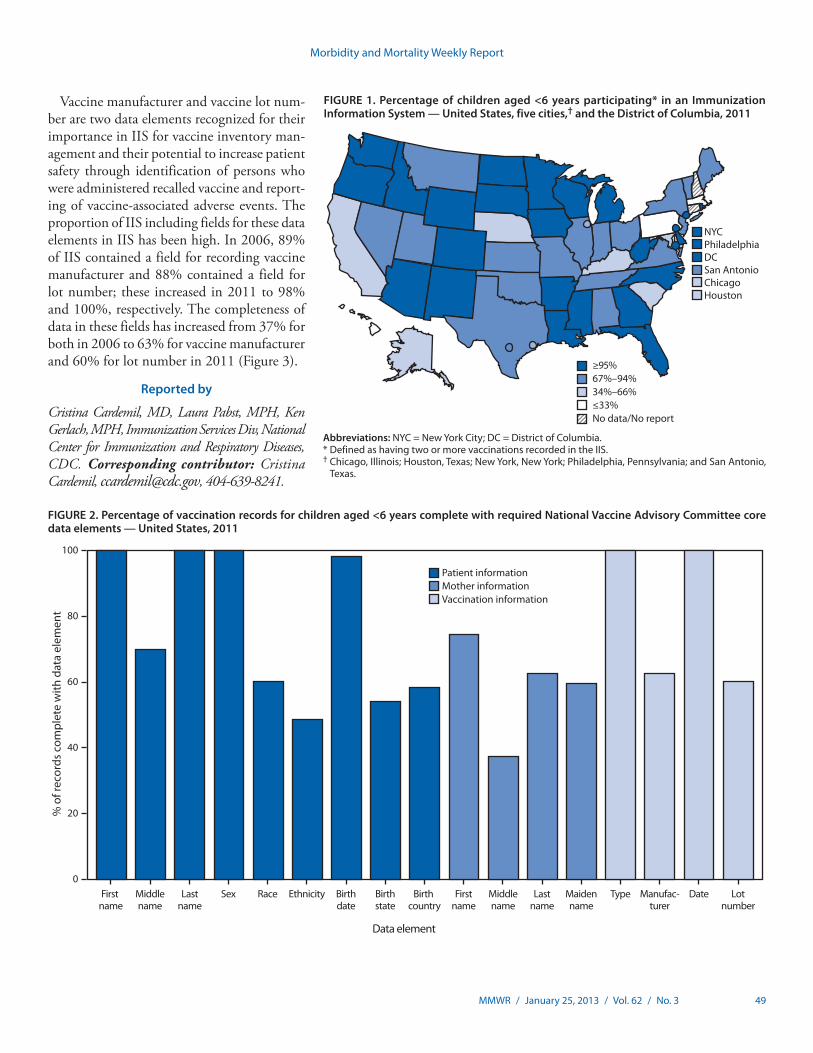
Nationally, 19.2 million U.S. children aged <6 years (84%) participated in an IIS in 2011. Child participation in IIS has increased steadily, from 63% in 2006 (1) to 84% in 2011. Of the 54 grantees with available data in 2011, 24 (44%) reported that >95% of children aged <6 years in their geographic area par-ticipated in their IIS. An additional 13 (24%) grantees reported child participation rates ranging from 80% to 94% (Figure 1).
Core Data Elements Each year, CDC collects IISAR information on the percent-
age of grantees meeting 12 NVAC functional standards for IIS (4,5). The initial standards were developed in 2001; NVAC revised and published new IIS functional standards in 2007. Progress in meeting functional standard 1, electronically store data on NVAC-required core data elements,§ is reported here. For each of the 12 NVAC-required core data elements, grantees report if their IIS contains a field for that element and, for those that do, the percentage of records¶ belonging to children aged <6 years that contain data in the field. Three of the 12 core data elements contain multiple components for a total of 18 data elements. These data are used to calculate an unweighted U.S. national average for field completeness.
Among the 54 grantees reporting in 2011, 32 (59%) included a field for each of the 18 data elements in their IIS. The most common data elements not included in IIS were birth order for multiple births only (nine grantees), mother’s middle name (eight grantees), and birth country (six grantees). Average completeness of NVAC core data elements for children aged <6 years ranged from 38% for mother’s middle name to ≥98% for six fields (patient’s first name, last name, sex, birth date, vaccine type, and vaccination date) (Figure 2).
* Chicago, Illinois; Houston, Texas; New York, New York; Philadelphia, Pennsylvania; and San Antonio, Texas.
† Additional information available at http://www.cdc.gov/vaccines/programs/iis/annual-report-iisar/index.html.
§ Required core data elements include the patient’s name (first, middle, last), sex, race, ethnicity, birth date, birth state/country, birth order, mother’s name (first, middle, last, maiden), vaccine type, vaccine manufacturer, vaccination date, vaccine lot number. Data on birth order is not reported here because field completeness can only be assessed if a person is part of a multiple birth, which is a relatively infrequent event.
¶ IIS contain one record per child and a field for each data element pertaining to a patient’s and mother’s demographic information. Each child has multiple vaccination records, and each of these vaccination records has an associated field for each data element pertaining to that vaccination (e.g., manufacturer, date, and lot number).
Vaccine manufacturer and vaccine lot num-ber are two data elements recognized for their importance in IIS for vaccine inventory man-agement and their potential to increase patient safety through identification of persons who were administered recalled vaccine and report-ing of vaccine-associated adverse events. The proportion of IIS including fields for these data elements in IIS has been high. In 2006, 89% of IIS contained a field for recording vaccine manufacturer and 88% contained a field for lot number; these increased in 2011 to 98% and 100%, respectively. The completeness of data in these fields has increased from 37% for both in 2006 to 63% for vaccine manufacturer and 60% for lot number in 2011 (Figure 3).
Reported by
Cristina Cardemil, MD, Laura Pabst, MPH, Ken Gerlach, MPH, Immunization Services Div, National Center for Immunization and Respiratory Diseases, CDC. Corresponding contributor: Cristina Cardemil, [email protected], 404-639-8241.
FIGURE 1. Percentage of children aged <6 years participating* in an Immunization Information System — United States, five cities,† and the District of Columbia, 2011
NYCPhiladelphiaDCSan AntonioChicagoHouston
≥95%67%–94%34%–66%≤33%No data/No report
Abbreviations: NYC = New York City; DC = District of Columbia.* Defined as having two or more vaccinations recorded in the IIS.† Chicago, Illinois; Houston, Texas; New York, New York; Philadelphia, Pennsylvania; and San Antonio,
Texas.
FIGURE 2. Percentage of vaccination records for children aged <6 years complete with required National Vaccine Advisory Committee core data elements — United States, 2011
80
60
40
20
100
0
% o
f rec
ords
com
plet
e w
ith d
ata
elem
ent
First name
Middlename
Lastname
Sex Race Ethnicity Birthdate
Birthstate
Birth country
Firstname
Middlename
Lastname
Maidenname
Type Manufac-turer
Date Lotnumber
Data element
Patient informationMother informationVaccination information
Morbidity and Mortality Weekly Report
50 MMWR / January 25, 2013 / Vol. 62 / No. 3
Editorial Note
Child participation in IIS and completeness of data for vac-cine manufacturer and lot number in IIS increased steadily from 2006 to 2011. Despite this progress, challenges remain to meeting the Healthy People 2020 objective for child par-ticipation to increase to 95% the proportion of children aged <6 years whose immunization records are in fully operational, population-based IIS, and completeness of the vaccine fields remains suboptimal. Maximal child participation and complete records are needed to fully realize the benefits of IIS, which include clinical decision support, vaccination coverage reports, support for vaccine-preventable disease outbreak response, vaccine inventory management, and the ability to generate reminder and recall messages. Developing and promoting these beneficial tools that IIS offer to providers can encourage provider participation in IIS. If provider participation in IIS increases, child participation increases.
Several ongoing initiatives are expected to increase partici-pation in IIS and improve the completeness and accuracy of data contained in IIS, including enhanced interoperability between IIS and electronic health records (EHRs), the use of IIS to interface with VTrckS, CDC’s vaccine tracking system for publicly purchased vaccine, and the use of 2D barcodes to facilitate recording vaccine information in EHRs and IIS. VTrcks and interoperability initiatives have been reported on previously (1,7). The 2D barcode project is an additional initiative that might help to address the completeness and accuracy of these fields.
In September 2011, CDC initiated a 2D vaccine barcode pilot project** to assess the impact and best practices of 2D
barcoded vaccines on vaccine administration and inventory management. This pilot project also will assess the ability of 2D barcoding technology to improve the completeness and accuracy of electronically stored immunization information. Printed 2D barcodes encode more information in a smaller area than the space needed for linear barcodes, meaning that all vaccine product data can be encoded into a symbol compact enough to appear on a single-dose vial or syringe. Although the linear barcode could hold the information, space constraints on the vial or syringe make the use of the linear barcode unrealistic. A 2D barcode will contain a Global Trade Identification Number that uniquely identifies the product and manufacturer, the lot expiration date, and the lot number. Pilot participants include 10 CDC immunization program grantees, 220 immunization providers (public and private), and two vaccine manufacturers.
Documenting vaccine product information and lot number is required by the National Childhood Vaccine Injury Act of 1986, and the American Academy of Pediatrics recommends documenting vaccine expiration date to improve patient safety. To report vaccine product data to an IIS, providers must either type them into an EHR, which transmits data to the IIS, or type the information into the IIS directly. In addition to recording data electronically in an EHR or IIS, some providers also record these data by hand in paper records. Recording information by hand and duplication of entries takes time and resources and increases the likelihood of data entry errors.
Use of a 2D barcode on vaccines could allow for rapid, com-plete, and accurate capture of these vaccine product data by a barcode scanner that could transfer the information to EHRs
FIGURE 3. Percentage of vaccination records for children aged <6 years containing vaccine manufacturer and lot number in immunization information systems — United States, 2006–2011
90
80
70
60
50
40
30
20
10
100
020102009200820072006 2011
Year
% o
f rec
ords
com
plet
e w
ith d
ata
elem
ent
Vaccine manufacturerVaccine lot number
What is already known on this topic?
In 2010, 82% of the 18.8 million U.S. children aged <6 years participated in immunization information systems (IIS).
What is added by this report?
In 2011, 84% (19.2 million) of U.S. children aged <6 years participated in IIS. Among IIS grantees, completeness of data for vaccine manufacturer and vaccine lot number has increased since 2006, but remained suboptimal at 63% and 60%, respec-tively, in 2011. In 2011, CDC initiated a vaccine barcoding pilot project to determine best practices for labeling and tracking vaccines using 2D barcodes that include vaccine product information, lot number, and expiration date.
What are the implications for public health practice?
Widespread adoption of 2D vaccine barcoding among manu-facturers and providers has the potential to increase complete-ness and accuracy of IIS data and improve patient safety. More complete and accurate data elements might provide an additional incentive for providers to participate in IIS, which in turn can increase child participation in IIS.
** Additional information available at http://www.cdc.gov/vaccines/programs/iis/activities/2d-vaccine-barcoding.html and http://www.2dbarcodepilot.com.
and IIS. A CDC assessment of the impact of 2D barcode for vaccine production, clinical documentation, and public health reporting and tracking analyzed the expected costs and benefits of barcode use by immunization providers. The assessment found that for every $1 expended, $2.70–$2.80 in benefits were expected to accrue from 2011 through 2023 (8). Net benefits to society were forecast to be $326 million to $349 million. Among surveyed primary-care providers who did not report immunizations to IIS currently, 63% indicated they would be more likely to do so if the 2D barcode were available.
The findings in this report are subject to at least two limitations. First, data from the IISAR were self-reported and self-validated. Second, because two of the 56 grantees did not report data during the period of data collection, the nationwide IIS participation rates for children aged <6 years and completeness of core data elements might be underesti-mated or overestimated.
As with other technological advances, adoption of 2D bar-code technology for recording vaccination information has the long-term potential to improve vaccine safety monitoring and inventory management, reduce staff time spent manually capturing vaccine data, decrease costs for vaccine stakeholders, and enhance the completeness and accuracy of vaccination information in electronic medical records and IIS. The barcode effort is one of many recent advances in health-care technology that should have the added benefit of reducing the reporting burden on providers while improving the quality of data in IIS. These advances and the resulting increase in data quality might lead to increased vaccine provider, and therefore child, participation in IIS, and achievement of the Healthy People 2020 objective and NVAC goals.
References 1. CDC. Progress in immunization information systems—United States,
vaccinations: immunization information systems. In: Guide to Community Preventive Services. Atlanta, GA: Community Preventive Services Task Force; 2010. Available at http://www.thecommunityguide.org/vaccines/universally/imminfosystems.html.
3. US Department of Health and Human Services. Healthy people 2020. Washington, DC: US Department of Health and Human Services; 2010. Available at http://healthypeople.gov/2020/topicsobjectives2020/objectiveslist.aspx?topicid=23.
4. National Immunization Program, Technical Working Group. 2001 minimum functional standards for registries. Atlanta, GA: National Immunization Program, Technical Working Group; 2011. Available at http://www.cdc.gov/vaccines/programs/iis/func-stds.html.
5. National Vaccine Advisory Committee. Immunization information systems: National Vaccine Advisory Committee (NVAC) progress report. Atlanta, GA: National Vaccine Advisory Committee; 2007. Available at http://www.hhs.gov/nvpo/nvac/reports/index.html.
6. US Census Bureau. State single year of age and sex population estimates: April 1, 2010 to July 1, 2011—resident. Washington, DC: US Census Bureau; 2011. Available at http://www.census.gov/popest/data/state/asrh/2011/index.html.
7. CDC. Progress in immunization information systems—United States, 2009. MMWR 2011;60:10–2.
8. CDC. Impact of a two-dimensional barcode for vaccine production, clinical documentation, and public health reporting and tracking: final report; 2012. Available at http://www.cdc.gov/vaccines/programs/iis/activities/downloads/2d-barcode-trkg-rpt.pdf.
Infant Meningococcal Vaccination: Advisory Committee on Immunization Practices (ACIP) Recommendations and Rationale
At its October 2012 meeting, the Advisory Committee on Immunization Practices (ACIP) voted to recommend vaccination against meningococcal serogroups C and Y for children aged 6 weeks through 18 months at increased risk for meningococcal disease. Meningococcal groups C and Y and Haemophilus b tetanus toxoid conjugate vaccine (Hib-MenCY-TT [MenHibrix, GlaxoSmithKline Biologicals]) is licensed for active immunization for prevention of invasive disease caused by Haemophilus influenzae type b (Hib) and meningococcal serogroups C and Y. Hib-MenCY-TT is not indicated for prevention of disease caused by meningococcal serogroup B, the most common serogroup causing disease in infants, or serogroups W135 or A, which are represented in quadrivalent meningococcal vaccines. Before licensure of Hib-MenCY-TT, no meningococcal conjugate vaccine was licensed for infants aged 2 through 8 months. MenACWY-D (Menactra, Sanofi Pasteur) is licensed as a 2-dose series for infants and toddlers aged 9 through 23 months, and MenACWY-D and MenACWY-CRM (Menveo, Novartis Vaccines) are licensed for persons aged 2 through 55 years as a single dose. These vaccines are recommended routinely for per-sons aged 11 through 18 years and persons aged 2 through 55 years at increased risk for meningococcal disease (and persons aged 9 months through 55 years for MenACWY-D) (1,2). This report summarizes the deliberations of ACIP, the rationale for its decision, and recommendations for use of Hib-MenCY-TT in infants at increased risk for meningococcal disease.
Methods On June 14, 2012, the Food and Drug Administration
licensed Hib-MenCY-TT for the prevention of invasive Hib and serogroups C and Y meningococcal disease in children aged 6 weeks through 18 months (3). In monthly teleconfer-ences during 2009–2012 and annual in-person meetings, ACIP’s Meningococcal Vaccines Work Group reviewed safety and immunogenicity data from phase 2 and phase 3 clinical trials as well as data on disease epidemiology and the infant vaccination schedule. The work group reviewed published peer-reviewed literature and unpublished data that were relevant to infant meningococcal vaccination. Summaries of the data that were reviewed and work group discussions were presented to ACIP before recommendations were proposed. Proposed infant meningococcal vaccination recommendations were presented at the October 2012 ACIP meeting and approved by ACIP.
Hib-MenCY-TT Safety and Immunogenicity Hib-MenCY-TT is a combination of three discrete
polysaccharide-protein conjugates. Each capsular polysac-charide is bound covalently to tetanus toxoid. The first dose may be given as early as age 6 weeks. The fourth dose may be given as late as age 18 months. Hib-MenCY-TT is supplied as a single-dose vial of lyophilized vaccine to be reconstituted with the accompanying vial of saline diluent (3). Hib-MenCY-TT effectiveness was inferred based on the following: 1) Hib anti-body responses after Hib-MenCY-TT vaccination that were comparable to antibody responses after Hib-TT (first 3 doses) or Hib polyribosylribitol phosphate–meningococcal outer membrane protein (PRP-OMP) (PedvaxHIB, Merck and Co) (fourth dose) vaccination, and 2) the proportion of persons with measurable meningococcal serogroups C and Y serum bactericidal activity using human complement (hSBA) after Hib-MenCY-TT vaccination. Evaluation of hSBA responses in clinical studies could be used to infer protection because an association between serum bactericidal activity and clinical effectiveness already exists (4). In the United States, meningo-coccal clinical endpoint efficacy trials with Hib-MenCY-TT were not feasible, and no meningococcal vaccine is licensed and available for this age group to allow a comparative trial.
A single-blinded, controlled, multicenter study with two parallel randomized groups was conducted to evaluate safety and immunogenicity of Hib-MenCY-TT compared with U.S.-licensed Hib-TT (ActHIB, Sanofi Pasteur) in healthy infants at ages 2, 4, and 6 months (5). The proportions of children who, after dose 3, had hSBA titers ≥1:8 (the clinical threshold defined as protective) to serogroups C and Y were 99% and 96%, respectively (5). The proportion of children who had anti-HibPRP antibody concentrations ≥1.0 µg/mL (the accepted level indicative of long-term protection) after dose 3 was 96% in the Hib-MenCY-TT group and 91% in the Hib-TT group (5). Hib-MenCY-TT also was evaluated before and after the fourth dose given at age 12–15 months. HibPRP-OMP was used in the control vaccine group. The proportion of subjects with hSBA titers ≥1:8 was 99% for serogroups C and Y 1 month after the fourth dose. The Hib response after the fourth dose also was demonstrated to be noninferior to HibPRP-OMP (the percentage of subjects with anti-HibPRP antibody concentrations ≥1.0 µg/mL was 99.2% in both treatment groups).
Hib-MenCY-TT was co-administered with DTaP-HepB-IPV and 7-valent pneumococcal conjugate vaccine (PCV7)
Morbidity and Mortality Weekly Report
MMWR / January 25, 2013 / Vol. 62 / No. 3 53
at ages 2, 4, and 6 months, and with measles-mumps-rubella, varicella, and PCV7 vaccines at age 12–15 months. In clinical trials, no decreased immunogenicity of coadministered vaccines was observed (5,6). A randomized, controlled, multicenter study evaluated the percentage of subjects with hSBA titers ≥1:8 at 2 months after the second dose was administered at age 4 months. In the group vaccinated with Hib-MenCY-TT, 94% and 83% of subjects achieved hSBA antibody titers ≥1:8 for meningococcal serogroups C and Y, respectively, after dose 2 (7). Rates of local and systemic adverse events observed after administration of Hib-MenCY-TT were comparable to rates observed after administration of Hib-TT. Thus, Hib-MenCY-TT was found to be safe and immunogenic for both Hib and meningococcal serogroups C and Y.
Summary of ACIP Deliberations and Rationale Infants at increased risk for meningococcal disease.
Infants with persistent complement component pathway defi-ciencies or functional or anatomical asplenia have an increased risk for meningococcal disease compared with healthy infants. Complement component deficiencies rarely are observed in infancy, but infants might be identified because of family his-tory. Certain infants with complex congenital heart disease have asplenia, and infants with sickle cell disease often are identified via newborn screening programs. Infants with sickle cell disease initially might have functioning spleens, but develop functional asplenia during early childhood. Infrequently, healthy infants also might be at increased risk because of a serogroups C or Y meningococcal disease outbreak for which vaccination is recommended. The number of U.S. infants in these high-risk groups is small (estimated at 3,000–5,000), making a targeted high-risk vaccination policy feasible and reasonable given the potential increased risk in these infants. Infants who are travel-ing with their families to the Hajj or to the “meningitis belt” of sub-Saharan Africa need protection against serogroups A and W135, which are not in Hib-MenCY-TT, and should receive a quadrivalent meningococcal conjugate vaccination licensed for children aged ≥9 months before travel (8).
Infants not at increased risk for meningococcal disease. ACIP reviewed the burden of meningococcal disease among infants and children aged 0–59 months. Meningococcal disease is a serious, but rare, infectious disease. Rates of meningococcal disease have declined in all age groups since 2000, and, in 2011, the overall rate of meningococcal disease was at a historic low of 0.21 per 100,000 population (CDC, unpublished data, 2011). In the United States, during 1993–2011, average annual rates of meningococcal disease were higher among children aged 0 through 59 months (1.74 per 100,000 population) than in adolescents aged 11 through 19 years (0.57 per 100,000) (CDC, unpublished data, 2011). However, approximately
60% of disease among children aged 0 through 59 months is caused by serogroup B meningococcal disease, which is not prevented by any meningococcal vaccine licensed in the United States. Additionally, the highest incidence in the first 5 years of life occurs in infants aged 0 through 6 months, most of whom are too young to have received the minimum 2 or 3 doses of vaccine that likely will be needed to provide protec-tion. The case-fatality ratio of meningococcal disease caused by serogroups C and Y is lower among children aged <59 months (6%) compared with adolescents (11%) (9,10). During 2007–2009, approximately 77 cases and four to eight deaths from serogroups C and Y Neisseria meningitidis occurred annually in children aged <59 months. For the estimated 205 annual cases of meningococcal disease in children aged <59 months that occurred during 2007–2009, a universal infant meningo-coccal vaccination program would have prevented 40–50 cases (nearly 25% of cases in this age group) (CDC, unpublished data, 2012). The epidemiology of meningococcal disease is dynamic, and rates of disease could increase in the future, requiring a reassessment of immunization strategy.
Presentations, including 1) a cost-effectiveness analysis of vaccinating all U.S. infants, 2) programmatic aspects of adding meningococcal vaccination to the infant routine immuniza-tion schedule, and 3) results of a survey evaluating attitudes of pediatricians and family physicians toward vaccinating all infants with meningococcal vaccines, were made at the October 2011 ACIP meeting and summarized during the October 2012 ACIP meeting.* These considerations support the ACIP deci-sion, but the current epidemiology of meningococcal disease is the primary rationale for the decision. In summary, the current low burden of disease, as well as the low proportion of menin-gococcal cases that are preventable with vaccines that do not protect against serogroup B disease, limit the potential impact of a routine meningococcal vaccination program in infants in the United States. Therefore, ACIP concluded that a targeted approach to protect infants at increased risk for meningococcal disease was the optimal vaccination strategy at this time. At the October 2012 ACIP meeting, ACIP voted to recommend vaccination with Hib-MenCY-TT only for infants at increased risk for meningococcal disease.
ACIP Recommendations for Infants at Increased Risk for Meningococcal Disease
Infants at increased risk for meningococcal disease should be vaccinated with a 4-dose series of Hib-MenCY-TT. These include infants with recognized persistent complement pathway deficiencies and infants who have anatomic or
* Additional information available at http://www.cdc.gov/vaccines/acip/meetings/meetings-info.html.
functional asplenia including sickle cell disease. Additionally, Hib-MenCY-TT can be used in infants aged 6 weeks through 18 months who are in communities with serogroups C and Y meningococcal disease outbreaks, but Hib-MenCY-TT is not adequate for infants traveling to the Hajj or the “meningitis belt” of sub-Saharan Africa (a quadrivalent meningococcal vaccine that contains serogroups A and W135 is required for those infants and may be given starting at age 9 months).
If an infant at increased risk for meningococcal disease is behind on his or her Hib vaccine doses, Hib-MenCY-TT may be used following the same catch-up schedule used for Hib vaccine. However, if the first dose of Hib-MenCY-TT is given at or after 12 months of life, 2 doses should be given at least 8 weeks apart to ensure protection against serogroups C and Y meningococcal disease. For infants at increased risk for meningococcal disease who have received or are going to receive a different Hib vaccine product, ACIP recommends a 2-dose series of MenACWY-D if they are aged 9 through 23 months or either of the two quadrivalent meningococcal vaccine products after age 23 months.
Hib-MenCY-TT may be co-administered with other routine infant vaccinations, including 13-valent pneumococcal conju-gate vaccine. Hib-MenCY-TT should not be co-administered with other Hib-containing vaccines.
Guidance for Use of Hib-MenCY-TT Based on an assessment of the potential public health impact,
including the current low incidence of meningococcal disease in the United States, at this time ACIP does not recommend routine meningococcal vaccination for infants who are not at increased risk for meningococcal disease. Hib-MenCY-TT is safe and immunogenic against Hib and N. meningitidis sero-groups C and Y. Hib-MenCY-TT may be used in any infant for routine vaccination against Hib and will offer some protection against serogroups C and Y meningococcal disease. Four doses of Hib-MenCY-TT fulfill the primary series and booster dose Hib immunization recommendations. If Hib-MenCY-TT vac-cine is used to achieve protection against serogroups C and Y, Hib-MenCY-TT should be used for all 4 doses of Hib vaccine. Because the protection offered by meningococcal vaccines wanes over time, an infant series will be unlikely to provide persistent protection against meningococcal disease until age 11–12 years, the age of recommended adolescent vaccination. Infants and children who received Hib-MenCY-TT and are travelling to areas with high endemic rates of meningococcal disease such as the “meningitis belt” are not protected against serogroups A and W-135 and should receive a quadrivalent meningococcal conjugate vaccine licensed for children aged ≥9 months before travel.
ACIP will continue to reevaluate trends in epidemiology to determine whether meningococcal vaccines should be added to the routine infant schedule and what schedule should be implemented for reimmunization. Vaccines that provide long-term protection against meningococcal disease early in life have the potential to reduce the burden of meningococcal disease, especially if they provide protection against serogroup B meningococcal disease. Health-care providers should be aware of the continued need for early recognition and treatment of meningococcal disease.†
Reported by
Lorry Rubin, MD, Meningococcal Vaccines Work Group, Advisory Committee on Immunization Practices, Atlanta, GA. Amanda Cohn, MD, Jessica MacNeil, MPH, Nancy Messonnier, MD, Div of Bacterial Diseases, National Center for Immunization and Respiratory Diseases, CDC. Corresponding contributor: Amanda Cohn, [email protected], 404-639-6039.
References 1. CDC. Recommendations of the Advisory Committee on Immunization
Practices (ACIP). MMWR 2005;54(No. RR-7). 2. CDC. Licensure of a meningococcal conjugate vaccine for children aged 2
through 10 years and updated booster dose guidance for adolescents and other persons at increased risk for meningococcal disease—Advisory Committee on Immunization Practices (ACIP), 2011. MMWR 2011;60:1018–9.
3. Food and Drug Administration. Package insert for MenHibrix (meningococcal groups C and Y and Haemophilus b tetanus toxoid conjugate vaccine). Available at http://www.fda.gov/downloads/biologicsbloodvaccines/vaccines/approvedproducts/ucm308577.pdf.
4. Borrow R, Balmer P, Miller E. Meningococcal surrogates of protection- serum bactericidal antibody activity. Vaccine 2005;23:2222–7.
5. Bryant KA, Marshall GS, Marchant CD, et al. Immunogenicity and safety of H influenzae type b-N meningitidis C/Y conjugate vaccine in infants. Pediatrics 2011;127:e1375–85.
6. Marchant CD, Miller JM, Marshall GS, et al. Randomized trial to assess immunogenicity and safety of Haemophilus influenzae type b and Neisseria meningitidis serogroups C and Y–tetanus toxoid conjugate vaccine in infants. Pediatr Infect Dis J 2010;29:48–52.
7. Nolan T, Richmond P, Marshall H, et al. Immunogenicity and safety of an investigational combined Haemophilus influenzae type B-Neisseria meningitidis serogroups C and Y-tetanus toxoid conjugate vaccine. Pediatr Infect Dis J 2011;30:190–6.
8. CDC. CDC health information for international travel 2012. New York, NY: Oxford University Press; 2012. Available at http://wwwnc.cdc.gov/travel/yellowbook/2012/table-of-contents.htm.
9. Kaplan SL, Schutze GE, Leake JA, et al. Multicenter surveillance of invasive meningococcal infections in children. Pediatrics 2006;118:e979–84.
10. Cohn AC, MacNeil JR, Harrison LH, et al. Changes in Neisseria meningitidis disease epidemiology in the United States, 1998–2007: implications for prevention of meningococcal disease. Clin Infect Dis 2010;50:184–91.
† Information available at http://www.cdc.gov/meningitis.
Emergence of New Norovirus Strain GII.4 Sydney — United States, 2012
Noroviruses are the leading cause of epidemic gastroenteri-tis, including foodborne outbreaks, in the United States (1). Hospitalization and mortality associated with norovirus infection occur most frequently among elderly persons, young children, and immunocompromised patients. Noroviruses belong to the family Caliciviridae and can be grouped into five genogroups (GI through GV), which are further divided into at least 34 genotypes. Human disease primarily is caused by GI and GII noroviruses, with most outbreaks caused by GII.4 strains (1). During the past decade, new GII.4 strains have emerged every 2–3 years, replacing previously predominant GII.4 strains. Emergence of these new norovirus strains has often, but not always, led to increased outbreak activity. For example, the pre-viously dominant GII.4 New Orleans strain was not associated with increased norovirus outbreak activity in the United States (2). CDC collects information on norovirus strains associated with outbreaks in the United States through an electronic labo-ratory surveillance network called CaliciNet (3). This report documents the recent emergence of a new GII.4 strain, GII.4 Sydney, which caused most (53%) of the norovirus outbreaks reported through CaliciNet during September–December 2012. Continued surveillance will enable further assessment of the public health implications and significance of this new strain.
In March 2012, a new GII.4 norovirus strain was identified in Australia. Named GII.4 Sydney, this emergent strain has since caused acute gastroenteritis outbreaks in multiple countries (4). In the United Kingdom, an early onset of the 2012 winter norovirus season was reported in association with emergence of GII.4 Sydney as the dominant strain implicated in outbreaks.* In the United States, GII.4 Sydney has spread rapidly nationwide, causing an increasing number of outbreaks. During September–December 2012, a total of 141 (53%) of the 266 norovirus outbreaks reported to CaliciNet were caused by GII.4 Sydney. The other outbreaks were caused by 10 different GI and GII genotypes, including GII.4 New Orleans. A statistically significant increase in the proportion of outbreaks caused by GII.4 Sydney was noted: four (19%) of 21 outbreaks in September 2012; 22 (46%) of 48 in October 2012; 70 (58%) of 120 in November 2012; and 45 (58%) of 77 in December 2012† (chi-square test for trend; p<0.01). Most (72 [51%]) of these GII.4 Sydney outbreaks resulted from direct person-to-person transmission;
29 (20%) were foodborne, one (1%) was waterborne, and the transmission mode was unknown in 39 (28%) of the outbreaks. Long-term–care facilities and restaurants were the most frequently reported settings, accounting for 91 (65%) and 18 (13%) of the GII.4 Sydney outbreaks, respectively. During the three previous winters, the peak in reported norovirus outbreaks occurred in January; therefore, at present, it is too early to make an assessment of the relative magnitude of the current season.
GII.4 noroviruses remain the predominant cause of norovirus outbreaks, and the GII.4 Sydney strain appears to have replaced the previously predominant strain, GII.4 New Orleans. Compared with other norovirus genotypes, GII.4 noroviruses have been associated with increased rates of hospitalizations and deaths during outbreaks (5). Health-care providers and public health practitioners should remain vigilant to the potential for increased norovirus activity in the ongoing season related to the emergent GII.4 Sydney strain. Continued surveillance for norovirus outbreaks through CaliciNet and additional data on clinical and epidemiologic features of out-breaks collected through the National Outbreak Reporting System (NORS)§ will enable further assessment of the public health impli-cations of the new GII.4 Sydney strain, including any association with increased severity or level of activity in the ongoing 2012–13 winter norovirus season. Proper hand hygiene, environmental disinfection, and isolation of ill persons remain the mainstays of norovirus prevention and control (1).
Reported by
Leslie Barclay, Mary Wikswo, MPH, Nicole Gregoricus, MSPH, Jan Vinjé, PhD, Ben Lopman, PhD, Umesh Parashar, MBBS, Aron Hall, DVM, Div of Viral Diseases, National Center for Immunization and Respiratory Diseases; Eyal Leshem, MD, EIS officer, CDC. Corresponding contributor: Eyal Leshem, [email protected], 404-639-7251.
References 1. CDC. Updated norovirus outbreak management and disease prevention
guidelines. MMWR 2011;60(No. RR-3). 2. Yen C, Wikswo ME, Lopman BA, Vinje J, Parashar UD, Hall AJ. Impact
of an emergent norovirus variant in 2009 on norovirus outbreak activity in the United States. Clin Infect Dis 2011;53:568–71.
3. Vega E, Barclay L, Gregoricus N, Williams K, Lee D, Vinje J. Novel surveillance network for norovirus gastroenteritis outbreaks, United States. Emerg Infect Dis 2011;17:1389–95.
4. van Beek J, Ambert-Balay K, Botteldoorn N, et al. Indications for worldwide increased norovirus activity associated with emergence of a new variant of genotype II.4, late 2012. Euro Surveill 2013;18(1).
5. Desai R, Hembree CD, Handel A, et al. Severe outcomes are associated with genogroup 2 genotype 4 norovirus outbreaks: a systematic literature review. Clin Infect Dis 2012;55:189–93.
* Additional information available at http://www.hpa.org.uk/NewsCentre/NationalPressReleases/2013PressReleases/130109Norovirusnewstrain.
† Data for 2012 are incomplete.
§ Additional information available at http://www.cdc.gov/nors.
Emergency Department Visits and Hospitalizations for Buprenorphine Ingestion by Children — United States, 2010–2011
Buprenorphine (Subutex) and buprenorphine/naloxone (Suboxone) received Food and Drug Administration approval in 2002 for the treatment of opioid dependence. Introduction of these drugs expanded the availability of opioid-dependence treatment options to reduce the morbidity and mortality asso-ciated with opioid abuse, and buprenorphine has become an increasingly prescribed component of office-based treatment. However, unsupervised ingestion of buprenorphine-containing products by children is a growing concern (1).
During 2010–2011, the National Electronic Injury Surveillance System — Cooperative Adverse Drug Event Surveillance project (2) identified 68 cases involving buprenorphine product inges-tions (out of 226 cases of opioid product ingestions) by children aged <6 years.* Based on these cases, CDC estimates that, dur-ing 2010–2011, an average of 1,499 (95% confidence interval [CI] = 905–2,092) children aged <6 years were evaluated each year in U.S. emergency departments (EDs) for buprenorphine-product ingestions; in contrast, zero cases were reported in 2004. Nearly all (95.8%) of the ED visits involved buprenorphine/naloxone. As is typical of unsupervised pediatric exposures to other medications, most ED visits involved boys (59.5%) and children aged 1 and 2 years (76.8%). Because of buprenorphine’s long half-life and risk for respiratory depression, 58.4% of ingestion-related ED visits required hospitalization.†
Buprenorphine products were involved in disproportionate numbers of unsupervised ingestions by children aged <6 years, compared with other prescription drugs. Buprenorphine prod-ucts were involved in 29.8% (CI = 20.1%–39.5%) of ED visits and 59.5% (CI = 38.9%–80.2%) of emergent hospitalizations for opioid product ingestions.§ Ingestion of buprenorphine/
naloxone caused 9.5% of emergent hospitalizations for drug ingestion by children aged <6 years, a greater proportion than any other single medication, even though in 2009 buprenor-phine products amounted to only 2.2% of all retail opioid prescriptions and 0.16% of all retail prescriptions (3).
Ingestions of buprenorphine-containing products by chil-dren are serious and have increased rapidly nationally. Fatalities have been reported in children after unsupervised ingestions of single doses (4). Innovative injury prevention approaches beyond current child-resistant bottles and safety warnings might be required to safeguard children while preserving availability of medications such as this important addiction treatment option for adults. Providers should remind patients to keep buprenorphine-containing products in child-resistant packaging, stored up, away, and out of the sight of children. Patients should post the Poison Help telephone number (1-800-222-1222) in their homes, and telephone 911 in the event of emergencies.
Reported by
Maribeth Lovegrove, MPH, Lee M. Hampton, MD, Daniel S. Budnitz, MD, Div of Healthcare Quality Promotion, National Center for Emerging Zoonotic and Infectious Diseases; Andrew I. Geller, MD, EIS Officer, CDC. Corresponding contributor: Andrew I. Geller, [email protected], 404-639-4050.
References 1. CDC. Buprenorphine prescribing practices and exposures reported to a
Pollock DA. Evaluation and overview of the National Electronic Injury Surveillance System-Cooperative Adverse Drug Event Surveillance project (NEISS-CADES). Med Care 2007;45(10 Suppl 2):S96–102.
3. Food and Drug Administration. Total number of prescriptions dispensed for long-acting/extended-release and immediate-release opioids from U.S. outpatient retail pharmacies, years 2000–2009. In: briefing information for the July 22–23, 2010, Joint Meeting of the Anesthetic and Life Support Drugs Advisory Committee and Drug Safety and Risk Management Advisory Committee. Silver Spring, MD: US Department of Health and Human Services, Food and Drug Administration; 2010.
4. Kim HK, Smiddy M, Hoffman RS, Nelson LS. Buprenorphine may not be as safe as you think: a pediatric fatality from unintentional exposure. Pediatrics 2012;130:e1700–3.
* A case was defined as an emergency department (ED) visit at one of the participating NEISS-CADES hospitals during 2010–2011 for assessment and treatment for a buprenorphine product ingestion by a child aged <6 years, where the child accessed the medication on his/her own, without adult permission or oversight (unsupervised ingestion).
† Hospitalizations included ED visits that resulted in admission to a hospital or transfer to another hospital.
Vol. 61, No. 48 In the MMWR report, “Chlorine Gas Release Associated
with Employee Language Barrier — Arkansas, 2011,” it was incorrectly stated that a Spanish-speaking employee with lim-ited English skills inadvertently poured sodium hypochlorite into a 55-gallon drum containing residual acidic antimicrobial solution, causing a chlorine gas release. The drum was labeled only in English. CDC subsequently has learned that, although the Spanish-speaking employee retrieved the 55-gallon drum for mixing because he thought it contained sodium hypochlo-rite, the actual dispensing of the sodium hypochlorite into the drum was performed by an English-speaking supervisor. The supervisor told investigators he did not read the label on the drum, which he noted appeared similar to other drums containing sodium hypochlorite.
* Deaths include those coded as B20–B24 in the International Classification of Diseases, 10th Revision.
From 2000 to 2010, HIV disease death rates decreased approximately 70% for both black and white men aged 25–44 years. Rates decreased by 53% for black men aged 45–54 years and 34% for white men aged 45–54 years. Throughout the period, HIV disease death rates for black men were at least six times the rates for white men.
Sources: CDC. National Vital Statistics System. Available at http://www.cdc.gov/nchs/data_access/vitalstatsonline.htm.
U.S. Government Printing Office: 2013-623-030/02047 Region IV ISSN: 0149-2195
The Morbidity and Mortality Weekly Report (MMWR) Series is prepared by the Centers for Disease Control and Prevention (CDC) and is available free of charge in electronic format. To receive an electronic copy each week, visit MMWR’s free subscription page at http://www.cdc.gov/mmwr/mmwrsubscribe.html. Paper copy subscriptions are available through the Superintendent of Documents, U.S. Government Printing Office, Washington, DC 20402; telephone 202-512-1800.
Data presented by the Notifiable Disease Data Team and 122 Cities Mortality Data Team in the weekly MMWR are provisional, based on weekly reports to CDC by state health departments. Address all inquiries about the MMWR Series, including material to be considered for publication, to Editor, MMWR Series, Mailstop E-90, CDC, 1600 Clifton Rd., N.E., Atlanta, GA 30333 or to [email protected].
All material in the MMWR Series is in the public domain and may be used and reprinted without permission; citation as to source, however, is appreciated.
Use of trade names and commercial sources is for identification only and does not imply endorsement by the U.S. Department of Health and Human Services.
References to non-CDC sites on the Internet are provided as a service to MMWR readers and do not constitute or imply endorsement of these organizations or their programs by CDC or the U.S. Department of Health and Human Services. CDC is not responsible for the content of these sites. URL addresses listed in MMWR were current as of the date of publication.