Stage 1 Report: Survey and Analysis of the Frameworks that Govern Transportation Investment in Other Countries Prepared By: PricewaterhouseCoopers LLP June 2010 Survey and Analysis of Transportation Investment Models in Other Countries
Transcript
Stage 1 Report: Survey and Analysis of the Frameworks that GovernTransportation Investment in Other Countries
Prepared By: PricewaterhouseCoopers LLP
June 2010
Survey and Analysis of Transportation InvestmentModels in Other Countries
Limitations
Slide 2
This publication was prepared by PricewaterhouseCoopers LLP (PwC) with the support of the United StatesDepartment of Transportation, Office of the Secretary of Transportation, under contract no. DTOS59-09-C-00444.
This publication is limited to the approach and analysis described herein and on information publiclyavailable as of June 15, 2010. No representation or warranty (express or implied) is given as to theaccuracy or completeness of the information contained in this publication, and the extent permitted by law,PwC and PwCIL and its members, employees and agents do not accept any liability, responsibility, or dutyof care for any consequences of you or anyone else acting, or refraining to act, in reliance on theinformation contained in this publication or for any decision based on it.
PwC refers to PricewaterhouseCoopers LLP, the US member firm of PricewaterhouseCoopers InternationalLimited (PwCIL). Each member firm is a separate legal entity and does not act as agent of PwCIL or anymember firm.
Table of Contents
I. Key Objectives and Overview of Research Approach
II. Overview of Transportation Investment Frameworks & AppraisalModels
III. Transportation Investment Frameworks in the UK, Australia and Japan
IV. Livability and Sustainability Impacts in Canada & Sweden
V. Summary of Key Lessons Learned And Considerations for the U.S.
VI. Appendices
Slide 3
I. Key Objectives and Overview of Research Approach
Slide 4
Section I. Key Objectives and Overview of Research Approach
Survey and Analysis of Transportation Investment Models inOther Countries – Key Objectives:
Slide 5
Section I. Key Objectives and Overview of Research Approach
• Conduct an analysis of transportation investment models in other countries addressing:− Stage 1: Survey and Analysis of the Frameworks that Govern Transportation Investment
in Other Countries
− Stage 2: Survey and Analysis of the Use of Public Sector Comparator (PSC) and Valuefor Money (VfM) Analyses in Developed Countries with Mature PPP Programs
− Stage 3: Survey and Analysis of Investment through Government-Sponsored LendingInstitutions
• Develop a resource for U.S. transportation officials to better understand internationalapproaches and how to incorporate best practices and innovations in U.S. transportationinvestment programs
The objective of Stage 1 is to:
• Provide an understanding of how other governments approach transportation investmentdecisions; and
• Provide insight into potential investment frameworks and appraisal models from nationalgovernments, or potentially leading sub-national governments, which could be adapted in theU.S.
• Complete a survey for the UK, Australia and Japan that includes:− The objectives of the transportation investment framework− The roles of the public and private sector in transportation investment− A process to identify needs, develop and assess options, and make investment decisions− A process for taxpayers to receive a valuable return on transportation investment− An assessment of how transportation systems contribute to economic growth− Methods for upfront financing for transportation investment− A process to assess if the transportation investment framework is achieving valuable
results
• Provide insight on Canadian and Swedish livability and sustainability policies and their impacton transportation investment decisions
• Highlight potential opportunities for the U.S. to incorporate best practices and innovations intoU.S. transportation investment programs
Objective of Stage 1: Survey and Analysis of the Frameworksthat Govern Transportation Investment in Other Countries
Slide 6
Section I. Key Objectives and Overview of Research Approach
The following table highlights the key research questions requested by U.S. DOT and identifieswhere the questions are addressed in this Report:
Slide 7
Section I. Key Objectives and Overview of Research Approach
Research Questions Summary of International Approach ReferenceWhat are the objectives of the jurisdiction’stransportation infrastructure investment model?
The jurisdictions have specific social, environmental, and economicgoals for their transportation infrastructure investment models.
Slides 28-31, 37-38, 43, 53
What are the relative roles of the public andprivate sector in transportation infrastructureinvestment?
The public sector is responsible for making investment decisionstypically using input from the private sector. The private sector acts asinvestors and external advisors, and is increasingly responsible for newand on-going infrastructure through public-private partnerships.
Slides 21, 36, 52
What are the best ways to provide upfrontfinancing for transportation infrastructureinvestment, including the use of governmentsponsored credit assistance?
The UK and Australia use a combination of government grants andrevenues with private sector financing, and no dedicated allocation fortransportation exists.
Slides 23, 39, 56
What is the best way to ensure that taxpayersare getting a valuable return for dollarsinvested in the transportation system?
Value for money analysis assists decision makers in identifying optionswith the potential for the greatest quality and effectiveness fromtaxpayer investments. Investment frameworks provide a consistent andtransparent decision process.
Slides 10-12, 15-16
What are the best ways to ensure thattransportation systems are contributing toeconomic growth?
Throughout the investment decision process, jurisdictions can useappraisal models to evaluate and compare the benefits and costs ofoptions.
Slides 15-16, 29,44-45
How does the jurisdiction ensure that itstransportation infrastructure investment modelis achieving valuable results?
Jurisdictions can use investment frameworks that assess benefitsrealization and conduct project evaluations to evaluate if theirinvestments are achieving valuable results. Performance baseddecision making can help jurisdictions determine which projects toinvest in based on return from previous investments.
Slides 24-26, 30,40, 57-58
Objective of Stage 1: Survey and Analysis of the Frameworksthat Govern Transportation Investment in Other Countries
Objective of Stage 1: Survey and Analysis of the Frameworksthat Govern Transportation Investment in Other Countries
Slide 8
• Underwent substantive reforms of its transportation frameworks following the landmark EddingtonTransport Study in 2006
• History of using quantitative appraisal models (e.g., cost-benefit analysis, multi-criteria analysis) to testthe value for money or social returns from projects before making investment decisions
UK
• Similar governance structure, car ownership/mass transit patronage levels, bulk freight and landmass/urbanization characteristics to the U.S.
• Extensive guidance material on evaluation methods (e.g., cost-benefit analysis, financial analysis andcost-effectiveness analysis)
• Creation of a federal body (Infrastructure Australia) to set national priorities
Australia
• Evolving transportation framework, including: adjusting the infrastructure investment approach accordingto unique modal needs, and investing in new research and development options for the next generation oftransportation
• History of using cost-effectiveness models to analyze transportation projects
Japan
Primary Jurisdictions:
• Variety of programs that emphasize sustainable transportation (e.g., Building Canada, ecoTRANSPORT,Moving on Sustainable Transport)
• History of incorporating sustainability and livability into transportation policy planningCanada
• Global leader for sustainable transportation policies and initiatives (Stockholm ranked second in theEuropean Green City Index for 2009)
• Recent transportation projects, including the congestion charge and on-going railway expansions (e.g.,Citybanan project)
Sweden
Specialized Jurisdictions:
Section I. Key Objectives and Overview of Research Approach
II. Overview of Transportation InvestmentFrameworks & Appraisal Models
Slide 9
Section II. Overview of Transportation Investment Frameworks & Appraisal Models
An Investment Framework:
• Is a process to identify needs, develop and assess options to address needs, and makeinvestment decisions for transportation infrastructure
• Establishes an overarching, long-term policy approach to transportation investment decision-making that achieves agreed upon economic objectives (e.g., at national government ordepartment level)
Rationale for Investment Frameworks:• Investment frameworks are used in other jurisdictions to help governments identify priority
needs and determine how to allocate funds among departments or programs• Adopting a consistent and transparent investment decision process may help to:
− Promote overall value for money and optimize use of limited budget resources (e.g.,valuable return on taxpayers’ investment)
− Make objective and accurate decisions that deliver cross-sector goals− Create public and political consensus on long-term policy approach
Overview of Transportation Investment Frameworks
Slide 10
Section II. Overview of Transportation Investment Frameworks & Appraisal Models
Source: Based on Survey of PwC Country Office staff
• Dependencies and relationships existbetween the frameworks usedGovernment-wide and at the Department-level and Project-level
• Government-wide frameworks can informthe policy that the Department-level andProject-level frameworks follow
• Project-level frameworks can inform theinvestment decisions by identifying thepotential projects that make up thedepartment’s request for Government-wide funds
Investment Frameworks Support Investment Decisions
Slide 11
Section II. Overview of Transportation Investment Frameworks & Appraisal Models
Investment frameworks can be used at multiple levels of the government to driveinvestment decisions
Government–wide FrameworkSets overarching policy across
government (e.g., road vs. hospital)
Department-level FrameworkGuides department investment decision
making (e.g., across all modes)
Project-level FrameworkGuides decision for individual need (e.g.,
congestion)
Appraisal Models
Inve
stm
entP
olic
y
InvestmentD
ecision
Source: Based on Survey of PwC Country Office staff
Value for Money (VfM):
• VfM seeks to secure the best mix of qualityand effectiveness for the least outlay, overthe whole lifetime of the goods or services,from purchase through to disposal
• VfM is a key concept that underlies theinvestment decision making process:
– At the government-wide level, VfM refers tofunds being allocated betweendepartments to deliver the greatest valuefrom the government investments
– At the department-level, VfM refers toinvesting in the programs that provide thegreatest value across all modes
– At the project-level, VfM refers to theproject providing the greatest quality andeffectiveness from the investment, takinginto consideration the quantitative andqualitative impacts of the project
Investment Frameworks Support Investment Decisions
Slide 12
Section II. Overview of Transportation Investment Frameworks & Appraisal Models
Government–wide FrameworkSets overarching policy across
government (e.g., road vs. hospital)
Department-level FrameworkGuides department investment decision
making (e.g., across all modes)
Project-level FrameworkGuides decision for individual need (e.g.,
congestion)
Appraisal Models
Inve
stm
entP
olic
y
Investm
entD
ecision
• VfM analysis can also assist in determining the preferred procurement method for a projectand this is discussed in Stage 2 of this analysis
Source: Based on Survey of PwC Country Office staff
Government-wide & Department-level Frameworks
Slide 13
Section II. Overview of Transportation Investment Frameworks & Appraisal Models
Government-wide and Department-level frameworks can inform investment policy andappraisal models for individual projects
Government–wide
Department-level
Project-level
Appraisal Models
Framework Type Examples
Government–wide Framework:Sets overarching policy across thegovernment to promote consistentdecision making across individualdepartments
Department-level Framework:Guides department investment decisionmaking by following government-widepolicies that are adopted for a specificdepartment’s needs
• UK Department for Transport’s NewApproach to Appraisal
• U.S. DOT’s TIGER & TIGER IIDiscretionary Grant Programs
Source: Based on Survey of PwC Country Office staff
Below is an overview of how the investment framework relates to the project lifecycle, whichillustrates how appraisal models support the investment decision process at the project level:
Project-level Frameworks
Slide 14
Section II. Overview of Transportation Investment Frameworks & Appraisal Models
Government–wide
Department-level
Project-level
Appraisal Models
Source: Based on Survey of PwC Country Office staff
Funding and Procurement Decisions• Procuring authorities conduct Value for Money (VFM) analysis
• Government-Sponsored Lending Institutions make investment decisions
Identify Need &Urgency
Develop Optionsto Address Need
EvaluateOptions
PrioritizeOptions
InvestmentDecision
Stage 2 andStage 3
Appraisal Models
• Appraisal Models are tools used in the investment decision process to assess and comparethe merit of different options
• They support decision makers by evaluating and comparing actions at various points in theinvestment decision process (e.g., evaluate options, prioritize options)
• One or multiple appraisal models can be used throughout the investment decision process, toidentify and estimate the relative costs and benefits of an option. In general, appraisal modelsmay consider the qualitative and quantitative factors that inform the value for money offered bya project
Project-level Frameworks
Slide 15
Section II. Overview of Transportation Investment Frameworks & Appraisal Models
Benefit Cost
Example benefits and costs evaluated in an appraisal model
Government–wide
Department-level
Project-level
Appraisal Models
Source: Based on Survey of PwC Country Office staff
Key Appraisal Models Used in the Transport Sector:• Reliable data outputs from Travel Demand Models, Capital / Operating Cost Estimation tools,
and wider-effect models are important for successful appraisal models. The wider-effectmodels are designed to account for the "spill-over" economic benefits and costs that accrue toa geographic area which is not the recipient of the transportation investment.
• Key examples of appraisal models used by transportation and other sectors include:
Project-level Frameworks
Slide 16
Section II. Overview of Transportation Investment Frameworks & Appraisal Models
Cost-Benefit AnalysisAn economic approach that
quantifies the benefits derived andcosts incurred by those parties
affected by an activity to determinethe aggregate net impact to society
and the economy
Multi-Criteria AnalysisEstablishes preferences betweenoptions by reference to an explicitset of objectives and measurable
criteria to assess the extent to whichthe objectives have been achieved
Economic Impact AnalysisFocuses on measurable changes in
the flow of money going tohouseholds and businesses.Two key tools: Input-output
modeling and Computable generalequilibrium (CGE)
FinancialEvaluation/Analysis
Determines the net cash inflows(benefits) vs. net cash outflows
(costs) to an agency, rather than thenet benefit to the economy or
society
Cost-Effectiveness AnalysisMeasures the benefits in physical
units rather than in monetary termsOffers a priority ranking of programs
or activities on the basis of acomparative ‘cost per unit of
effectiveness’
Government–wide
Department-level
Project-level
Appraisal Models
Key Observations:
Project justification beyond financial evaluation supports the need for a broader cost/benefit analysis
The use of accurate data outputs from reliable travel demand forecasting and capital / operating expenseestimation tools is important to provide valuable results from economic appraisal models
Source: Based on Survey of PwC Country Office staff
III. Transportation Investment Frameworks in the UK,Australia and Japan
Slide 17
Section III. Transportation Investment Frameworks in the UK, Australia and Japan
United Kingdom (UK)
Slide 18
Section III. Transportation Investment Frameworks in the UK, Australia and Japan
Attributes of the UK’s Transportation Investment Frameworks
Slide 19
Section III. Transportation Investment Frameworks in the UK, Australia and Japan
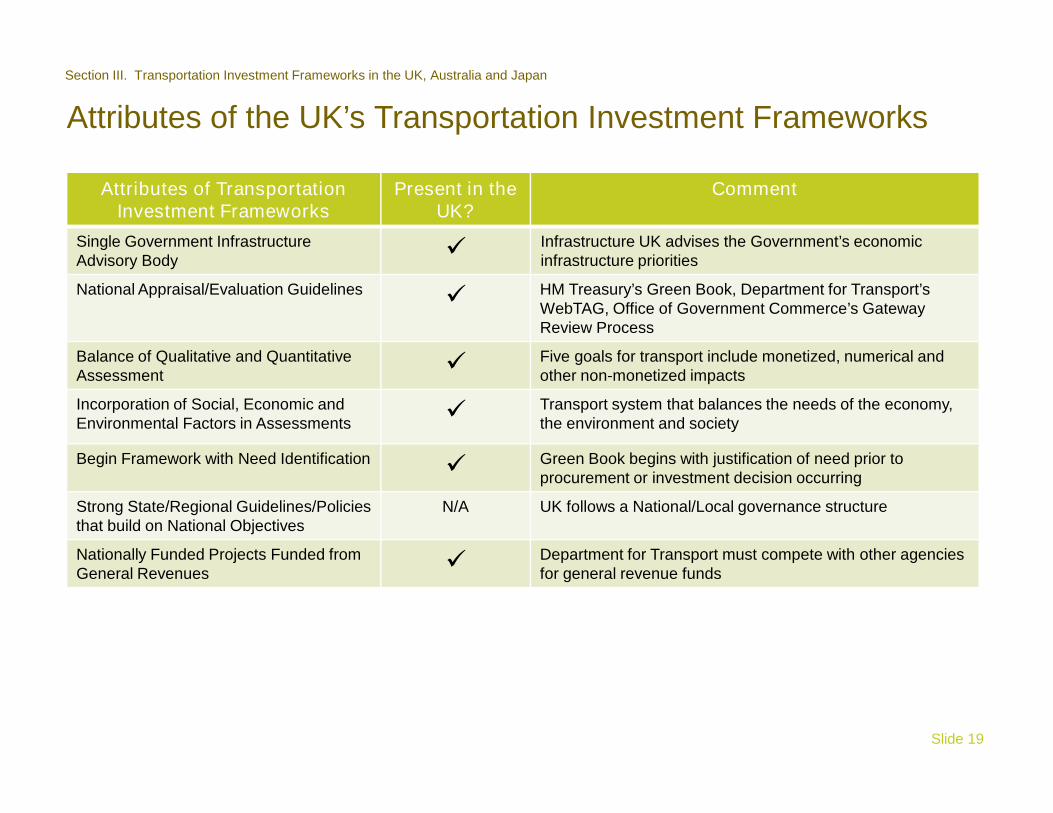
Attributes of TransportationInvestment Frameworks
Present in theUK?
Comment
Single Government InfrastructureAdvisory Body Infrastructure UK advises the Government’s economic
infrastructure priorities
National Appraisal/Evaluation Guidelines HM Treasury’s Green Book, Department for Transport’sWebTAG, Office of Government Commerce’s GatewayReview Process
Balance of Qualitative and QuantitativeAssessment Five goals for transport include monetized, numerical and
other non-monetized impacts
Incorporation of Social, Economic andEnvironmental Factors in Assessments Transport system that balances the needs of the economy,
the environment and society
Begin Framework with Need Identification Green Book begins with justification of need prior toprocurement or investment decision occurring
Strong State/Regional Guidelines/Policiesthat build on National Objectives
N/A UK follows a National/Local governance structure
Nationally Funded Projects Funded fromGeneral Revenues Department for Transport must compete with other agencies
for general revenue funds
UK’s Government-wide Frameworks
Slide 20
Section III. Transportation Investment Frameworks in the UK, Australia and Japan
Government–wide FrameworkSets overarching policy across
government (e.g., road vs. hospital)
Department-level FrameworkGuides department investment decision
making (e.g., across all modes)
Project-level FrameworkGuides decision for individual need (e.g.,
congestion)
Appraisal Models
Inve
stm
entP
olic
yIn
vestmen
tDecisio
n
• National Level:− Departments (e.g., Department for Transport - DfT): Sets
and achieves objectives by working with regional, local andprivate sector partners
− Infrastructure UK: Helps Treasury prioritize long-term,cross-sector infrastructure support and guidance
− HM Treasury: Makes spending decisions and providesguidance on the appraisal and evaluation process
− Office of Government Commerce (OGC): Providesguidance on the procurement process, and project/riskmanagement reviews
• Regional Assemblies: Produces Regional Transport Plan andestablishes regional priorities for the environment, transport andinfrastructure
• Local Government: Manages day-to-day aspects of localtransport networks, and prepares a Local Transport Plan
• Private Sector: Acts as contractors, investors and externaladvisors (e.g., technical, financial, and legal). Responsible formajority of building for new and on-going infrastructure andservice delivery
• Project delivery, preparation and ownership is generally handledby the project sponsor (e.g., Rail Authority)
UK Government: Investment FrameworkKey Stakeholders
Slide 21
Section III. Transportation Investment Frameworks in the UK, Australia and Japan
In December 2009, Partnerships UK andHM Treasury’s PPP unit wasconsolidated to create Infrastructure UK.As of March 2010, its key responsibilitiesincluded:
• Working with key government andprivate sector stakeholders to:
– Identify required changes in policiesand regulation to encourageinfrastructure investment in the UK
– Identify the interdependencies thatimpact infrastructure investmentneeds, and publish an action plan inresponse
• Developing a National InfrastructureFramework with a long-term, cross-sector view of infrastructure needs
• Teaming with departments to developan Infrastructure Technology Strategythat coordinates future investment inresearch, development and innovationfor infrastructure
Government–wide
Department-level
Project-level
Appraisal Models
Source: HM Treasury website, DfT website, and Based on Survey of PwC Country Office staff
UK Government: Future Direction of FrameworksNational Infrastructure Framework
Slide 22
Section III. Transportation Investment Frameworks in the UK, Australia and Japan
A National Infrastructure Framework is expected to be published by Infrastructure UK by the end of 2010. Theframework will help Ministries make effective decisions on prioritization and timing in the context of a long-term,cross-sector view of infrastructure needs.
• UK’s response to the investmentchallenge may focus on:
– Attracting diverse investment (e.g.,geography and investor type); and
– Enabling investment for large,complex projects by clarifying policiesto mitigate long-term risks forinvestors, and using co-investment(e.g., investing alongside other publicor private parties) as a form of directgovernment financing intervention
National Infrastructure Framework Vision:
Government–wide
Department-level
Project-level
Appraisal Models
Source: Infrastructure UK, Strategy for National Infrastructure, April 2010
UK Government: Upfront Financing for InfrastructureEconomic Infrastructure
Slide 23
Section III. Transportation Investment Frameworks in the UK, Australia and Japan
Source: Infrastructure UK, Strategy for National Infrastructure, April 2010
Example: Economic Infrastructure Funding and Financing ModelsFinancing refers to the upfrontcapital required to buildinfrastructure through:• Private sector investment,
(e.g., through InfrastructureUK )
• Public borrowing (e.g., directborrowing from government, orEuropean Investment Bank)
Funding refers to the payment ofinfrastructure over time through:• User funding (e.g., tolls, or
fare box revenue)• Taxpayer funding (e.g.,
Government grants directly toDfT from General RevenueFunds)
The UK has a variety of upfront financing methods available for transport infrastructure investment.
Government–wide
Department-level
Project-level
Appraisal Models
Source: Infrastructure UK, Strategy for National Infrastructure, April 2010; Based on Survey of PwC Country Office staff
UK Government: Appraisal and Evaluation GuidanceHM Treasury’s Green Book
Slide 24
Section III. Transportation Investment Frameworks in the UK, Australia and Japan
The HM Treasury’s Green Book - Appraisal and Evaluation in Central Government, published in 2003,establishes a base set of guidelines for how transportation projects are appraised in the UK. The Green Book:
• Provides a consistent and transparent process for appraisal and evaluation of policies and capital projects forall of the Central Government (i.e., department and ministers responsible for national affairs)
• Covers activities such as: policy & program development, new or replacement capital projects, use ordisposal of existing assets, specification of regulations, and major procurement decisions
Key Observations:
All departments compete for national funding, therefore a cross-governmentprocess that justifies action prior to funding commitment is required to supportthe allocation of limited funds and resources across departments
Appraisal processes performed by the departments justify the overall value formoney of their potential projects, and help decision-makers prioritize fundsacross sectors
Treasury guidelines facilitate a department's ability to adopt rigorousframeworks that are consistent with national guidelines
Government–wide
Department-level
Project-level
Appraisal Models
Source: HM Treasury – Green Book; Based on Survey of PwC Country Office staff
UK Government: Appraisal and Evaluation ProcessHM Treasury’s Green Book
Slide 25
Section III. Transportation Investment Frameworks in the UK, Australia and Japan
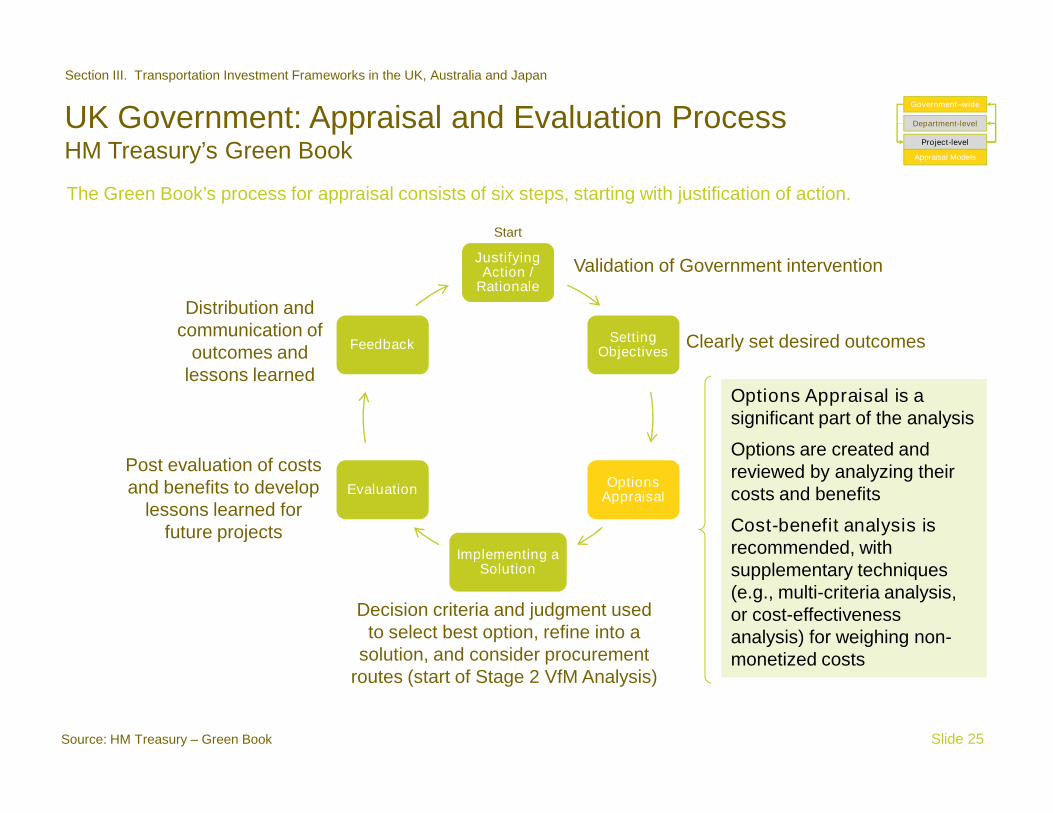
The Green Book’s process for appraisal consists of six steps, starting with justification of action.
JustifyingAction /
Rationale
SettingObjectives
OptionsAppraisal
Implementing aSolution
Evaluation
Feedback
Options Appraisal is asignificant part of the analysis
Options are created andreviewed by analyzing theircosts and benefits
Decision criteria and judgment usedto select best option, refine into a
solution, and consider procurementroutes (start of Stage 2 VfM Analysis)
Post evaluation of costsand benefits to develop
lessons learned forfuture projects
Distribution andcommunication of
outcomes andlessons learned
Start
Government–wide
Department-level
Project-level
Appraisal Models
Source: HM Treasury – Green Book
Projects must also follow the Office of GovernmentCommerce (OGC) Gateway Review process that:• Examines the policies/projects after each critical stage in their
lifecycle to assure they can progress successfully• Includes one program review (Gateway Review 0) and five
steps in the project-level review• Helps track if investment goals were met, as well as other
unexpected outcomes or “flow-in effects” (e.g., loss of localretail business or increase in bicycle accidents due to re-routingof trucks to expressway) that can be added to improve futurecost-benefit analysis
• Is supported by detailed guidance materials, including specificquestions and documentation required for each review step
• Complies with the Green Book in Gateway Reviews 1 & 2 sothat the appraisal and development of options is adequatelyperformed
UK Government: Appraisal and Evaluation ProcessGateway Review Process
Slide 26
Section III. Transportation Investment Frameworks in the UK, Australia and Japan
OGCGatewayReview 0:Strategic
Assessment
OGCGatewayReview 1:Business
Justification
OGCGatewayReview 2:DeliveryStrategy
OGCGatewayReview 3:InvestmentDecision
OGCGatewayReview 4:Readinessfor service
OGCGatewayReview 5:
Operationalreview and
benefitsrealization
OGC’s Gateway Review Process:
Government–wide
Department-level
Project-level
Appraisal Models
Key Observations:
The Gateway Review Process assists in delivering projects that meet the intended objectives, which may help toimprove the return to taxpayers
It also promotes continuous improvement and learning by identifying ways to refine procurement policies andguidance
A challenge when implementing reviews can be to identify tangible project improvements
Source: OGC – Gateway Review website; Based on Survey of PwC Country Office staff
UK’s Department-level Frameworks
Slide 27
Section III. Transportation Investment Frameworks in the UK, Australia and Japan
Government–wide FrameworkSets overarching policy across
government (e.g., road vs. hospital)
Department-level FrameworkGuides department investment decision
making (e.g., across all modes)
Project-level FrameworkGuides decision for individual need (e.g.,
congestion)
Appraisal Models
Inve
stm
entP
olic
yIn
vestmen
tDecisio
n
• Objective: Transport systems that balance the needs of the economy, theenvironment and society
• The Government’s Five Goals for Transport are used as key objectivesor criteria for evaluating projects during the appraisal process:1) To reduce transport’s emissions of carbon dioxide and other
greenhouse gases, with the desired outcome of tackling climatechange.
2) To support national economic competitiveness and growth, by deliveringreliable and efficient transport networks.
3) To promote greater equality of opportunity for all citizens, with thedesired outcome of achieving a fairer society.
4) To improve quality of life for transport users and non-transport users,and to promote a healthy natural environment.
5) To contribute to better safety, security and health and longer life-expectancy through reducing the risk of death, injury or illness arisingfrom transport, and promoting travel modes that are beneficial to health.
• For each goal, key performance indicators with set targets are used tomeasure progress and success
• In 2007, the UK developed 30 cross-government Public ServiceAgreements (PSAs) that set out the Government’s priority outcomes overthe period 2008-2011. The DfT leads the PSA for “Deliver reliable andefficient transport networks that support economic growth,” which alignswell with its five goals
DfT: Investment FrameworkObjectives of Transport Investment
Slide 28
Section III. Transportation Investment Frameworks in the UK, Australia and Japan
Key Observations:
The UK’s future transportstrategy depends on the newgovernment that was formed inMay 2010.
As of June 2010, each of theFive Goals for Transport are:
• Consistently applied during theappraisal process to supportdecisions
• Aligned with overallgovernment goals
• Relate to cross-agency PublicService Agreements (PSAs)
• An example of how a nationalstrategy can be applied to thesector level and refined forsector specific interests andissues
Government–wide
Department-level
Project-level
Appraisal Models
Source: DfT website; Based on Survey of PwC Country Office staff
DfT: Investment FrameworkThe Eddington Study on Transport & Economic Growth
Slide 29
Section III. Transportation Investment Frameworks in the UK, Australia and Japan
In 2005, Sir Rod Eddington (CEO of British Airways from 2000-2005) was jointly commissioned by the transportand economic ministries to examine the long-term links between transport and economic growth. The keyfindings:• Identified seven microeconomic drivers, as ways transport impacts the economy (outlined in figure below)• Warns that “transport cannot of itself create growth…Economic growth causes rising transport demands,
which if left unchecked, can put the transport network under strain, damaging productivity andcompetitiveness”
DfT used the findings and recommendations to develop a new, merit-based approach to decisionmaking that facilitates government’s ability to identify and select projects among available options onthe basis of hard-edged and comprehensive economic appraisal. Key attributes include:• Clear focus on non-transportation objectives for the transportation system (e.g., supporting economic growth,
and reducing emissions) with rigorous strategy and policy development to address objectives• Emphasis on assessing a range of transportation options to meet an objective without bias towards mode or
type of intervention (e.g., large capital project, pricing, or small strategic project)
Section III. Transportation Investment Frameworks in the UK, Australia and Japan
The DfT’s New Approach to Appraisal (NATA) is a body of advice,software and data products to support business case development forGovernment funding or approval.
• NATA follows a similar appraisal approach to the Green Book thatstarts with consideration of problems and ends with identification ofa preferred solution. Guidance from the Treasury Green Book isapplied during the economic appraisal of transport schemes underNATA
• Detailed guidance materials, tools and templates are available onthe DfT’s Transport Appraisal Guidance website (known asWebTAG), including:
– Data sources (e.g., Trip-end Modeling Program which forecaststravel demand at geographical level)
– Software for assessing whether road schemes provide VfM– A National Transport Model, an analytical and policy testing tool
that provides a systematic means of comparing the nationalconsequences of applied transport policies
– Research work that aims to improve transport modeling andeconomic appraisal
• Guidance materials are currently being refreshed, with consultationand drafts posted for comment
See Appendix B for additional detail on NATA & WebTAG
Key Observation:
NATA illustrates how a nationalstrategy can be incorporated at thesector level, and refined for sectorspecific interests and issues
Green Book
NATA
GatewayReview
Linking Together: The Green Bookdrives NATA’s appraisal approach.Priority projects identified by NATA
undergo a Gateway Review
Government–wide
Department-level
Project-level
Appraisal Models
Source: HM Treasury website; DfT website; Based on Survey of PwC Country Office staff
The Green Book suggests using a multi-criteria analysis to incorporate non-monetized impacts into the overallvalue for money decision. The NATA process can be considered a variation of a multi-criteria analysis, whichuses an Appraisal Summary Table (AST) to establish a structured approach to include impacts without knownmarket values.
NATA’s Appraisal Summary Table (AST):• Indicates the degree to which the five Government goals for transport would be achieved• Includes qualitative (e.g., livability) and quantitative (in either monetized or numerical terms) impacts• Must be limited to a single page and include all sub-objectives even if impact is very small or neutral• Is analyzed by decision makers as they use their judgment to reach an assessment on the overall value for
money of the proposed option (e.g., compare ‘overall net value’ derived from judgment to the overall value)
Example Sub-objectives from the AST for each Transport Goal:
DfT: Key Appraisal ModelsAppraisal Summary
Slide 31
Section III. Transportation Investment Frameworks in the UK, Australia and Japan
Tackle ClimateChange
• Reducegreenhousegases
Support EconomicGrowth
Promote Equalityof Opportunity
Improve Quality ofLife
Better Safety,Security & Health
• Improvereliability
• Improveconnectivity
• Wider(economic)impacts
• Improveaccessibility
• Improveaffordability
• Enhanceregeneration
• Reduceexposure tonoise
• Minimize impacton biodiversity
• Improve accessto leisure
• Reduce risk ofdeath or injury
• Improve healththrough physicalactivity
• Reduce crime
See Appendix B for additional detail on AST
Government–wide
Department-level
Project-level
Appraisal Models
Source: DfT website; Based on Survey of PwC Country Office staff
UK: Summary Observations
Slide 32
Section III. Transportation Investment Frameworks in the UK, Australia and Japan
• Justifying action, prior to funding commitment, supports the prioritization and allocation of limited funds andresources to programs and projects that demonstrate the potential to deliver the highest value
• Detailed guidance, aligned with strategic National and Department goals, supports transparency andconsistency of investment decisions
• DfT’s extensive WebTAG materials and transparent consultation process can act as a valuable resource
• On-going development of a National Infrastructure Framework under the current economic environmentmay also act as a key resource for other countries, including the U.S.
Source: Based on Survey of PwC Country Office staff
Australia
Slide 33
Section III. Transportation Investment Frameworks in the UK, Australia and Japan
Attributes of Australia’s Transportation Investment Framework
Slide 34
Section III. Transportation Investment Frameworks in the UK, Australia and Japan
Attributes of TransportationInvestment Frameworks
Present inAustralia?
Comment
Single Government InfrastructureAdvisory Body Infrastructure Australia (IA) was established to advise the
federal government
National Appraisal/EvaluationGuidelines Infrastructure Australia provides guidance on national
frameworks that builds upon the Australian Transport Council’snational appraisal framework and is supplemented by detailedState guidance
Balance of Qualitative andQuantitative Assessment Use of analytical tools to measure both quantitative and
qualitative impacts
Incorporation of Social, Economicand Environmental Factors inAssessments
Objectives across six areas including: economic, safety, social,environmental, integration and transparency
Begin Framework with NeedIdentification Infrastructure Australia’s Reform and Investment Framework
Strong State/RegionalGuidelines/Policies that build onNational objectives
State-level guidelines follow National requirements whilecustomizing to State requirements and strategic objectives. Keystates include: New South Wales, Victoria and Queensland
Nationally Funded Projects Fundedfrom General Revenues Transport competes with other agencies for general revenue
funds
Australia’s Government-wide Frameworks
Slide 35
Section III. Transportation Investment Frameworks in the UK, Australia and Japan
Government–wide FrameworkSets overarching policy across
government (e.g., road vs. hospital)
Department-level FrameworkGuides department investment decision
making (e.g., across all modes)
Project-level FrameworkGuides decision for individual need (e.g.,
congestion)
Appraisal Models
Inve
stm
entP
olic
yIn
vestmen
tDecisio
n
• Department of Infrastructure, Transport, Regional Development & Local Government:− Provides funding for transport infrastructure and a framework for
competition between and within transport modes− Provides policy advice on whole of government strategies to maximize the
potential of regions− Provides information about relevant Government policies and programs that
is disseminated to regional Australia• Infrastructure Australia: Advises governments and investors of infrastructure on:
− Policy and regulatory reforms to improve the efficient utilization of nationalinfrastructure networks
− Nationally significant infrastructure priorities and possible financingmechanisms
Australian Government: Investment FrameworkKey Stakeholders
Slide 36
Section III. Transportation Investment Frameworks in the UK, Australia and Japan
• Bureau of Infrastructure, Transport and Regional Economics (BITRE): Provides economic analysis,research and statistics on infrastructure, transport and regional/local development to inform policy andunderstanding
• Australian Transport Council: Provides a forum for Commonwealth, State, and Territory Ministers toconsult and provide advice on the coordination and integration of all transport policy issues.
• State and Territory Governments: Create state transport plans and fund majority of improvements.Regulate transport operation and safety standards. Key State Departments include: Queensland Departmentof Transport and Main Roads; VicRoads and Victoria Department of Infrastructure; New South Wales Roadsand Traffic Authority. Similar to the UK, project delivery, preparation, and ownership is generally provided byState and Local Governments’ Project Sponsor
• Private Sector: Provides expert inputs (e.g., technical, financial, legal) and advice, as well as investment
Key Observation:
Historically, the Australianstates provided themajority of infrastructurefunding. However, anincrease in federalfunding has resulted frompolitical and tax systemchanges, and hasincreased the FederalGovernment’s role.
Government–wide
Department-level
Project-level
Appraisal Models
Source: DITRDLG website; Based on Survey of PwC Country Office staff
Australian Government: Investment FrameworkObjectives of Infrastructure Investment
Slide 37
Section III. Transportation Investment Frameworks in the UK, Australia and Japan
Infrastructure Australia identified the following guiding principles to assist with better infrastructuredecision making:• Infrastructure Pricing - Sending the appropriate signals to influence supply and demand for infrastructure• Competitive Markets - Establishing competitive markets wherever possible to minimize the need for
regulation• Private Sector - Involve the private sector, where it is efficient to do so, in delivering outcomes• National Regulation - A national perspective should be adopted where regulation is required• National Markets - Encourage national markets where possible• Customer - Customer focused. Equitable access for all users
Government–wide
Department-level
Project-level
Appraisal Models
Source: Infrastructure Australia - Better Infrastructure Decision-Making
In 2009, Infrastructure Australia’s National Infrastructure Priorities highlighted an economically, socially,and environmentally sustainable infrastructure future. Through guidance from Sir Rod Eddington, ananalytical assessment approach for cross-sector infrastructure investment, known as the Reform andInvestment Framework was introduced.
Australian Government: Investment FrameworkInfrastructure Priorities
Slide 38
Section III. Transportation Investment Frameworks in the UK, Australia and Japan
The Framework:• Is a top-down approach to infrastructure decision-making with
seven distinct stages• Aims to “ensure decisions are taken in an objective and
systematic way, thus leading to the adoption of the mosteffective and efficient policy solutions”
• May replace several legacy frameworks (e.g., AustralianTransport Councils’ National Guidelines for Transport SystemManagement)
• Is suitable to use as an overall planning process forinfrastructure to identify a group of initiatives, or to describe theapproach taken for identification of a single initiative
Reform & Investment Framework:
Key Observation:
The Reform and Investment Framework illustrates how changes to the political landscape can affect theframeworks used for investment decisions
See Appendix C for additional detail on the Reform & Investment Framework
Government–wide
Department-level
Project-level
Appraisal Models
Source: Infrastructure Australia – National Infrastructure Priorities
In January 2009, the Nation Building Funds Act of 2008 established the AUD$20B Building Australia Fund forcritical infrastructure in the transport, communications, water and energy sectors. Infrastructure Australia wastasked with developing a priority list of projects for the Government to consider.
Australian Government: Investment FrameworkBuilding Australia Fund (BAF)
Slide 39
Section III. Transportation Investment Frameworks in the UK, Australia and Japan
The prioritization and selection criteria for the BAF included:• Supporting the seven key themes for action, including: national broadband
network; creation of a true national energy market; competitive internationalgateways; a national rail freight network; transforming our cities throughtransport; providing essential Indigenous infrastructure; and adaptable andsecure water supplies
• A project of national significance (but not necessarily interstate)• Meeting three project assessment criteria, reflecting the BAF legislation:
1) How well the project meets Australia’s wider policy goals: supportingeconomic growth, protecting the environment and promoting socialinclusion, measured against a series of qualitative criteria;
Out of over 1,000 potentialprojects, InfrastructureAustralia identified ten priorityprojects, of which seven wereultimately funded 50/50 byfederal and state government.
In the 2009-10 Budget, $8.5Bwas committed to projects forroad, rail and portinfrastructure, including $7.6Bthrough the Building AustraliaFund (remaining $0.9Bthrough separate funds)
Government–wide
Department-level
Project-level
Appraisal Models
Key Observation:Infrastructure Australia, as a central infrastructure advisor, advises the government on investment prioritiesthrough performance of audits and assessments
3) Project governance and delivery: an assessment of the quality of governance, procurement and riskmanagement plans put in place to deliver the project
2) The contribution the project would make to Australia’s economic success:this was measured through an objective economic assessment of the projects, identifying the level ofincremental economic benefits of the project compared to the incremental economic costs, expressed inthe project’s economic benefit cost ratio; and
Source: Infrastructure Australia website
Similar to the UK’s OGC Gateway Review, the Australian Department of Finance has implemented aGateway Review Process. The process:• Is an independent ex-post review at critical points in the project's lifecycle - conducted by a team not
associated with the project - assesses the project against its specified objectives and identifies areas forcorrective action
• Was introduced to strengthen the oversight and governance of major projects and to deliver agreed projectson-time, on-budget and in-line with stated objectives
• Is required for any procurement and infrastructure projects over AUD$20M• Is similar to UK approach, where the reviews track realization of expected and unexpected outcomes, to
identify outcomes that can be added to improve future analysis predictions• Is supported by detailed guidance materials, including specific questions and documentation required is
provided by the Department of Finance for each review step:
Australian Government: Investment FrameworkGateway Review Process
Slide 40
Section III. Transportation Investment Frameworks in the UK, Australia and Japan
See Appendix C for mapping of Gateway Review Process to overall project lifecycle
Gate 0:Business Need
Gate 1:Business Case
Gate 2:Procurement
Strategy
Gate 3:InvestmentDecision
Gate 4:Readiness for
Service
Gate 5:Benefits
Realization
Key Observation:
Similar to the UK, a challenge when implementing reviews can be to identify tangible project improvements
Government–wide
Department-level
Project-level
Appraisal Models
Source: Australian Department of Finance website
Australia provides an example of how National and StateGovernments can align processes.• National guidelines supplemented by State specific requirements
seek to provide a consistent approach for appraisals andinvestment decisions– States customize the National policies by adding additional detail
to align with their strategic objectives and jurisdictionalrequirements (e.g., The State of Victoria published State-levelplans which lay out in more detail the high order goals adoptedby the National government)
• Often State-level policies or initiatives are used as a basefoundation for the National policies to inform directions for furtherreform
Australian Government: Investment FrameworkState Transport Frameworks
Slide 41
Section III. Transportation Investment Frameworks in the UK, Australia and Japan
Key Observations:
Aligning the State and National processes supports the effectiveimplementation of objectives and appraisals
The States differ by their ability to adopt standard processes that meetnational requirements
Government–wide
Department-level
Project-level
Appraisal Models
Source: Based on Survey of PwC Country Office staff
Australia’s Department-level Frameworks
Slide 42
Section III. Transportation Investment Frameworks in the UK, Australia and Japan
Government–wide FrameworkSets overarching policy across
government (e.g., road vs. hospital)
Department-level FrameworkGuides department investment decision
making (e.g., across all modes)
Project-level FrameworkGuides decision for individual need (e.g.,
congestion)
Appraisal Models
Inve
stm
entP
olic
yIn
vestmen
tDecisio
n
Transport Policy Objectives:• Economic - To promote the efficient movement of people and goods in order to support sustainable
economic development and prosperity
• Safety - To provide a safe transport system that meets Australia's mobility, social and economic objectiveswith maximum safety for its user
• Social - To promote social inclusion by connecting remote and disadvantaged communities and increasingaccessibility to the transport network for all Australians
• Environmental - Protect our environment and improve health by building and investing transport systemsthat minimize emissions and consumption of resources and energy
• Integration - Promote effective and efficient integration and linkage of Australia’s transport system withurban and regional planning at every level of government and with international transport systems
• Transparency - Transparency in funding and charging to provide equitable access to the transport system,through clearly identified means where full cost recovery is not applied
Transport Department: Investment FrameworkObjectives of Transport Investment
Slide 43
Section III. Transportation Investment Frameworks in the UK, Australia and Japan
Government–wide
Department-level
Project-level
Appraisal Models
Source: DITRDLG website
The selection criteria for the Building Australia Fund balanced the project’s ability to contribute toAustralia’s economic growth and success with environmental protection and social inclusion goals.
Australian research has found that transport infrastructure supports economic growth by:• Reducing costs to business through faster, more efficient roads, rail and ports• Creating more efficient freight networks and export infrastructure so Australian businesses will have better
access to global business• Promoting lower transit costs (e.g., actual user-fee, or lost time due to congestion/unreliability) improve the
competitiveness of Australian businesses
Challenges in meeting economic growth goals include:• Poor economic framework having poor pricing mechanism• Insufficient investment in infrastructure over a sustained period• Policy and infrastructure investment are not aligned• Poor coordination across governments• Capacity constraints• Poor supply-chain performance• Urban congestion
Transport Department: Investment FrameworkTransportation & Economic Growth
Slide 44
Section III. Transportation Investment Frameworks in the UK, Australia and Japan
Cost of Investment Gaps:
The Bureau of Infrastructure, Transport andRegional Economics forecasted that the costof doing nothing about congestion inAustralia's capital cities is around $12.9B in2010.
Along with a growing population, this cost isestimated to rise to around $20B per year by2020.
Significant and strategic investments in keycities/corridors is needed to continue tosupport productivity growth, and avoidconstraining future economic growth.Dollars values are in AUD
Government–wide
Department-level
Project-level
Appraisal Models
Source: Australian National Transport Commission. National Transport Policy Framework
Three appraisal methods have frequent relevance to the Australian Government Agencies
Cost-Benefit Analysis (CBA):• Methodology for assessing the net benefits accruing to society as a whole• Conducted from the point of view of the local country or possibly the international community• Appropriate time period over which a CBA should be conducted is generally the projected life of the project
Financial Evaluation (or “Investment Evaluation”):• Assesses the impact of a program or project on the organization’s own financial performance• Conducted from the perspective of an individual firm or agency, rather than community as a whole• Can answer the question of whether a proposal offers an acceptable return from an organization’s
perspective or determining the lowest cost procurement methodCost-Effectiveness Analysis (CEA):• Determines the cost of achieving a specific physical target• May be undertaken from a national or local perspective• Differ from CBA in that benefits are expressed in physical units rather than in money units. As in CBA, costs
are expressed in money terms• Useful in areas such as health, accident safety and education where it is often easier to quantify rather than
monetize benefits
Transport Department: Key Appraisal ModelsCost-Benefit Analysis, Financial Evaluation, and Cost-Effectiveness Analysis
Slide 45
Section III. Transportation Investment Frameworks in the UK, Australia and Japan
Government–wide
Department-level
Project-level
Appraisal Models
Source: Commonwealth Department of Finance – Introduction to Cost-Benefit Analysis
Australia: Summary Observations
Slide 46
Section III. Transportation Investment Frameworks in the UK, Australia and Japan
• A central infrastructure advisor seeks to balance cross-sector priorities and facilitate inter-dependencies
• National guidelines supplemented by State specific requirements support a consistent approach forappraisals and investment decisions
• A key challenge to implementing Gateway Reviews is the ability to identify tangible recommendations forimprovement
• An increase in federal funding for infrastructure reflects changes in the political and financial landscape
• States influence the development of national policies
• Similar upfront financing methods are adopted as the UK, with a combination of government grants andrevenues with private sector financing. There is no dedicated funding stream for transportation investment(such as the U.S. gas tax).
Source: Based on Survey of PwC Country Office staff
Japan
Slide 47
Section III. Transportation Investment Frameworks in the UK, Australia and Japan
Attributes of Japan’s Transportation Investment Framework
Slide 48
Section III. Transportation Investment Frameworks in the UK, Australia and Japan
Attributes of TransportationInvestment Frameworks
Present inJapan?
Comment
Single Government InfrastructureAdvisory Body Ministry of Land, Infrastructure, Transport and Tourism (MLIT)
National Appraisal/EvaluationGuidelines Sector specific guidelines for road, rail, seaport and airport
project evaluations
Balance of Qualitative andQuantitative Assessment Projects with a benefit-cost ratio less than 1.2 are reassessed
with consideration for qualitative, non-tangible values.
Incorporation of Social, Economicand Environmental Factors inAssessments
“Effects on the whole society,” including impact on daily lives ofresidents, local economy, local community and the environment,are considered in project evaluations
Begin Framework with NeedIdentification MLIT’s Evaluation and Appraisal Process
Strong State/RegionalGuidelines/Policies that build onNational objectives
N/A
Nationally Funded Projects Fundedfrom General Revenues Funds previously earmarked for road improvements (e.g., Gas
Tax) were folded into general funds in FY2009
Japan’s Government-wide Frameworks
Slide 49
Section III. Transportation Investment Frameworks in the UK, Australia and Japan
Government–wide FrameworkSets overarching policy across
government (e.g., road vs. hospital)
Department-level FrameworkGuides department investment decision
making (e.g., across all modes)
Project-level FrameworkGuides decision for individual need (e.g.,
congestion)
Appraisal Models
Inve
stm
entP
olic
yIn
vestmen
tDecisio
n
Japan’s Key Plan for Infrastructure Development:• Was jointly submitted by the National Police Agency, the Ministry of Agriculture, Forestry and Fisheries and
MLIT, and endorsed by Japan’s Cabinet in 2003 to promote infrastructure that integrates long-term programsestablished for each project area
• Shifted the focus of policy-making from the budget of projects to the achievement of priority goals• Is part of MLIT’s effort to promote autonomy of regions through creation of development plans
Process for Infrastructure Plan Development:• Involve public and gather opinions of local government to prepare the plan for Cabinet approval• Ex-post review of plan during implementation to adjust as needed to social and economic conditions
Japan Government: Investment FrameworkKey Plan for Infrastructure Framework
Slide 50
Section III. Transportation Investment Frameworks in the UK, Australia and Japan
Key Observation:
Japan's Plan for Infrastructure Framework encourages regional autonomy to effectively utilize local expertiseand private sector resources
Example Performance Goals and Indicators:Themes: Living, Safety, Environment, VitalityMeasures:• Formation of good residential communities• Improving comfort and convenience of urban transportation• Securing transportation services and improving international competitiveness and attractiveness
Government–wide
Department-level
Project-level
Appraisal Models
Source: Japan MLIT website
Japan’s Department-level Frameworks
Slide 51
Section III. Transportation Investment Frameworks in the UK, Australia and Japan
Government–wide FrameworkSets overarching policy across
government (e.g., road vs. hospital)
Department-level FrameworkGuides department investment decision
making (e.g., across all modes)
Project-level FrameworkGuides decision for individual need (e.g.,
congestion)
Appraisal Models
Inve
stm
entP
olic
yIn
vestmen
tDecisio
n
MLIT: Investment FrameworkKey Stakeholders in Transport Investment
Slide 52
Section III. Transportation Investment Frameworks in the UK, Australia and Japan
The Ministry for Land, Infrastructure, Transport andTourism (MLIT) is the National ministry responsible fortransportation systems and infrastructure investment. Keytransport related bureaus under Japan’s MLIT:• Road Bureau: Oversees road projects and policy• Road Transport Bureau: Oversees automobile travel and
traffic systems• Railway Bureau: Oversees rail projects and policy• National and Regional Planning Bureau: Develops
comprehensive land use policies• City and Regional Development Bureau: Creates the
policy vision, and develops balanced infrastructureOther Key Stakeholders Include:• Road: National and local governments are responsible for
non-toll roads. Private companies are responsible for theconstruction, operation and maintenance of toll roads(expressways)
• Rail: National and local governments are responsible fornew construction. Privatized National Railway Companiesoperate railways, and may receive Government O&Msubsidies
• Private Investors: There are currently a limited number ofPPP/PFI transport projects in Japan.
National Level(Headquarters):
Responsible for systems andpolicies that reflect national
needs and evaluation of resultsbased on budget allocation
Regional Level(Regional Bureau):
Responsible for formulation ofroads project that reflectregional (by-block) needs
Local Level(National Highway Offices)
Responsible for roads projectsthat reflect local needs and
ensuring efficient execution ofbudget allocation
Example of the Division of Japan’s Road BureauResponsibilities
Japan’s local governments heavily depend onNational financial support (historically 30% ofbudget). This dependency requires standardizationof policies and processes across regions andlocalities.
Government–wide
Department-level
Project-level
Appraisal Models
Source: Japan MLIT website; Based on Survey of PwC Country Office staff
• MLIT’s five goals reflect its broad responsibilities and focus on economic, social and environmental factors:1) Supporting Joyful Life: Realize a society where people can enjoy life in a safe environment to pursue
activities with freedom and initiative to suit their own lifestyles and stages of life2) Enhancing Global Competitiveness: Realize a globally competitive economic society that is
sustainable with stable growth3) National Safety: Minimize disaster, ensure traffic safety and maintain maritime order and safety4) Preserve and Create a Beautiful and Benign Environment: Playing our part to help improve the
environment, creation and preservation of a healthy environment, and enhancing Japan’s nationalbeauty for a sense of pride
5) Enhancing Regional Diversity: Foster and utilize the unique qualities of various regions throughindependent development supported by interregional cooperation
Transportation:• Japan’s transportation infrastructure investment approach aims to help form a vital economic society and
region, respond to global environmental issues, promote safety and security, and aid tourism development• Each transportation mode has its own laws and policies to guide investment decisions, and MLIT encourages
policy evaluation and provides subsidies to promote key priorities (e.g., safety)
MLIT: Investment FrameworkObjectives of Transport Investment
Slide 53
Section III. Transportation Investment Frameworks in the UK, Australia and Japan
Government–wide
Department-level
Project-level
Appraisal Models
Source: Japan MLIT website; Based on Survey of PwC Country Office staff
• Japan’s transportation framework model has changed with the restructuring of key transportation bodies(e.g., railway, and highway), and has experienced multiple national and rural issues (e.g., rise in lowoperational efficiency and non-profitable infrastructure needs)
• As a result, Japan’s transport policy has taken a multi-faceted direction, including:− Adjusting the infrastructure investment approach according to unique modal needs (e.g., Private Finance
Initiative (PFI) scheme for expansion of Tokyo Airport, privatization of Tokyo Metro)− Promoting regional revitalization policies that enhance autonomy of regions and encourage use of private
sector expertise and funds− Implementing mobility management and transportation demand management initiatives (e.g., park and
ride systems, and alternative work schedules)− Investing in new research and development options for the next generation of transportation (e.g.,
intelligent transport systems, dual mode vehicles, and magnetic levitation trains)
MLIT: Investment FrameworkRecent Changes in Transport Investment
Slide 54
Section III. Transportation Investment Frameworks in the UK, Australia and Japan
Government–wide
Department-level
Project-level
Appraisal Models
Source: Japan MLIT website; Based on Survey of PwC Country Office staff
Slide 55
Section III. Transportation Investment Frameworks in the UK, Australia and Japan
Toll-Road Restructuring:
The Japan Highway PublicCorporation wasrestructured in 2005, andseparated into sixcompanies.
These six companies arejoint-stock companies andall shares are held by thegovernment.
A new organization wasfounded as anincorporated administrativeorganization to reduce thefinancial burden forhighway companies and tosupport the successfuloperation of highwayservices for highwaycompanies.
Before restructuring:
After restructuring:
MLIT: Investment FrameworkRecent Changes in Transport Investment
Government–wide
Department-level
Project-level
Appraisal Models
Source: Mizutani & Uranishi – Privatization of the Japan Highway Public Corporation: Policy Assessment
Japan’s up-front financing options for infrastructure vary by transport mode:
• Roads:− The majority of the road investment is traditionally procured by National and Local Governments, except
toll roads which are conducted by private road companies− Historically, the two major sources of funding were the earmarked tax revenue system, which appropriated
gasoline tax and others for highway development and maintenance, and the toll road system, whichrepaid loans from toll fee receipts
− In FY2009, earmarked revenue such as the gasoline tax for road improvements were shifted into thegeneral revenues. The impact of this new policy is still to be determined.
• Rail:− Seven companies (Japan Railways) were privatized in 1987 and are operators of Japan’s railway. Some
of these firms receive operating and maintenance subsidies from the Government.− For new construction, the Government funds are partly provided for most of the railway companies. The
amount/percentage of subsidies varies according to the structure of the railroad.− MLIT is starting to research the possibility of Public Private Partnerships (PPPs) for new railroad
construction
MLIT: Investment FrameworkUp-front Financing Methods for Transport Infrastructure
Slide 56
Section III. Transportation Investment Frameworks in the UK, Australia and Japan
Government–wide
Department-level
Project-level
Appraisal Models
Source: Based on Survey of PwC Country Office staff
MLIT: Appraisal and Evaluation ProcessFramework Guidelines
Slide 57
Section III. Transportation Investment Frameworks in the UK, Australia and Japan
• Evaluation and investment decisions are made by the MLIT, after budgets are approved by Ministry ofFinance and the Cabinet (known as the Diet)
• In the late 1990s, specific guidelines for the evaluation of road, railway, airport and seaport projects were firstintroduced. Most notable are the Evaluation of Road Investment Projects, which was last revised in 2006.
• In 2007, Japan shifted to a result-oriented policy development process to better align evaluationmeasures with budget measures. A three-tier system was established, which included ex-ante, in-progressand ex-post project evaluations, as well as post-reviews of forecasting methods.− Ex-Ante Evaluation: Performed at the appraisal phase− In-Progress: Re-evaluation conducted if the project has not started after three years of appraisal and
then again after five years of appraisal− Ex-Post Evaluation: Conducted five years after completion of the project
Roles & Responsibilities in Transport Evaluation:• MLIT conducts the evaluation, and project evaluation. Monitoring committees are formed with a third-party to
discuss results.• MLIT develops and revises the evaluation process through inputs received from experts outside of MLIT.
Key Challenges of Transport Evaluation:• Evaluation challenges vary by project, however many relate to changes in the demand and cost estimate
projections, and delays in the project’s progress
Government–wide
Department-level
Project-level
Appraisal Models
Source: EVA-Tren Expert Workshop – Chevroulet – Berkley Research Paper – “Transport & Energy Infrastructure Approach in Europe
• Ex-ante project evaluations are conducted through a combination of appraisal models:− Cost-Benefit Analysis (CBA) is used to select a set of projects among the available options− Multi-Criteria Analysis (MCA) helps to rank the projects that have been selected
• CBAs are followed by an environmental and social impact assessment which use established economicvalues based on the Contingent Valuation Method Guidelines published in 2009
MLIT: Appraisal and Evaluation ProcessEx-ante Project Evaluations
Slide 58
Section III. Transportation Investment Frameworks in the UK, Australia and Japan
Flow of Japan’s Ex-ante project evaluations:
Cost-Benefit Analysis
Government–wide
Department-level
Project-level
Appraisal Models
Source: EVA-Tren Expert Workshop – Chevroulet – Berkley Research Paper – “Transport & Energy Infrastructure Approach in Europe
Japan: Summary Observations
Slide 59
Section III. Transportation Investment Frameworks in the UK, Australia and Japan
• Japan’s evolving transportation framework with privatization of road, rail and metro companiesdemonstrates an alternative approach for relieving government’s transportation debt
• The Japanese structure encourages regional autonomy to effectively utilize local expertise and privatesector resources
Source: Based on Survey of PwC Country Office staff
Comparison of Transportation Investment Frameworks
Slide 60
Section III. Transportation Investment Frameworks in the UK, Australia and Japan
Attributes of TransportationInvestment Frameworks
UK Australia Japan
Single Government InfrastructureAdvisory Body National Appraisal/EvaluationGuidelines Balance of Qualitative andQuantitative Assessment Incorporation of Social, Economicand Environmental Factors inAssessments
Begin Framework with NeedIdentification Strong State/RegionalGuidelines/Policies that build onNational objectives
N/A N/A
Nationally Funded Projects Fundedfrom General Revenues
IV. Livability & Sustainability Impacts on Investment inCanada & Sweden
Slide 61
Section IV. Livability & Sustainability Impacts on Investment
• Livable communities in Canada are characterized by increased access to safe drinking water, protectionagainst natural disasters, improved urban development, and access to sports facilities
• Canada defines sustainable development as “development that meets the needs of the present withoutcompromising the ability of future generations to meet their own needs”
• In line with Canada’s environmental agenda, key infrastructure and transportation initiatives include:
Impact on Infrastructure Investment:• Mandatory greenhouse gas reduction targets established by Federal Government in its environmental
agenda requires a shift in investment strategies for major industries
• Certain projects must meet livability and sustainability criteria to receive funding– For example, under the Building Canada Fund, large-scale transit infrastructure projects must
include Transportation Demand Management measures that improve environmental outcomes
Section IV. Livability & Sustainability Impacts on Investment
Building Canada Fund
• Provides long-term, stable, flexible andpredictable funding for specific infrastructureprojects
• Clear goals and streamlined processes• High collaboration between federal, provincial
and municipal governments• Balances regional needs with national priorities
ecoTRANSPORT Strategy
• Focuses on Transportation DemandManagement (TDM) policies that shift personalauto travel to other modes, disperses travelfrom congested times and routes, or eliminatestravel all together
• Pursues cutting edge technologies• Works with manufacturers to bring clean
vehicles to Canada safely and quickly
Source: Infrastructure Canada, Building Canada Plan; Government of Canada, ecoTRANSPORT Strategy
Canada: Key Stakeholders in Transport
Slide 63
Section IV. Livability & Sustainability Impacts on Investment
Canada’s Transport, Infrastructure, and CommunitiesPortfolio includes two key authorities:
Transport Canada:• Supports the government’s environmental agenda through
policies, regulations and programs that reduce the harmfulimpact of all transportation modes
• Ensures all parts of the transportation system are safe,secure, efficient, and environmentally responsible
• Develops a Program Activity Architecture framework tohighlight how the department’s activities contribute toreaching the government’s strategic outcomes
Infrastructure Canada:• Leads federal efforts to implement an action plan that
enhances infrastructure through strategic investments, keypartnerships, sound policies, and practical research
• Manages funds providing investments in infrastructureinitiatives across the country (e.g. Building Canada Fund)
• Invests in research and analysis to increase knowledge andexpertise in Canada about infrastructure management
Overall, the Federal Government selects projects to investin, which are implemented by State/Local Governments
Source: Transport Canada’s Program Activity Architecture, 11/2009
Transport Canada’s Program Activity Architecture:
Source: Government of Canada, Transport Canada; Infrastructure Canada; Based on Survey of PwC Country Office staff
Canadian Benefit-Cost Analysis Approach• Transport Canada uses a nine-step evaluation process to perform a benefit-cost analysis (BCA)• Process determines a preferred transportation investment option from an economic standpoint using net
present values (NPV), but the NPV does not automate decision-making as uncertainties must also beassessed
Transport Canada’s Evaluation Services Group:• Determines the impact of policies, programs, or initiatives and the extent to which they are relevant,
successful, and cost-effective• Provides evaluations with the necessary information managers need to make sound decisions and design
effective and efficient policies, programs, and initiatives• Follows an evaluation process that is collaborative, bringing together policy, program, and initiative experts
and evaluators, thereby building relationships across the Department and other government departments
Transport Canada’s Nine Step Benefit-Cost Analysis
Source: Transport Canada, Guide to Benefit-Cost Analysis, September 1994
1. State Problemor Opportunity 2. Identify Issues 3. Identify Base
Case Option4. Identify Other
Options 5. Screen Options
6. EstablishOptions for
ComparativeAnalysis
7. EstimateProject-Related
Costs
8. Identify &Estimate Benefits& Other Effects
9. EvaluateOptions &
Compare Results
Canada: Transportation Investment Appraisal Model
Slide 64
Section IV. Livability & Sustainability Impacts on Investment
Source: Transport Canada – Guide to Benefit-Cost Analysis; Government of Canada, Transport Canada
The Building Canada Plan (BCP):• Delivers results that support Canada's priorities: a
stronger economy, cleaner environment and bettercommunities
• Provides CAD$33B in flexible and predictablefunding from 2007-2014
• Includes up to 1% of funding that will be available forresearch, planning, feasibility, and other studies
Canada: Policies and Initiatives – Building Canada Plan
Slide 65
Section IV. Livability & Sustainability Impacts on Investment
The Building Canada Fund:• Is the flagship fund of the BCP• Is led by Infrastructure Canada• Provides a total Federal Funding allocation of
CAD$8.5B for key public infrastructure priorities• Unifies delivery of currently distributed infrastructure
program funding into a single instrument• Consists of two components to balance the needs of both urban and rural communities:
– The Major Infrastructure Component (MIC) targets larger projects of national and regional significance– The Communities Component (CC) focuses on communities with populations less than 100,000
• The division of funding between MIC and CC are set in each federal-provincial-territorial frameworkagreement
Funding Allocations under the Building Canada Plan:
Building Canada Plan
Municipal Base FundingGas Tax Fund: $11.8B/7 years
Goods and Services Tax(GST) Rebate: $5.8B/7 years
Provincial / TerritorialBase Funding
(equal per jurisdiction)$2.275B / 7 years
Building CanadaFund$8.5B
MajorInfrastructureComponent
CommunitiesComponent
Gateways andBorder
CrossingsFund: $2.1BAsia –PacificGateway: $1B
Public-Private
PartnershipsFund
$1.26B
See Appendix E for detail on the Building Canada Plan funding allocation
Source: Infrastructure Canada, Building Canada Plan, all dollars in CAD
Source: Infrastructure Canada, Building Canada Plan
The BCF Overall Selection Criteria and Process includes:• Fifteen eligible categories – five of which are national priorities• Funding allocated to provinces and territories based on population• Framework Agreements with each province and territory, where the
Government works in partnership to address infrastructure issues in aconsistent and coherent manner, taking into account long-term planning
• Funding recipients that may be provincial, territorial, or local government,a private partner, a non-government organization or a combination
The Major Infrastructure Component (MIC) Selection Process includes:• 67% of MIC funding will be directed to the five national priority categories• Projects selected on the basis of merit through joint negotiations• A requirement for all projects to meet criteria targeting environmental,
economic and quality-of-life objectives, with additional emphasis oninnovative technologies and inter-agency partnerships
• A requirement for all project to be cost-shared, with a maximum federalshare of one-third when involving municipalities
The Communities Component (CC) Selection Process includes:• A requirement for all projects to meet environmental, economic and
quality-of-life objectives, as well as category specific criteria• A competitive, application-based process• The federal and provincial governments and municipalities each
contributing one-third to finance community projects
Canada: Policies and Initiatives – Building Canada Fund (BCF)
Slide 66
Section IV. Livability & Sustainability Impacts on Investment
Growing Economy
Core National Highways*Shortline Rail/Shortsea Shipping
Connectivity and BroadbandTourism
Regional/Local Airports
Strong Communities
Clean Drinking Water*Disaster Mitigation
Brownfield RedevelopmentCultureSport
Local Roads
Cleaner Environment
Wastewater Treatment*Public Transit*Green Energy*
Solid Waste Management
BCF Themes & Categories:
* Denotes National Priority
Source: Infrastructure Canada, Building Canada Plan
In 2007, the Government of Canada launched its ecoTRANSPORT strategy to address one of the country’slargest sources of air pollution--transportation. The ecoTRANSPORT strategy provides over $100M to promoteclean, sustainable transportation choices for Canadians and includes the following initiatives:
Canada: Policies and Initiatives - ecoTRANSPORT
Slide 67
Section IV. Livability & Sustainability Impacts on Investment
1. ecoMOBILITY Program• CAD$10M to develop programs, services,
and products that encourage Canadians tochoose public transit/other sustainabletransportation options
2. ecoTECHNOLOGY for Vehicles• CAD$15M for in-depth testing and publishing
of emerging technologies and to foster newpartnerships with the automotive industry
3. ecoENERGY for Personal Vehicles• CAD$21M to provide fuel consumption
information and decision-making tools toencourage consumers to purchase fuel-efficient vehicles
4. ecoFREIGHT Program:• CAD$61M to reduce the environmental and
health effects of freight transportation
Improve the health of Canadians and the environmentby reducing the environmental impacts oftransportation
Contribute to Canada’s future prosperity andcompetitiveness by making transportation sustainable
Promote an efficient transportation system thatsupports choice and the high quality of life Canadiansexpect
Goals of the ecoTRANSPORT Strategy
Key Observations:
The ecoTRANSPORT strategy emphasizesTransportation Demand Management (TDM) policiesand programs that influence the demand for travel inprivate vehicles by increasing awareness and offeringtravel incentives
Source: Government of Canada, ecoTRANSPORT Strategy
Canada: Summary Observations
Slide 68
Section IV. Livability & Sustainability Impacts on Investment
• The Building Canada Fund includes a funding split between rural (population < 100,000) and metropolitancommunities, as determined in each province/territory’s framework agreement
• The federal funding commitment to any single project is a maximum of 50% under the Building CanadaFund, and based on population
• The framework agreements formally establish a partnership between the Government of Canada and eachprovince/territory to address immediate infrastructure needs and conduct long-term planning
• The ecoTRANSPORT Strategy invests in education, research, and strategic partnerships to reduceemissions across Canada
Source: Based on Survey of PwC Country Office staff
Section IV. Livability & Sustainability Impacts on Investment
For Sweden, the aim of the transport system is to ensure that the entire journey or mode of transport functionssmoothly for everyone
Four strategic challenges have priority in the national strategy for sustainable development (SD), including:building sustainable communities, encouraging good health on equal terms, meeting the demographicchallenge, and encouraging sustainable growth.
Sweden’s political climate and proactive initiatives have contributed to making sustainable transportationdevelopment a reality. Recent initiatives include:
.Hammarby Sjöstad Stockholm Congestion Tax Clean Vehicles in
Stockholm
• An urban development projectin Stockholm, turning abrownfield site into a greencity
• Demonstrates a successfulmulti-agency approach forplanning awards
• Implemented in downtownStockholm in 2006/2007
• Reduced traffic by 20% indowntown Stockholm
• Green cars are exempt frompaying the tax
• Since 1994, it has promotedclean vehicles andrenewable fuels
• The goal is to have half ofbuses running on renewablefuel by 2011 and all by 2025
Impact on Infrastructure Investment:• All policy decisions must take account of the longer-term economic, social and environmental implications• Funds collected from congestion tax are used for transport projects (the estimated 2010 net revenue is€60M)
Source: Division for Sustainable Development – Strategic Challenges; Hammarby Sjostad; BioEthanol for Sustainable Transport (BEST)
Sweden’s Transport Government Structure:• On April 1, 2010, the Swedish Transport Administration and Transport Agency began operations, replacing
the Swedish Rail Administration, the Swedish Road Administration, and the Swedish Institute for Transportand Communications Analysis
• The new joint agency provides improved organization, and the administering of infrastructure anddevelopment of transport modes to be conducted from a holistic/global perspective
• The Swedish Transport Administration and Transport Agency cooperate with existing government authoritiesto simplify everyday travel. The key responsibilities include:
Sweden: Key Stakeholders in Transport
Slide 70
Section IV. Livability & Sustainability Impacts on Investment
• Responsible for long-term planning of the transport system for road, rail,maritime, and air traffic
• Responsible for construction, operation and maintenance of public roads andrailways
Swedish Transport Administration
• Stipulates rules and monitors how they are followed• Grants permissions• Manages congestion and vehicle taxation
Swedish Transport Agency
• Reviews bases for decisions• Assesses measures• Responsible for statistics
Transport Analysis
Key Observations:
Centralizing the roadand rail administrationhas provided for efficientand integrated planning
A cross-mode transportanalysis team supportsconsistent decisionmaking and gathering ofimportant data andstatistics
Source: Trafikverket website
Sweden: Planning Infrastructure in Sweden
Slide 71
Section IV. Livability & Sustainability Impacts on Investment
Sweden’s Infrastructure Planning Approach:• The infrastructure planning process is jointly performed by the traffic agencies and the regions in dialogue
with traffic system users• During strategic planning, strategic issues related to the development of transport system and desired
outcomes are addressed• The Government then produces its proposal for the strategy and financial framework for the development of
the transport systemSwedish Infrastructure Planning Process:
Source: Government of Sweden, Planning Infrastructure in Sweden, May 2009
Source: Government Offices of Sweden, Planning Infrastructure in Sweden
Sweden: Sustainable Development Background
Slide 72
Section IV. Livability & Sustainability Impacts on Investment
Sustainable Development:• This was adopted as an overall Government policy objective in 2003• It is coordinated by a single government body known as the “Division for
Sustainable Development” under the Ministry of Environment, who helpsto facilitate the Strategy for Sustainable Development (SDS) acrossagencies and levels of government (e.g., all ministry links regardingsustainable development refer to a single website)
• It requires recognition across all ministries that sustainable developmentmust actively shape all policy decisions. One report highlighted that“sustainable development policy is seen as a key catalyst for renewal,growth and employment”
• Progress is monitored by a total of 87 sustainable development indicators :– Headline Indicators (12): average life expectancy, violence, energy
efficiency, investments, employment rate, public debt, growth, risk ofpoverty, demographic support ratio, greenhouse gases, hazardoussubstances and development assistance
– Each headline indicator is broken down into six different areas:health, sustainable consumption and production, economicdevelopment, social cohesion, environment and climate, and globaldevelopment.
Source: Division for Sustainable Development – Strategic Challenges
Source: Cities of Opportunity, 2010
Sweden: Stockholm’s Livability and Sustainability Success
Slide 73
Stockholm was also included in the 2010 Cities of Opportunity Report,which provides a quantitative and qualitative analysis of 21 capitals:
– Stockholm ranked #1 in sustainability management, greenness, airquality, and congestion management
– Gunnar Söderholm, City Director of Environment and Health, attributessustainability success to Stockholm’s long-term perspective in planning,starting in the 1950s, and consensus among political parties to invest ingreen alternatives and research new technologies
The Siemens’ European Green City Index Report for 2009 rankedStockholm #1 in Transport and #2 Overall. Key highlights include:
– 68% of people cycle or walk to work, and 25% use public transit– Trafik Stockholm system provides constant traffic data to drivers and
adjusts traffic lights/variable road signs to reduce congestion– Universal political support for green public alternatives, including political
pressure on public transit officials to develop new solutionsThe report also found a strong correlation between citizen engagement andenvironmental performance, noting that the city leaders should explore waysof engaging more closely with their citizens.
Source: European Green City Index, 2009
Section IV. Livability & Sustainability Impacts on Investment
Two recent reports analyze Stockholm’s Success:
Source: Economist Intelligence Unit, European Green City Index; PricewaterhouseCoopers LLP and the Partnership for New York, Cities ofOpportunity
What makes Sweden so successful in sustainable green transportation?• The Siemens’ European Green City Index noted three key building blocks for Stockholm’s success:
Sweden: Livability and Sustainability Success Factors
Slide 74
Section IV. Livability & Sustainability Impacts on Investment
Easy accessto green, safe,
andconvenientmodes of
transportation
Application ofgreen
technologysolutions tovehicles andinfrastructure
Governmentpolicy that
encouragesuse of greenalternatives
LeadingGreen
TransportPractices
Key Observations:
Shifting public and political opinions regarding initiatives requires significant effort and time
Prior to its implementation, 75% of residents opposed the congestion tax, however today 65% of residents are infavor of it
Communication and collaboration have been the key drivers for change (e.g., running a public awareness programfor sustainable lifestyles)
In addition, other critical success factors for Sweden include:• Setting lofty goals and experimenting with new technology to achieve them• Engaging and motivating communities to make greener decisions• A shifting political climate that now supports green solutions for sustainable development• Collecting and analyzing performance data to improve system performance
Source: Economist Intelligence Unit, European Green City Index, 2009
How does Sweden achieve high levels of communication and collaboration with stakeholders?• Builds a collaborative network of government and private interests, through development of mutually
beneficial partnerships with the private sector (e.g., IBM for Congestion Tax, Energy Company for transitenergy use) and public sector (e.g., Housing Authority for Hammarby Sjöstad)
• Markets sustainable lifestyle benefits through public awareness campaigns• Advocates clean technology and leads by example by setting goals for 100% of the municipality’s own
vehicles to be clean by 2010, and 100% of its buses to run on renewable fuel by 2025• Promotes clean vehicles through disseminating newsletters and seminars, and raising awareness of clean
vehicles in private companies using external market activities, including establishing a company register,supplying journalists with research results, and providing advice to companies through direct contacts
• Drives consensus about the necessity of improving the environment regardless of political party majorities
Sweden: Success Factors - Communication & Collaboration
Slide 75
Key Observations:
Long-term planning perspectives can be important in creating sustainable change and cultural shifts
Engaging users and developing cross-agency approaches have supported this transformation
Lessons learned from Hammarby Sjöstad:• Hammarby Sjöstad involved various authorities and administrations during the early stages of planning to
create a residential environment based on sustainable resource usage• The GlashusEtt environmental information center informs residents through exhibitions and demonstrations
how they are a part of the eco-cycle solution of Hammarby Sjöstad, known as the Hammarby Model
Section IV. Livability & Sustainability Impacts on Investment
See Appendix F for more information on Hammarby Sjöstad
Source: Economist Intelligence Unit, European Green City Index; BioEthanol for Sustainable Transport (BEST); Hammarby Sjostad
National Policies• The Clean Vehicles in Stockholm initiative paved the way for some of Sweden’s national policies, including
the following:− 1999: Company car taxation of alternatively fuelled vehicles becomes equivalent to conventional cars− 2003: The Minister of Finance reduces the tax on biofuels through the end of 2012− 2006: The “pump law” requires all refuelling stations of a certain size to supply at least one alternative
fuel, and requirements have since increased− 2007: Purchase subsidy to all private buyers of clean cars until June 2009
Sweden: Lessons Learned from Stockholm Initiative
Slide 76
The Impact of Incentives• An analysis of the Clean Vehicles in Stockholm
initiative provides the following insights on incentives:− Incentives affecting the operating costs of
vehicles are strongest (e.g. congestion chargingand fuel price)
− Incentives that introduce a privilege for cleancars over conventional counterparts are strongerthan incentivesthat simply “even out” their differences
− The most influential factor for company cardrivers to choose a clean vehicle is the loweremployee benefittax assessed to a clean company car Source: Promoting Clean Cars, BioEthanol for Sustainable Transport (BEST),
February 2009
Section IV. Livability & Sustainability Impacts on Investment
See Appendix F for more information on the Clean Vehicles in Stockholm Initiative
Source: BioEthanol for Sustainable Transport (BEST), Promoting Clean Cars: Case Study of Stockholm and Sweden
Sweden: Summary Observations
Slide 77
Section IV. Livability & Sustainability Impacts on Investment
• The consolidated Swedish Transport Administration allows for the administering of infrastructure anddevelopment of transport modes to be conducted from a holistic perspective
• Incentives have supported the city in influencing the market spread of clean cars:– Incentives that offer the largest monetary gain, that drivers experience frequently (e.g. congestion
charges), and that introduce a privilege for clean cars have been effective• A complete approach has been implemented to reduce the environmental impact of the community:
– Hammarby Sjöstad held early consultations with administrative departments and companiesresponsible for energy, waste management, water & sewage to develop solutions that would meetenvironmental goals
– Communication and collaboration with residents has been critical to the success of the project
Source: Based on Survey of PwC Country Office staff
V. Summary of Key Lessons Learned AndConsiderations for the U.S.
Slide 78
Section V. Summary of Key Lessons Learned And Considerations for the U.S.
Key Lessons Learned from UK, Australia, and Japan
Slide 79
Section V. Summary of Key Lessons Learned And Considerations for the U.S.
• Long-term planning that incorporates land-use visions and cross-mode infrastructureneeds helps to provide stability and security to public and private partners
• Established frameworks and appraisal methods, that are aligned with nationalobjectives and involve significant stakeholder consultation, may providetransparency and support cross-mode infrastructure investment
• Central infrastructure advisory bodies may contribute to cross-sector investmentprioritization and funding
• State-level guidance can assist in addressing individual state requirements andstrategic objectives while aligning with national guidelines
• Justifying action, prior to funding commitment, may focus the allocation of limitedfunds and resources to those areas that provide the greatest value
Long-term land-use vision, cross-sector views, and justification for need are commonthemes across the key jurisdictions that could provide benefits to the United States
Source: Based on Survey of PwC Country Office staff
• Long-term planning perspectives provide crucial support to sustainable developmentand cultural shifts
• Consensus on improving the environment across political parties has also assistedthe progress towards sustainability
• Deliberate distribution of funding between rural and metropolitan areas may help toin addressing the infrastructure needs of smaller communities
• Engaging residents and developing cross-agency approaches supporttransformation and may reduce the environmental impact on a community
• Policies that emphasize Transportation Demand Management (TDM) measures mayinfluence the demand for travel in private vehicles by increasing awareness andoffering travel incentives
• Incentives that offer the largest monetary gain or that drivers experience frequentlycan influence the market spread of clean vehicles
Key Lessons Learned from Canada and Sweden
Slide 80
Long-term planning, engagement of residents, and collaboration between public andprivate entities have assisted in making livable and sustainable communities a reality
Section V. Summary of Key Lessons Learned And Considerations for the U.S.
Source: Based on Survey of PwC Country Office staff
Australia:• Australian Transport Council, National Guidelines for Transport System Management In Australia: http://www.atcouncil.gov.au/documents/ngtsm.aspx• Infrastructure Australia. http://www.infrastructureaustralia.gov.au/
Canada:• Infrastructure Canada: http://www.infc.gc.ca/department/about-apropos/about-apropos-eng.html• Infrastructure Canada, Building Canada Plan: http://www.buildingcanada-chantierscanada.gc.ca/plandocs/index-eng.html• Government of Canada, ecoTRANSPORT Strategy: http://www.ecoaction.gc.ca/ecotransport/index-eng.cfm• Government of Canada, Transport Canada: http://www.tc.gc.ca/eng/aboutus-menu.htm
Japan:• Japan’s MLIT Ministry of Land, Infrastructure, Transport and Tourism http://www.mlit.go.jp/index_e.html
Sweden:• BioEthanol for Sustainable Transport (BEST), Promoting Clean Cars: Case Study of Stockholm and Sweden, February 2009: http://www.best-
europe.org/upload/BEST_documents/incentives/D.5.12%20Promoting%20Clean%20Cars%20Report.pdf• Economist Intelligence Unit, European Green City Index: http://www.siemens.com/entry/cc/features/urbanization_development/all/en/pdf/report_en.pdf• Division for Sustainable Development – Strategic Challenges: http://www.sweden.gov.se/content/1/c6/07/01/83/1a9ae133.pdf• HammarbySjostad: http://www.hammarbysjostad.se/• PricewaterhouseCoopers and the Partnership for New York, Cities of Opportunity: http://www.pwc.com/en_U.S./us/cities-of-opportunity/assets/pwc-
UK:• Eddington Transport Study: http://www.dft.gov.uk/adobepdf/187604/206711/executivesummary.pdf• HM Treasury – Green Book: http://www.hm-treasury.gov.uk/d/green_book_complete.pdf• HM Treasury – Office of Government Commerce (OGC) Gateway Review for Programmes & Projects:
http://www.ogc.gov.uk/what_is_ogc_gateway_review.asp• UK’s Department for Transport - Transport Analysis Guidance – WebTAG: http://www.dft.gov.uk/webtag/
Appendix A: Source List
Slide 81
Appendices
Appendix B: UK’s DfT NATA Process Flow
Slide 82
Appendices
Source: DfT WebTAG website
Appendix B: UK WebTAG Excerpts
Slide 83
Appendices
Source: DfT WebTAG website
Appraisal Summary Table Worksheet from WebTAG:
Appendix B: UK DfT’s NATA - Appraisal Summary Table
Slide 84
Appendices
KEY POINTS ASSESSMENT
PVB £m
PVB £m
PVB £m
None/PVB £m
PVB £m
Verbal score
Verbal score
Verbal score
Number
Verbal Score
PVB £m
Verbal score
Verbal score
Verbal score
Verbal score
Verbal score/PVB £m
Verbal score
PVB £m
PVB £m
PVB £m
PVB £m
Verbal score
PVC £m
PVB £m
Appraisal Summary Table
Option Date & Contact
IMPACT ON PUBLICACCOUNTS
Broad transport budget
Wider public finance impacts
BETTER SAFETY,SECURITY & HEALTH
Reduce the risk of death orinjuryImprove health through physicalactivityReduce air quality health costs
Building Canada Plan Allocations for 2007 – 2014: Top Four Provinces
Appendix E: Building Canada Fund Example
Slide 87
Appendices
Ontario Quebec BritishColumbia
Alberta
Building Canada Fund $3,097 m(36%)
$1,953 m(23%)
$1,040 m(12%)
$841 m(10%)
- Major Infrastructure Component $2,735 m(88%)
$1,729 m(89%)
$929 m(89%)
$753 m(90%)
- Communities Component $362 m(12%)
$210 m(11%)
$111 m(11%)
$88 m(10%)
Base Funding $175 m $175 m $175 m $175 m
Gas Tax Fund $2,987 m $1,854 m $1,003 m $798 m
TOTAL $6,259 m $3,983 m $2,218 m $1,814 m
Source: Infrastructure Canada – Building Canada Framework Agreements
Transportation Goals:• Provide fast, attractive public transport, combined with
carpool and cycle paths, to reduce private car usage• Goal for 80% of all residents’ and workers’ travel be
made by public transport, foot, or bicycle• Ensure at least 15% of households and at least 5% of
workplaces be signed up to the carpool• 100% of heavy transportation be by vehicles that
meet current environmental zone requirements
Appendix F: Sweden - Hammarby Sjöstad
Slide 88
Overview:• A sustainable urban development project in Stockholm• Started in the early 1990s and estimated to be completed in 2016• Reconstructing an industrial area into an energy-efficient, environmentally conscious
neighborhood of 25,000 people• Imposed strict environmental requirements on buildings, technical installations, and
the traffic environment• Goal is to have half the environmental impact compared to other areas built in the
early 1990s
Transport Type Referent Hammarby
Car 35% 21%
Tvärbanan (LightRail)/Ferry* 0% 34%
Bus 50% 18%
Bicycle 7% 9%
Walking 8% 18%*Referent districts do not have Tvärbanan light rail or ferry options.
Source: Grontmij, Report Summary, March 2008
A breakdown of Hammarby Sjöstad residents’everyday journeys against comparable districts
Appendices
Source: Grontmij, Report Summary, March 2008
Clean Vehicles in Stockholm:• Initiative started in 1994 to promote clean vehicles and renewable fuels• Stockholm leads by example – goal is for half of its buses to run on renewable fuel by 2011 and all by 2025• Extensive activities of the initiative in Stockholm have positively influenced the introduction of several
national incentives, including reduced tax assessment value for clean company cars• Early success includes the following achievements:
– 15% of all private car traffic in and out of the central city is green– 40% of new cars sold in Stockholm were alternative-fuel vehicles in 2008
Appendix F: Sweden - Clean Vehicles in Stockholm Initiative
Slide 89
Methods used to promote clean vehicles
Market Incentives • Exemption from congestion charges for alternatively-fueled vehicles• Minister of Finance reduced tax on biofuels from 2003-2012
Awareness-raising • In 2000, Stockholm introduced information activities targeted towardsprivate companies to help them choose clean vehicles
InfrastructureDevelopment
• Expansion of public transit, such as the Citybanan project (€1.7B project todouble rail capacity in Stockholm)
• Installing car charging stations in parking lots and close to homes
Initiative’s Goals for the end of 2010:• 35% of new car sales be of clean vehicles• All of the municipality’s own vehicles be clean and fuelled by at least 85% renewable fuels
Appendices
Source: BioEthanol for Sustainable Transport (BEST), Promoting Clean Cars: Case Study of Stockholm and Sweden