Statistics in the Community (STATCOM) Purdue University Guide for Conducting Surveys: A Handbook for STATCOM Members STATCOM304 Revision 1.0 Xian Xiao, Gayla R. Olbricht, & Nilupa S. Gunaratna August 2006
Transcript
Statistics in the Community (STATCOM)Purdue University
Guide for Conducting Surveys: A Handbook for STATCOM MembersSTATCOM304Revision 1.0
Xian Xiao, Gayla R. Olbricht, & Nilupa S. GunaratnaAugust 2006
TABLE OF CONTENTS
1. Overview of Survey Procedures …..…………………………………...…….… 4 2. Initial Meeting with Clients ……………..……………………………...…….… 7
3. Sampling Issues ………………………….………………………………..……. 7
3.1 Probability Sampling3.1.1 Simple Random Sampling3.1.2 Stratified Random Sampling
3.2 Non-Probability Sampling3.3 Taking a Census3.4 Calculating the Sample Size
3.4.1 Sample Size for Proportions3.4.2 Sample Size for Means 3.4.3 Further Considerations
The purpose of this booklet is to provide an introduction to general procedures for survey projects, including an initial meeting with clients, survey design, data analysis, and report writing. Suggestions are provided on how to determine a sampling scheme, how to create items for a survey, how to choose a suitable response format for your questions, and how to determine the sample size. The suggestions offered here are rather general and may not apply to every situation. In addition to the community client, it may be helpful to have the survey reviewed by someone with expertise in the subject matter covered in the survey.
1. OVERVIEW OF SURVEY PROCEDURES
There are some general procedures that are important in a typical survey project. This document expands on several of these procedures. However, keeping the overall survey process in mind throughout the project is important, especially for setting and keeping up with a reasonable timeline. STATCOM members should make sure the client is also aware of the survey process and be realistic when setting project goals. Student consultants should leave themselves enough time to complete the analysis and prepare the final report. Since STATCOM members are working on volunteered time, they also must balance their work with academic responsibilities. Due to this fact, it is important to communicate with the client when the team will be busy with final exams, etc.
Timeline of key events in survey projects:
Initial meeting with client
o Once a client has indicated he/she would like help with a survey, it is imperative to have a meeting in person to clarify the goals of the project and determine how STATCOM can be of assistance.
o Meeting at the client’s location is recommended. This can help the STATCOM team have a better understanding of the community organization and its work environment.
Survey design
o Generally, the client will already have some questions or topics in mind that he/she would like to address on the survey.
o STATCOM will work with the client to revise questions to improve clarity and to make question formatting conducive to statistical analysis.
o Multiple meetings or emails with the client may be necessary before the survey is finalized, and this is one of the more time-consuming phases of the process. Care must be taken to allocate enough time for this phase.
Sampling scheme
o STATCOM will assist the client with determining the number of surveys to send out and an appropriate sampling scheme.
Revision 1.0 August 2006 Page 4 of 24
Sampling scheme (cont)
o The client may discuss how to obtain an appropriate sampling frame. It is important to identify a sampling frame that will cover as much of the target population as possible. In the past, the City of West Lafayette has used postal addresses of all residents as a list from which a sample can be drawn.
Writing of the cover letter
o Generally, a cover letter will be included in the survey, which will explain to the survey recipient the purpose of the survey and provide a set of instructions (including a deadline for returning the survey).
o The client should compose this cover letter with input from STATCOM.
Printing and mailing of surveys
o The client is responsible for all costs associated with distributing the surveys.
o A return address should be included so the recipient knows where to send the completed survey.
o If possible, including an envelope and a postage stamp could help improve the response rate.
o All completed surveys will be received by the client.
Printing and mailing of reminder postcards
o Reminder postcards are recommended to increase the response rate, but depend on the client’s available budget.
o An example of a reminder postcard from the West Lafayette Strategic Plan survey is given below:
A week ago, the city sent you the Strategic Plan Survey in the mail. This is your chance to voice your concerns about the services provided by the city. If you have already taken time to fill out the survey, we appreciate your input. If not, we do want to hear your opinions. Please take a few minutes to fill out the survey and hand it in by Feb 21st. Your response is much appreciated.
Developing a data entry template for the client
o STATCOM generally provides the client with a Microsoft Excel data entry template.
o This can help prevent data formatting issues that may arise if the client enters data in their own way.
Revision 1.0 August 2006 Page 5 of 24
o STATCOM members can also plan ahead for coding in statistical packages since they know how the data are formatted prior to receiving actual data.
Time for receipt of surveys
o It may take several weeks for the survey recipients to complete and return the survey.
Time for data entry
o All data entry is completed by the client.o If possible, the client should complete the data entry in duplicate. This
helps in identifying errors in data entry.
Checking of data quality and resolution of potential errors in data entry
o In order to do this, the client should number the surveys as they are received.
o Once STATCOM receives the data, statistical software should be used to check for errors in data entry (e.g., proc compare in SAS).
Data analysis and preparation of final report
o STATCOM team members work together to complete the data analysis and prepare a final report for the client.
o It may be necessary during this time to communicate with the client to clarify data and update them on the team's progress.
o In addition to the final report, it should be determined if the client would like a presentation that summarizes the survey results.
Review of report by STATCOM leaders or advisors
o Before the final report is presented to the client, it should be reviewed by a STATCOM leader and/or a faculty/staff advisor. In general, it is a good idea for at least two different people to review the report. It is important to schedule this editing time into the timeline.
o If the majority of suggestions from this review are grammatical or formatting, this process may not take long. However, if alternative or additional analyses are suggested it is important to allow time to make these kinds of changes.
o If requested, an electronic copy of the final report can be provided for the client (most clients want this).
Preparation for final meeting with client
Revision 1.0 August 2006 Page 6 of 24
o STATCOM team members should either prepare a formal presentation, if requested by the client, or thoroughly go through the final report with the client at the final meeting.
o It is important to try to ensure that the client understands the analysis and any questions that the client has should be addressed at this time.
Follow up with client
o A client satisfaction survey may be conducted by phone or mail.o This feedback will help STATCOM improve services to future clients.
2. INITIAL MEETING WITH CLIENTS
The initial meeting with clients is a time for the team members to interact with clients in person and to understand the purpose of the project. At the initial meeting, it is necessary for the team address the following issues with the client:
The objectives of the survey How the results will be used General survey procedures The target population Research methods, such as sampling methods Questionnaire design Projection duration (timeline) Final products (e.g., written report and presentation).
At the initial meeting, it should be clarified which tasks will be done by the consultants and which will be done by the client. For example, it should be made clear that the students working on the project are volunteering their time and thus a reasonable timeline should be constructed. Also, it should be emphasized that the client is entirely responsible for decision-making based on the results that consultants provide. Clients are also expected to enter their own data. STATCOM will assist clients in the survey design process, provide a data entry template, perform all analyses, and provide a final report (and/or presentation) for the client.
It is also necessary to keep in mind that the client may not be familiar with the statistical definitions of “population”, “sample”, “sampling frame”, “bias”, etc. It is important for consultants to communicate concepts and key statistical considerations in a way that is understandable to the client. Explaining your reasoning may increase the client’s understanding and awareness of statistical concepts. Clients may then be able to apply this knowledge themselves in future projects.
3. SAMPLING ISSUES
Revision 1.0 August 2006 Page 7 of 24
Surveys attempt to measure variables on a target population of interest. A population is defined as the collection of individuals for which statistical inferences will be drawn. A sample is a subset of the members in the population. Populations are typically quite large, thus it becomes impossible to measure every member of the population. Instead, a sample from the population is taken that hopefully gives an adequate representation of that population. For example, suppose a client is interested in Purdue students’ views on tuition. The population, therefore, is ALL Purdue students. However, the client may, in reality, only survey 250 Purdue students. These 250 comprise the sample. A sampling frame is a collection of members on which the sample is based. Ideally, the sampling frame includes all members of the population, but in reality, it may only contain a subset of the population. There are two general approaches to obtaining these samples.
3.1 PROBABILITY SAMPLING
In this approach, each member of the population of interest has a specified probability (greater than zero) of being in the sample. The major advantage of such an approach is the results of the survey can be used to draw inferences/conclusions about the larger population of interest. Common types of probability samples are as follows.
3.1.1 SIMPLE RANDOM SAMPLING
In this type of sample, each member of the population of interest has a known and equal chance of being included in the sample. One way of obtaining a simple random sample is by following these steps. First determine the desired sample size (N). Next, list out and number each member of the sample frame. Then generate N random numbers. Members whose numbers match the random numbers are selected as part of the sample. For example, suppose the sampling frame includes every Purdue student (which is hypothetically 35,000) and the client wants to sample 100 of them. The client would list out and number all 35,000 Purdue students. Then, he or she would generate 100 random numbers that can range from 1 to 35,000. Suppose the first two numbers selected are 25,892 and 379. The Purdue students listed by each of these numbers are selected for the sample, and so forth.
3.1.2 STRATIFIED RANDOM SAMPLING
Stratified random sampling is best defined through an example. Revisiting the previous example, suppose clients are interested in determining whether Purdue students think tuition is too high. It may be ideal to stratify the sample first before randomly choosing the members. One important determinant of tuition views likely concerns whether the student receives financial aid (loans, grants, etc.). So, the client might group the sampling frame into those receiving aid and those not receiving aid. Then, the client will select a random sample from each group. Using this randomization technique allows you to represent sub-groups of the sample. There are two types of stratified random samples:
Revision 1.0 August 2006 Page 8 of 24
a) Proportionate stratified: Suppose that three times as many Purdue students receive aid than do not receive aid. The client would likely want to have three times as many students with aid in the sample as those without aid.
b) Disproportionate stratified: In proportionate stratification, the proportion of members of a given sub-group is the same in the sample as is in the population. In a disproportionate stratified sample, this is not the case. This technique is done when the client is interested in a sub-group that has few members. For example, suppose a client is interested in surveying engineers about job satisfaction. But suppose further that the client is particularly interested in obtaining views of female engineers. In the overall population of engineers, suppose women comprise approximately 20%. So, instead of having a sample that is comprised of only 20% females (which would be proportional), the client might opt to have the women comprise 50% of the sample.
3.2 NON-PROBABILITY SAMPLING
In this technique, the probability that a given member will be included in the sample is unknown. For instance, in a convenience sample the researcher has easy access to a group of members who wish to participate. Unlike a probability sample, one cannot use inferential statistics to draw conclusions about the overall population. One can only make conclusions about the sample.
3.3 TAKING A CENSUS
If the target population is small, e.g., business owners in a specific neighborhood, a census, where the entire population of interest is surveyed, may be desirable and perhaps even easier than a probability sample.
3.4 CALCULATING THE SAMPLE SIZE
There are many ways of determining an adequate sample size for the survey. Although there are many different ways available, here we will explore two.
3.4.1 SAMPLE SIZE FOR PROPORTIONS
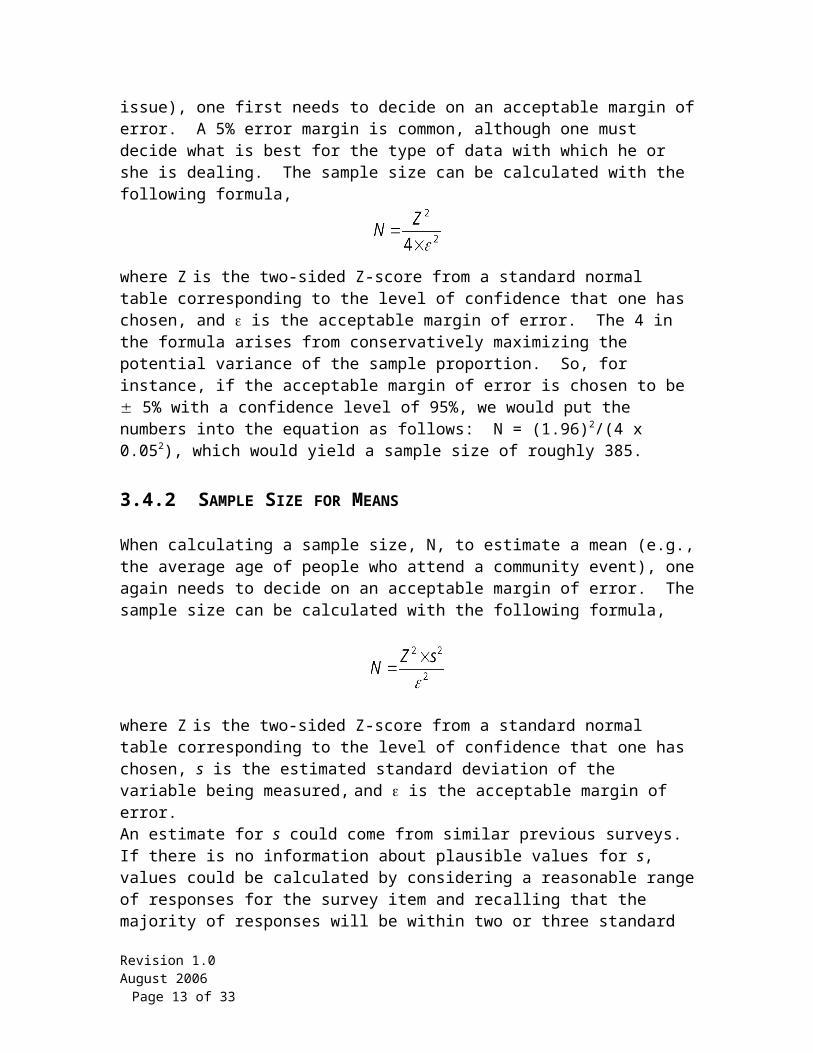
When calculating a sample size, N, to estimate a proportion (e.g., the percentage of people who vote “yes” on a certain issue), one first needs to decide on an acceptable margin of error. A 5% error margin is common, although one must decide what is best for the type of data with which he or she is dealing. The sample size can be calculated with the following formula,
Revision 1.0 August 2006 Page 9 of 24
where Z is the two-sided Z-score from a standard normal table corresponding to the level of confidence that one has chosen, and is the acceptable margin of error. The 4 in the formula arises from conservatively maximizing the potential variance of the sample proportion. So, for instance, if the acceptable margin of error is chosen to be 5% with a confidence level of 95%, we would put the numbers into the equation as follows: N = (1.96)2/(4 x 0.052), which would yield a sample size of roughly 385.
3.4.2 SAMPLE SIZE FOR MEANS
When calculating a sample size, N, to estimate a mean (e.g., the average age of people who attend a community event), one again needs to decide on an acceptable margin of error. The sample size can be calculated with the following formula,
where Z is the two-sided Z-score from a standard normal table corresponding to the level of confidence that one has chosen, s is the estimated standard deviation of the variable being measured, and is the acceptable margin of error.An estimate for s could come from similar previous surveys. If there is no information about plausible values for s, values could be calculated by considering a reasonable range of responses for the survey item and recalling that the majority of responses will be within two or three standard deviations of the mean. For example, if the ages of people attending a community event are likely to range between 20 and 60 years, and we expect about 95% of the people to fall within this age range, we may estimate s at 10 years (i.e., the span of 20 to 60 years represents four standard deviations). We then use this figure for the sample size calculation.
In this case, if an acceptable margin of error is 3 years with a confidence level of 95%, we would put the numbers into the equation as follows: N = (1.962 x 10²)/(32), which would yield a sample size of roughly 43.
3.4.3 FURTHER CONSIDERATIONS
Some important suggestions to consider when determining an adequate sample size are as follows:
a) Surveys typically consist of multiple questions, and different sample sizes may be required for different items. To be conservative, take the largest necessary sample size.
b) Not all the surveys will be returned, so the final sample size should be adjusted appropriately for the expected response rate. Just sending out a survey with no other incentives will generally give a response rate of roughly 20 or 30% of the total number sent out. The response rate of earlier surveys may also be a good indicator of the response rate. As an example, if one calculates that a sample size of 200 is
Revision 1.0 August 2006 Page 10 of 24
required but previous experience suggests there will be a 40% response rate, 500 surveys should be sent out to help ensure acceptable margins of error.
c) One should not forget the important subgroups in the sample. For example, if a sample of 400 people is needed, one may want to make sure roughly 200 of those surveyed are women, if that is a subgroup of interest. Consult a statistical reference for discussion on the different ways to allocate observations to subgroups or strata.
d) Rarely do sample sizes above 1500 make practical sense or are even needed. After about 1500, the sampling error stays much the same even at very large sample sizes.
e) If a sample size of, for example, 700 is calculated, but because of time and money constraints that is impossible, try to use a smaller sample and concentrate on getting a higher response rate.
f) Sample size and variance calculations may be adjusted if the target population is relatively small in size or if the number sampled is a significant fraction of the total population. Adjusting for the finite nature of the population will lead to a smaller necessary sample size or estimated variances. In these cases, consult a statistical reference for further discussion of finite population correction.
4. QUESTIONNAIRE DESIGN
An example of a STATCOM survey from the West Lafayette Strategic Plan project is given in Appendix 1. This survey follows the guidelines discussed below.
4.1 THE STRUCTURE OF THE QUESTIONNAIRE
Cover letter
The cover letter should be brief. Items that need to be addressed in the cover letter include:
o Who is conducting the surveyo The purpose/importance of the surveyo Instructions for completing the surveyo Individuals are randomly selectedo Whether individuals’ responses are anonymous or at least confidentialo Deadline for returning completed surveyso A “thank you” note for completing the surveyo For mail surveys, a return address should be includedo If possible, a return envelope and a postage stamp could be provided
Revision 1.0 August 2006 Page 11 of 24
o An official logo of the client organization included on the cover letter and/or survey may help increase the response rate by making the survey look more "official"
o An example from the West Lafayette Strategic Plan project:
You have been selected by the City of West Lafayette to participate in a survey of residents regarding services offered by the City of West Lafayette. The results of this survey will be used to determine potential areas of improvement and expansion in city services. Please fill out this survey by circling your responses in the right hand column, and return the survey in the enclosed envelope by February 18, 2005. Your responses will be anonymous and confidential. Your participation is greatly appreciated.
Content of questions
o Demographics / Descriptive
Demographics are the characteristics of the population. Assuming population characteristics are known, we are able to test whether or not the collected sample is a good representative of the population. Also, it may be useful to see if certain questions vary by these characteristics.
o Topics of interests
o Comments written by respondent
Asking the respondents for opinions on issues related to the survey A report may include a note about care in the use of respondents’
comments in decision-making. Below is an example from the West Lafayette Strategic Plan Survey report:
At the conclusion of the survey, residents were asked for “Comments and suggestions on how we can improve our city.” This question was designed specifically to identify areas that may be in need of improvement. The comments are listed in their entirety in Appendix 2, where they are sorted into common categories. When reading the comments, please take note that since respondents are identifying potential areas of improvement, these comments will tend to be negative. Because they are open-ended remarks, they cannot be thoroughly analyzed statistically. Also, even though there are 387 comments, only a few of them refer to one particular question. Furthermore, given the negative attitude of most of these comments, keep in mind that they do not represent the entire sample, which, as we have seen above, tends to respond positively on average (i.e., between neutral and agree).
o General notes
Revision 1.0 August 2006 Page 12 of 24
A shorter survey is desirable because survey recipients would be more likely to respond and the client will have lower printing and postage costs.
It may be possible to modify the format of the survey to facilitate more rapid data entry.
Clients generally have a list of questions/topics they would like to address. It is best for the client to provide a draft of the questionnaire with these questions and STATCOM can then work to modify questions based on the principles below.
4.2 ITEM GENERATION
In order to create a useful survey, the items (questions) on that survey should be carefully constructed. Here are some guidelines to think about when generating items.
4.2.1 SIMPLICITY
Question wording and response format should be straightforward and clear. One way that the researcher can ensure simplicity is to avoid double-barreled questions. An example of a double-barreled question is: “Do you believe that Al Gore is a competent and charismatic leader?” This question is double-barreled because of the use of the word ‘and.’ A respondent might think that Al Gore is competent without thinking he is also charismatic. This would make it difficult for the respondent to answer the question. The survey researcher should use two questions instead of one: “Do you believe Al Gore is a competent leader?” and “Do you believe Al Gore is a charismatic leader?”
4.2.2 CLARITY
Items should be clear enough so that all respondents interpret the question in the same manner. It is not desirable for one respondent to interpret the question in a completely different manner than another respondent. Try to avoid vagueness in the items. For instance, do not use a question like: “How happy are you with your life?” This could be interpreted as asking about one’s social life, work life or spiritual life. The question should be worded in a more specific manner. Also, to ensure clarity, one should use language and vocabulary that is understandable by your respondents. Any technical jargon that may not be understood by the respondent should be avoided.
4.2.3 BIASED LANGUAGE
There are many ways in which a question might steer respondents toward a certain answer. These should be avoided as much as possible. For instance, do not use questions
Revision 1.0 August 2006 Page 13 of 24
that imply that certain answers are more desirable or accurate (“leading questions”). An extreme example is, “Purdue is a wonderful school, don’t you agree?” It is clear that the researcher believes that Purdue is wonderful and wants the respondent to believe so as well. Another way one can avoid bias is to use emotionally neutral wording. Finally, underlining, italicizing, or boldfacing items may bias responses. “Do you believe that the President has made significant contributions to US-China relations?” By underlining the word ‘significant’ it is implied that the President has not made significant contributions in this area.
4.2.4 ORDER OF ITEMS (NON-SCALED)
Items should be in a ‘logical order.’ For example, when asking about one’s employment history, the questions should be in order from most to least recent. Also, sensitive or highly personal questions are better placed at the end of the survey because:
If respondents become upset/offended by the question, the researcher still has their responses on all previous items.
By answering previous questions, the respondent has already invested time in the survey. This may make the respondent more willing to answer such personal or sensitive questions.
An upsetting item near the beginning may alter the mood of the respondents, biasing their later answers.
4.2.5 DESCRIPTIVE QUESTIONS
Often, descriptive statistics of the respondents are of interest to the client. Obtaining means, standard deviations and ranges is often sufficient for their purposes. It is sometimes useful to examine and compare descriptive statistics for subgroups of interest. Consider the following question:
On average, how many hours per day do you spend watching television or movies?(a) 0 (b) 0.5 - 1 (c) 1.5 – 2 (d) 2.5 – 3 (e) more than 3
It may be interesting to break the respondents down into groups by gender, level of education or time spent in the office.
Since potentially every demographic question could be coupled with other survey questions, it is important to identify which relationships the client is interested in knowing. While some items may lead to important insight into the survey issues, others may not be relevant for the client’s objectives. Determining which relationships are most relevant for the client is important to decide before starting the analysis. This will help save time and eliminate irrelevant results. More analyses can always be done at a later time if additional items become of interest.
5. RESPONSE FORMAT
Revision 1.0 August 2006 Page 14 of 24
There are two major types of response format options: open- and closed-ended. The advantages and disadvantages of using each will be discussed below.
Note: Whenever possible, open-ended questions are avoided. This is done in order to minimize subjectivity in the analysis. Furthermore, responses made on a numerical scale (Likert Scale) are more informative than “yes or no” answers.
5.1 OPEN-ENDED QUESTIONS
Open-ended questions allow the respondent to give information using their own words. They provide a way to assess information that cannot be easily obtained via close-ended questions, where the respondent must choose one answer from a list of choices. No set response options are provided with open-ended questions.
Advantages include:
(1) Obtaining more detailed and elaborate information than can be found in a close-ended question (that is, breadth of the answer is not limited)
(2) Not forcing respondents to choose from only those responses provided in the survey (3) Using open-ended questions during a pilot phase can provide material for later close-ended questions.
Disadvantages include:
(1) Responses to open-ended questions require a level of communication skills on the part of the respondent above those needed to answer close-ended items(2) Respondents might provide irrelevant, redundant, or incoherent responses (3) Data input and analysis can be very time consuming.
To do any kind of statistical analysis, a coding scheme will need to be developed for which responses can be scored. At least two individuals will need to code all responses so that there is a check on agreement. These individuals must be trained on the coding scheme. Finally, inter-rater reliability needs to be assessed.
5.2 CLOSE-ENDED QUESTIONS
For a close-ended question, the researcher provides a set of response options and the respondents must choose the answer that best represents their view.
Advantages include:
(1) Consistent response options across respondents make data input, statistical analysis and comparisons quick and easy
Revision 1.0 August 2006 Page 15 of 24
(2) Fixed response categories or a fixed scale may facilitate interpretation of the question (i.e., if the question itself is a bit ambiguous, its meaning may become clearer once the respondent reads the response options)(3) Close-ended questions can typically be completed faster than open-ended questions.
Disadvantages include:
(1) If none of the options matches the respondent’s ‘true’ answer, he or she may randomly choose a meaningless response, which may increase error(2) Idiosyncratic characteristics of respondent’s answers may not be apparent when respondents are forced to choose among a forced set of options.
5.3 FORMS OF CLOSE-ENDED QUESTIONS
The two major types of close-ended questions are multiple choice and scaled questions.
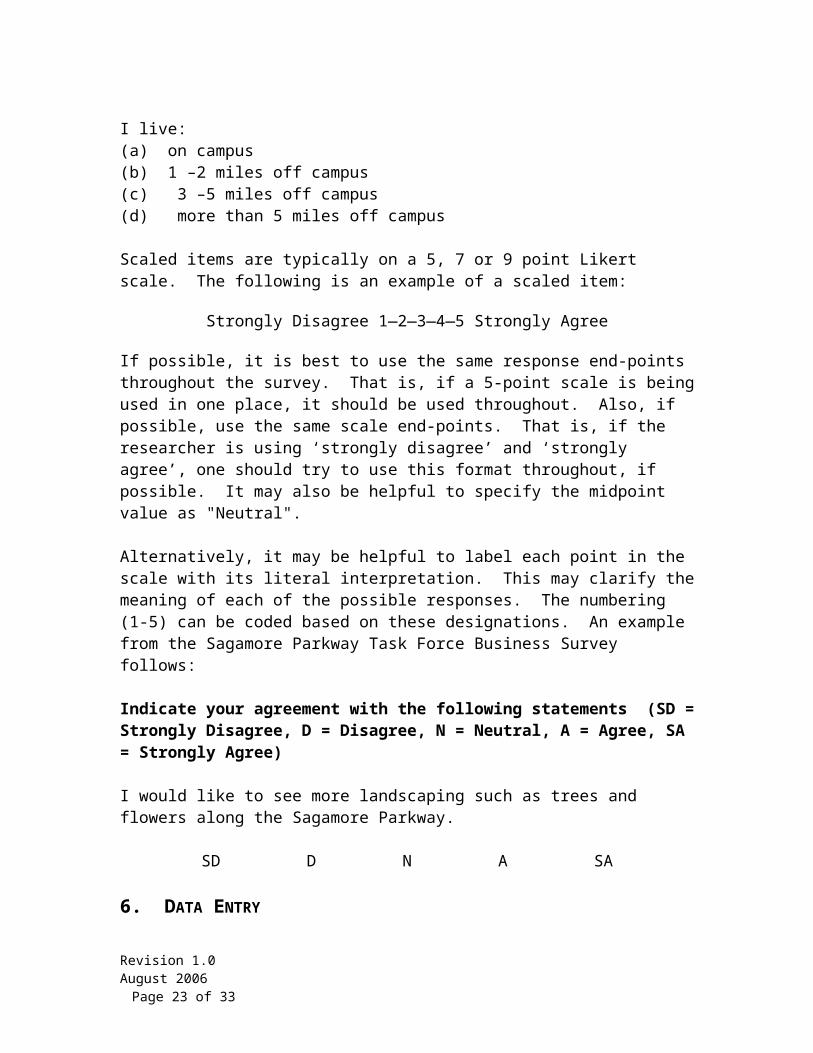
In a multiple choice question, the respondent is given a few response options from which he or she must select the answer that most reflects his or her view. For example,
I live: (a) on campus (b) 1 –2 miles off campus (c) 3 –5 miles off campus (d) more than 5 miles off campus
Scaled items are typically on a 5, 7 or 9 point Likert scale. The following is an example of a scaled item:
Strongly Disagree 1—2—3—4—5 Strongly Agree
If possible, it is best to use the same response end-points throughout the survey. That is, if a 5-point scale is being used in one place, it should be used throughout. Also, if possible, use the same scale end-points. That is, if the researcher is using ‘strongly disagree’ and ‘strongly agree’, one should try to use this format throughout, if possible. It may also be helpful to specify the midpoint value as "Neutral".
Alternatively, it may be helpful to label each point in the scale with its literal interpretation. This may clarify the meaning of each of the possible responses. The numbering (1-5) can be coded based on these designations. An example from the Sagamore Parkway Task Force Business Survey follows:
Indicate your agreement with the following statements (SD = Strongly Disagree, D = Disagree, N = Neutral, A = Agree, SA = Strongly Agree)
I would like to see more landscaping such as trees and flowers along the Sagamore Parkway.
Revision 1.0 August 2006 Page 16 of 24
SD D N A SA
6. DATA ENTRY
STATCOM provides a Microsoft Excel data entry sheet for clients. Examples of past templates are available upon request. Clients have the responsibility of entering the data and, if possible, we recommend this be done in duplicate. The formatting for these two entries should be kept consistent. Examples of how to maintain such consistency are given below:
Using lower case letters to enter the data, such as “a, b, c” or “sa, a, n, d, sd” Using consistent abbreviations
o nk=don’t knowo na=not applicableo . = missing value (this may be software dependent)
7. PLOTTING AND SUMMARIZING THE DATA
In general, we want to summarize the survey results in a table, visualize them in a graph, and discuss them in sentence form. The examples below demonstrate some of the tables and graphs that STATCOM has used in past reports. Different tables/graphs may be appropriate in different situations and the student consultants should use their best judgment to create displays which will give an easy and accurate interpretation of the results for the client. Note that different software may work better for different tasks. It is more important to utilize the software best suited for each specific task rather than to resolve to use one software for all of the analysis. Three different software are used in the examples given in the following sections.
7.1 TABLES
The percent of each response is described as an integer (no decimal). The average response and the standard deviation are input in the table as a number
with two decimals when appropriate. An example of a table follows:
7.2 HISTOGRAMS
Histograms should be in grayscale or should use distinguishing patterns that are readily differentiated if the report will be printed in black and white.
Revision 1.0 August 2006 Page 17 of 24
A brief description and question number are needed for each variable. An example of a histogram created in Microsoft Excel from the Village Parking
Study Residents’ Survey:
How likely are you to use the following modes of transportation to the campus area?
The error bar plot displays the average response of each question and a 95% confidence interval. A 95% confidence interval provides a range of possible values for the average response; that is, if we were to conduct a survey repeatedly and calculate a confidence interval each time, then we would expect 95% of these confidence intervals to contain the true average response of the target population. If the target population is small compared to the sample size, the width of the confidence interval may be adjusted with a finite population correction. The bubble plot provides a visual representation of the frequency of responses; the bigger the bubble, the higher the percent of people who chose that particular response to a question. These bubble plots can be made in software such as SAS or R. An example from the Sagamore Parkway Task Force Resident Survey is given below:
Revision 1.0 August 2006 Page 18 of 24
General procedure of obtaining error bar plot in SPSS 12.0 for Windows: Select ‘Graphs’, ‘Error Bar’ Select ‘Simple’, ‘Summaries of Separate Variables’ Click the ‘Define’ option Select the variable(s) into ‘Error Bars’ window Click ‘OK’ Double click the graph in SPSS output Select ‘Options’, ‘Transpose Chart’.
8. REPORT WRITING
There are several things to keep in mind when preparing a final report for the client. Examples of past reports can be provided upon request.
8.1 THINGS TO CONSIDER WHEN WRITING A REPORT
Present results in a concise way that will be easy for the reader to understand. Always keep in mind the audience for the report and be sure to include anything the
client specifically requests. Describe the project to give a context for analysis and end with a summary of the
analysis that has been completed. Do not attempt to make recommendations about decision-making for the client. The
report is meant to provide the client with statistically sound results that the client themselves can decide how to use.
For most analyses, results can be displayed in the form of a table, a graph, and a written summary. While graphical summaries are nice, it is important not to neglect the written summary. This may help the client better understand the results.
Revision 1.0 August 2006 Page 19 of 24
Label graphs and tables with clear explanations so that the client could possibly understand the results by looking at the graph alone.
Attach the survey to the report and include the actual questions in the body of the report when presenting results.
Avoid statistical jargon, opting instead for a general explanation of analyses rather than a technical one.
Separate out the report into logical sections and provide a table of contents if appropriate.
Use a word processor to check for spelling mistakes. Ask someone else to review the report before presenting it to a client (a STATCOM
leader will do this). Leave all numbering of figures, sections, etc. and spacing formats to the final stage.
These may change along the way and it is easier to include them and check everything at the end, once all edits have been made.
8.2 REPORT ORGANIZATION
8.2.1 COVER PAGE
A cover page should include the following items:
Title of report Date final report is given to client Prepared by Statistics in the Community (STATCOM) List of STATCOM team members working on the project
8.2.2 TABLE OF CONTENTS
If the report is long and can be naturally broken into sections, a table of contents may be a helpful reference for clients to find sections of interest.
8.2.3 INTRODUCTION
The introduction is a place for describing survey objectives, dates of initial contact with client and other key events (surveys sent out, last date completed surveys were received, etc.). The following is an example of an introduction from the Village Parking Study Merchants' Survey:
Statistics in the Community (STATCOM) is a community outreach organization of graduate students within the Department of Statistics at Purdue University. It provides free statistical consulting services to governmental and nonprofit groups in and around West Lafayette, Indiana. In June 2005, STATCOM was asked by the West Lafayette City Engineer’s Office to help implement a set of surveys assessing the parking needs in the Village, as defined by the map in Appendix 2. The surveys will be utilized to determine the opinions of merchants and patrons of the Village area.
Revision 1.0 August 2006 Page 20 of 24
More detailed information about the survey implementation, population information, and data analysis procedures can also be included in the introduction. A description of each section in the report could also be mentioned here.
8.2.4 CHARACTERISTICS OF RESPONDENTS
This should state information on the sample, response rate, and the summary (tables and figures) of characteristics of respondents which were measured by the demographic questions on the survey.
While a high response rate is desired, it is not always achieved. Some things to do to boost response rates are sending follow-up postcards reminding the respondents to return their surveys, sending a good but brief cover letter explaining the importance of the survey, providing a postage stamp on the return envelopes, and offering monetary or gift incentives for returning the survey. Among other things, the cover letter should definitely address aspects such as confidentiality, deadlines, contact information if the respondent has questions, and the purpose of the study. If the respondent knows this information, as well as why he or she was chosen to participate, he or she will be much more likely to return the survey.
Regardless of the actual response rate, one concern is whether nonresponse is random. If so, even surveys with a low response rate can yield results that are generalizable to the target population. However, studying the characteristics of nonrespondents may help to determine if there are any patterns which may affect the survey results.
8.2.5 RESULTS
Although data collected through a survey are not considered experimental, most of the same statistical tests performed on experimental data can be used to analyze survey data.Chi-square tests, t-tests, ANOVA and regression can all be used on survey data. ANOVA tables may or may not be necessary. Think hard about what you need and try to keep it simple.
8.2.6 COMMENTS
Generally, an entire list of the written comments from the questionnaire is provided in the appendix for the client to see. In addition, a classification of the comments into general recurring categories may be possible. It is important keep in mind that the comments cannot be statistically analyzed and may be difficult to interpret. In general, many comments tend to be negative, so it is important not to focus too much attention on just a few strong statements. However, the comments can be useful in designing future surveys as they may bring up questions that had not been asked on the current survey. Remember to consider the cost and time required to collect new data should you think about recommending this.
Revision 1.0 August 2006 Page 21 of 24
8.2.7 CONCLUSION
Providing the client with a one page summary of key findings listed in bullet form is extremely beneficial. This will allow the client to see a quick overview of the results.
8.2.8 APPENDIX
Questionnaire/survey Comments in their entirety
9. USEFUL REFERENCES
Sections 3, 4.2, and 5 were adapted from the following guide:
Claypool, H. and Wassel, C. (2002). Issues in Survey Design: A Handbook for Clients. Developed for the Statistical Consulting Service at Purdue University.
Sampling reference:
Lohr, S.L. (1999). Sampling: Design and Analysis. Pacific Grove, CA: Duxbury Press.