33
Survey Design Dr. Victoria Mitchell October 29,
| Date post: | 18-Dec-2015 |
| Category: |
Documents |
| View: | 216 times |
| Download: | 1 times |

Survey Design
Dr. Victoria Mitchell
October 29, 2007

Survey Construction
Start with a cover letter – even for online surveys
Divide the questionnaire into 4 parts…
Initiation: sets the stage and respondent’s expectation Body: group like items together by topic or scale type Conclusion: put threatening/sensitive questions here Demographics: put at the end as it is least important

Design the Survey Questions
Keep it simple!!!! Focus – each item should address just one issue. Keep each item brief. Be clear about what you are asking. Use the same words as the least sophisticated
respondent. Use simple sentences Use structured questions as much as possible. Use appropriate scales.

Validity & Reliability Construct Validity: survey’s ability to measure what its suppose to.
PCA, factor analysis, structural equation modeling
Reliability: repeatable, survey’s ability to get the same data values from several similar measures. Cronbach’s alpha, inter-item reliability
Validity and reliability are compromised by Sampling error
Small sample size (min 30, or 5-10 responses per survey item)
Inappropriate subsample of the population (cows and donkeys)
Sampling bias Shy field worker attempts to measure satisfaction Only approaches people who smile or look happy

Reliability/Validity Map
RELIABILITY
VALIDITY
High
High
Low
Low
.. .. .. ... . . .
. . . .
.... ....
.. .. . . . .

Types of Measurement Scales
Multiple Response Likert scale (5-7 scale choices) Verbal frequency scale Ordinal scale Forced ranking scale Paired comparison scale Comparative scale Checklist

Multiple Response Please check any type of newspaper you
regularly read for business news.Local, morning paperLocal, evening paperLocal, weekly paperRegional, weekly paperNational, daily paperNational, weekly paperOther, (what kind?) ___________________
Common, simple, versatile measurement scale.

Likert Scale
Please pick a number from the scale below to show how much you agree or disagree with each statement and jot it in the space to the left of each item.
Scale
1 = strongly agree
2 = agree
3 = neutral
4 = disagree
5 = strongly disagree
__ I’m tall for my age.
__ I’m hungry.
__ Orange is my favorite colour.
__ The elephant is purple.
__ Leftovers are delicious.
__ My credit card is maxed out.
__ Moose look like elk.
Used to measure degree of agreement. Easy to code.

Verbal Frequency Scale
Please pick a number from the scale to show how often you do each of the things listed below and jot in the space to the left of the item.
Scale1 = always2 = often3 = sometimes4 = seldom5 = never
__ Seek out information about candidates before voting.
__ Vote along party lines.
__ Contribute money to a local political campaign.
__ Contribute money to a national political campaign.
__ Volunteer to work on a local campaign.
__ Volunteer to work on a national campaign.
Used to measure how often an action is taken for several items.

The Ordinal Scale
Ordinarily, when do you turn on a television set in your home on a weekday? (Please check only one).
(1) __ The first thing in the morning
(2) __ A little while after awakening
(3) __ Mid-morning
(4) __ Just before lunch
(5) __ Right after lunch
(6) __ Mid-afternoon
(7) __ Early evening, before dinner
(8) __ Right after dinner
(9) __ Late evening
(10) __ Usually don’t turn it on
Use when a quantity or value is not sufficient information.

Forced Ranking Scale
Please rank the colas listed below in their order of preference. Jot the number 1 next to the one you prefer most, number 2 by your second choice, and so forth.
__ Pepsi-Cola
__ Coca-Cola
__ Royal Crown Cola
__ Generic Cola
Used for relative comparison. Number of items to rank should be less than 10.

Paired Comparison Scale
For each pair of soft drinks listed below, please put a check mark by the one you most prefer, if you had to choose between the two.
(1) __ Pepsi-Cola
(2) __ Coca-Cola
(1) __ Royal Crown Cola
(2) __ Pepsi-Cola
(1) __ Royal Crown Cola
(2) __ Like Cola
(1) __ Royal Crown Cola
(2) __ Coca-Cola
(1) __ Royal Crown Cola
(2) __ Pepsi-Cola
__ Royal Crown Cola __ Like Cola
Used to capture simple choice between pairs.
Use an even number of alternatives.

The Comparative Scale
Compared to the previous rock band, the one currently playing is… (check one space).
Outstanding Equal Terrible
_____ _____ _____ _____ _____
Used to compare an object with one or more other objects.
Use an even number of alternatives to avoid “fence-riding.”

The Checklist
Please put a check mark in the space in front of any word or phrase that describes your job.
__ Easy __ Technical __ Boring
__ Interesting __ Low-paying __ Strenuous
__ Routine __ Dead-end __ Changing
__ Important __ Demanding __ Temporary
__ Safe __ Exhausting __ Difficult
__ Rewarding __ Secure __ Slow-paced
__ Enjoyable __ Rigid __ Pleasant
__ Satisfying __ Degrading __ Risky
Used to describe a topic. Provides a profile.

Instrument Validation
Pre-testing for Content Validity - Delphi Panel - Sorting Procedure - Expert Feedback
Pilot Survey – layout and reliability - Survey structure validated - Cronbach’s alpha for reliability
Final Field Test –construct validity - Distribute Surveys - Correlation analysis - Factor analysis, PCA, SEM - Cronbach’s alpha for reliability


Conceptual Model: IT-enabled Process Redesign
Business Process Rework
IT PlatformRework
Timing: Technology
Position
Administration: Planning Approach
Intended Design
DesignUncertainty
Implementation Success
Engineering: Process Redesign
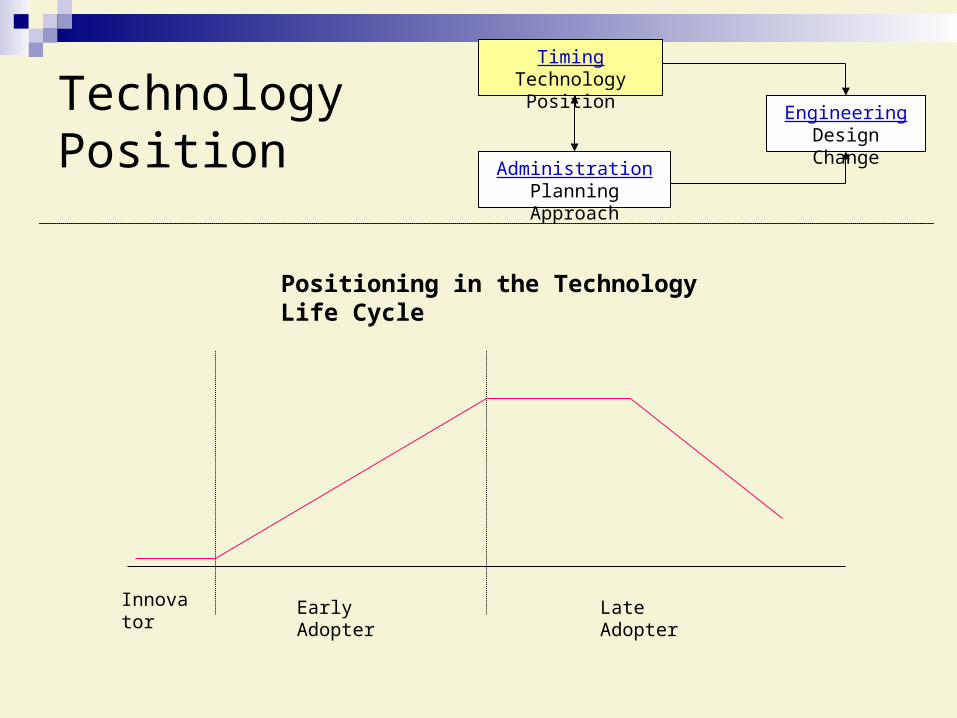
TimingTechnology Position
AdministrationPlanning Approach
EngineeringDesign Change
Technology Position
Innovator Early Adopter Late Adopter
Positioning in the Technology Life Cycle

Comprehensive Planning Adaptive Planning
TimingTechnology Position
AdministrationPlanning Approach
EngineeringDesign Change
Planning School Incremental School
Integrated Nonintegrated
Formal Informal
Deliberate Emergent
Proactive Reactive
Rational Bounded rationality
Synoptic Feedback driven adjustments
Early goal formation Continuous goal formation
Planning Approach

TimingTechnology Position
AdministrationPlanning Approach
EngineeringDesign Change
Design Change
Incremental
Design Change
Architectural
Design Change
Modular
Design Change
Radical
Design Change
Change in Components
Change
in
Linkages
Minor
Minor
Major
Major
Design Changes adapted from Henderson and Clark (1990).

Timng Decision
Technology Position: - First Mover - Early adopter - Late adopter
Administrative Decision
Planning Approach: - Comprehensive - Adaptive
Engineering OutcomeDesign Change: - Incremental - Modular - Architectural - Radical
Research Question: How Does Technology Position and Planning Approach Affect Design Change?

Planning Timing
AdaptivePlanning
Comprehensive
Planning
First Mover
Architectural
& RadicalDesign Change
Incremental& Modular
Design Change
Early adopter
Incremental& Modular
Design Change
Incremental& Modular
Design Change
Late adopter
Incremental& Modular
Design Change
Architectural
& RadicalDesign Change
Hypothesized Relationships
TimingTechnology Position
AdministrationPlanning Approach
EngineeringDesign Change
H1: First movers will experience less design change with comprehensive planning.
H2: Late adopters will experience less design change with adaptive planning.
H3: Early adopters will experience less design change with a mixed planning approach.

Measurement:Structured and Open-ended Questions
Phone Interview with Project Managers
What is the most recent redesign project you’ve implemented (project name)?What were the project’s goals?Describe the process before the redesign project was implemented.Describe the intended business process.Describe the final business process (if it differs from the intended process).When did this project start?What was the initial scheduled completion date?What was the actual completion date?What was the most critical IT-related delay experienced?How long did this delay the project? Was this delay anticipated? (why or why not)

Measurement:Project Manager Survey – Likert Scales
Instruction:Using the scale provided, please indicate the extent to which you agree or disagree with the following statements as they pertain to the redesign project.
M1. The process was redesigned in anticipation of future industry trends...................M2. The process was redesigned to create a competitive advantage............................M3. The redesigned process is a de facto industry standard.........................................M4. The redesigned process is unique, no one else is using it……………………….M5. This design was adopted because of its proven usefulness in the industry……..M6. The redesigned process is a major departure from previous operations…………M7. The redesigned process is similar to process designs used in other areas of our organization*………………………………………………………………..
1 2 3 4 5 6 7 1 2 3 4 5 6 7 1 2 3 4 5 6 7 1 2 3 4 5 6 7 1 2 3 4 5 6 7 1 2 3 4 5 6 7 1 2 3 4 5 6 7
*Due to its low factor loading, item M7 was culled from the pilot survey.
Strongly StronglyDisagree Agree AgreeMarket Position Items

Measurement:IT Manager Survey – Likert Scales
Project Name:
Using the scale provided, please indicate the extent to which you agree or disagree with the following statements as they pertain to the redesign project.
P1. Our organization has a formal ITplan………….……………………………P2. The business unit had a formal redesign plan…………………..……………P3. Business unit personnel were involved in IT planning………………………P4. IT personnel were involved in redesign planning……...…….………………P5. Redesign goals were clear to IT personnel prior to process implementation…P6. The information and IT needs of the redesign project were considered when formulating the IT plan..........…………………...............................................P7. An assessment of IT capabilities and limitations was used in redesign planningP8. Alterations to the IT platform were made as a specific project need arose……P9. Alterations to the IT platform were anticipated prior to process implementation
1 2 3 4 5 6 7 1 2 3 4 5 6 7 1 2 3 4 5 6 7 1 2 3 4 5 6 7 1 2 3 4 5 6 7
1 2 3 4 5 6 7 1 2 3 4 5 6 7 1 2 3 4 5 6 7 1 2 3 4 5 6 7
Strongly StronglyDisagree Agree AgreePlanning Mode Items

Measurement:Project Manager Survey - Guttman Scale
Please indicate the response that best describes the extent to which the initial e-process design was changed to facilitate project completion.
Business Process Design Change
A. Minor changes were required to the initial redesigned process. New task skills or additional training to handle material and information flows were generally not required.
B. Major changes were required in one or more of the tasks embedded in the initial redesigned process, however the flow of materials or information was not altered. New skills were required to accomplish the modified tasks.
C. Major changes were required in the flow of materials or information through the initial redesigned process, however the tasks embedded in the intended design were not altered. Employees had to be educated regarding the new process flows.
D. Major changes were required in both the tasks embedded in the redesigned process and associated flows of material or information. New skills were required to accomplish the modified tasks and employees had to be educated regarding new process flows.

Measurement: IT Manager Survey – Guttman Scale
Please indicate the response that best describes the extent to which the IT platform was changed to facilitate project completion.
IT Platform Design Change
A. Minor changes were required in the IT platform; new skills or additional training on the part of information systems personnel were not required.
B. Major changes were required in the components of the IT platform (hardware, software, data) without changing the platform’s basic configuration. Components were changed in such a way that new knowledge was required on the part of information systems personnel to implement the change.
C. Major changes were required in the IT platform’s configuration without significantly altering the components themselves. New skills and policies were needed to implement the change.
D. Major changes were required in one or more of the components making up the IT platform as well as the relationships among components that altered the network’s basic configuration.

Correlation Matrix: Technology Position
Items TP1 TP2 TP3 TP4 TP5 TP6
TP1 1.000
TP2 0.899 1.000
TP3 0.601 0.520 1.000
TP4 0.408 0.410 0.668 1.000
TP5 0.502 0.458 0.830 0.866 1.000
TP6 0.338 0.404 0.628 0.967 0.837 1.000

Correlation Matrix: Planning Approach
Items PM1 PM2 PM3 PM4 PM5 PM6 PM7 PM8 PM9
PM1 1.000
PM2 0.821 1.000
PM3 0.714 0.603 1.000
PM4 0.755 0.669 0.734 1.000
PM5 0.760 0.655 0.756 0.779 1.000
PM6 0.707 0.617 0.732 0.643 0.769 1.000
PM7 0.836 0.740 0.785 0.830 0.891 0.747 1.000
PM8 0.666 0.557 0.705 0.628 0.772 0.950 0.743 1.000
PM9 0.648 0.589 0.635 0.823 0.732 0.626 0.756 0.589 1.000

Principle Components Analysis: Construct Validity (convergent & discriminant)
0.9140.8850.8660.8370.7200.683
-0.114-0.115-0.108-0.187-0.009-0.145
Design was adopted because of its proven usefulness.Redesigned process is unique, no one else is using it.Redesigned process is a major departure from operations.Redesigned process is a de facto industry standard.Process redesigned anticipating future industry trends.Process was redesigned to create a competitive advantage.
-0.174-0.006-0.193-0.006-0.232-0.007-0.003-0.242-0.180
0.8700.8010.8340.8820.8390.9130.9490.8150.800
Company has a redesign plan.Company has an IT plan.Business unit personnel involved in IT planning.IT personnel involved in business unit planning.SBU IT/information needs considered in IT planning.Redesign goals clear to IT personnel.Redesign planners assessed IT capabilities/limitations.IT alterations made as a specific project need arose.IT alterations anticipated before redesign implemented.
Factor 1Timing
Factor 2Planning Item Content

Technology Position
-1.2658 First
Mover
0.0105Early
adopter
1.1002Late
adopterF= 498.805
(0.000)
Planning Approach
-1.0990Adaptive
0.6980Comprehen-
sive
F= 406.272(0.000)
Cluster Means ANOVA
Cluster Analysis forGroup Membership

Planning
Timing
AdaptivePlanning
ComprehensivePlanning
Total
Percentage
First MoverEarly adopterLate adopter
121619
242822
364441
34%36%30%
Total
47
74
121
100%
Percentage 39% 61% 100%
Projects by Timing and Planning Approach

Data is ready for Hypothesis Testing!


