67
Survey Methods for Health Services Research: Theory & Application Lusine Abrahamyan MD MPH PhD CCHE Seminar Series, October 2017 1

Survey Methods for Health Services Research: Theory & Application
Lusine Abrahamyan MD MPH PhD
CCHE Seminar Series, October 2017
1

2
How many of you were happy with the TTC service today morning?
Who thinks this summer was not very warm?
On a scale from 1 to 5 how would you rate the service from your primary care provider with 1 being not satisfied and 5 being extremely satisfied?
Please show of hands:

Outline Part I
Survey as a health service research method
Study designs & surveys
Survey sampling strategies Survey errors
Survey modes/techniques
Part II (preliminary)
Design and implementation of survey tools
Survey planning and monitoring
Analyzing survey data
Examples of surveys Public surveys
Patient surveys
3

Defining Survey as a Research Method
A survey is a systematic method of collecting data from a population of interest.
Information is gathered by asking individuals questions, using structured and standardized questionnaire.
Surveys are quantitative in nature.
Surveys aim to collect information from a sample population that is representative of the overall population, within a certain degree of error.
4

Why Survey?
Evaluate population knowledge, beliefs, attitudes about … Evaluate healthcare services, processes of care, outcomes Evaluate client/patient satisfaction, etc…
5
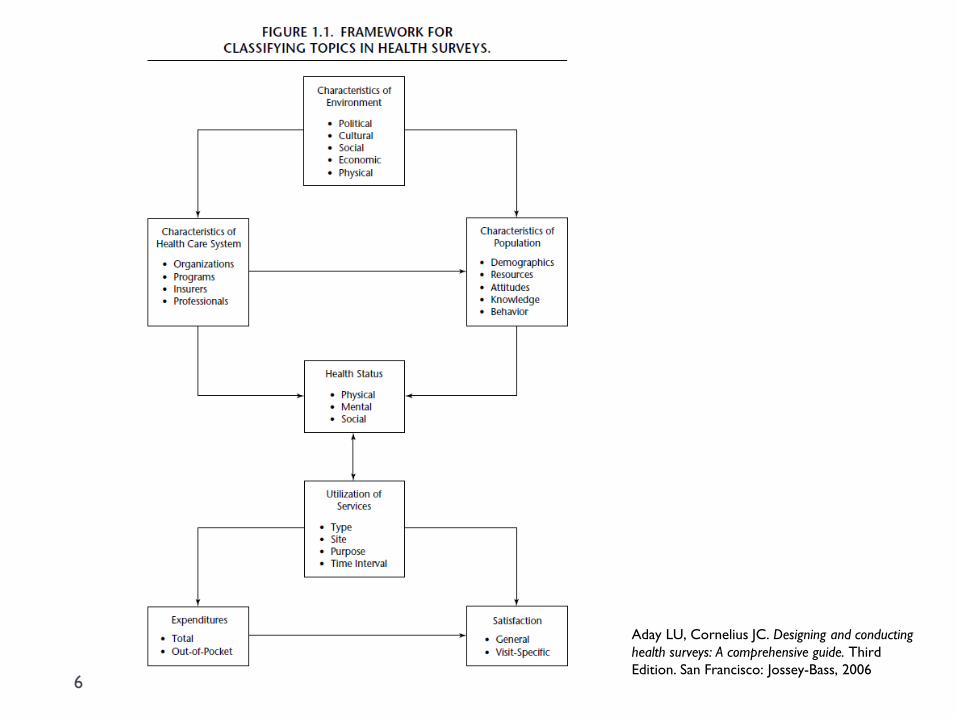
6
Aday LU, Cornelius JC. Designing and conducting health surveys: A comprehensive guide. Third Edition. San Francisco: Jossey-Bass, 2006

Advantages of Surveys
Collect a lot of information from a large group of stakeholders, within a short period of time, and over a wide geographical area
Data collection is standardized and can be conducted in several ways Phone, in-person, mail, email/web
If sampled appropriately, can represent the total population
Quantitative data more straightforward to analyze than qualitative
May analyze relationships between variables to explain study findings
7

Disadvantages of Surveys
Difficult to gather in-depth information on perspectives & experiences Qualitative studies are preferred in such cases
Can become expensive and time consuming if intends to cover large population
May require higher level statistical skills depending on the level of complexity of the design e.g., cluster designs, multi-level modelling
8

Framework for Conducting a Survey
Clarify the Purpose Why survey? Who are the stakeholders? Who is the population of interest? What are the research questions and hypothesis?
Assess Resources What resources will you need?
Decide on Methods Which method is the most appropriate given the purpose and constrains? Mail/email/phone???
Write Questionnaire What questions need to be asked? What response formats should be used? What should be be overall layout of the questionnaire?
Pilot test/Revise Questionnaire
Prepare Sample What is the size of the target population? What sampling frame should be used?
Train Interviewers
Collect Data
Process Data What methods should be used for data coding, data entry and cleaning?
Analyze the Results
Interpret & Disseminate Results How to disseminate findings among knowledge users?
Take Action What policy changes should be made after the survey?
9

Clarifying Purpose of the Survey Why have you chosen to conduct a survey? E.g., evaluate peoples’ perceptions, opinions, knowledge, attitudes,
behaviors, exposures to risk factors, experiences of care, needs Is there any alternative way to obtain this information?
Who are the stakeholders? People who will be interested in the results of the survey and
who will take actions based on the results Engage them early to clarify what issues need to be explored
What resources you can rely on? People (internal and external), money, time
10

PICO Framework for Research Questions
11
P Patient, Population, or Problem What specific patient population are you interested in and what are their important characteristics? (e.g., disease/health status, complains, age, sex, medications, etc)
I Intervention, Prognostic Factor, or Exposure
What is your investigational intervention? (e.g., a specific diagnostic test, treatment, prophylaxis, risk behavior, prognostic factor)
C Comparison (if there is a control group)
What is the main alternative to compare with the intervention?
O Outcome of interest What do you intend to accomplish, measure, improve or affect? (e.g., specific symptoms, functional outcomes, disease incidence, rate of complications, knowledge)
T Time How long it will take to demonstrate an outcome?
S* Study design What would be the best study design/methodology? (e.g., case-control, cohort, RCT, cross-sectional)
What type of question are you asking? Diagnosis, Etiology/Harm, Therapy, Prognosis, Prevention
*When the framework is used for systematic reviews (PICOS).

Study Designs & Surveys
12
Study Designs & Surveys
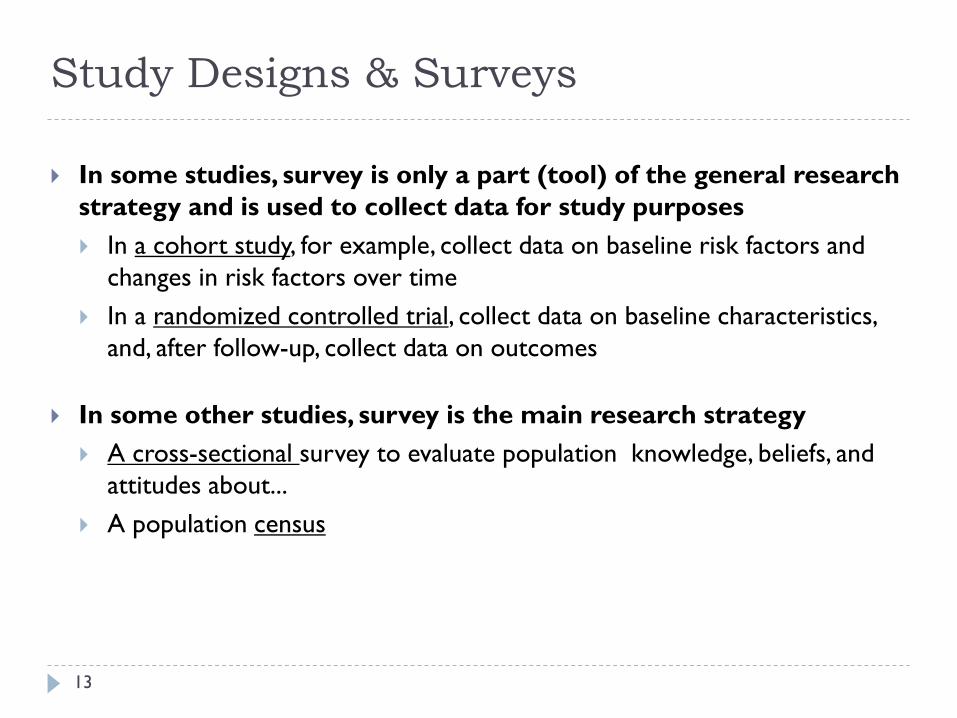
In some studies, survey is only a part (tool) of the general research strategy and is used to collect data for study purposes In a cohort study, for example, collect data on baseline risk factors and
changes in risk factors over time In a randomized controlled trial, collect data on baseline characteristics,
and, after follow-up, collect data on outcomes
In some other studies, survey is the main research strategy A cross-sectional survey to evaluate population knowledge, beliefs, and
attitudes about... A population census
13

Study Designs
Experimental study designs • True experimental, randomized trials • Quasi-experimental trials
Observational study designs • Cross-sectional study • Repeated cross-sectional versus panel surveys
• Cohort study • Case-control study
14

True Experimental Designs with Randomization
15
Pretest-Posttest Control Group Design Threats to Validity
R O X O Internal validity: can be controlled External validity: - Interaction of selection bias and intervention - Reactive effects of testing and experimental arrangements
R O O
Posttest-Only Control Group Design
R X O
R O
DT Campbell & J Stanley. Experimental and Quasi-Experimental Designs for Research. 1963

Example: Whiplash Intervention Trial Objective: determine which of physician care or two rehabilitation programs of care is most effective in
improving recovery of patients with recent whiplash disorder.
Study design: a pragmatic randomized clinical trial
16 Côté et al. Protocol of a randomized controlled trial of the effectiveness of physician education and activation versus two rehabilitation programs for the treatment of Whiplash-associated Disorders: The University Health Network Whiplash Intervention Trial. Trials. 2008; 9: 75.

Quasi-Experimental Designs
17
Nonequivalent Control, Posttest only Threats to Validity
O X O Internal validity: Regression to the mean Selection bias Confounding History Maturation External validity: -Interaction effect of testing
O
Nonequivalent Control, Pretest-Posttest
O X O
O O

Pre-Experimental Designs
18
One-Shot Case Study Threats to Internal Validity
X O History Maturation Testing Selection bias Attrition bias
One-Group Pretest-Posttest Design
O X O
Static-Group Comparison
X O
O
All have weak external validity.
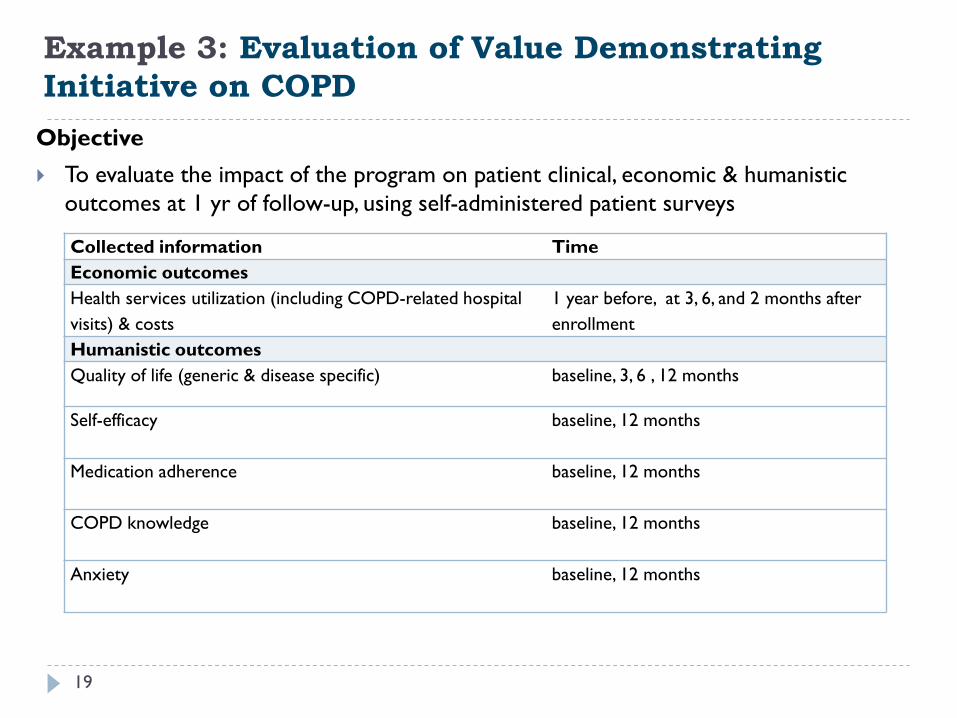
Example 3: Evaluation of Value Demonstrating Initiative on COPD
Objective To evaluate the impact of the program on patient clinical, economic & humanistic
outcomes at 1 yr of follow-up, using self-administered patient surveys
19
Collected information Time Economic outcomes Health services utilization (including COPD-related hospital visits) & costs
1 year before, at 3, 6, and 2 months after enrollment
Humanistic outcomes Quality of life (generic & disease specific) baseline, 3, 6 , 12 months
Self-efficacy baseline, 12 months
Medication adherence baseline, 12 months
COPD knowledge baseline, 12 months
Anxiety baseline, 12 months

Observational Study Designs
Characterize the population under the study (e.g., risk factors, behaviors) and the occurrence of the diseases (place, time) Epidemiological triad: Who? Where? When?
May generate hypotheses about exposure disease Cross-sectional, case-control studies
May provide evidence for exposure disease Cohort studies
20

Cross-Sectional Study
Perhaps the most popular design for surveys
Provides a snapshot of the population at one point in time Establishes the prevalence (absence/presence of the disease) Describes current health and exposure status (i.e. risk factors) Describes attitudes, knowledge, behavior
For unbiased population estimates, need to utilize a strong sampling strategy
21

Cross-Sectional Study
Strengths Relatively inexpensive and takes up little time to conduct
Can estimate prevalence of a disease/outcome of interest if the sample is taken from a representative sample of the whole population
Several outcomes and risk factors can be assessed simultaneously
There is no loss to follow-up!
Weaknesses Surveys prone to non-response bias and recall bias The temporal relationship between exposure and disease is unclear
cannot make causal inferences about exposure disease (correlation does not imply causation!!!)
Only a snapshot the study may provide differing results if another time-frame or sample had been chosen 22

Repeated Cross-Sectional Survey
The same cross-sectional survey is repeated over time
Uses the same sampling frame but each time (randomly) samples different individuals
Provides data on population-level changes over survey periods
23
30
5055
0
10
20
30
40
50
60
1973 1983 1993
Percent caries free among 5 year olds (UK)
Changes in population BMI, Cuba

Panel Surveys
Is a type of longitudinal survey
Designed specifically to evaluate changes over time at the individual level
Selects a cross-sectional sample and follows the initial sample over several waves, even if respondents move location
High cost and complexity
High risk of attrition and multiple testing bias
Examples: National Longitudinal Survey of Children and Youth (Canada) British Household Panel Survey Socio-economic panel (Germany) 24

Cohort Study
Estimates show potential risk factors relate to outcomes Establishes cause effect relationship
Designed to estimate the incidence of the diseases Can be done prospectively or retrospectively
25

Framingham Heart Study
Commenced in 1948, under the direction of the National Heart, Lung and Blood Institute (USA)
Objective to identify the common factors or characteristics that contribute to cardiovascular disease (CVD)
Methods The original cohort recruited 5,209 men and women between the ages of 30 and 62
from the town of Framingham, Massachusetts, who had not yet developed overt symptoms of CV disease or suffered a heart attack or stroke
Investigators conducted extensive physical examinations and lifestyle interviews that they would later analyze for common patterns related to CVD development.
Followed CVD development over a long period of time in three generations of participants.
26
http://www.framinghamheartstudy.org/about/index.html

Case-Control Study Design
The design is retrospective in nature
Identify a group of cases (people with disease) and a group of controls (people without disease)
Use interviews and/or search the records to obtain information on prior exposure to the factor(s) of interest
Measure strength of the association (odds ratio (OR))
27

Example
28
45 -75 years old women with endometrial cancer (cases) registered at the National Oncology Center of Armenia from 2000 to 2006 (n=177).
45-75 years old women without endometrial cancer (controls) residing in Yerevan and recruited through Random Digit Dialing (n=232).
demographic characteristics menstrual and reproductive history breastfeeding experiences contraceptive history family history of cancer use of hormonal medications height and weight smoking status other comorbidities (diabetes)
Interviewer-administered phone interviews
Calculate odds of developing cancer for each risk factor

Survey Sampling
29
30
Defining the Sampling Strategy The sampling strategy should aim to obtain a representative sample of the
target population within allocated timeline and budget
The sample size should be large enough to allow for reliable and valid conclusions from the survey
Some important questions in selecting the sample include: How many responders will be included? How the survey respondents will be selected? What is the size of the target population? What can the budget allow? How confident do you need to be with the results? Do you need to look at any subgroups?
31
Selecting Study Population Survey (target) population – all of the units (individuals, households,
organizations) to which one desires to generalize survey results.
Sampling frame – the list from which a sample will be drawn (using a pre-specified sampling strategy) in order to represent the survey target population Ideally, sampling frame is the list of the target population. Who will be included? Where they can be located? When the data will be collected?
Sample population – all units of population that are drawn for inclusion in the survey. Sampling element/unit - the ultimate unit from whom information will be collected
in the survey and who will be the focus of the analysis (e.g., individual, household, hospital, province, country).
Study population – all the units that return completed surveys.
32

Sources to Obtain Sample Frames
To survey general public: Telephone surveys: phone books that provide phone numbers for all listed
telephones by area code Mail surveys: the list of addresses and, ideally, first and last names Household surveys: the list of addresses; respondents can be selected when in-
person visit is made.
To survey professionals (e.g., doctors, nurses): Professional directories
To survey patients: Clinic databases (may contain both demographic and clinical information)
To conduct intercept surveys (surveying when people enter/exit a specified location): Listing of all representative locations obtained from municipal offices/professional
organizations (e.g., list of all pharmacies by area code).
33

Sampling Strategies
Census – gathering information from every individual in a population Ideal but not always practical!
Probability & Non-probability sampling methods Non-probability sampling methods
E.g., convenience sampling, snowball sampling
Probability sampling methods Simple random sampling Systematic random sampling Stratified random sampling Cluster sampling Combination of probability sampling methods
34

Simple Random Sampling
35
Gives every sampling unit in the sampling frame a known, nonzero and equal chance be selected for survey, with no constraints on random selection.
Method: Assign a number to each sampling unit in the sampling frame Use a random number generator software or a table of random
numbers to draw the sample (e.g., 2, 5, 8 &10 in the picture)
Total population sample = 12 Survey sample = 4 Sampling prob. = 4/12*100=33%

Systematic Random Sampling
36
Similar to simple random sampling but uses a systematic approach for selection
Method: Define the sampling frame and number sequentially (1-12) Randomly select a starting point (2 in the picture) Calculate the sampling interval (#sampling frame/sample size = 12/4 =3)
and add to the starting point to get each next sample unit (2, 5, 8 &11)
Stratified Random Sampling
37
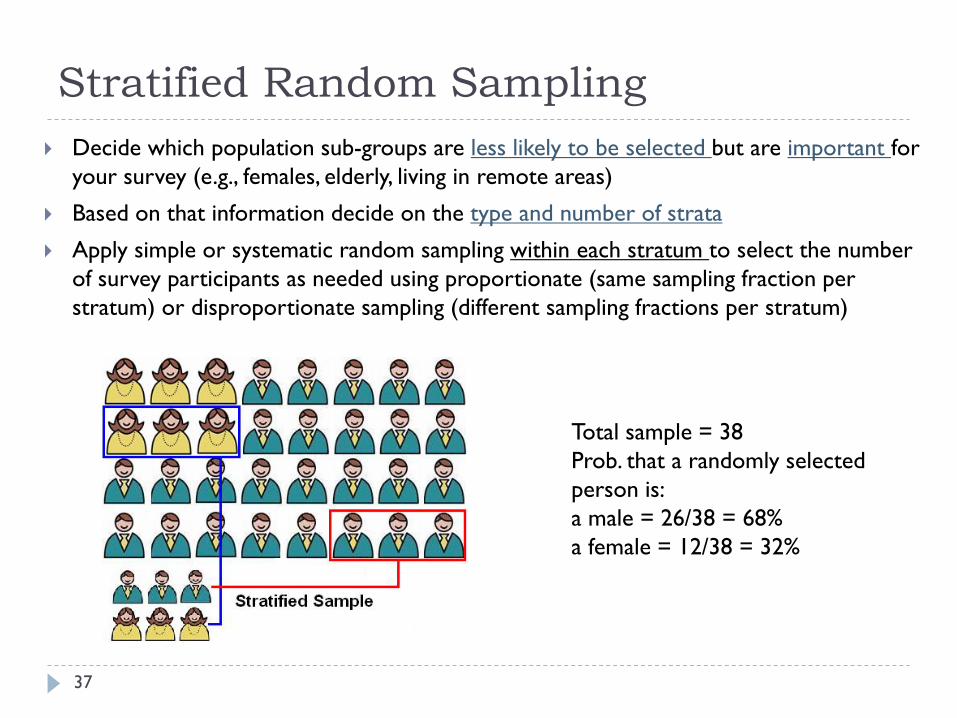
Decide which population sub-groups are less likely to be selected but are important for your survey (e.g., females, elderly, living in remote areas)
Based on that information decide on the type and number of strata
Apply simple or systematic random sampling within each stratum to select the number of survey participants as needed using proportionate (same sampling fraction per stratum) or disproportionate sampling (different sampling fractions per stratum)
Total sample = 38 Prob. that a randomly selected person is: a male = 26/38 = 68% a female = 12/38 = 32%

Cluster Sampling
38
Samples within naturally occurring clusters:
Schools, primary care units, city blocks, cities, provinces, etc
Need stronger data support for complete sampling frame
Pros: Reduces interviewer travel time and costs
Cons: Homogeneity within the clusters but heterogeneity between them higher sampling error than in simple or stratified random sampling
Usually combined sampling methods are applied (multi-stage, probability proportionate to size (PPS) sampling)
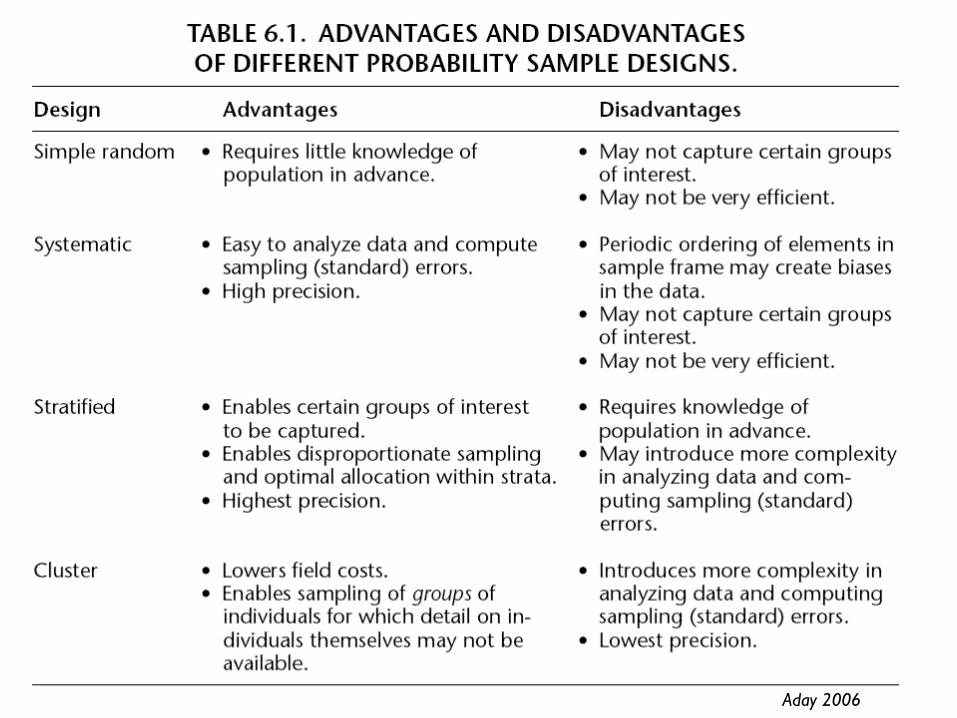
PH352 39 Aday 2006
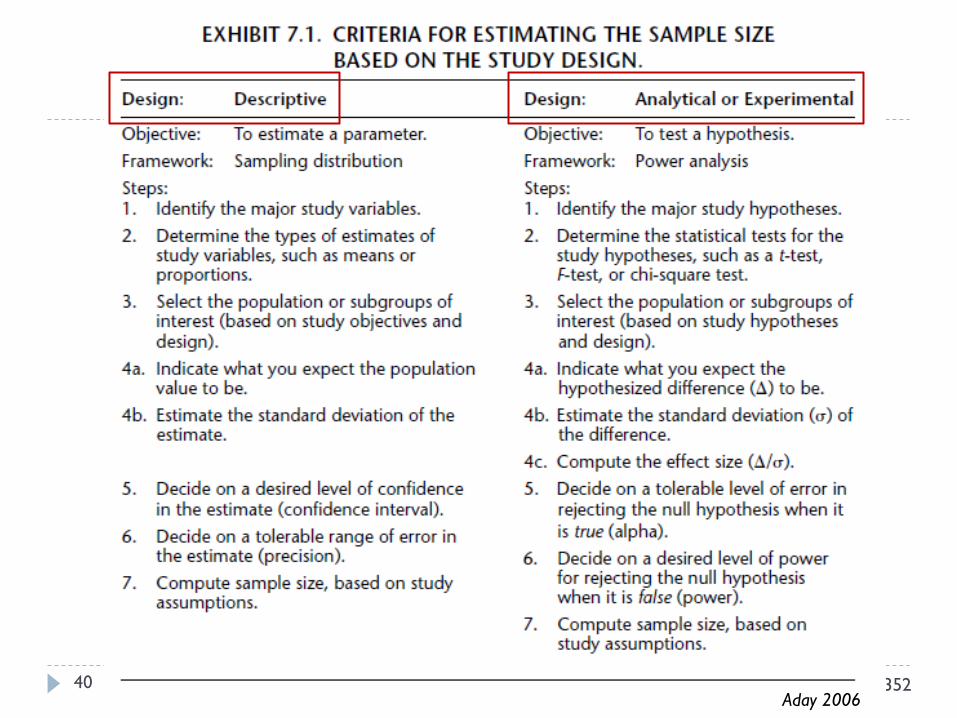
PH352 40 Aday 2006
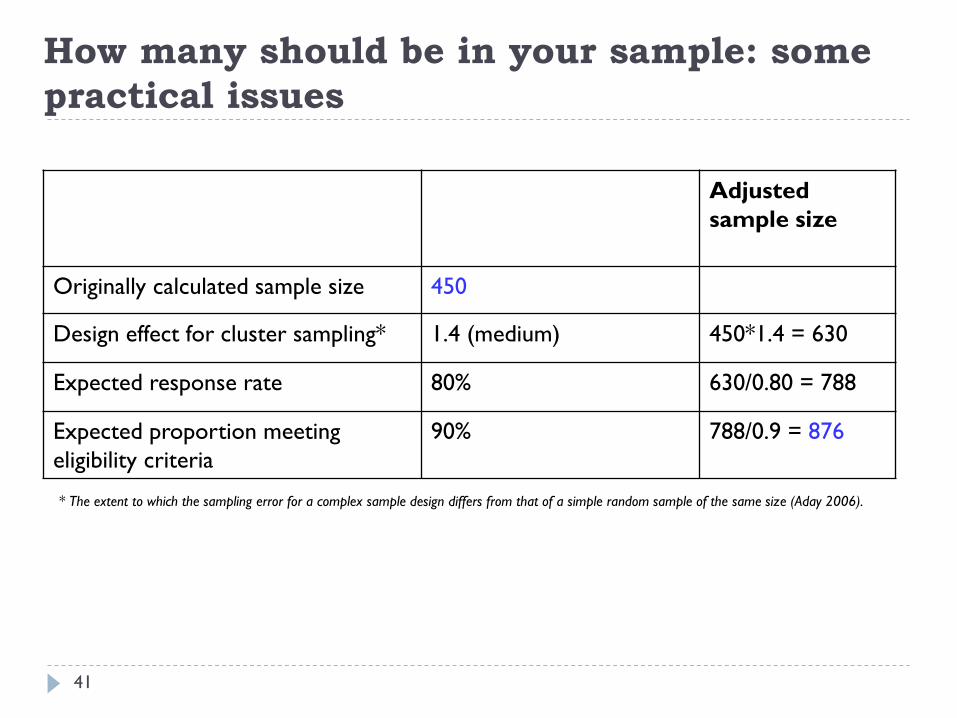
How many should be in your sample: some practical issues
41
Adjusted sample size
Originally calculated sample size 450
Design effect for cluster sampling* 1.4 (medium) 450*1.4 = 630
Expected response rate 80% 630/0.80 = 788
Expected proportion meeting eligibility criteria
90% 788/0.9 = 876
* The extent to which the sampling error for a complex sample design differs from that of a simple random sample of the same size (Aday 2006).

Survey Errors (by Dillman)
Type Description
Non-coverage error When not allowing all members of the survey population to have an equal or known, nonzero chance of survey participation (relates to sampling frame that is not full/accurate).
Sampling error When surveying only a sub-set, and not all, elements of the survey target population. Difficult to avoid as it is difficult to survey the whole target population (relates to sampling procedures applied).
Non-response error When people who respond to survey are different from non-responders who were sampled for the survey.
Measurement error Errors generated because of poor overall questionnaire design, poor wording or inappropriate data collection method.
42

Example: A cross-sectional survey about the educational experiences of 2012-2016 IHPME students
43
You decide to apply a simple random sampling to select 60 students from the existing email list (sampling frame) of all students in those years. This introduces a sampling error (e.g., the estimates obtained from this sample may/may not be representative of the ‘true’ population estimate). Sample estimates should always be presented with their 95% CI.
When you obtain the email list from the Registrar’s office they notify you that about 30% of these email addresses are not currently active/accurate. You exclude these email addresses and apply random sampling to the remaining 70% (without giving a chance to 30% to participate your sampling frame is not complete). If these 30% are different from the 70% in the sampling frame (e.g., age, year of study, PAS), you may introduce a non-coverage error.
Now imagine that as you email the selected 60 students, only half of them respond to the survey. If there are differences between responders and non responders (e.g., age, year of study, PAS), this introduces a non-response error.
And, finally, if the survey instrument was poorly developed or has not been tested in this population there is a clear chance of a measurement error.

Example: Dealing with survey errors Objective: To evaluate satisfaction with in-hospital care in patients with acute myocardial infarction(AMI) in Ontario.
Target population
Population to which the results are generalized
Patients with AMI treated in Ontario hospitals
Sample frame Population from which eligible subjects are drawn
The list of all AMI patients (n = 50,000) in 2016 obtained from discharge databases of all acute hospitals in Ontario
Sample population
Number of patients drawn from the list (sampling unit = patient)
Use simple random sampling to select 500 patients as per sample size calculation and contact for the survey (additional eligibility criteria may be applied)
Study population
Those who respond to survey n = 250 completed the survey (response rate 50%)
44
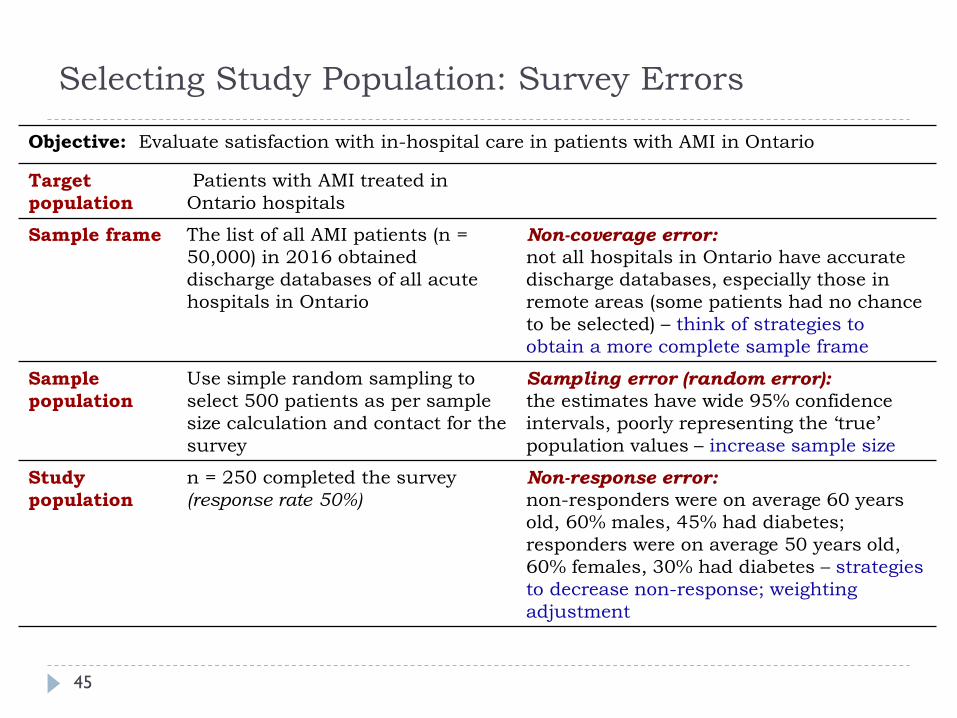
Selecting Study Population: Survey Errors
Objective: Evaluate satisfaction with in-hospital care in patients with AMI in Ontario
Target population
Patients with AMI treated in Ontario hospitals
Sample frame The list of all AMI patients (n = 50,000) in 2016 obtained discharge databases of all acute hospitals in Ontario
Non-coverage error: not all hospitals in Ontario have accurate discharge databases, especially those in remote areas (some patients had no chance to be selected) – think of strategies to obtain a more complete sample frame
Sample population
Use simple random sampling to select 500 patients as per sample size calculation and contact for the survey
Sampling error (random error): the estimates have wide 95% confidence intervals, poorly representing the ‘true’ population values – increase sample size
Study population
n = 250 completed the survey (response rate 50%)
Non-response error: non-responders were on average 60 years old, 60% males, 45% had diabetes; responders were on average 50 years old, 60% females, 30% had diabetes – strategies to decrease non-response; weighting adjustment
45

Survey Techniques
46

What factors define the method?
Study population (literacy, residency, completeness of sampling frame, location)
Research question(s) - explanatory, exploratory
Target response rate
Budget
Staffing & other resources (Internet, phone, training)
Timelines
47

The key to successful survey is the successful planning!!!
48
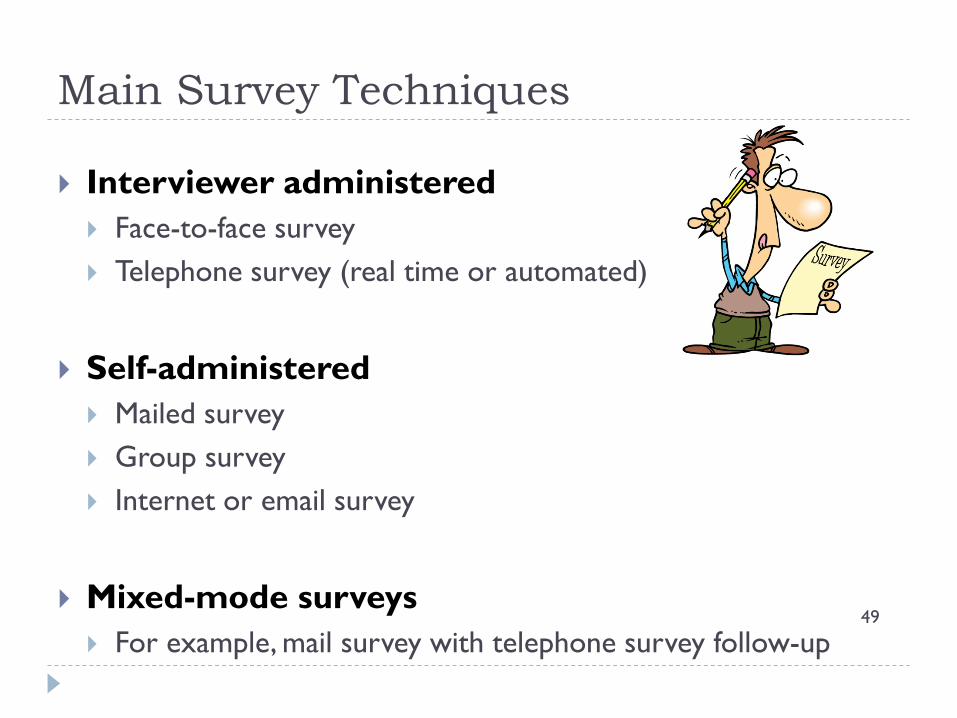
Main Survey Techniques
Interviewer administered Face-to-face survey Telephone survey (real time or automated)
Self-administered Mailed survey Group survey Internet or email survey
Mixed-mode surveys For example, mail survey with telephone survey follow-up
49

Face-to-face survey
Allows for face-to-face social interaction between interviewer and responder more personable, creates trust and cooperation from respondents.
Higher response rate than in any other design both to survey and individual survey questions.
Higher chance to administer longer surveys with complex questions.
Can document demographic characteristics of non-responders and reasons for refusal.
Interviewer can control the sequence of questions and can probe and clarify questions if needed.
50

Face-to-face survey
Disadvantages Social desirability bias may affect the accuracy of
responses
Time and money to recruit and train interviewers is high. Need to ensure the interviewer asks the same questions in
the same way to all responders. Might be difficult to find interviewers willing to travel to
remote areas or to areas with unfavorable conditions. Cost per interview is high (interviewer salary plus
transportation costs). 51

Social desirability bias
Generated if the responder gives not truthful but ‘socially acceptable’ answers to survey questions to appear in a different social role or to gain prestige. Examples:
Exaggerating healthy eating and exercise habits Undermining dangerous/illegal or non healthy behaviors Downplaying prejudice against religion or race
Methods to check for this type of response bias: Ask few indirect questions on the topic rather than a single
direct Ask follow-up questions on the topic Repeat the same question later within the same survey
52

Telephone survey
A very popular method in countries where phone coverage is high. Method of choice for short surveys of general population.
Advantages Possible to achieve high response rates (often >80%).
Can document demographic characteristics of non-responders and reasons for refusal.
Chance to explain complex questions to responders, if needed and reduce non-response to individual questions.
Able to obtain results quickly. Less costly than face-to-face interviews (and can be more/less expensive
than mail surveys).
53

Telephone survey Disadvantages Difficult to administer long questions with several available
categories
Technical difficulties to reach the respondent
Multiple callbacks may be needed, up to 20 per responder
Prone to non-coverage error especially with the increasing use of cell phones Cell phones not listed in directories. In some countries law prohibits automated dialers to call cell phones. Under-representation of certain groups – e.g., young people.
Telemarketing made phone surveys increasingly difficult!!!
54

Telephone survey Some phone surveys use phone directories as sampling frame
Most phone surveys, however, apply a type of random digit dialing
Random digit dialing (RDD): Generate a list of possible phone numbers:
The number of possible combinations can be high! Not all the numbers are real phone numbers (e.g. 000001) not efficient
Use area codes first If you know area codes (and assign the sample size per area code), first
select the area codes and then generate the remaining numbers E.g., 416 - xxx xxxx where 416 is a district/area code in Toronto and
‘xxx xxxx’ is a randomly generated number between 0 and 9999999 More efficient as the likelihood of an existing phone number is higher. 55

Telephone survey Other variants Computer-assisted telephone interviewing (CATI) A telephone survey where the interviewer reads the interview script
from the screen and enters answers directly into the computer (more efficient)
In some cases the software can accommodate RDD, personalize questions, perform logic and range checks as the interviewer enters data (more accurate)
Automated computer telephone interviewing (ACTI) A telephone survey that uses an interactive voice response – a pre-
recorded voice that replaces the interviewer Data is collected either by the respondent's key strokes or machine-
recognizable words and phrases (more accurate and efficient)
56

Mailed Survey Advantages Social desirability bias minimized.
Administrative costs and cost/respondent are less than in face-to-face surveys.
Disadvantages The demographics of non-responders and reasons for refusals not
always easy to establish.
High potential for missing responses in returned questionnaires.
Longer time required to mail and collect questionnaires, especially if there are follow-up mails sent to non responders.
57

Mailed Survey: Dillman’s method
Few days before mailing the questionnaire, send a brief letter that notifies sample members of the importance of the survey.
Send out the 1st mailing and include a personalized cover letter and self-addressed, stamped return envelope with the questionnaire (usually results in a 40% response)
Send a reminder card 10-14 days after the 1st mailing to thank those participants who have already responded and to remind those who have not of the importance of the study. The card should also indicate where people can obtain another copy of the questionnaire if they have mislaid their original copy.
3 to 4 weeks later, send a second mailing with a new cover letter emphasizing the importance of receiving responses. Also include a new questionnaire and return envelope (has been found to increase response rate by an additional 20%). You can repeat this once more after 6 to 8 weeks.
Recently added: send a token financial incentive with the survey request.
58 Ref: Dillman, D.A. (2000) Mail and Internet Surveys: The Tailored Design Method. 2nd Edition. New York, NY: John Wiley & Sons, Inc.

59

Group administered survey
Completed by individual respondents gathered together in one location E.g., hospital or clinic-based survey of providers, patients
Need to emphasize and secure both anonymity & confidentiality
Advantages Higher response rate
Disadvantages Less feasible overall Participants may feel coerced to participate and may give not very truthful
answers
60
Internet survey E-mail survey:
the survey is sent to responder’s email who sends it back to the researcher upon completion.
Web survey: responders are asked or directed to a website where they fill the questionnaire. The
researcher has access to the server that hosts the compiled data. Advantages The least expensive survey technique.
Short time to complete the survey – to set up, send, and analyze.
More flexibility to questionnaire design visual graphics, audio components, interactive screens and tailored questions, added
links for clarifications in complex questions
Reduces errors from coding or entry – already coded when filled
Reduces or eliminates social desirability bias compared to in-person or phone interviewers
Internet survey
Disadvantages Non-coverage error: the sample frame is not representative of target
population (e.g., all university students versus all university students with Internet/email)
Non-response bias: those who answer are generally more educated, have higher income and are younger; sometimes even difficult to estimate (unknown who is answering to the survey)
Self-selection bias
Technological expertise needed to conduct Web surveys.
Ethical considerations: If not informed, perceive as violation of privacy Decreasing popularity with increasing market surveys Requirements for data security to ensure anonymity and confidentiality
62

Comparing Survey Methods (Aday 2006) Design Characteristics Mail Phone Face-
to-face Web
Opportunity for representative sample for listed population
High High High Medium
Opportunity to control sampling unit (e.g., specific household member)
Medium High High Low
Allowable length of questionnaire Medium Medium High Medium
Allowable complexity of questions Medium Low High High
Ability to control question sequence Low High High High
Ability to ensure questionnaire completion
Medium High High Low
Risk of social desirability bias Low Medium High Low
Risk of interviewer bias Low Medium High Low
Personnel requirements Low Low High Low
Overall time requirement High Low High Low
Overall costs Low Medium High Low 63

Calculating a Response Rate
Response rate = number completed the survey mmnnnnnnnnmm number selected/eligible for the survey
Example from MPH 2015 report: “Overall 3,319 phone call attempts were done, out of which 978 respondents were found to be eligible
to participate in the study. Out of the eligible respondents 589 refused to participate. Overall 389 respondents completed the survey, which corresponded to the 100% predetermined sample size. Following the survey the actual response rate was calculated, which was 39.78%. ” If some of the interviews were discarded for different reasons (non-complete, non-valid answers, etc),
then another response rate can be calculated.
Always try to document the reasons for non-response: refusal, language problem, illness, partially filled questionnaire, non-eligibility, etc.
Example from an Armenian household survey (http://aua.am/chsr/PDF/2006/HHS2006_final_eng.pdf ):
“The primary reason for non-response was the absence of all household members (35.1%), followed by the refusal by the household to participate (8.2%), the absence of the selected respondent (7.0%), the absence of any eligible respondent (2.9%), or an unoccupied house (5.0%).”
64

Is there an ‘Acceptable’ Response Rate?
There is no agreed-upon standard for acceptable response rates Recommended ‘acceptable’ levels in the literature vary from 50 -75%
The Canadian Medical Association Journal's editorial policy states: “Except for in unusual circumstances, surveys are not considered for publication if
the response rate is less than 60% of eligible participants.”
The lower the response rate, the higher the likelihood of non-response error
To be credible, published survey research must meet acceptable levels of scientific rigor, particularly in regard to response rate, transparency and the representativeness or generalizability of the study's results.
65 Draugalis et al. Best Practices for Survey Research Reports: A Synopsis for Authors and Reviewers. Am J Pharm Educ. Feb 15, 2008; 72(1): 11.

Response rates & survey modes
People have preferences for survey modes that affects response rates Personal interview > Telephone > Self-administered mail > Internet surveys
Starting with one method and then switching to another for non-responders (sequential strategy of mixed-modes) increases response rates American Community Survey, a large national demographic survey conducted
by the US Bureau of the Census 56.2% response rate via a mail survey, 63.5% after a telephone interview
follow-up, and finally a 95.4% after face-to-face interviews (Griffin and Obenski, 2002).
66

Edwards et al. Methods to increase response to postal and electronic questionnaires. Cochrane Database Syst Rev. 2009 Jul 8;(3):MR000008.
Postal: 481 eligible RCTs evaluated 110 methods Electronic: 32 eligible RCTs evaluated 27 methods
Factors increasing the response (Odds Ratio)
• using monetary incentives: 1.87 • recorded delivery: 1.76 • teaser on the envelope - e.g. a comment suggesting to
participants that they may benefit if they open it: 3.08 • pre-notification: 1.45 • follow-up contact: 1.35 • unconditional incentives: 1.61 • shorter questionnaires: 1.64 • 2nd copy of the questionnaire at follow up: 1.46 • mentioning an obligation to respond: 1.61 • university sponsorship: 1.32 • non-monetary incentives: 1.15 • personalised questionnaires: 1.14 • use of hand-written addresses: 1.25 • an assurance of confidentiality: 1.33 • first class outward mailing: 1.11
• using non-monetary incentives: 1.72 • shorter e-questionnaires: 1.73 • including a statement that others had responded: 1.52 • a more interesting topic: 1.85 • using a lottery with immediate notification of results:
1.37 • an offer of survey results: 1.36 • using a white background: 1.31 • personalised e-questionnaires: 1.24 • using a simple header: 1.23 • using textual representation of response categories:
1.19 • giving a deadline: 1.18 • a picture included in an e-mail: 3.05;
Factors decreasing the response (Odds Ratio)
• included questions of a sensitive nature: 0.94 • when "Survey" was mentioned in the e-mail subject line: 0.81
• when the e-mail included a male signature: 0.55


