Survey of Bat Species For the Proposed Sunshine Wind Park Coconino County, Arizona Prepared for: Sunshine Arizona Wind Energy, LLC 1016 West University Drive, Suite 108 Flagstaff, AZ 86001 Prepared by: Dr. Carol Chambers Northern Arizona University Box 15018 Flagstaff, AZ 86011 Ecological Monitoring & Assessment Program Northern Arizona University Box 5845 Flagstaff, AZ 86011 Western EcoSystems Technology, Inc. 2003 Central Avenue Cheyenne, Wyoming 82001
Transcript
Survey of Bat Species
For the Proposed Sunshine Wind Park
Coconino County, Arizona
Prepared for:
Sunshine Arizona Wind Energy, LLC 1016 West University Drive, Suite 108
Flagstaff, AZ 86001
Prepared by: Dr. Carol Chambers
Northern Arizona University Box 15018
Flagstaff, AZ 86011
Ecological Monitoring & Assessment Program Northern Arizona University
Box 5845 Flagstaff, AZ 86011
Western EcoSystems Technology, Inc.
2003 Central Avenue Cheyenne, Wyoming 82001
Bat Survey Sunshine Wind Park March 13, 2007
March 2007
2
Bat Survey Sunshine Wind Park March 13, 2007
EXECUTIVE SUMMARY
Capture (mist netting) and acoustic (active and passive) surveys to identify bat species richness and level of activity of bats were conducted from April to November 2006 at the proposed Sunshine Wind Park site east of Flagstaff. Bats were captured during 2 months (April, May) when water levels in earthen tanks permitted netting. Active acoustic surveys were conducted concurrent with netting to identify (when possible) species seen but not captured. Passive acoustic survey methods were conducted at 2 sites between June and November. I confirmed presence of 8 species and likely presence of a ninth. Species captured by mist netting or recorded acoustically were: Allen’s lappet-browed bat (Idionycteris phyllotis), pallid bat (Antrozous pallidus), hoary bat (Lasiurus cinereus), Mexican free-tailed bat (Tadarida brasiliensis), fringed myotis (Myotis thysanodes), California myotis (Myotis californicus), Yuma myotis (Myotis yumanensis), and western pipistrelle (Pipistrellus hesperus). Big brown bat (Eptesicus fuscus) probably occurred at the site based on acoustic recordings; however, echolocation calls of big brown bats can look similar to several other species. Although this species is suspected at the Sunshine Wind Park site, it is not confirmed. Hoary bat and Mexican free-tailed bat are migratory species. Allen’s lappet-browed bat, capable of traveling long (>60 km/night) distances nightly when foraging, is listed as sensitive or of concern by the Forest Service (Sensitive Species, proposed for listing, Region 3) and U.S. Fish & Wildlife Service (Species of Concern). Capture rates using mist netting for the Sunshine Wind Park site were low compared with those from an area in desertscrub / grassland near the Grand Canyon (Marble Canyon, House Rock Valley) in northern Arizona. Captures near Grand Canyon were 6 to 100 times higher than at the Sunshine Wind Park site. The Grand Canyon provides many roost sites, which may explain the difference in activity. Passive acoustic surveys at the Sunshine Wind Park site indicated highest use by bats in September; however, equipment problems prevented effective sampling through the 6 month period. These data should be considered preliminary. Rates at the Wind Park site were lower than concurrently recorded at a ponderosa pine (Pinus ponderosa) site near Flagstaff, Arizona (Fort Valley). There are 2 known roosts for Allen’s lappet-browed bat and Townsend’s big-eared bat (Corynorhinus townsendii) near (<20 km) the proposed Sunshine Wind Park site. I detected Allen’s lappet-browed bat but not Townsend’s big-eared bat at the site. However, Townsend’s big-eared bat is difficult to capture and detect acoustically, so it is possible they use the site. Data from the 2006 survey season suggests that activity by bats is relatively low at the proposed Sunshine Wind Park site. However, some migratory and sensitive species were detected, and multi-year surveys using a combination of techniques (acoustic, capture) would provide better information about bat activity at the site.
3
Bat Survey Sunshine Wind Park March 13, 2007
INTRODUCTION
Foresight Wind Energy is evaluating the feasibility of developing a wind power project in Coconino County, Arizona. The proposed project site for the Sunshine Wind Park is located approximately 56 km east of Flagstaff, Arizona and is bisected by Interstate 40 (I-40) at the Meteor Crater exit. The proposed development would be located on private lands currently managed primarily for livestock production. Wind turbines have been implicated in deaths of bats at 16 turbine sites in the U.S. and Canada (Arnett et al., in preparation). In western states (Wyoming, Oregon, California), estimated fatalities per turbine ranged from 1.1 to 3.4 bats representing at least 7 species (mean fatality per megawatt of energy produced per turbine ranged from 0.8 to 2.5; Arnett et al., in preparation). Migrating bats (hoary bats, silver-haired bats; for scientific names, see Table 1) were among the species most affected. In Arizona, both of these species and other migratory bats occur (Table 1). Other Arizona bat species such as Allen’s lappet-browed bat (U.S. Fish & Wildlife Service Species of Concern and U.S. Forest Service Region 3 Sensitive Species [proposed for listing]) forage over long distances from roosts (80 km per night; 40 km one way from roost location) and forage in open country (grasslands and desert scrub as are found in the Sunshine Wind Park area), and thus may be at risk. Finally, some species have been designated at risk by federal agencies (Table 1) in the Southwest because disturbance and loss of maternity colonies has reduced numbers (e.g., Townsend’s big-eared bat, Allen’s lappet-browed bat; see Hinman and Snow 2003). These species may not travel long distances, but if they roost nearby, their populations could be impacted by wind turbine collisions.
OBJECTIVES
The objectives of this project were to describe the bat community at the proposed Sunshine Wind Park site and to assess any impacts wind turbines might have on bats. Specifically the study was designed to provide information on bat use of the study area that would:
• Be useful in evaluating the potential impact to bats from wind power development in the area; and
• Help in designing a wind park that is less likely to expose bat species to potential collisions with turbines.
To address these objectives, I used several methods of monitoring bats to identify activity level and temporal patterns (time when most activity occurred), and generated a species list for the Sunshine Wind Park site. I provide information on several known roosts in the vicinity and make comparisons of data collected at the Sunshine Wind Park site to other areas in northern Arizona.
METHODS
I monitored bats in 2 areas where wind turbines were proposed for placement, at an earthen tank 3.2 km south of I-40 (coordinate system NAD27 ConUS; UTMs: 0496713, 3881868; elevation 1659 m), and near the Met Tower, 1.4 km north of I-40 (UTMs: 496036, 3886762, elevation 1646 m). The sites were ~4.8 km apart. Since multiple survey methods are more likely to detect
4
Bat Survey Sunshine Wind Park March 13, 2007
bat species, and some bats are easier to detect with one method than another (Table 1), I used 3 survey methods to identify bats and level of activity at these sites: (1) passive and (2) active acoustic monitoring to record echolocation calls of bats and (3) mist-netting to capture bats.
Passive acoustic monitoring Passive acoustic monitoring was conducted from May through late October/early November 2006 for 3 to 5 consecutive days each month at each of 2 locations. Acoustic monitoring stations consisted of an ANABAT II and CF Z-CAIM placed singly at each location. One was placed near a water source (Netting Tank); the other near the Met Tower. Calls were collected from 18:00 to 06:00 each 24 hr period. From August till late October/early November, the Met Tower station was placed by a newly-filled pond (UTMs: 496692, 3886508, elevation 1647 m; <500 m from original position) in the vicinity of the Met Tower to increase the likelihood of recording bat echolocation calls (bats are more likely to pursue prey and drink over water than over open space without water). Because of equipment problems (high intensity rains shorted out microphones several times) and weather (wind, rain), I obtained data for 16 nights for 1 station (Netting Tank) and 19 nights for the second station (Met Tower). All data files were visually inspected and non-bat calls (wind, rain, and insects) were removed. Because of the difficulty in identifying calls to species, calls were sorted by frequency group. Frequency groups were categorized as 50k (>50 kHz calls), 40k (50 – 40 kHz calls), 25k (35 – 20 kHz calls), and 20k (<20 kHz calls) and included 3 to 8 species (Table 1; in the southwestern U.S., most bat ecologists group calls into these categories). I identified calls to species through visual inspection of call characteristics when possible. I categorized calls into 2 types: feeding buzzes and passes. Feeding buzzes indicated active pursuit and possible capture of prey by a bat. Passes indicated the presence of a bat. I calculated the number of bat passes and feeding buzzes per hour. To compare activity across time, I sorted calls by each hour of the night to look for patterns.
Active acoustic monitoring Concurrent with mist netting and at the same locations (i.e., 1 night each month in April and May), I conducted active Anabat surveys using an Anapocket (ANABAT II, CF Z-CAIM, and Personal Digital Assistant [PDA]). The Anapocket is a handheld mobile device used to monitor bat echolocation calls. It can be left on continuously. When a call is detected, the microphone of the Anapocket can be pointed towards the area where the call is best detected (i.e., complete call sequences) and the bat can be spotlighted to look at its shape, coloration, and flight pattern (these can be distinctive for some species such as the Yuma myotis, which circles over water, flying just above the surface and is uniform in coloration). While netting, I monitored activity in the vicinity of the pond using an Anapocket and spotlighted flying bats when I could locate them. In April, I recorded bats between 2028:23 and 2239:01 hrs. In May, I recorded calls between 2141:02 and 0229:20 hrs. Because I recorded calls opportunistically, I did not calculate a call rate but used these for species identification only. Mist netting Mist netting is most effective over water in the Southwest because bats are often limited by water and will commonly visit ponds and other water sources to drink. It is the best method of documenting many bat species (Table 1). I used mist nets to capture bats over an earthen pond
5
Bat Survey Sunshine Wind Park March 13, 2007
when water levels were low enough (the pond could be waded) to set up mist nets (April, May 2006, Figure 1 A). However, netting is only effective when the surface area of the pond can be covered with enough nets so that bats have difficulty avoiding nets when they drink or forage. When the surface area becomes too large or the pond is too deep so that access is limited, nets can no longer cover the pond and bats can forage and drink in these areas without being captured. The pond, located in a grassland vegetation type, was dry from June until late July. At this time, it and other ponds in the Sunshine Wind Park site filled over a 3-day period, rendering them too large and deep to survey. All ponds were too large to net effectively during the rest of the monitoring period (through October; Figure 1 B). I conducted 2 mist netting sessions: 26-27 April and 25-26 May. Both times were during new moon periods of the month (dark nights with no moon light when bats are more active because they are less visible to predators compared to full moon periods). Mist nets were set over open water in a wagon wheel configuration to cover as much of the water surface area as possible (Kunz and Kurta 1988). I used 10 nets each session to provide optimal coverage of the water surface area. Nets were 2.6 m tall and 9, 12 or 18 m long. Nets were opened at dusk (~2000 hr) and closed at dawn (~0430 hr). In April, I used 3 9-m nets, 1 12-m net, and 6 18-m nets for a total of 220.5 net hours (1 net hr = 1 6-m net open for 1 hr). In May, I used 2 9-m nets, 1 12-m net, and 7 18-m nets for a total of 221 net hours. I identified captured bats to species, sex, reproductive condition, and age. To determine age (juvenile, sub adult, adult) I looked for the presence of cartilaginous epiphyseal plates in the phalanges (Anthony 1982). I determined reproductive status (pregnant, lactating, post-lactating, non-reproductive) by examining bats in hand. Males were scrotal if the testes were partly descended. The abdomens of females were palpated for evidence of pregnancy (fetus), and mammary glands were checked for evidence of lactation. I measured mass with a spring scale (to nearest 0.2 g), and forearm, thumb, ear, and tragus lengths with calipers (to nearest 0.1 mm) to aid in identification. Bats were released within 15 min of capture. Capturing and handling of bats conformed to the guidelines established by the American Society of Mammalogists (1998) under a protocol approved by the Northern Arizona University Institutional Animal Care and Use Committee. I calculated capture rate of bats (number of bats per net hour) for each netting session. I compared capture rates at the Sunshine Wind Park with capture rates from other locations in northern Arizona.
Sample Collection I captured 1 hoary bat that was unable to fly upon release. This animal was euthanized and tested for rabies. The Arizona Veterinarian Diagnostics Lab conducted a necropsy to determine why the bat was unable to fly. I also collected a sample of fur (2 mg) from the animal to analyze for the stable hydrogen isotope ratio of water (δD). The hair sample from the hoary bat was cleaned using a mild liquid detergent to remove dirt, followed by washing in a solvent mixture (chloroform:methanol, 2:1, v/v) to remove oils. It was then rinsed thoroughly with deionized water and dried for 24 to 48 hours at 60 °C. Samples are weighed (ca. 1 mg) into silver foil capsules and analyzed for stable-isotope-ratios of hydrogen
6
Bat Survey Sunshine Wind Park March 13, 2007
(dD) by pyrolysis using a Thermo-Chemical Elemental Analyzer (TC/EA) interfaced to a continuous-flow isotope ratio mass spectrometer (Delta Plus XL, Thermo Finnigan, Bremen, Germany). Stable isotope ratios are expressed as delta values and are reported in per mil notation. Replicate samples of calibrated keratin standards (CFS, CHS, and BWB) are analyzed along with unknown samples to correct for day-to-day variation in run conditions.
RESULTS
Mist netting During April and May, I captured 8 bats representing 6 species during each netting session (Tables 1 and 2, Figure 2). Capture rate for April was 0.02 bats/net hour and for May was 0.02. In June and July in other locations in northern Arizona (e.g., Marble Canyon, Grand Canyon), capture rates were higher: 0.12 to 2.09 (C. Chambers, unpublished data). I know of no other netting studies conducted during April and May in northern Arizona that would provide data for comparing capture rates. The hoary bat captured in April could not be released because of an unknown injury. The bat was unable to fly after capture and was euthanized the next morning. This bat tested negative for rabies. A necropsy on the bat did not indicate what affected her ability to fly. There were no microscopic lesions on the brain, heart, kidney, liver, pancreas, small intestine or large intestine. There was marked pulmonary congestion with focal pulmonary hemorrhage. The cause of the damage to lungs was not determined, and there was no evidence of any inflammatory change. The damage was assumed to be recent. The bat appeared to be healthy with good muscle mass and little or no body fat. The bat was a female and the age was undetermined. The δD isotope signature of the hoary bat was -105.7 ‰ and indicated this animal was migratory because the local δD isotope signature is between -70 and 79‰ (Figure 3). It is likely the bat spent the previous summer much farther north or at higher elevation (e.g., northern Rocky Mountains or Canada). Female hoary bats do not appear to spend much time in the northern Rockies when they are molting new fur, so this animal may have been ranging widely (Paul Cryan, USGS Research Biologist, personal communication).
Active acoustic monitoring In April, I recorded bats between 2028:23 and 2239:01 hrs. I recorded 112 calls and detected 2 species, pallid bat (2 calls) and Yuma myotis (109 calls). In May, I recorded 24 calls between 2141:02 and 0229:20 hrs. I detected 3 species: pallid bat, California myotis, and Yuma myotis. During netting sessions, I observed very few bats flying over the pond, and most recordings on the Anapocket were of Yuma myotis. I did not observe more than 2 Yuma myotis directly over water in the pond at the same time, indicating low rate of use of the pond. Passive acoustic monitoring Although over 8000 files were recorded during 52 sampling nights, problems with Anabats meant I effectively sampled (bat calls were recorded) only 35 nights. The monsoon season started in late July at the Sunshine Wind Park site. During the monsoon season, rain shorted microphones and recorded static so I lost opportunities to record bats. When it rained, bats were probably not active, thus unlikely to be recorded; however noise caused by falling rain was
7
Bat Survey Sunshine Wind Park March 13, 2007
recorded on the Anabats and precluded recording any bat calls. I repaired or replaced microphones following 3 of the monitoring sessions. I recorded few calls in July or August (≤ 0.34 calls/hr, Table 3). I recorded fewer calls at the Met Tower (≤ 0.10 calls/hr, Table 3) than at the Netting Tank (≤ 0.34 calls/hr, Table 3). However, in September, I recorded the most calls of any month, with a higher call rate at the Met Tower (6.93 calls/hr) compared to 2.86 calls/hr at the Netting tank. The higher call rates observed at the Met Tower site could be attributed to the better location of the equipment (repositioned at a nearby newly-filled pond rather than over dry ground). There was a decrease in call rate to ≤ 0.27 during the late October / early November session (Table 3). I compared the call rate at the Sunshine Wind Park with that of ponderosa pine (Pinus ponderosa) forest near Flagstaff (Fort Valley site) for data collected during the same time period. Call rates at Fort Valley were higher (0.96 and 1.79 calls/hr) during July and August than at the Sunshine Wind Park site (0.05 to 0.34 calls/hr, Table 3). Most calls were recorded in the 50k (80%) and the 25k (18%) frequency groups; there were few 40k and 20k frequency group calls (Figure 4). Most of the 25k frequency group calls could not be assigned to a species. However, at least 8% were pallid bat, 1% suspected to be big brown bat, and 7% Mexican free-tailed bat (Figure 5 A). Of the 50k frequency group, most calls were assigned to Yuma or California myotis (74%); 3% of calls were western pipistrelle. Yuma myotis dominated calls in this group (Figure 5 B). Bats represented by the 40k and 20k frequency groups included Allen’s lappet-browed bat and fringed myotis (Appendix 1). Most passes were recorded before midnight. All 20k frequency group passes were recorded before midnight; 74% and 75%, respectively, of 25k and 40k frequency group passes were recorded before midnight (Table 4). Seventy-five percent of 50k passes were recorded before 0100 hr (Table 4). Few feeding buzzes were recorded, and these were primarily for the 50k frequency group (Table 4). Most of the 50k frequency group feeding activity (75%) occurred by midnight and were likely Yuma myotis (less likely to be California myotis based on calls, but identifications could not always be confirmed to species). Using passive acoustic monitoring systems, I confirmed the presence of 2 additional species at the Sunshine Wind Park site: Allen’s lappet-browed bat and western pipistrelle. I suspect I identified a third species, big brown bat; although it is difficult to identify echolocation calls of this species from some other species in the 25k frequency group (Appendix 1, Table 1). Known roosts During a concurrent roost study I am conducting for Arizona Game and Fish Department, the presence of at least 2 roosts were identified in the vicinity of the Sunshine Wind Park site (Ben Solvesky and C. Chambers, Northern Arizona University, unpublished data). One roost was a limestone cave with at least 50 bats (Townsend’s big-eared bats and Myotis species) using the roost. It was located within 7 km of the areas surveyed with passive acoustic systems at the Sunshine Wind Park site. This roost may be a hibernaculum, but is used during summer as a day roost (possibly a maternity roost). A cave roost for Allen’s lappet-browed bats and other species (possibly Myotis) has also been identified within 20 km of the Sunshine Wind Park site.
8
Bat Survey Sunshine Wind Park March 13, 2007
DISCUSSION AND RECOMMENDATIONS
The southwestern United States is unique in its high species richness of bats and presence of tropical and temperate bat families. Twenty-eight species representing four families have been identified in Arizona. Unlike many small-sized animals, bats are long-lived (some are known to live 30 years) and reproduce at slow rates; many species produce only 1 young per year. Some bat species are migratory, and move long distances during spring and fall (e.g., hoary bat). These characteristics make bats vulnerable to factors that cause population declines. Studies at wind projects throughout the U.S have shown that some species of bats are at risk of collision with turbines. Surveys to determine bat species seasonally present in an area can aid in wind project planning and conservation efforts. Capture rates at the Sunshine Wind Park site were low. However, I was only able to net bats during spring at the Sunshine Wind Park site (April, May). Highest capture rates in northern Arizona usually occur in June and July when I could not net at the Sunshine Wind Park site because ponds were either dry or too large to net effectively. However, low capture rates in the area may also be attributed to limited roost sites. Bats use caves, mines, crevices, buildings, bridges, snags, and tree cavities for roosting. Limited roost availability will limit bat population sizes. Rabe (1999) and Tuttle et al. (2006) conducted bat surveys (acoustic, infrared video-taping, netting) in areas near the Sunshine Wind Park site (e.g., Tuttle et al. [2006] conducted work ~20 km west) in grassland ecosystems and also experienced low activity. Their data suggest that roosts are limiting in the vicinity of the Sunshine Wind Park site. Bat populations may be lower because of this factor. I captured 2 individuals representing 2 migratory species that could be at risk from wind turbines. The hoary bat did not appear to be sick but had sustained some type of recent injury. The injury could have been from mishandling although unlikely since handlers working with me were experienced. The bat could have been recently injured while migrating and either off course because of the injury, or on course and using the water source for drinking or foraging. Hoary bats fatalities have been recorded at most wind farms studied (see Johnson 2005), even within non-forested habitats, suggesting they may follow more broad front migration patterns. The mean annual stable hydrogen isotope ratio of water (δD) changes with latitude and elevation (Meehan et al. 2004; Figure 2), and δD from local sources is generally taken into animal tissues such as hair as a result of feeding or drinking from those sources. Bats are generally believed to molt once a year, most likely in August (Constantine 1957, Quay 1970, Cryan et al. 2004) and presumably hydrogen isotopic signatures of hair reflect δD values of the area where bats molted and grew new hair. Cryan et al. (2004) found that δD signatures of hair from hoary bats were correlated with δD values of water sources where they lived during their molt, but that δD values of local sources at capture locations were in some cases quite different from δD values of bat hair, indicating incorporation of hydrogen from a different location. They took this as evidence of long-distance movement for this species. The hoary bat I captured was migratory, and from the δD signature she had spent the previous summer in northern U.S. or southern Canada. The
9
Bat Survey Sunshine Wind Park March 13, 2007
monthly distribution of captures of hoary bats (Cryan 2003) showed highest concentration of hoary bats from June through October in the Southwest. Hoary bats are in the 25k frequency group. I recorded more 50k frequency group calls than 25k frequency group calls between June and October, and because it is difficult to resolve 25k frequency group bats to species, I can not confirm if other hoary bats were detected acoustically during summer/fall at the Sunshine Wind Park site. The Mexican free-tailed bat captured by mist netting is also a migratory species. I did record the presence of this species acoustically, suggesting some use of the area, although use did not seem high. I recorded higher acoustic activity in September than any other month. Recording in late October may have been too late to detect migrating bats (e.g., Cryan 2003), and June though August recordings were problematic with nights of rain and wind interrupting recording. Higher call rates in September could be attributed to increased density of bats local to the area (e.g., Yuma myotis) since young would be volant by that time. The Sunshine Wind Park site is close to 2 known cave roosts. A Townsend’s big-eared bat roost is < 7 km from the site, and an Allen’s lappet-browed bat roost is within 20 km (B. Solvesky and C. Chambers, Northern Arizona University School of Forestry, unpublished data from bat roost surveys in northern Arizona). Allen’s lappet-browed bats can travel distances of 40 to 60 km nightly so could access the proposed Wind Park site. This species is not federally listed, but is a species of concern for 2 agencies (U.S. Fish and Wildlife Service and U.S. Forest Service, Region 3). Allen’s lappet-browed bat did use the wind park site during 2006 and was recorded 3 times (at 2 locations, during 2 months). Allen’s lappet-browed bat may have occurred more commonly, but their low echolocation calls make them difficult to detect acoustically. I did not detect Townsend’s big-eared bats acoustically, but they are also difficult to record and capture. Both Allen’s lappet-browed and Townsend’s big-eared bats are not commonly captured (they are adept at avoiding capture by netting and their echolocation calls are not easy to record). More effort might result in higher detection rates of these species at the Sunshine Wind Park site. The bat community at the proposed Sunshine Wind Park site is probably richer than I have described given sampling restrictions (one season only, equipment problems during some months). I confirmed presence of 8 species, and likely 9 (big brown bat). Two were migratory species (hoary bat, Mexican free-tailed bat), 1 was a long-distance forager (Allen’s lappet-browed bat). Known roosts for Townsend’s big-eared bat and Allen’s lappet-browed bat may elevate the risk of harm to these species; however, the risk is unknown at this time. Scope and limitations Netting in the Southwest is a very effective method of determining species presence, and can also provide an index of activity with calculation of capture rate. I was only able to mist net 1 site because the area was dry in spring and early summer. This water dried up by early June. It is rarely effective to capture bats without setting nets over water. This was also a difficult site to net, since the pond I used was large and hard to cover the surface area with nets. This could have reduced capture success. After late July, there were many ponds available in the area; all too
10
Bat Survey Sunshine Wind Park March 13, 2007
large to net however. During other (drier) years, netting multiple ponds in the area would provide much better data on the bat community. Data gathered using passive acoustic methods can be limiting because many species of bats in the southwest cannot be identified to species by their call. In addition, equipment may fail and many days of data lost without knowing a problem exists unless sites are checked frequently. Because bats fly at different heights, and probably migrate well above ground level, acoustic equipment should be placed at multiple heights above ground. In this survey, I placed equipment just above ground level (e.g., 1 m). Monitoring bat calls at heights that wind turbines move would provide a more accurate representation of bats likely to be affected by wind parks. Annual variability in bat populations is well documented (e.g., Fenton 1997, Seidman and Zabel 2001). A one-year study of a bat community is unlikely to be adequate in describing the community, especially given the complexity of the bat community in Arizona and the Southwest. Recommendations for Additional Study
1. Use multiple techniques (e.g., mist netting, passive and active acoustic monitoring) for surveying in areas such as the Southwest where bat species richness is high.
2. Repeat surveys for bats at any site proposed for wind development prior to construction. Surveys should be conducted for multiple years.
3. Set passive acoustic monitoring equipment at multiple heights to detect activity in areas where turbines will be active.
Post-Construction Monitoring 1. Currently there are no operational commercial scale wind projects in Arizona. The
Sunshine Wind Park may be the first large scale Arizona wind energy project to become operational. As such, valuable information will be gained from a minimum one-year monitoring study that is designed to estimate bat mortality. In the event that bat mortality levels are significantly greater than other western wind projects, consideration should be made to conduct studies designed to investigate the effectiveness of mitigations measures such as turbine management and or tower height options to reduce mortality.
11
Bat Survey Sunshine Wind Park March 13, 2007
LITERATURE CITED American Society of Mammalogists. 1998. Guidelines for the capture, handling, and care of
mammals as approved by The American Society of Mammalogists. Journal of Mammalogy 79:1416-1431.
Anthony, E. L. P. 1982. Age determination in bats. Pp. 47-58 in Ecology of Bats. (T. H. Kunz,
ed.) Plenum Press, New York, New York. Arnett, E. B., W. K. Brown, W. P. Erickson, J. K. Fiedler, B. L. Hamilton, T. H. Henry, A. Jain,
G. D. Johnson, J. Kerns, R. R. Koford, C. P. Nicholson, T. J. O’Connell, M. Piorkowski, and R. D. Tankersley, Jr. Patterns of bat fatalities at wind energy facilities in North America. In preparation for Journal of Wildlife Management.
Barclay, R. M. R., E. F. Baerwald, and J. C. Gruver. 2006. The influence of turbine size on
mortality of bats and birds at North American wind farms. Abstract. 36th North American Symposium on Bat Research, 18-21 October 2006, Wilmington, North Carolina.
Constantine, D.G. 1957. Color variation and molt in Tadarida brasiliensis and Myotis velifer.
Journal of Mammalogy 38:461-466. Cryan, P. M. 2003. Seasonal distribution of migratory tree bats (Lasiurus and Lasionycteris) in
North America. Journal of Mammalogy 84:579-593. Cryan, P. M., M. A. Bogan, R. O. Rye, G. P. Landis, and C. L. Kester. 2004. Stable hydrogen
isotope analysis of bat hair as evidence for seasonal molt and long-distance migration. Journal of Mammalogy 85:995-1001.
Fenton, M. B. 1997. Science and the conservation of bats. Journal of Mammalogy 78:1-14. Hinman, K. E., and T. K. Snow. Eds. 2003. Arizona Bat Conservation Strategic Plan. Nongame
and Endangered Wildlife Program Technical Report 213. Arizona Game and Fish Department, Phoenix, Arizona.
Kunz, T.H., and A. Kurta. 1988. Capture methods and holding devices. Pp. 1-28 in Ecological
and behavioral methods for the study of bats. (T. H. Kunz, ed.). Smithsonian Institution Press, Washington, D. C.
Meehan, T. D., J. T. Giermakowski, and P. M. Cryan. 2004. GIS-based model of stable hydrogen
isotope ratios in North American precipitation for use in animal movement studies. Isotopes in Environmental and Health Studies 40:291-300.
Rabe, Michael J. 1999. Bat habitat use in pinyon-juniper woodland and grassland habitats in
northern Arizona. Northern Arizona University, Flagstaff. M.S. Thesis.
12
Bat Survey Sunshine Wind Park March 13, 2007
Quay, W.B. 1970. Integument and derivatives. Pp. 1-56 In Biology of bats, W.A. Wimsatt, ed. Academic Press, New York.
Seidman, V. M. and C. J. Zabel. 2001. Bat activity along intermittent streams in northwestern
California. Journal of Mammalogy 82:738-747. Tuttle, S. R., C. L. Chambers, and T. C. Theimer. 2006. Potential effects of livestock water-
trough modifications on bats in northern Arizona. Wildlife Society Bulletin 34:602-608.
13
Table 1. Bat species of northern Arizona, status, and effective survey methods (mist netting or acoustic methods using Anabat or other bat echolocation detector) (Western Bat Working Group, http://www.wbwg.org/survey_matrix.htm#KEY). Species that are known to migrate are designated (M); those that travel long (>60 km/night) distances (L), and those that are listed as sensitive or of concern (C; Hinman and Snow 2003). Travel distances and migratory status are not known for many species. Frequency groups were 50k (>50 kHz calls), 40k (50 – 40 kHz calls), 25k (35 – 20 kHz calls), and 20k (<20 kHz calls) If bats were detected by the surveys conducted at Sunshine Wind Park, they were denoted by C for captured and A for acoustic detection. A? indicates presence of the species is likely as detected acoustically. Survey Method 1 Frequency Detected Mist Passive Active Group at Sunshine Species Scientific name Netting Acoustic Acoustic (kHz range) Wind Park Spotted bat (L, C) Euderma maculatum 3 2 1 20k Greater western mastiff bat (C) Eumops perotis 3 1 1 20k Allen's lappet-browed bat (L, C) 2, 3 Idionycteris phyllotis 3 2 2 20k A Big free-tailed bat (M) Nyctinomops macrotus 3 1 1 20k Pallid bat Antrozous pallidus 1 2 1 25k C, A Townsend's big-eared bat (C) 4 Corynorhinus townsendii 3 4 4 25k Big brown bat Eptesicus fuscus 1 3 1 25k A? Silver-haired bat (M) Lasionycteris noctivagans 1 4 2 25k Hoary bat (M) Lasiurus cinereus 3 2 1 25k C Southern yellow bat (M) Lasiurus xanthinus 3 2 1 25k Mexican free-tailed bat (M) Tadarida brasiliensis 2 1 1 25k C Western red bat (M, C) 2 Lasiurus blossevillii 3 2 1 40k Southwestern myotis Myotis auriculus 1 U U 40k Western small-footed myotis 3 Myotis ciliolabrum 2 4 4 40k Long-eared myotis 3 Myotis evotis 1 2 2 40k Arizona myotis 3 Myotis occultus 2 4 4 40k Fringed myotis 3 Myotis thysanodes 1 2 2 40k C, A Cave myotis 3 Myotis velifer 2 3 3 40k Long-legged myotis 3 Myotis volans 2 4 3 40k California myotis Myotis californicus 1 3 1 50k C, A
Bat Survey Sunshine Wind Park March 13, 2007
Yuma myotis 3 Myotis yumanensis 1 3 1 50k C, A Western pipistrelle Pipistrellus hesperus 2 1 1 50k A 1 1 = preferred or highly effective, 2 = effective in most habitats, 3 = effective in some habitats, 4 = presents serious challenges, U = Unknown 2 Forest Service Sensitive Species, Region 3. Sensitive Species List. Proposed for listing. 3 U.S. Fish & Wildlife Service, Species of Concern. 4 The World Conservation Union conservation status for this species is VU:A2, meaning vulnerable, threshold levels of population reduction predicted for the future.
15
Bat Survey Sunshine Wind Park March 13, 2007
Table 2. Bats captured by mist netting at a pond at the proposed Sunshine Wind Park site in April and May 2006. Individuals were identified to species, and time of capture, sex, reproductive condition (Repro; N = non reproductive, S = scrotal, P = pregnant), whether the animal had a keeled calcar (= Yes), length of ear, forearm (FA), and thumb, and weight (Wt) taken. Bats known to be migratory are in bold. As bats were released, a recording of their echolocation calls was taken when possible, and the file identifier noted in Comments section. Since California (Myotis californicus) and western small-footed myotis (M. ciliolabrum) are often indistinguishable in the hand, echolocation calls distinguish these species (California myotis echolocates at 50 kHz; western small-footed myotis at 40 kHz). The call for the California myotis captured on May 25-26 identified the captured bat as a California myotis (50 kHz call). Date Military Ear FA Thumb Species Time Sex Repro Keeled (mm) (mm) (mm) Wt (g) Comments April 26-27 Hoary bat 20:00 F N -- -- -- -- 26 Could not fly after capture,
euthanized Pallid bat 20:20 M S -- -- -- -- 16 Anabat file G4262028.23, .39 Pallid bat 20:50 F N -- -- -- -- 15.5 Fringed myotis 23:58 F P -- 14 42 -- 8 May 25-26 Yuma myotis 20:35 F P -- 13 34.8 -- 5 Anabat file G5252055.40 Mexican free-tailed bat 21:40 M N -- -- 32.9 4.7 12 California myotis 22:25 F N Yes -- 4 Anabat file G5252245.27 Yuma myotis 02:19 F P -- 13 34.6 -- 6 Anabat files G5260228.21 and
G5260229.20; same bat as 20:35 capture
16
Table 3. Passive Anabat sampling results for 2 sites at Sunshine Wind Park (Netting Tank and Met Tower) with comparison to a site in ponderosa pine (Pinus ponderosa) forest near Flagstaff (Ft Valley). Sites were sampled in 2006. Number of nights sampled is the number of nights passive Anabat units were placed at each site, effective number of nights sampled is the number of nights that data were recorded (bat calls were prevented from being recorded by heavy rain or wind on some nights). Number of files recorded includes all files recorded (e.g., bat, insect, rain, wind). Number of calls per hour is the call rate of bats recorded during each month at each site. Average call rate is the average number of calls per hour per site (across all months). Effective Number Total Total call Average # Nights # nights of files # Calls rate call rate Location Month sampled sampled Recorded (# calls/hr) (# calls/hr) (# calls/hr) Sunshine Wind Park Netting Tank Jun 2 0 3 -- -- Jul 8 4 1370 13 0.34 Aug 4 0 5137 -- -- Sep 6 6 214 205 2.85 Oct/Nov 6 6 38 22 0.27 1.26 Met Tower Jun 2 0 0 -- -- Jul 8 4 1351 2 0.05 Aug 4 3 10 3 0.10 Sep 6 6 507 499 6.93 Oct/Nov 6 6 43 4 0.05 2.23 Ft Valley, Flagstaff Jul 36 36 -- 637 1.79 Aug 36 36 -- 354 0.96 1.37
Bat Survey Sunshine Wind Park March 13, 2007
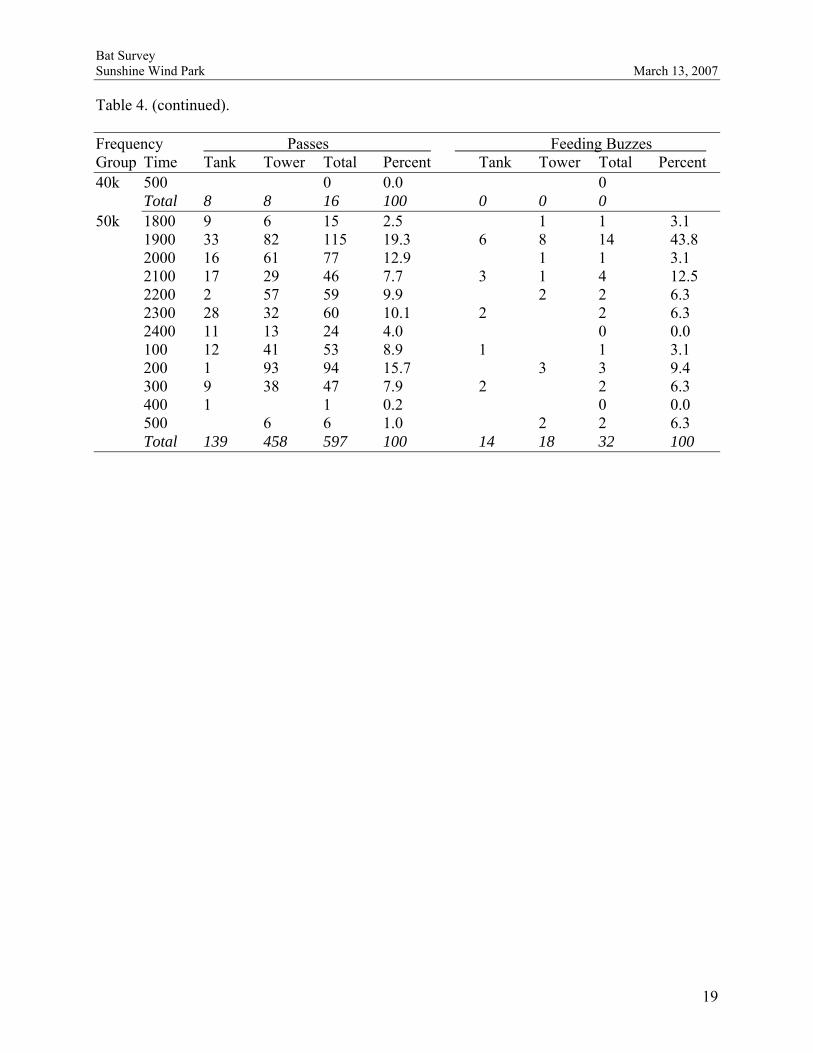
Table 4. Number and percent of calls (passes and feeding buzzes) for 4 frequency groups (20k = <20 kHz calls, 25k = 35 to 20 kHz calls, 40k = 50 to 40 kHz calls, 50k = >50kHz calls; for bat species in each group, see Table 1) recorded Jul – Oct/Nov 2006 at 2 locations (Tank = netting tank, Tower = Met Tower) at the Sunshine Wind Park site. Data represent 19 recording nights. Calls were sorted by 24-hr time in 1 hr blocks (e.g., 1800 includes all calls between 1800 and 1859). Frequency Passes Feeding Buzzes Group Time Tank Tower Total Percent Tank Tower Total Percent 20k 1800 0 0 0 1900 0 0 0 2000 2 2 66.7 0 0 2100 0 0 0 2200 0 0 0 2300 1 1 33.3 0 0 2400 0 0 0 100 0 0 0 200 0 0 0 300 0 0 0 400 0 0 0 500 0 0 0
Figure 1. Earthen pond used for mist-netting bats at Sunshine Wind Park. A. Setting up mist nets when water levels were relatively low (25 May 2006). This pond was dry by June and through most of July. B. The pond filled to near the top of the berm during a weekend monsoon event in late July (photo 8 August 2006) and was too full to net through the rest of the study period. Both photos taken from west side of pond looking east. A. B.
Bat Survey Sunshine Wind Park March 13, 2007
21
Bat Survey Sunshine Wind Park March 13, 2007
Figure 2. Bats captured by mist netting at an earthen pond at the Sunshine Wind Park site, April and May, 2006. A. California myotis (Myotis californicus), B. Yuma myotis (M. yumanensis), C. Mexican free-tailed bat (Tadarida brasiliensis), D. hoary bat (Lasiurus cinereus), E. pallid bat (Antrozous pallidus). A.
C.
B.
22
Bat Survey Sunshine Wind Park March 13, 2007
D. E.
23
Bat Survey Sunshine Wind Park March 13, 2007
Figure 3. Stable hydrogen isotope ratio of water (δD) for growing-season precipitation in North America (Meehan et al. 2004). The δD signature for the hoary bat captured in April at the Sunshine Wind Park site was -105.7 ‰, indicating this animal was migratory and probably spent the previous summer in the northern Rocky Mountains or Canada.
24
Bat Survey Sunshine Wind Park March 13, 2007
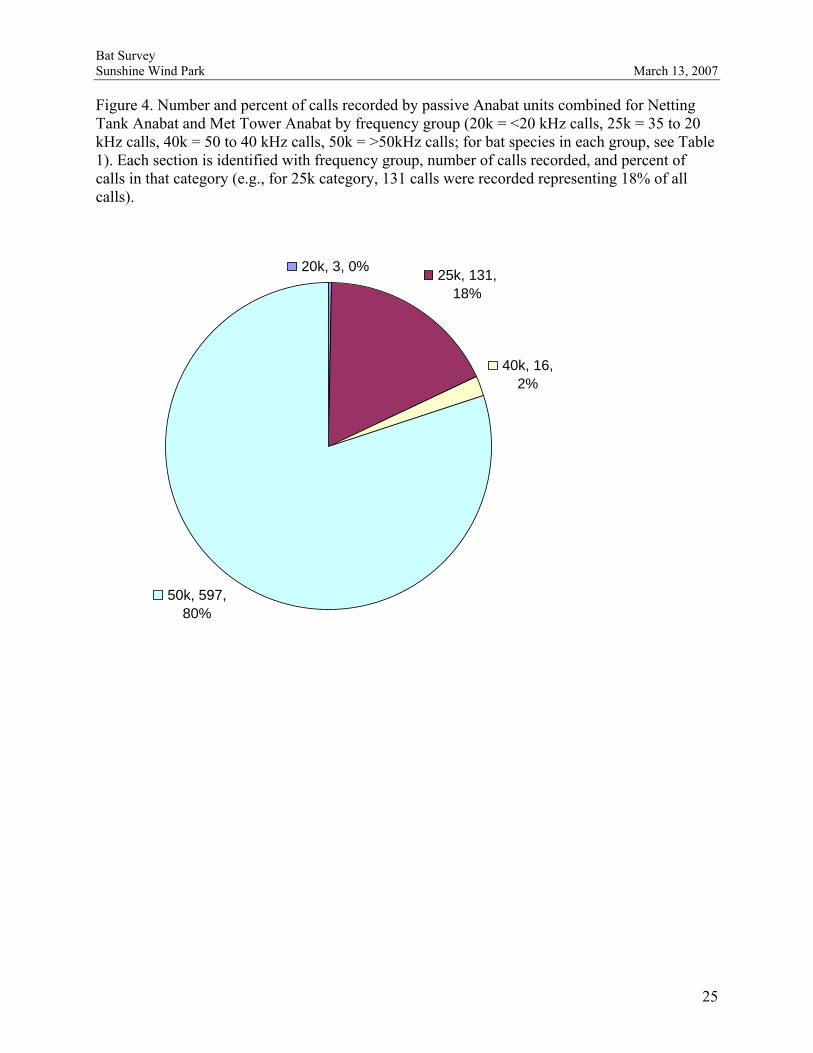
Figure 4. Number and percent of calls recorded by passive Anabat units combined for Netting Tank Anabat and Met Tower Anabat by frequency group (20k = <20 kHz calls, 25k = 35 to 20 kHz calls, 40k = 50 to 40 kHz calls, 50k = >50kHz calls; for bat species in each group, see Table 1). Each section is identified with frequency group, number of calls recorded, and percent of calls in that category (e.g., for 25k category, 131 calls were recorded representing 18% of all calls).
20k, 3, 0% 25k, 131, 18%
40k, 16, 2%
50k, 597, 80%
25
Bat Survey Sunshine Wind Park March 13, 2007
Figure 5. Distribution for calls recorded by passive Anabat detectors by species for 2 sites combined (Netting Tank Anabat and Met Tower Anabat). A. 25k frequency group with 124 calls (could include pallid bat, Townsend’s big-eared bat, big brown bat, silver-haired bat, hoary bat, southern yellow bat, and Mexican free-tailed bat; for scientific names, see Table 1) and B. 50k frequency group with 594 calls (could include California myotis, Yuma myotis, and western pipistrelle). Because California and Yuma myotis calls can be very similar, a combined category (California/Yuma myotis) was included when calls could not be distinguished to species. Calls that could not be identified were labeled unknown. Sections of each pie chart are identified with species, number of calls recorded, and percent of calls in that category (e.g., for pallid bat category, 10 calls were recorded representing 8% of calls). A.
pallid bat, 10, 8%
big brown bat, 1, 1%
Mexican free-tailed bat, 9,
7%
unknown, 104, 84%
B.
California myotis, 9, 2%
Yuma myotis, 292, 49%
western pipistrelle, 18,
3%
California/Yuma myotis, 137,
23%
unknown, 138, 23%
26
Bat Survey Sunshine Wind Park March 13, 2007
Appendix 1. Samples of echolocation calls recorded at Sunshine Wind Park in 2006. A. Call of California myotis at release that had been captured by mist netting 25 May 2006, 22:25 hr (file G5252245.27).
B. Call of fringed myotis recorded by passive Anabat at Netting Tank, 25 September 2006, 20:25 hr (file G9252025.03).
27
Bat Survey Sunshine Wind Park March 13, 2007
C. Call of Allen’s lappet-browed bat recorded at Met Tower 1 August 2006, 20:22 hr (file G8012022.16).
. D. Call of Allen’s lappet-browed bat recorded at Netting Tank 29 September 2006, 23:16 hr (file G9292316.48).
28
Bat Survey Sunshine Wind Park March 13, 2007
E. Call of western pipistrelle recorded by passive Anabat at Met Tower, 26 September 2006, 18:49 hr (file G9261849.40).
F. Call of Yuma myotis recorded by passive Anabat at Met Tower, 30 September 2006, 02:07 hr (file G9300207.20).
29
Bat Survey Sunshine Wind Park March 13, 2007
Appendix 2. Abstract on effects of wind turbines on bats. The influence of turbine size on mortality of bats and birds at North American wind farms. Robert M. R. Barclay, Erin F. Baerwald, and Jeffery C. Gruver, Biological Sciences, University of Calgary, Calgary, AB, Canada. ABSTRACT. 36th North American Symposium on Bat Research, 18-21 October 2006, Wilmington, North Carolina. Originally, concerns regarding wildlife at wind farms focused on mortality of birds. More recently, mortality of migratory bats has become an issue at some wind farms. One hypothesis to explain the apparent increase in mortality of migratory bats is the increase in size of wind turbines over the years. Larger diameter rotors may kill more bats per turbine, or taller turbines may extend further into the airspace traveled by migrating bats. To test these hypotheses, we compiled data from published and unpublished reports regarding bat and bird mortality at 30 wind energy sites in North America. When we corrected mortality rates for variation in the rotor-swept-area, mortality of birds did not vary significantly with turbine tower height. However, there was a significant exponential increase in bat mortality per turbine as turbine height increased. Bat mortality was uniformly low at turbines with towers shorter than 60 m. At turbine towers taller than 60 m, some wind farms had high mortalities while others did not. These results reflect the fact that radar studies find migrating birds and bats primarily higher than 100 m above the ground. However, they do not explain why bats are killed at higher rates than birds at tall turbines, or why mortality rate varies among sites with tall turbines. Ongoing studies will hopefully indicate what landscape and temporal variables influence bat mortality and provide potential solutions.