Black 1997 Economic Census Survey of Minority-Owned Business Enterprises Company Statistics Series 1997 Issued March 2001 EC97CS-3 U.S. Department of Commerce Economics and Statistics Administration U.S. CENSUS BUREAU
Transcript
Black
1997 Economic Census
Survey of Minority-Owned Business Enterprises
Company Statistics Series
1997Issued March 2001
EC97CS-3
U.S. Department of CommerceEconomics and Statistics Administration
U.S. CENSUS BUREAU
Many persons participated in the variousactivities of the 1997 Surveys of Minority-and Women-Owned Business Enterprises.
The Company Statistics Division preparedthis report. Ruth A. Runyan, AssistantChief for Surveys and Programs, wasresponsible for the overall planning, man-agement, and coordination. Planning andimplementation were under the directionof Eddie J. Salyers, Chief, EconomicCensus Branch, assisted by Valerie C.Strang, Section Chief. Primary staff assis-tance was provided by Melody Atkinson,Ahmad Bakhshi, Lori Bowan,Trey Cole, Elaine Emanuel, BarbaraEsworthy, Mary Frauenfelder, GeoffreyHill, James Jarzabkowski, DurwinKnutson, James McFarland, SungsooOh, and John Seabold.
General direction for statistical methodol-ogy was provided by Ruth Detlefsen,Assistant Chief for Research and Methodol-ogy (until October 1998); Carol Caldwell,her successor; and Mark Sands, Chief,Statistical Research and Methods Branch.Richard Moore developed the sampledesign, imputation, estimation andvariance methodology, with assistancefrom Lieu Galvin, David Harville, andSteven Klement.
The Economic Statistical Methods andProgramming Division, Charles P.Pautler Jr., Chief, assisted by Martin S.Harahush, Assistant Chief for Quinquen-nial Programs, developed and imple-mented computer processing systems.Steven G. McCraith, Chief, QuinquennialSurveys Branch, and Gary Sweetland,Chief, Mailout and Data Collection Branch,supervised the preparation of computerprograms. Thaddeus S. Hess, Joseph F.Keehan, and Daniel A. Vacca wereassigned primary programming responsi-bilities with assistance from John D.Bedwell, Edward F. Carr, Jr., DianeConley, Phuong-Dung T. Diep,Steve Jarvis, Sheila Koonce, John E.McCormick, Robert A. Penrod,Linda Raley, Mark H. Ratti,
Jerry W. Richards, and Michele Shelby.Robert S. Jewett and Barbara L.Lambert provided special computerprocessing.
The staff of the National Processing Center,Judith N. Petty, Chief, performed mailoutpreparation and receipt operations, clericaland analytical review activities, and dataentry.
The staff of the Decennial Systems andContract Management Office, AlanBerlinger, Chief, was responsible foroverseeing the electronic data captureoperation.
The Computer Services Division, Debra D.Williams, Chief, performed the computerprocessing.
Kim D. Ottenstein, Bernadette J.Gayle, Helen M. Curtis, and Laurene V.Qualls of the Administrative andCustomer Services Division, Walter C.Odom, Chief, provided publications andprinting management, graphics designand composition, and editorial review forprint and electronic media. Generaldirection and production managementwere provided by Michael G. Garland,Assistant Chief, and Gary J. Lauffer,Chief, Publications Services Branch.
The overall planning and review of thecensus operations were performed by thestaff of the office of the Assistant Directorfor Economic and Agriculture Censuses.
This survey depended upon the coopera-tion of the staffs of the Internal RevenueService and the Social Security Administra-tion. Thanks are due to Daniel F. Skelly,Director, Statistics of Income Division,Karen Cys, Nick Greenia, and KenSzeflinski of the Internal Revenue Ser-vice; Frank Thomas of the Social SecurityAdministration; and Roberta Custard,Paul Hanczaryk, and Edward D. Walkerof the Census Bureau, who coordinatedactivities with the agencies.
If you have any questions concerningthe statistics in this report, call301-457-3316.
ACKNOWLEDGMENTS
Black
1997 Economic Census
Survey of Minority-Owned Business Enterprises
Company Statistics Series
1997Issued March 2001
EC97CS-3
U.S. Department of CommerceDonald L. Evans,
Secretary
Economicsand Statistics
AdministrationJ. Lee Price,
Acting Under Secretary forEconomic Affairs
U.S. CENSUS BUREAUWilliam G. Barron, Jr.,
Acting Director
Paula J. Schneider,Principal Associate Directorfor Programs
Frederick T. Knickerbocker,Associate Directorfor Economic Programs
Thomas L. Mesenbourg,Assistant Directorfor Economic Programs
Ewen M. Wilson,Chief, Company StatisticsDivision
For sale by Superintendent of Documents, U.S. Government Printing Office, Washington, DC 20402.
ECONOMICS
AND STATISTICS
ADMINISTRATION
Economicsand StatisticsAdministration
J. Lee Price,Acting Under Secretaryfor Economic Affairs
U.S. CENSUS BUREAU
William G. Barron, Jr.,Acting Director
William G. Barron, Jr.,Deputy Director
CONTENTS
Introduction to the Economic Census 1.............................
Surveys of Minority~ and Women~Owned Business Enterprises 3......
Summary of Findings 9...........................................
FIGURES
1. Black~Owned Firms as a Percent of Total Firms in State: 1997 13.
2. Percent Distribution of All U.S. Firms by Industry Division:1997 14...................................................
3. Percent Distribution of Black~Owned Firms by Industry Division:1997 14...................................................
4. Average Receipts per Firm by Industry Division for Black~Owned Firms Compared to All U.S. Firms: 1997 15............
5. Black~Owned Firms and Receipts as a Percent of All U.S. Firmsand Receipts by Industry Division: 1997 16...................
TABLES
1. Statistics for Black~Owned Firms by Major Industry Group:1997 17...................................................
2. Statistics for Black~Owned Firms by State: 1997 19.............
3. Statistics for Black~Owned Firms by Industry Division forStates: 1997 20...........................................
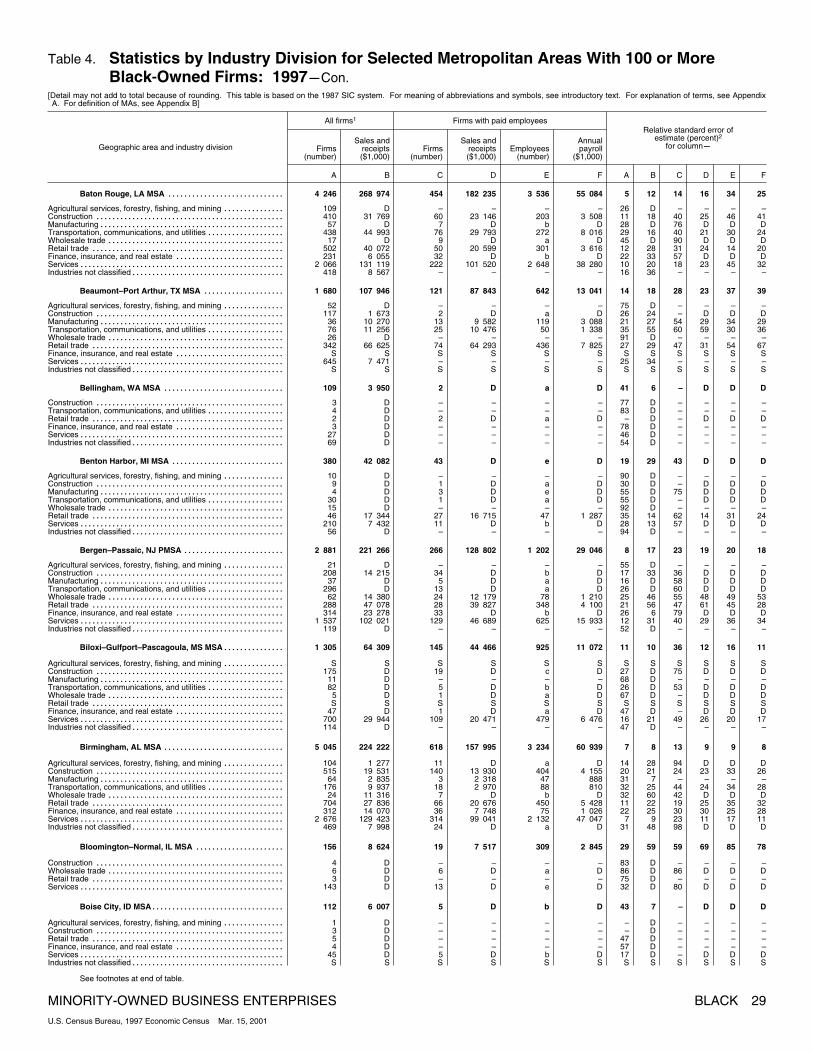
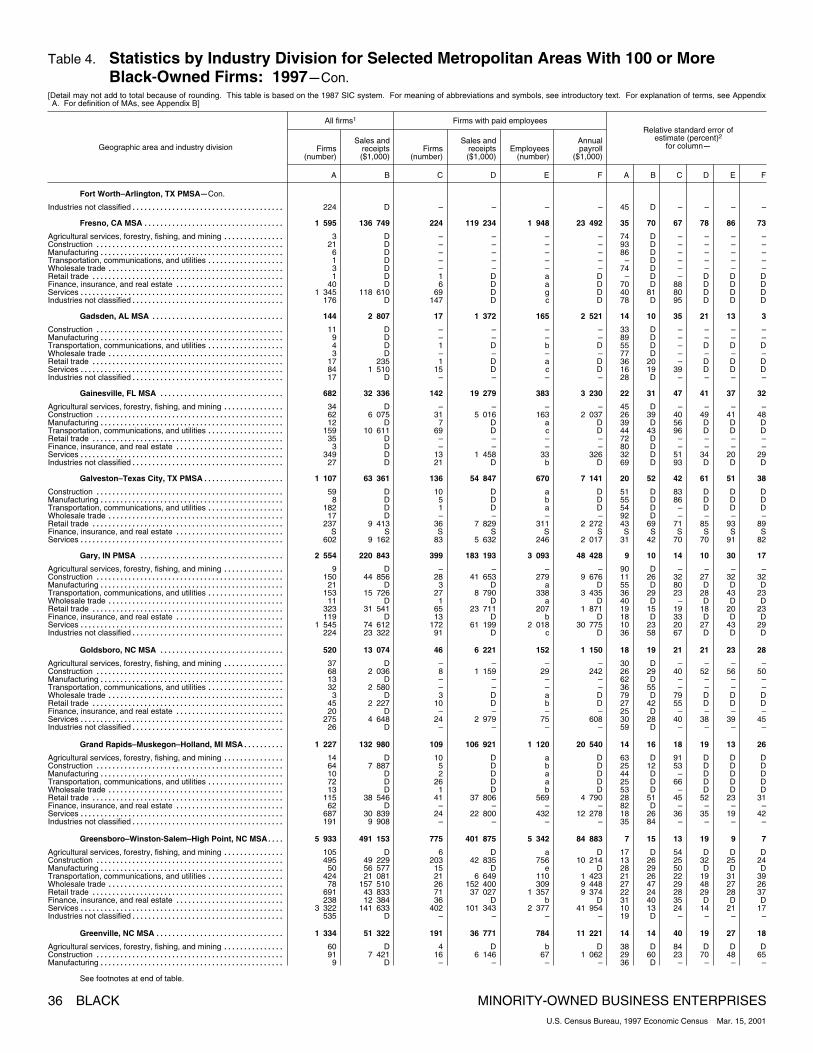
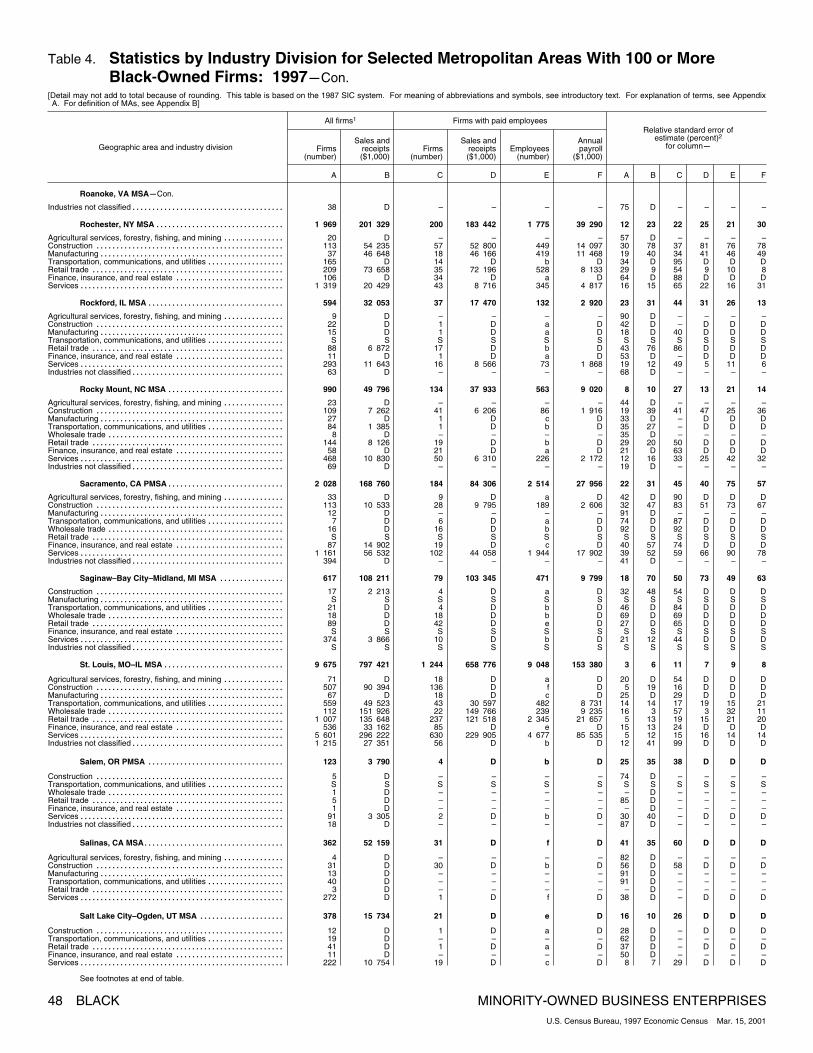
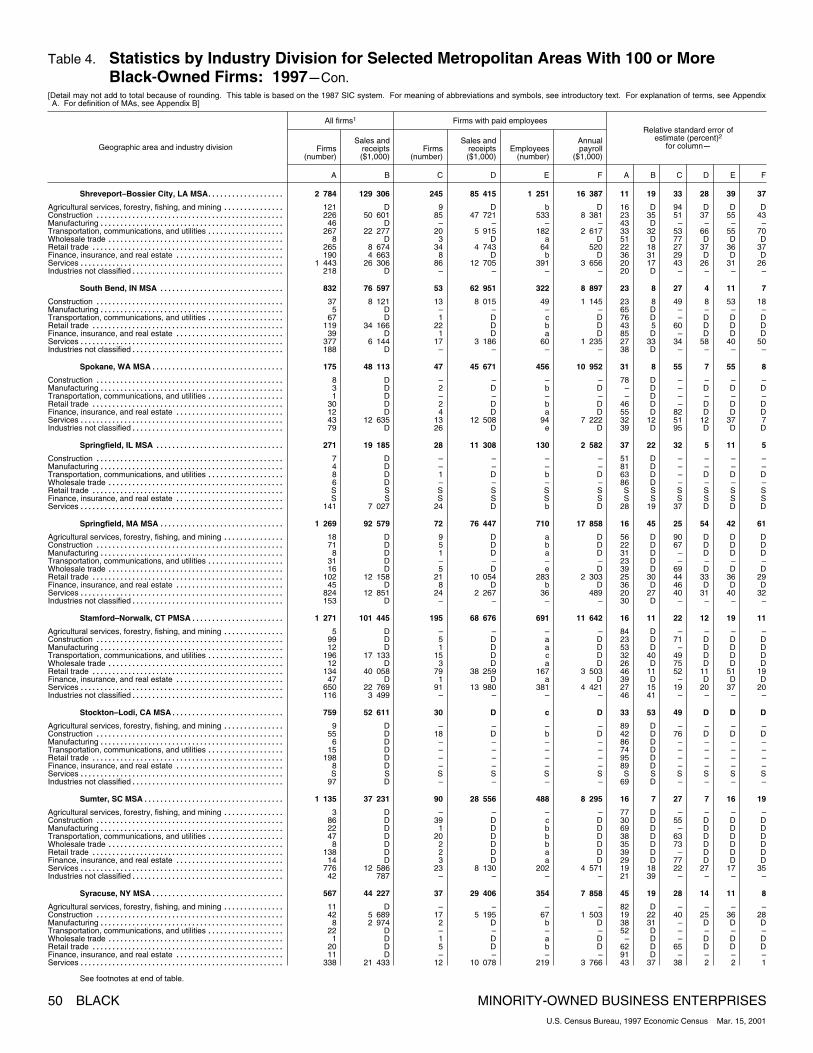
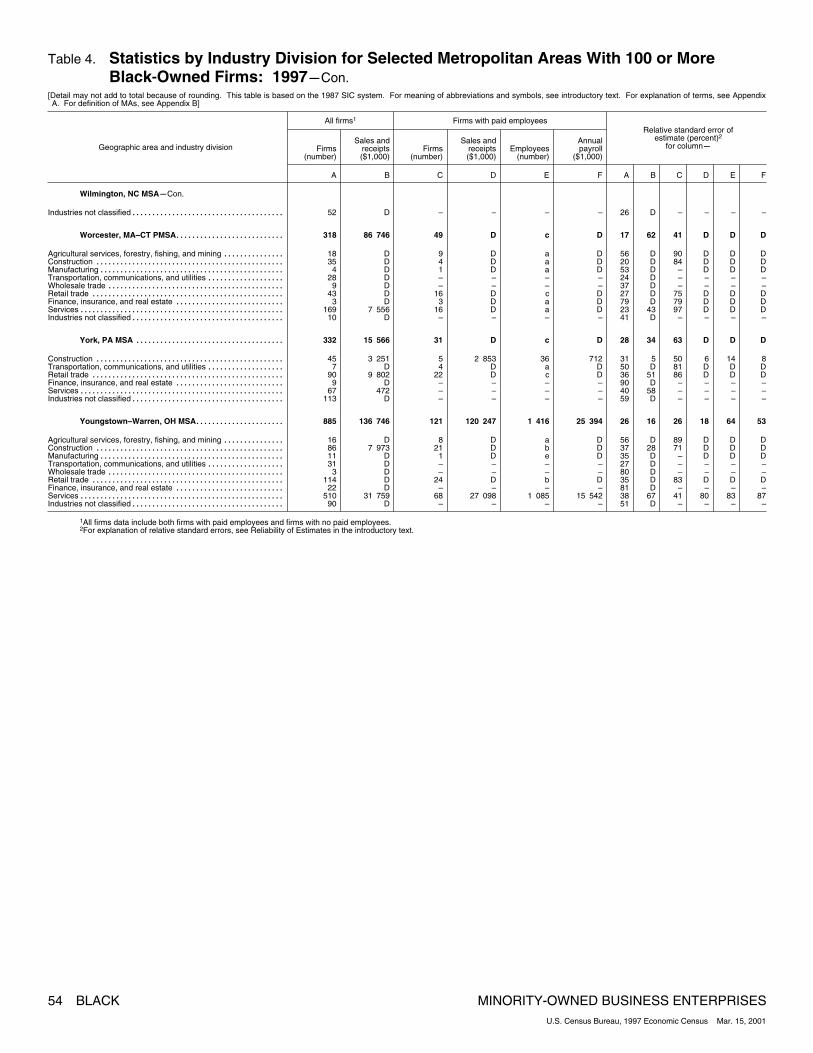
4. Statistics by Industry Division for Selected Metropolitan AreasWith 100 or More Black~Owned Firms: 1997 27................
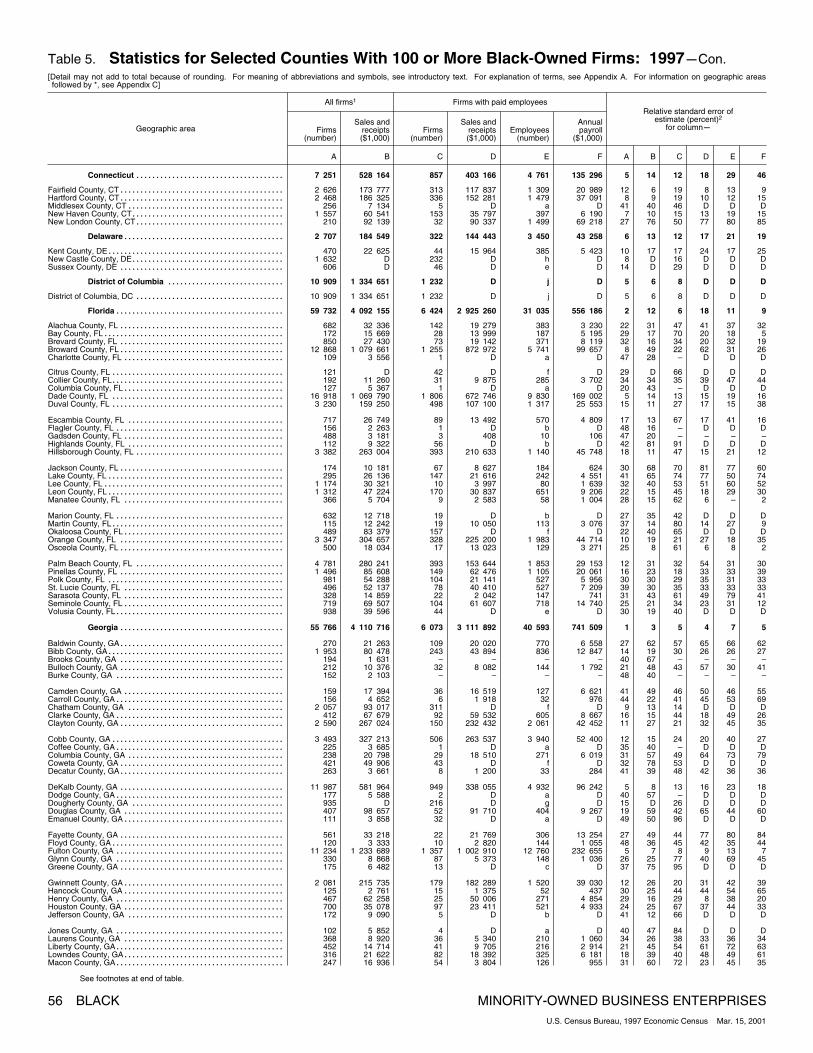
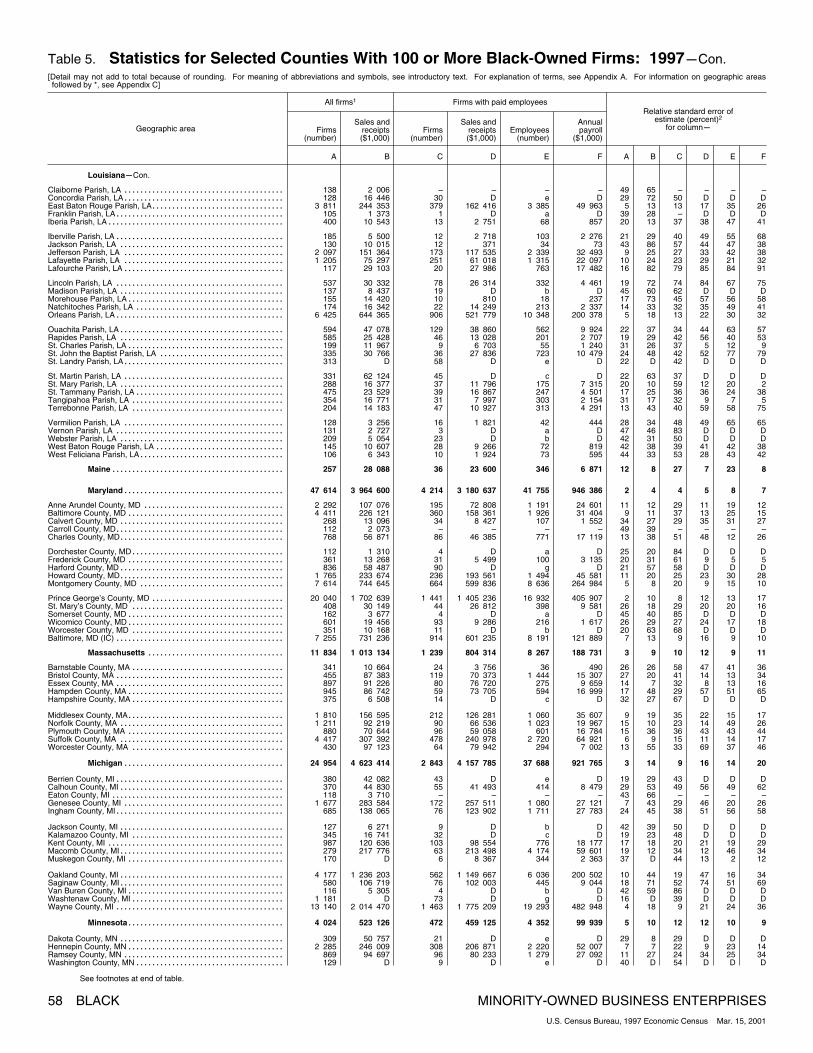
5. Statistics for Selected Counties With 100 or More Black~OwnedFirms: 1997 55............................................
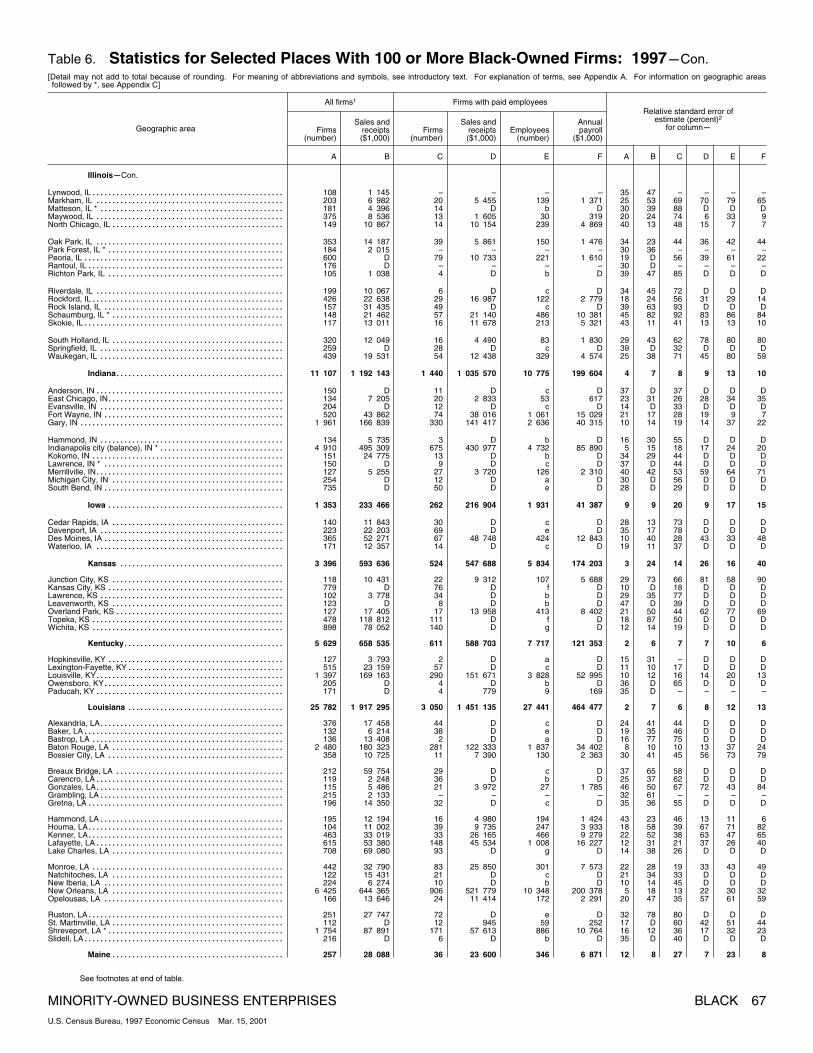
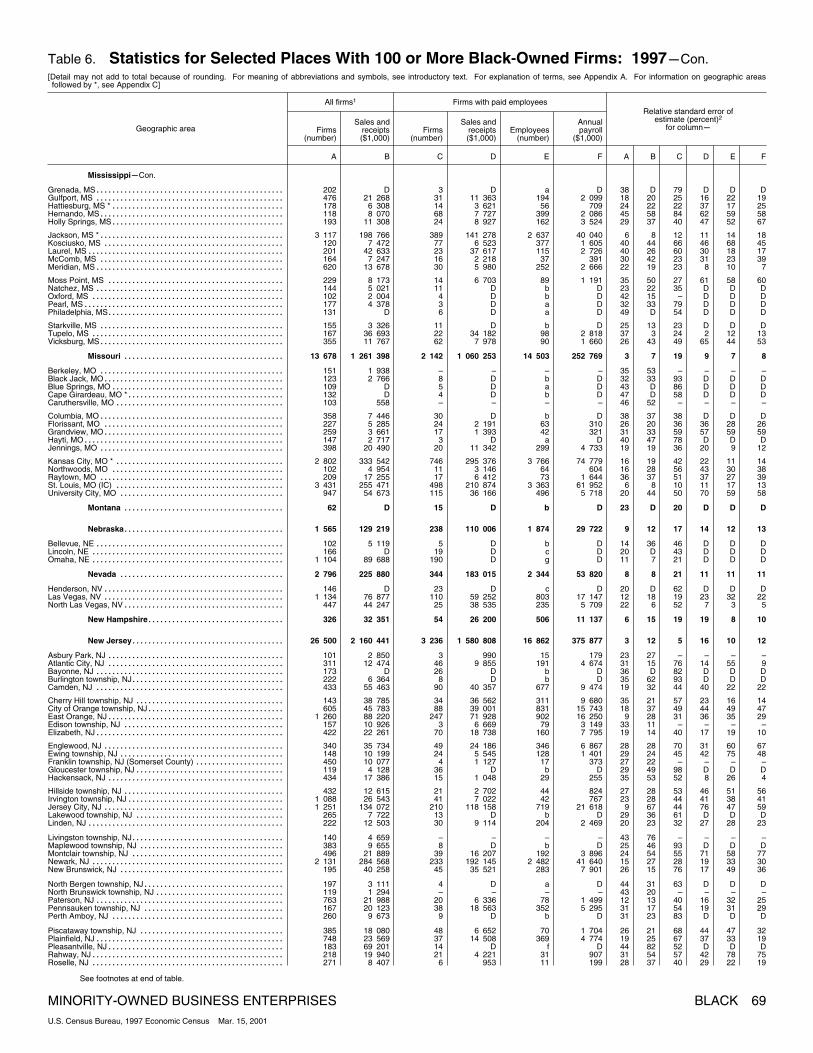
6. Statistics for Selected Places With 100 or More Black~OwnedFirms: 1997 64............................................
7. Statistics for Black~Owned Firms by Industry Division and LegalForm of Organization: 1997 74..............................
8. Statistics for Black~Owned Firms by Industry Division andReceipts Size of Firm: 1997 75..............................
9. Statistics for Black~Owned Firms With Paid Employees byIndustry Division and Employment Size of Firm: 1997 77........
10. Statistics for Black~Owned Firms With No Paid Employees byIndustry Division: 1997 79..................................
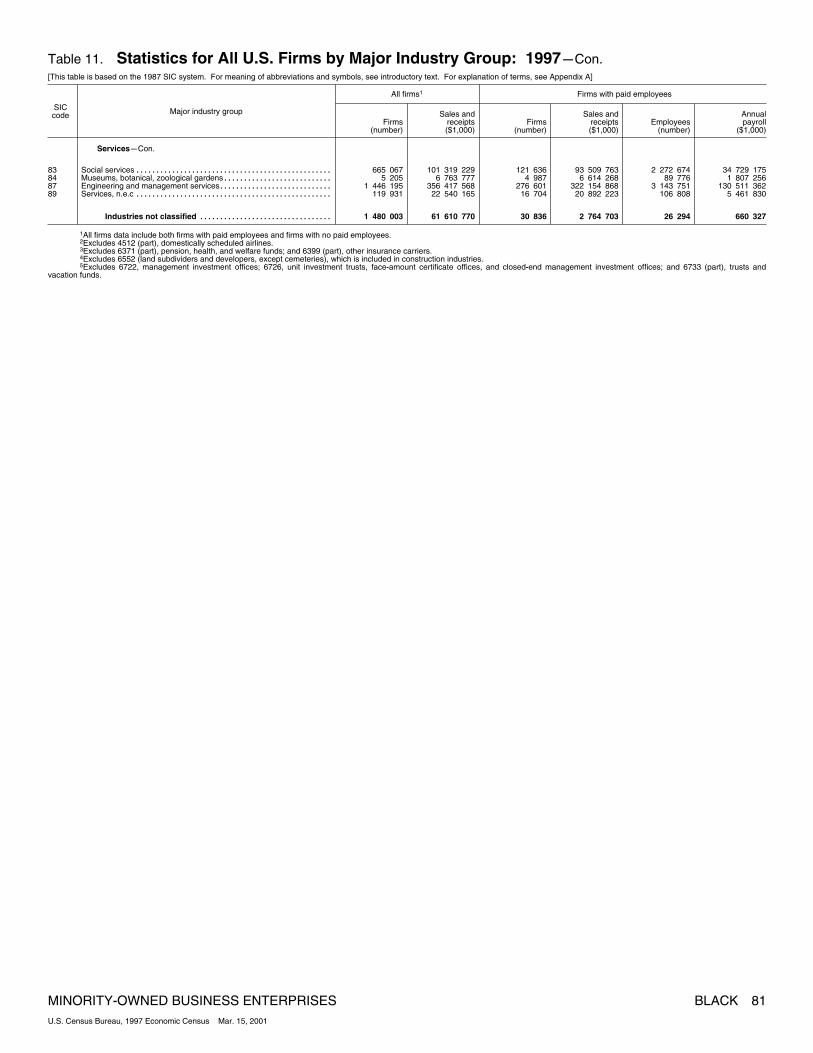
11. Statistics for All U.S. Firms by Major Industry Group: 1997 80....
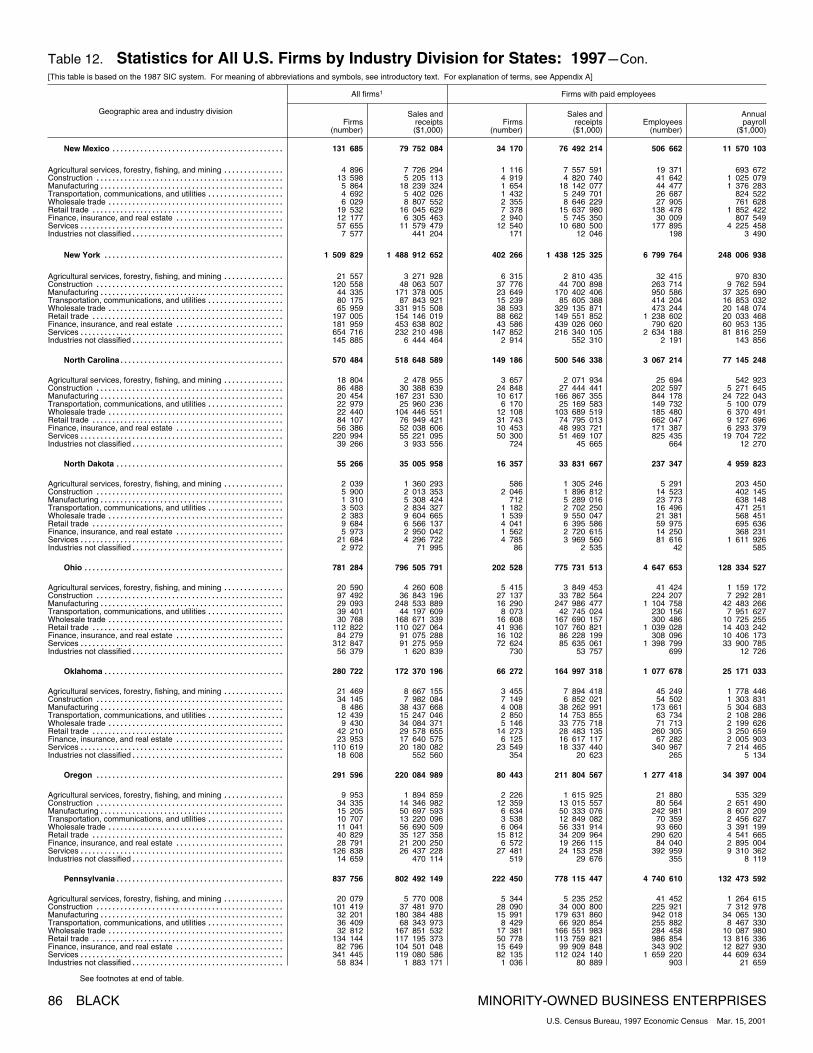
12. Statistics for All U.S. Firms by Industry Division for States:1997 82...................................................
13. Statistics for All U.S. Firms by Industry Division and Legal Formof Organization: 1997 89...................................
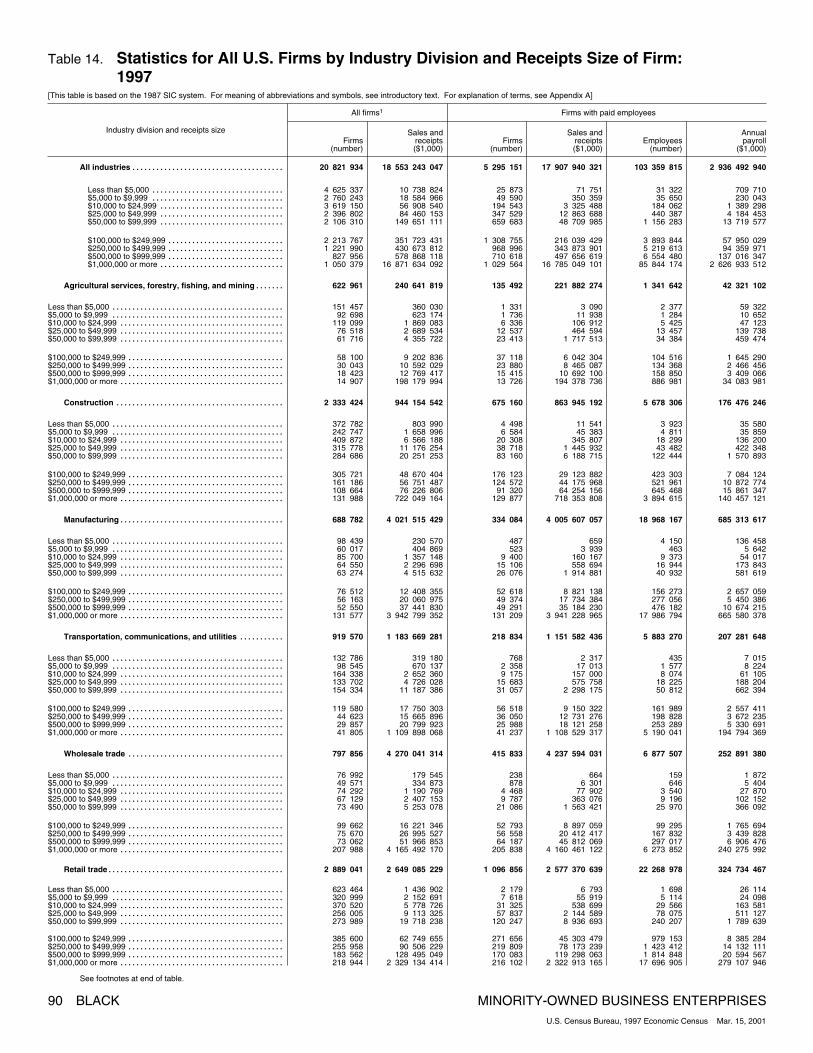
14. Statistics for All U.S. Firms by Industry Division and ReceiptsSize of Firm: 1997 90......................................
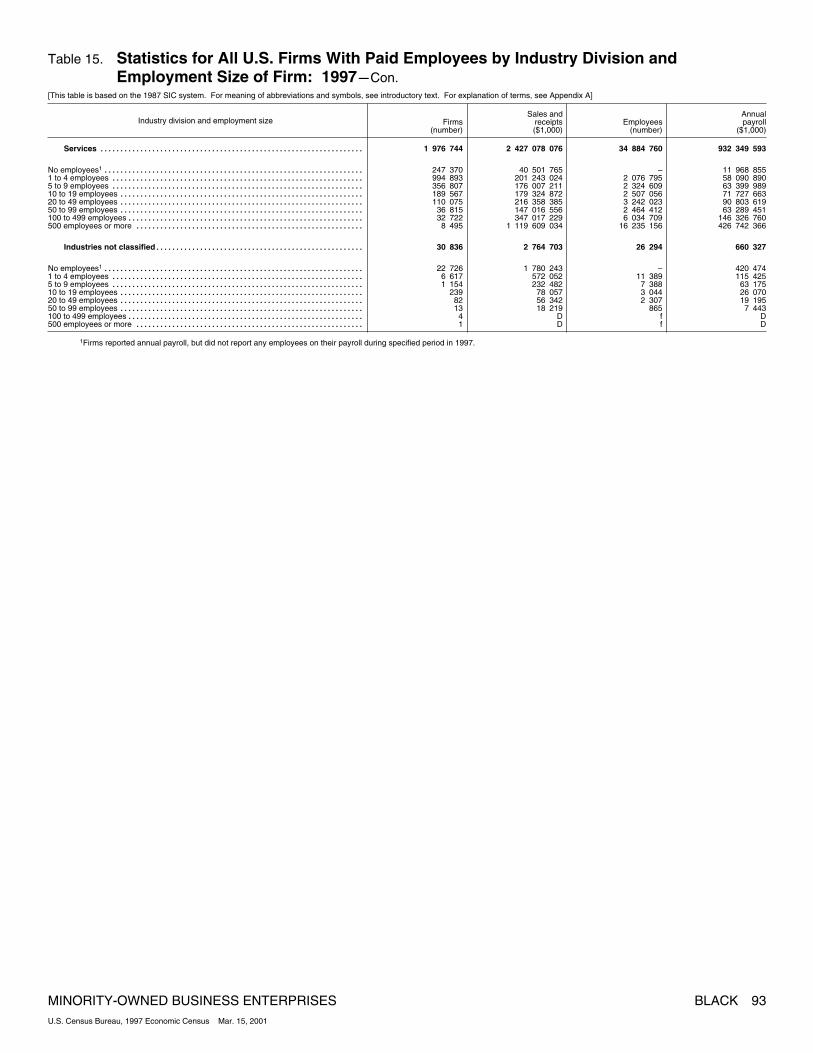
15. Statistics for All U.S. Firms With Paid Employees by IndustryDivision and Employment Size of Firm: 1997 92...............
16. Statistics for All U.S. Firms With No Paid Employees byIndustry Division: 1997 94..................................
MINORITY~OWNED BUSINESS ENTERPRISES BLACK iiiU.S. Census Bureau, 1997 Economic Census Mar. 15, 2001
CONTENTSmCon.
APPENDIXES
A. Explanation of Terms A–1.....................................
B. Metropolitan Areas B–1.......................................
C. Geographic Notes C–1........................................
D. Questionnaires D–1...........................................
PUBLICATION PROGRAMmInside back cover
iv BLACK MINORITY~OWNED BUSINESS ENTERPRISESU.S. Census Bureau, 1997 Economic Census Mar. 15, 2001
Introduction to the Economic Census
PURPOSES AND USES OF THE ECONOMIC CENSUS
The economic census is the major source of facts aboutthe structure and functioning of the Nation’s economy. Itprovides essential information for government, business,industry, and the general public. Title 13 of the UnitedStates Code (Sections 131, 191, and 224) directs theCensus Bureau to take the economic census every 5 years,covering years ending in 2 and 7.The economic census furnishes an important part of the
framework for such composite measures as the grossdomestic product estimates, input/output measures, pro-duction and price indexes, and other statistical series thatmeasure short-term changes in economic conditions. Spe-cific uses of economic census data include the following:
• Policymaking agencies of the federal government usethe data to monitor economic activity and assess theeffectiveness of policies.
• State and local governments use the data to assessbusiness activities and tax bases within their jurisdic-tions and to develop programs to attract business.
• Trade associations study trends in their own andcompeting industries, which allows them to keeptheir members informed of market changes.
• Individual businesses use the data to locate potentialmarkets and to analyze their own production and salesperformance relative to industry or area averages.
GEOGRAPHIC AREA CODING
Accurate and complete information on the physicallocation of each establishment is required to tabulate thecensus data for the states, metropolitan areas (MAs),counties, parishes, and corporate municipalities includingcities, towns, villages, and boroughs. Respondents wererequired to report their physical location (street address,municipality, county, and state) if it differed from theirmailing address. For establishments not surveyed by mail(and those single-establishment companies that did notprovide acceptable information on physical location),location information from Internal Revenue Service taxforms is used as a basis for coding.
BASIS OF REPORTING
The economic census is conducted on an establishmentbasis. A company operating at more than one location isrequired to file a separate report for each store, factory,
shop, or other location. Each establishment is assigneda separate industry classification based on its primaryactivity and not that of its parent company.
DOLLAR VALUES
All dollar values presented are expressed in currentdollars; i.e., 1997 data are expressed in 1997 dollars, and1992 data, in 1992 dollars. Consequently, when makingcomparisons with prior years, users of the data shouldconsider the changes in prices that have occurred.All dollar values are shown in thousands of dollars.
AVAILABILITY OF ADDITIONAL DATA
Reports in Print and Electronic Media
All results of the 1997 Economic Census are availableon the Census Bureau Internet site (www.census.gov) andon compact discs (CD-ROM) for sale by the Census Bureau.Unlike previous censuses, only selected highlights arepublished in printed reports. For more information, includ-ing a description of electronic and printed reports beingissued, see the Internet site, or write to U.S. CensusBureau, Washington, DC 20233-8300, or call CustomerServices at 301-457-4100.
HISTORICAL INFORMATION
The economic census has been taken as an integratedprogram at 5-year intervals since 1967 and before thatfor 1954, 1958, and 1963. Prior to that time, individualcomponents of the economic census were taken sepa-rately at varying intervals.The economic census traces its beginnings to the 1810
Decennial Census, when questions on manufacturing wereincluded with those for population. Coverage of economicactivities was expanded for the 1840 Decennial Censusand subsequent censuses to include mining and somecommercial activities. The 1905 Manufactures Census wasthe first time a census was taken apart from the regulardecennial population census. Censuses covering retailand wholesale trade and construction industries wereadded in 1930, as were some covering service trades in1933. Censuses of construction, manufacturing, and theother business service censuses were suspended duringWorld War II.The 1954 Economic Census was the first census to be
fully integrated: providing comparable census dataacross economic sectors, using consistent time periods,
INTRODUCTION 1MINORITY-OWNED BUSINESS ENTERPRISES
U.S. Census Bureau, 1997 Economic Census
concepts, definitions, classifications, and reporting units.It was the first census to be taken by mail, using lists offirms provided by the administrative records of otherfederal agencies. Since 1963, administrative records alsohave been used to provide basic statistics for very smallfirms, reducing or eliminating the need to send themcensus questionnaires.The range of industries covered in the economic
censuses expanded between 1967 and 1992. The censusof construction industries began on a regular basis in1967, and the scope of service industries, introduced in1933, was broadened in 1967, 1977, and 1987. While afew transportation industries were covered as early as1963, it was not until 1992 that the census broadenedto include all of transportation, communications, andutilities. Also new for 1992 was coverage of financial,insurance, and real estate industries. With these additions,the economic census and the separate census of govern-ments and census of agriculture collectively coveredroughly 98 percent of all economic activity.Printed statistical reports from the 1992 and earlier
censuses provide historical figures for the study of long-term time series and are available in some large libraries.All of the census reports printed since 1967 are still avail-able for sale on microfiche from the Census Bureau.CD-ROMs issued from the 1987 and 1992 EconomicCensuses contain databases including nearly all data pub-lished in print, plus additional statistics, such as ZIP Codestatistics, published only on CD-ROM.
SOURCES FOR MORE INFORMATION
More information about the scope, coverage, classifica-tion system, data items, and publications for each of theeconomic censuses and related surveys is published in theGuide to the 1997 Economic Census and Related Statisticsat www.census.gov/epcd/www/guide.html. More informa-tion on the methodology, procedures, and history of thecensuses will be published in the History of the 1997Economic Census atwww.census.gov/econ/www/history.html.
ABBREVIATIONS AND SYMBOLS
The following abbreviations and symbols are used withthe 1997 Economic Census data:
A Standard error of 100 percent or more.
D Withheld to avoid disclosing data of individualcompanies; data are included in higher leveltotals.
F Exceeds 100 percent because data includeestablishments with payroll exceeding rev-enue.
N Not available or not comparable.
Q Revenue not collected at this level of detail formultiestablishment firms.
S Withheld because estimates did not meetpublication standards.
V Represents less than 50 vehicles or .05percent.
X Not applicable.
Y Disclosure withheld because of insufficientcoverage of merchandise lines.
Z Less than half the unit shown.
a 0 to 19 employees.
b 20 to 99 employees.
c 100 to 249 employees.
e 250 to 499 employees.
f 500 to 999 employees.
g 1,000 to 2,499 employees.
h 2,500 to 4,999 employees.
i 5,000 to 9,999 employees.
j 10,000 to 24,999 employees.
k 25,000 to 49,999 employees.
l 50,000 to 99,999 employees.
m 100,000 employees or more.
p 10 to 19 percent estimated.
q 20 to 29 percent estimated.
r Revised.
s Sampling error exceeds 40 percent.
nec Not elsewhere classified.
nsk Not specified by kind.
– Represents zero (page image/print only).
pt. part
(CC) Consolidated city.
(IC) Independent city.
2 INTRODUCTION MINORITY-OWNED BUSINESS ENTERPRISES
U.S. Census Bureau, 1997 Economic Census
Surveys of Minority- and Women-OwnedBusiness Enterprises
GENERAL
The Survey of Minority-Owned Business Enterprises(SMOBE) is conducted in conjunction with the Survey ofWomen-Owned Business Enterprises (SWOBE). The SMOBEand SWOBE provide basic economic data on businessesowned by Blacks, persons of Alaska Native, AmericanIndian, Asian, or Pacific Islander descent, persons of His-panic or Latin American ancestry, and women. These sur-veys are based on the entire firm rather than on individuallocations of a firm. The published data cover number offirms, gross receipts, number of paid employees, andannual payroll. The data are presented by geographic area,industry, size of firm, and legal form of organization offirm.
CENSUS DISCLOSURE RULES
The U.S. Census Bureau is prohibited by law from pub-lishing any statistics that disclose information reported byindividual companies. Publishing the number of firms,however, is not considered confidential by the CensusBureau rules. Therefore, the number of firms may beshown, even when other data must be withheld. Theinformation and data obtained from the Internal RevenueService (IRS), the Social Security Administration (SSA), andother sources are also treated as confidential and can beseen only by Census Bureau employees sworn to protect itfrom disclosure.
SURVEY METHODOLOGY
All firms operating during 1997, except those classifiedas agricultural, are represented in these surveys. The listsof all firms (or universe) are compiled from a combinationof business tax returns and data collected on othereconomic census reports. The Census Bureau obtainselectronic files from the IRS for all companies filing IRSForm 1040, Schedule C (individual proprietorship or self-employed person); 1065 (partnership); any one of the1120 corporation tax forms; or 941 (Employer’s QuarterlyFederal Tax Return). The IRS provided certain identifica-tion, classification, and measurement data for businessesfiling those forms.
For most firms with paid employees, the Census Bureaualso collected employment, payroll, receipts, and kind ofbusiness information for each plant, store, or physicallocation during the 1997 Economic Census.
To design the sample, the Census Bureau used severalsources of information to identify the probability that abusiness was minority- or women-owned. For all soleproprietorships, partnerships, and corporations that filedelectronic tax forms, the SSA provided gender and racecodes for the owners.
Persons applying for Social Security Numbers (SSNs)prior to 1981 could categorize their race as (a) White, (b)Black, or (c) Other. In 1981, the racial descriptions onsocial security applications were expanded to (a) Asian,Asian-American, or Pacific Islander, (b) Hispanic, (c) Black,(d) Northern American Indian or Alaskan Native, and (e)White.
Most persons who currently own businesses appliedfor their SSNs prior to 1981. Therefore, the majority ofowners could be classified only as (a) White, (b) Black, or(c) Other by use of SSA race codes.
For each owner, the SSA also provided the CensusBureau with the individual’s country of birth, current sur-name, original surname, mother’s maiden surname, andfather’s surname. The Census Bureau has developed listsof American Indian, Asian, and Hispanic surnames basedon research using prior survey data.
In addition to the SSA data, several other sources wereused to preidentify businesses by race, ethnicity, andgender of owner(s) as potentially minority-owned:
• Lists of minority- and women-owned businesses pub-lished in syndicated magazines, located on the Internet,or disseminated by trade or special interest groups.
• Word strings in the company name indicating possibleminority ownership (derived from 1992 surveyresponses).
• Racial distributions for various state-industry classes(derived from 1992 survey responses) and racial distri-butions for various ZIP Codes.
Individual proprietors who reported they were of minor-ity ancestry in the 1992 survey and were still active in1997 were excluded from the mail canvass and the 1992responses were used instead. See the section on Samplingbelow for a description of how cases were selected.
Sampling. There were six sampling frames used andevery case was assigned to one of the following frames:
• American Indian
• Asian/Pacific Islander
BLACK 3MINORITY-OWNED BUSINESS ENTERPRISES
U.S. Census Bureau, 1997 Economic Census
• Black
• Hispanic
• Non-Hispanic white male
• Women
The SMOBE and SWOBE universe was stratified by state,industry, and the inferred race code. The Census Bureauselected large companies (based on volume of sales) ‘‘withcertainty.’’ All certainty cases were sure to be selected andrepresented only themselves (i.e., have a selection prob-ability of one and a sampling weight of one). The certaintycutoffs varied by sampling stratum, and each stratum wassampled at varying rates, depending on the number offirms in a particular industry in a particular state. Thesampling rate was lowest in states and industries with thegreatest number of firms. A similar methodology was usedto select a sample from the remaining universe: the pur-pose of this was to estimate the number of firms ownedby persons of minority ancestry when no indication ofminority ownership was found from any of the sourceslisted above.
A firm selected into the sample was mailed one of twoquestionnaires (see Appendix D for a sample of both). TheCensus Bureau sent the MB-1 questionnaire to partner-ships and corporations, or to sole proprietorships thatsubmitted joint tax returns where, based on the adminis-trative records, it was probable that the husband and wifewere of different races. The businesses were asked toreport the percentage of stock ownership of the businessby gender, race and ethnicity. The MB-2 questionnaire wasused for sole proprietors and self-employed individualswho were ‘‘single filers’’ or who filed joint tax returnswhere, based on administrative records, there was a lowprobability that the husband and wife were of differentraces. The businesses were asked to report the gender,race and ethnicity of the primary owner(s) of the business.The form included an equal male/female ownership optionfor the collection of business owners by gender.
Tabulation. In the 1997 SMOBE and SWOBE,minority/women ownership of a business was based onthe race/ethnicity/gender of the person(s) owning major-ity interest in the business. Firms equally male-/female-owned were counted and tabulated as a separate category.The gender of sole proprietors and self-employed personswho were ‘‘single filers’’ was taken directly from adminis-trative record data.
Businesses in which ownership was shared amongminority and nonminority groups with no singleracial/ethnic group having majority interest were tabu-lated as 50 percent minority-/50 percent nonminority-owned in the Company Summary publication and wereexcluded from the minority business counts.
It was possible for a firm to be classified in more thanone minority group (one racial and one Hispanic ethnicity)and to be included in more than one minority report. For
example, a firm could be included in both the Black reportand the Hispanic report, if it were owned by a person whoreported his/her race as Black and his/her ethnicity asHispanic. However, such a firm is counted only once attotal levels in the minority Summary and the CompanySummary publications.
Data are tabulated by firm. A firm is a business organi-zation consisting of one or more domestic locations. Firmsare counted in each geographic area and industry in whichthey operate. The employment, payroll, and receiptsreflect the sum of their locations within the specifiedgeography and industry and are, therefore, additive tohigher levels. The number of firms, however, reflects allfirms in a given tabulation level and are not additive. Forexample, a firm with operating locations in two countieswill be counted in both counties, but only once in thestate total.
Businesses with publicly held stock whose ownershipwas indeterminate relative to gender, race or ethnicity, andnonprofit, foreign-owned and mutual companies weretabulated separately and published in the ‘‘other’’ categoryin our reports.
RELIABILITY OF ESTIMATES
The data in the SMOBE and SWOBE are, in part, esti-mated from a sample and will differ from the data thatwould have been obtained from a complete census. Twotypes of possible errors are associated with estimatesbased on data from sample surveys: sampling errors andnonsampling errors. The accuracy of a survey resultdepends not only on the sampling errors and nonsamplingerrors measured, but also on the nonsampling errors notexplicitly measured. For particular estimates, the totalerror may considerably exceed the measured errors. Thefollowing is a description of the sampling and nonsam-pling errors associated with the 1997 SMOBE/SWOBE.
Sampling variability. The particular sample used for theSMOBE and SWOBE is one of a large number of all possiblesamples of the same size that could have been selectedusing the same sample design. Estimates derived from thedifferent samples would differ from each other. The rela-tive standard error is a measure of the variability amongthe estimates from all possible samples. The estimatedrelative standard errors presented in the tables estimatethe sampling variability, and thus measure the precisionwith which an estimate from the particular sampleselected for the SMOBE and SWOBE approximates the aver-age result of all possible samples. Relative standard errorsare applicable only to those published cells in whichsample cases are tabulated. A relative standard error is anexpression of the standard error as a percent of the quan-tity being estimated.
The sample estimate and an estimate of its relativestandard error can be used to estimate the standard errorand then construct interval estimates with a prescribed
4 BLACK MINORITY-OWNED BUSINESS ENTERPRISES
U.S. Census Bureau, 1997 Economic Census
level of confidence that the interval includes the averageresults of all samples. To illustrate, if all possible sampleswere surveyed under essentially the same condition, andestimates calculated from each sample, then:
1. Approximately 68 percent of the intervals from onestandard error below the estimate to one standarderror above the estimate would include the averagevalue of all possible samples.
2. Approximately 90 percent of the intervals from 1.6standard errors below the estimate to 1.6 standarderrors above the estimate would include the averagevalue of all possible samples.
Thus, for a particular sample, one can say with speci-fied confidence that the average of all possible samples isincluded in the constructed interval.
Example of a confidence interval. Suppose the esti-mated number of employer minority-owned firms inAgricultural Services is 7,139 and the estimated relativestandard error is 2 percent. The estimated standarderror is 7,139 x .02=143. An approximate 90-percentconfidence interval is 7,139 ± (1.6 x 143) or 7,139 ±228.8 or 6,910.2 to 7,367.8.
Nonsampling errors. All surveys and censuses aresubject to nonsampling errors. Nonsampling errors areattributable to many sources: inability to obtaininformation for all cases in the universe, adjustments tothe weights of respondents to compensate for nonrespon-dents, imputation for missing data, data errors and biases,mistakes in recording or keying data, errors in collectionor processing, and coverage problems.
Explicit measures of the effects of these nonsamplingerrors are not available. However, it is believed that mostof the important operational and data errors weredetected and corrected through an automated data editdesigned to review the data for reasonableness and con-sistency. Quality control techniques were used to verifythat operating procedures were carried out as specified.
Approximately 79 percent of the questionnaires werereturned. For respondents which supplied some but not allof the requested information and for businesses selectedwith certainty which failed to respond, data were imputedusing a procedure that ensured that the imputed datawere consistent with the responses provided and all infor-mation available from administrative sources. Weights ofthe responding cases, which were not selected with cer-tainty, were adjusted to compensate for the remainder ofthe cases which failed to respond. All of these proceduresassume that (1) the administrative information is accurateand (2) nonrespondents possess the same characteristicsas respondents with similar demographic characteristics.Neither of these assumptions is exactly true.
INDUSTRY CLASSIFICATIONS
The system published in the Standard Industrial Classi-fication (SIC) Manual: 1987 was used to classify firms for
the SMOBE and SWOBE. Under this system, economicactivities are coded on a numerical basis. Related activitiesare grouped at a primary level by industry division (i.e.,manufacturing, construction, retail trade, etc.). Withineach industry division, successive levels of detail of theeconomic activity are defined: major group (two-digitcode); industry group (three-digit code); and industry(four-digit code). For example, one hierarchy in wholesaletrade is:
SIC level SIC code DescriptionIndustry division — Wholesale tradeMajor group 50 Durable goodsIndustry group 506 Electrical goodsIndustry 5064 Electrical appliances,
television and radiosets
Data in the SMOBE and SWOBE reports are presented atthe industry division or major group level, depending onthe table.
The SMOBE and SWOBE cover all industries in the SICsystem except the following major industry groups:
• Agricultural Production (01, 02)
• Railroad Transportation (40)
• U.S. Postal Service (43)
• Selected parts of 63, Insurance Carriers
• Pension Funds (self-managed funds and funds man-aged by a third party)
• Health and Welfare Funds (self managed funds andfunds managed by a third party)
• Selected parts of 67, Holding and Other InvestmentOffices
• Management Investment Offices, Open-End
• Unit Investment Trusts, Face-Amount CertificateOffices, and Closed-End Management InvestmentOffices
• Vacation Funds for Employees
• Personal Investment Trusts
• Membership Organizations (86)
• Private Households (88)
• Public Administration (91-97)
GEOGRAPHIC AREAS COVERED
The SMOBE and SWOBE reports present data for theUnited States, each state and the District of Columbia;metropolitan areas (MAs), which include selected metro-politan statistical areas (MSAs), primary metropolitan
BLACK 5MINORITY-OWNED BUSINESS ENTERPRISES
U.S. Census Bureau, 1997 Economic Census
statistical areas (PMSAs), and consolidated metropolitanstatistical areas (CMSAs); counties; and places with 100 ormore women- or minority-owned firms.
MSAs. The MSAs for which data are shown are amongthose defined by the Office of Management and Budget asof June 30, 1997. An MSA is an integrated economic andsocial unit with a population nucleus of at least 50,000inhabitants.1 Each MSA consists of one or more countiesmeeting standards of metropolitan character; in NewEngland, cities and towns, rather than counties, are thecomponent geographic units.
PMSAs. An MSA with a population of 1 million or moremay be subdivided into PMSAs. A PMSA consists of a largeurbanized county or a cluster of counties (cities and townsin New England) that demonstrates very strong internaleconomic and social links separate from the ties to otherportions of its MSA. Where PMSAs are defined, the MSA ofwhich they are component parts is redesignated a CMSA.
Counties. Data are shown for counties or countyequivalents.2 3
Places. Included in the SMOBE and SWOBE are places of2,500 inhabitants or more or incorporated as a city,borough, village, or town.1 2 In addition, statistics arepresented for towns in the six New England states, NewYork, and Wisconsin, and townships in Michigan, Minne-sota, New Jersey, and Pennsylvania with a 1990 censuspopulation of 10,000 or more.
COMPARABILITY OF 1992 AND 1997 DATA
The following changes were made in survey methodol-ogy in 1997 which affect comparability with past reports:
1. The universe for the 1997 SMOBE and SWOBE wasexpanded to include all corporations. In 1992, onlysubchapter S corporations in addition to partnershipsand sole proprietorships were included for the SMOBE.A small sample of ‘‘C’’ corporations was included inthe SWOBE to provide estimates at the industry divi-sion level only.
2. Previously, the SMOBE and SWOBE programs defined abusiness as an entity that filed a business income taxreturn. Businesses that had received one or moreEmployer Identification Numbers (EINs) may have filedtax returns under more than one EIN. In past surveys,each EIN was treated as a separate business. For1997, all operations under the same ownership weredefined as one company or business, irrespective of
the number of the company’s EINs. The definitioneliminated the likelihood of surveying the samebusiness owner more than once. This change had noeffect on the employment and payroll data for thesesurveys, but slightly reduced the count for thenumber of businesses and the total receipts.
3. In the past, ownership was based on therace/ethnicity/gender of the majority of the numberof owners, without regard to the percentage of inter-est owned in the firm. Businesses with 50 percent ormore minority owners have in the past been includedin the minority business counts. In the 1997 SMOBE,51 percent or more of the interest, claims or rights inthe business must be held by minorities to beincluded as a minority-owned business and similarlyfor women. In the 1997 SMOBE, businesses in whichownership was shared among minority and nonminor-ity groups with no single racial/ethnic group havingmajority interest were excluded from the minoritybusiness counts and tabulated as 50 percentminority/50 percent nonminority-owned in the Com-pany Summary publication. Equally ownedmale/female firms were treated as a separate entityand were presented in a separate section of theWomen-Owned Businesses publication. In previoussurveys, businesses which were equally owned by aman and a woman were classified as either male- orfemale-owned. Equally owned corporations and part-nerships were counted as women-owned. Usingadministrative data all sole proprietorships wereassigned a gender based on the spouse with the larg-est self-employment income. The addition of theequally owned category in 1997 substantially reducedthe estimates for women-owned businesses.
4. In the past, a small sample of the cases placed on thenon-Hispanic white male frame was taken to estimatethe number of firms owned by persons of minorityancestry when no indication of minority ownershipwas found from any of the sources used in stratifica-tion. The estimates from this sample were presentedin a separate section of the Asian- and PacificIslander-, American Indian- and Alaska Native-ownedbusiness publication and the Hispanic-owned businesspublication as an estimate of the undercount and wereexcluded from the detailed tables. In the 1997 SMOBEand SWOBE, the estimates from this part of the samplewere included in the detailed tables of the publica-tions.
5. In prior surveys, the SMOBE universe of sole propri-etorships was based on businesses filing an annualIRS Schedule C (Form 1040) ‘‘Profit or Loss From Busi-ness’’ report. Employers were identified by first match-ing these Schedule C records to IRS Form 941‘‘Employers Quarterly Federal Tax Return’’ payrollreports. Not all Schedule C business income tax
1According to 1990 Census of Population or subsequent spe-cial census.
2Those defined as of January 1, 1997.3See Appendix C for Alaska, Louisiana, Maryland, Missouri,
Montana, Nevada, Virginia, and District of Columbia countyequivalents.
6 BLACK MINORITY-OWNED BUSINESS ENTERPRISES
U.S. Census Bureau, 1997 Economic Census
records that represented firms with employees couldbe matched. To estimate for sole proprietorshipemployers that were not matched to payroll taxreturns, a portion of the sole proprietorship universethat reported cost of labor or wages as an expenseitem on the Schedule C was also considered employ-ers. In addition, some cases with no cost of labor orwages reported but with large receipts had payrollimputed and were counted as employers.
For 1997, the methodology was revised to identifysole proprietorship employers as only those that filedthe IRS Form 941 payroll tax form. These businesseswere included in the universe even if they could notbe matched to a Schedule C. This resulted in adecrease in the estimate of firms with paid employeesrelative to the 1992 methodology.
COMPARABILITY OF SURVEY DATA WITH OTHERECONOMIC CENSUS DATA
The tables in each publication that show data for allU.S. firms are comparable to and include the minority- andwomen-owned firm data. Caution should be exercised incomparing data presented in this report with published orunpublished data from other reports of the 1997Economic Census. Factors that affect comparability ofdata among censuses are industrial scope, business unitcovered, receipts size, and coverage of nonemployers.
Industrial scope. Data in this report are based on the1987 SIC Manual4 (see Industry Classifications section).
Several SIC industries were in scope of the SMOBE andSWOBE but out of scope of the basic economic census.These industries included: 07, Agricultural Services; 08,Forestry; 09, Fishing, Hunting, and Trapping.
Major industry group 86, Membership Organizations,was within the scope of the economic census but out ofthe scope of the SMOBE and SWOBE.
In the SMOBE and SWOBE, industry 6552 (landsubdividers and developers, except cemeteries) isincluded with the construction industry group, unlike theother economic censuses that include it with industry 65(real estate).
Business unit. Most of the economic censuses areconducted on an establishment or physical location basis,individually enumerating and tabulating each establish-ment owned by a firm. In the SMOBE and SWOBE, however,the whole firm was the primary unit for enumeration. (SeeAppendix A for definition of ‘‘firm.’’)
Receipts size. Most of the economic censuses determinewhether or not a firm may be counted as an active busi-ness according to its receipts size. The specified mini-mums vary by industry. For a firm to be counted as an
active business in the SMOBE and SWOBE, it had only tofile a business tax return with business receipts greaterthan $1,000, except for the construction industry, whichhad no minimum business receipts cutoff.
Firms with no paid employees. Although nonemployerfirms are included in these surveys, they are omitted frommany of the economic census reports.
DOLLAR VALUES
All dollar values presented in the SMOBE and SWOBEreports are expressed in current dollars, i.e., 1997 dataare expressed in 1997 dollars and 1992 data in 1992dollars. Consequently, when making comparisons to prioryears, users should take into consideration the inflationthat has occurred.
COMPACT DISCS
Data for the economic censuses are also available oncompact discs-read only memory (CD-ROM). For theSMOBE and SWOBE, discs will contain more detailed indus-try data by state and comparison data for all U.S. firms,as well as the same information found in the reports.Discs are sold by Administrative and Customer ServicesDivision, U.S. Census Bureau, Washington, DC 20233-1900.
SPECIAL TABULATIONS
Special tabulations of data collected in the 1997 SMOBEand/or SWOBE may be obtained, depending on availabilityof time and personnel, on computer disk, or in tabularform. The data will be in summary form and subject to thesame rules prohibiting disclosure of confidential informa-tion (including name, address, kind of business, or otherdata for individual firms) as are the regular publications.
Special tabulations are prepared on a cost basis. Arequest for a cost estimate, as well as exact specificationson the type and format of the data to be provided, shouldbe directed to the Chief, Economic Census Branch,U.S. Census Bureau, Washington, DC 20233-6400.
To discuss a special tabulation before submitting arequest, call 301-457-3318.
ABBREVIATIONS AND SYMBOLS
The following abbreviations and symbols are used inthis publication:
− Represents zero.D Withheld to avoid disclosing data for
individual companies; data are included inhigher-level totals.
IC Independent city.NA Not available.X Not applicable.CDP Census designated place.CMSA Consolidated metropolitan statistical area.
4Standard Industrial Classification Manual: 1987. For sale bySuperintendent of Documents, U.S. Government Printing Office,Washington, DC 20402. Stock No. 041-001-00314-2.
BLACK 7MINORITY-OWNED BUSINESS ENTERPRISES
U.S. Census Bureau, 1997 Economic Census
MA Metropolitan area.MSA Metropolitan statistical area.PMSA Primary metropolitan statistical area.SIC Standard industrial classification.
n.e.c. Not elsewhere classified.
n.s.k. Not specified by kind.
pt. Part.
8 BLACK MINORITY-OWNED BUSINESS ENTERPRISES
U.S. Census Bureau, 1997 Economic Census
Summary of Findings (Revised)
Blacks owned 823,499 of all U.S. nonfarm businesses in1997, employing 718,341 persons and generating $71.2billion in business revenues. In 1997, Black-owned firmsaccounted for 4.0 percent of the 20.8 million nonfarmbusinesses in the United States, 0.7 percent of theiremployment and 0.4 percent of their receipts. Excludingbusinesses with publicly held stock whose ownership wasindeterminate relative to race or ethnicity, and nonprofit,foreign-owned and mutual companies, Black-owned firmsaccounted for 4.0 percent of the nonfarm businesses inthe United States and 0.9 percent of their receipts.
The data in this report were collected as part of the1997 Economic Census from a large sample of all nonfarmbusinesses filing 1997 tax forms as individual proprietor-ships, partnerships, and any type of corporation, and withreceipts of $1,000 or more. The data are not comparableto earlier surveys due to significant methodology changeswhich are discussed in the section below on Data Compa-rability to Prior Surveys.
Black-Owned Businesses by Legal Form ofOrganization: 1997
Note: ‘‘Other’’ includes cooperatives, receiverships, estates, andbusinesses classified as unknown legal forms of organization.
INDUSTRY CHARACTERISTICS
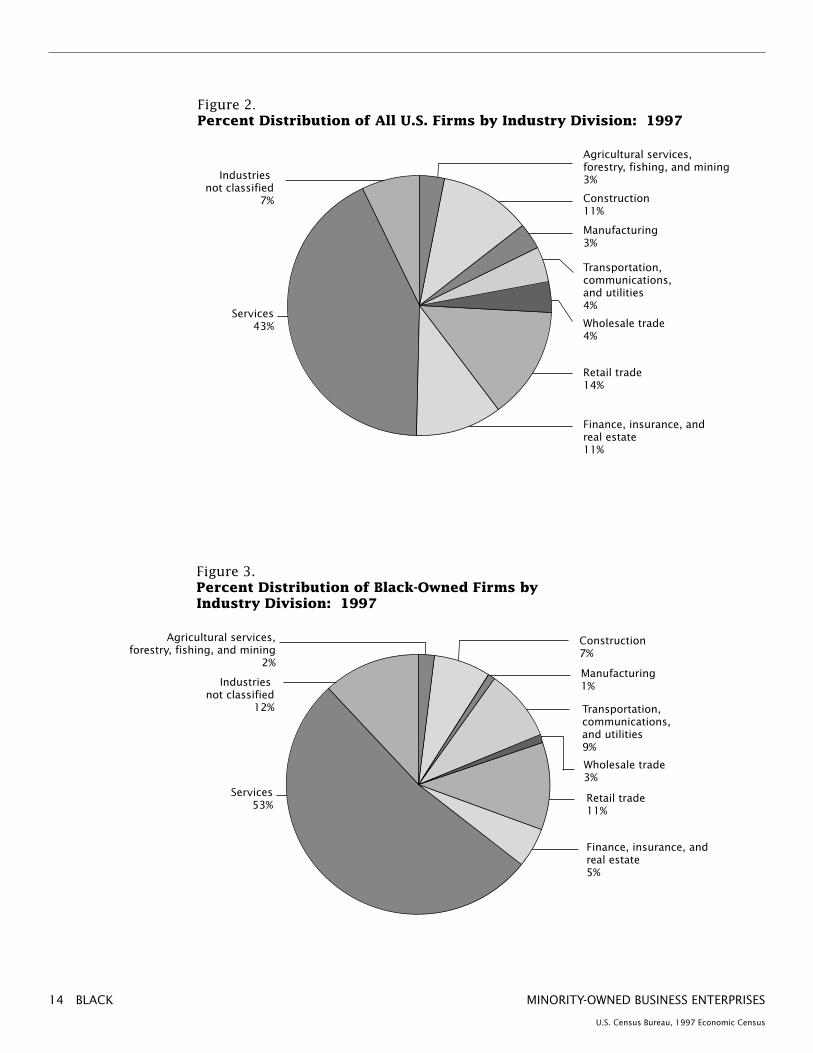
Fifty-three percent of all Black-owned firms operated inthe service industries, accounting for 36.4 percent ofreceipts of all Black-owned businesses. This is 4.9 percentof all service businesses in the country. Forty-eight per-cent of the total number of Black-owned service firmswere concentrated in business and personal services. Thenext largest concentration of Black-owned firms was in theretail trade industry, accounting for 10.6 percent of allBlack-owned firms and 19.4 percent of the total receipts.
Table A. Top Industry Receipt Leaders forBlack-Owned Firms : 1997
New York had the most Black-owned firms at 86,469 or10.5 percent with receipts of $5.1 billion or 7.1 percent ofall Black-owned business receipts. California was secondwith 79,110 or 9.6 percent with receipts of $6.4 billion or9.0 percent. Texas was third in number of firms with60,427 but was second in receipts with $6.9 billion. Texasaccounted for 7.3 percent of all Black-owned firms and 9.6percent of receipts. Table C shows the 10 metropolitanareas (MAs) with the largest number of Black-owned firmsand compares the firms and receipts in these MAs with thenumber in their respective states. These 10 MAs accountfor 38.9 percent of the total number of Black-owned firmsin the United States and 40.0 percent of the gross receipts.
BLACK 9MINORITY-OWNED BUSINESS ENTERPRISES
U.S. Census Bureau, 1997 Economic Census
LEGAL FORM OF ORGANIZATION
Ninety percent of Black-owned firms operated asindividual proprietorships in 1997 and accounted for 26.8percent of gross receipts. Corporations, other than sub-chapter S corporations, accounted for only 5.2 percent ofthe total number of firms but 40.1 percent of the grossreceipts. Subchapter S corporations were 3.6 percent of allBlack-owned firms but accounted for 27.7 percent of theirgross receipts. Partnerships accounted for 1.7 percent ofthe total Black-owned firms and 4.5 percent of grossreceipts. Businesses classified as other legal forms oforganization and those not classified accounted for 0.1percent of the total number of firms and 0.9 percent of thegross receipts.
SIZE OF FIRM
Black-owned firms with paid employees accounted for11.3 percent of the total number of Black-owned firms and79.2 percent of their gross receipts. There were 889 firmswith 100 employees or more which accounted for $12.3billion in gross receipts (21.7 percent of the total receiptsof Black-owned employer firms).
There were 8,682 Black-owned firms with receipts of$1 million or more. These firms accounted for only 1.1percent of the number of Black-owned firms and 56.4 per-cent of the total receipts.
Table B. Ten States With Largest Number of Black-Owned Firms Compared to All Firms andPopulation: 1997 (Revised)
The data for 1997 are not directly comparable to previ-ous survey years because of several changes to the surveymethodology. These changes are discussed in greaterdetail in the Introductory Text in the section titled ‘‘Com-parability of 1992 and 1997 Data.’’ The most significantchanges occurred in the treatment of C corporations, intabulating businesses with 50-percent minority owner-ship, and in the identification of firms with paid employ-ees. In 1992 and in previous studies, C corporations wereexcluded from the survey. Only subchapter S corporations,in addition to partnerships and sole proprietorships, wereincluded. In 1997, the universe for the Survey of Minority-Owned Business Enterprises was expanded to include all
corporations. However, businesses that were foreign-owned, publicly held, nonprofit, or whose ownership wasshared by its membership, such as mutual companies,were tabulated separately and not distributed to the raceof ownership categories. Race of ownership for theremaining corporations was determined to be Black ornon-Black if 51 percent or more of the stock interest,claims or rights were held by African Americans.
The second major change occurred with the treatmentof businesses with 50-percent minority-/50-percent non-minority ownership. In the past, businesses with 50 per-cent or more minority owners have been included in theminority business data. For 1997, businesses in which
BLACK 11MINORITY-OWNED BUSINESS ENTERPRISES
U.S. Census Bureau, 1997 Economic Census
ownership was shared among minority and nonminoritygroups with no single racial/ethnic group having majorityinterest were excluded from the minority business dataand were tabulated and published separately as50-percent minority-/50-percent nonminority-owned in theCompany Summary publication.
The third major change occurred in identifying sole pro-prietorships with paid employees. The methodology wasrevised to account for only those firms which paid payrolltaxes to the IRS. This resulted in a decrease in the esti-mate of firms with paid employees relative to the 1992methodology.
The comparison table provides measures of changefrom 1992 to 1997 in both the number and receipts forBlack-owned firms. Due to the methodology changes dis-cussed above, exact estimates of change are not available.However, the trends shown at the aggregate level arebelieved to be reliable.
Comparison of Black-Owned Firms to All U.S.Firms: 1997 and 1992[Excluding C corporations]
All U.S. firms1997 . . . . . . . . . . . . . . 18,431,456 4,661,018 NA NA1992 . . . . . . . . . . . . . . 17,253,143 3,324,200 NA NAPercent change . . . . . . 6.8 40.2 NA NA
1All firms data include both firms with paid employees and firms withno paid employees.
2For explanation of relative standard errors, see Reliability of Esti-mates in the introductory text.
12 BLACK MINORITY-OWNED BUSINESS ENTERPRISES
U.S. Census Bureau, 1997 Economic Census
Figure 1.Black-Owned Firms as a Percent of Total Firms in State: 1997
IL
AK
WA
OR
CA
ID
UT
NV
AZ
NE
SD
ND
NM
CO
WY
MT
MI
IN
LA
AR
MO
IA
MN
TX
OK
KS
PA
DC
MDWVVA
NC
SC
FL
WI
GAAL
TN
KY
OH
NH
VT
HI
ME
MA
RICT
NJ
NY
DE
MS
10.0 to 25.05.0 to 9.91.0 to 4.90.0 to 0.9
Percent of Total
BLACK 13MINORITY-OWNED BUSINESS ENTERPRISES
U.S. Census Bureau, 1997 Economic Census
Figure 2.Percent Distribution of All U.S. Firms by Industry Division: 1997
Agricultural services,forestry, fishing, and mining3%Industries
not classified7%
Services43%
Finance, insurance, and real estate11%
Construction11%
Manufacturing3%
Transportation, communications, and utilities4%
Wholesale trade4%
Retail trade14%
Figure 3.Percent Distribution of Black-Owned Firms by Industry Division: 1997
Agricultural services,forestry, fishing, and mining
2%
Industries not classified
12%
Services53%
Finance, insurance, and real estate5%
Construction7%
Manufacturing1%
Transportation, communications, and utilities9%
Wholesale trade3%
Retail trade11%
14 BLACK MINORITY-OWNED BUSINESS ENTERPRISES
U.S. Census Bureau, 1997 Economic Census
0 1200 2400 3600 4800 6000
Figure 4.Average Receipts per Firm by IndustryDivision for Black-Owned Firms Compared to All U.S. Firms: 1997
[Thousand dollars]
All industries
Agricultural services,forestry, fishing, and
mining
Construction
Manufacturing
86
35
136
352
89
717
158
81
Black
All
Transportation, communications, and
utilities
Wholesale trade
Retail trade
Finance, insurance, and real estate
Services
Industries not classified
59
43
891
386
405
5,839
1,287
5,352
917
1,147
294
42
BLACK 15MINORITY-OWNED BUSINESS ENTERPRISES
U.S. Census Bureau, 1997 Economic Census
0 3 6 9 12 15
Figure 5.Black-Owned Firms and Receipts as a Percent of All U.S. Firms and Receipts by Industry Division: 1997
All industries
Construction
Manufacturing
4.0%
2.0%
2.4%
1.5%
7.8%
1.0%
3.0%
1.7%
Firms
Receipts
Wholesale trade
Retail trade
Finance, insurance, and real estate
Services
Industries not classified
4.9%
6.8%
0.4%
0.2%
0.8%
0.1%
0.5%
0.1%
0.5%
0.1%
1.0%
7.1%
Agricultural services,forestry, fishing, and
mining
Transportation, communications, and
utilities
16 BLACK MINORITY-OWNED BUSINESS ENTERPRISES
U.S. Census Bureau, 1997 Economic Census
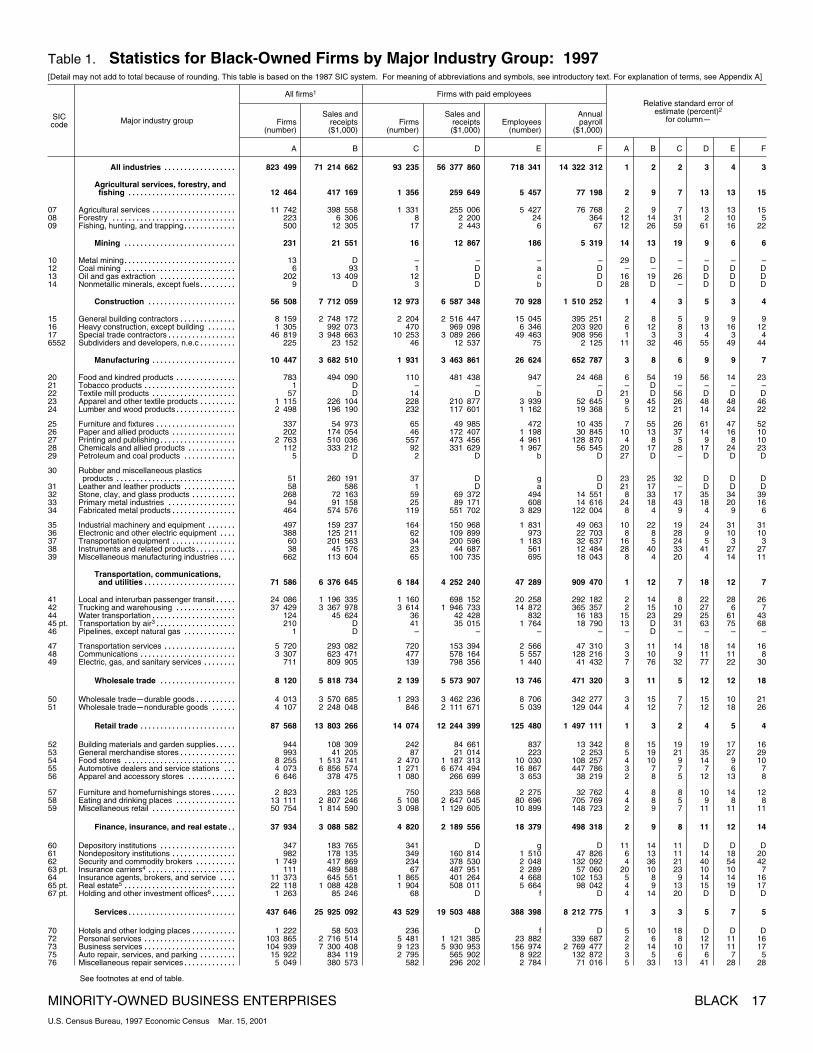
Table 1. Statistics for Black~Owned Firms by Major Industry Group: 1997[Detail may not add to total because of rounding. This table is based on the 1987 SIC system. For meaning of abbreviations and symbols, see introductory text. For explanation of terms, see Appendix A]
SICcode Major industry group
All firms1 Firms with paid employeesRelative standard error of
10 Metal mining 13............................ D – – – – 29 D – – – –12 Coal mining 6............................ 93 1 D a D – – – D D D13 Oil and gas extraction 202................... 13 409 12 D c D 16 19 26 D D D14 Nonmetallic minerals, except fuels 9......... D 3 D b D 28 D – D D D
70 Hotels and other lodging places 1 222........... 58 503 236 D f D 5 10 18 D D D72 Personal services 103 865....................... 2 716 514 5 481 1 121 385 23 882 339 687 2 6 8 12 11 1673 Business services 104 939....................... 7 300 408 9 123 5 930 953 156 974 2 769 477 2 14 10 17 11 1775 Auto repair, services, and parking 15 922......... 834 119 2 795 565 902 8 922 132 872 3 5 6 6 7 576 Miscellaneous repair services 5 049............. 380 573 582 296 202 2 784 71 016 5 33 13 41 28 28
See footnotes at end of table.
MINORITY~OWNED BUSINESS ENTERPRISES BLACK 17U.S. Census Bureau, 1997 Economic Census Mar. 15, 2001
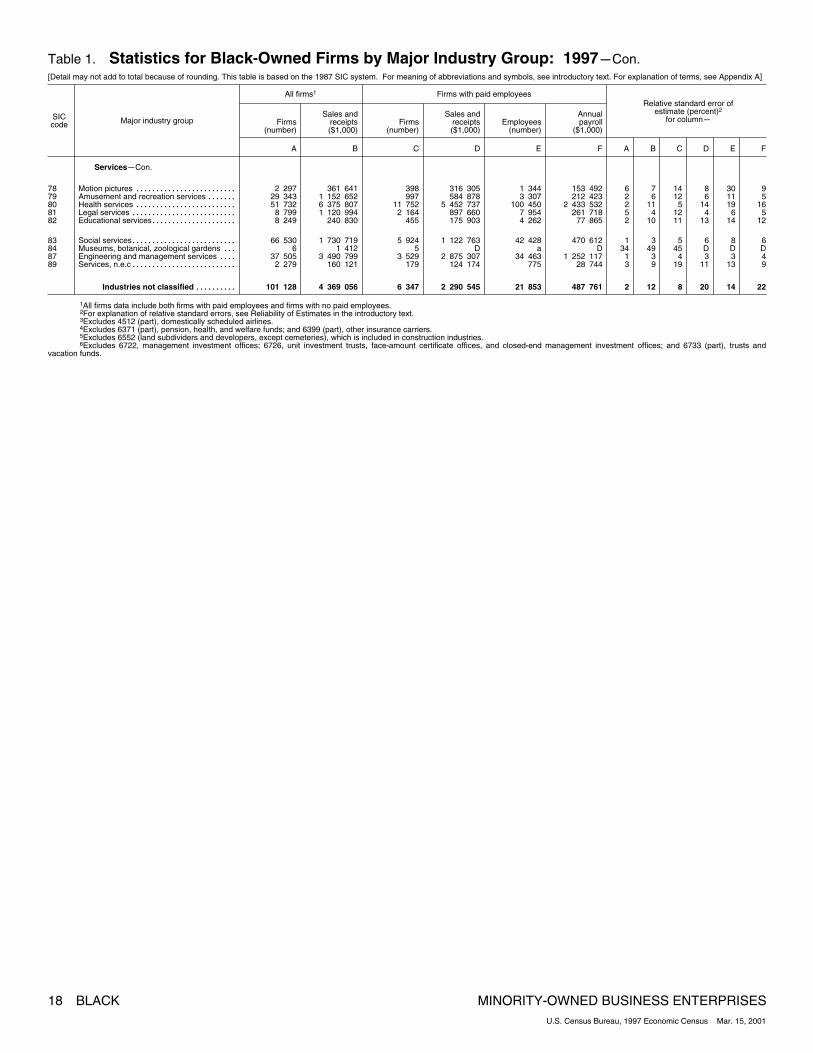
Table 1. Statistics for Black~Owned Firms by Major Industry Group: 1997mCon.[Detail may not add to total because of rounding. This table is based on the 1987 SIC system. For meaning of abbreviations and symbols, see introductory text. For explanation of terms, see Appendix A]
SICcode Major industry group
All firms1 Firms with paid employeesRelative standard error of
1All firms data include both firms with paid employees and firms with no paid employees.2For explanation of relative standard errors, see Reliability of Estimates in the introductory text.3Excludes 4512 (part), domestically scheduled airlines.4Excludes 6371 (part), pension, health, and welfare funds; and 6399 (part), other insurance carriers.5Excludes 6552 (land subdividers and developers, except cemeteries), which is included in construction industries.6Excludes 6722, management investment offices; 6726, unit investment trusts, face~amount certificate offices, and closed~end management investment offices; and 6733 (part), trusts and
vacation funds.
18 BLACK MINORITY~OWNED BUSINESS ENTERPRISESU.S. Census Bureau, 1997 Economic Census Mar. 15, 2001
Table 2. Statistics for Black~Owned Firms by State: 1997[Detail may not add to total because of rounding. For meaning of abbreviations and symbols, see introductory text. For explanation of terms, see Appendix A]
Geographic area
All firms1 Firms with paid employeesRelative standard error of
1All firms data include both firms with paid employees and firms with no paid employees.2For explanation of relative standard errors, see Reliability of Estimates in the introductory text.
MINORITY~OWNED BUSINESS ENTERPRISES BLACK 19U.S. Census Bureau, 1997 Economic Census Mar. 15, 2001
Table 3. Statistics for Black~Owned Firms by Industry Division for States: 1997[Detail may not add to total because of rounding. This table is based on the 1987 SIC system. For meaning of abbreviations and symbols, see introductory text. For explanation of terms, seeAppendix A]
Geographic area and industry division
All firms1 Firms with paid employeesRelative standard error of
Agricultural services, forestry, fishing, and mining 11........... D – – – – 70 D – – – –Construction 31........................................... 5 394 12 4 978 46 1 512 23 34 38 37 63 47Manufacturing 6.......................................... D – – – – 40 D – – – –Transportation, communications, and utilities 60............... 5 034 10 D b D 24 61 52 D D DWholesale trade 2........................................ D – – – – – D – – – –Retail trade 100............................................ 8 880 24 7 650 72 1 000 19 27 54 32 36 21Finance, insurance, and real estate 17....................... D 2 D a D 23 D – D D DServices 506............................................... 32 637 48 26 295 549 9 806 7 11 29 13 8 14Industries not classified 143.................................. 2 485 22 D a D 45 29 97 D D D
Agricultural services, forestry, fishing, and mining 11........... D – – – – 74 D – – – –Construction 191........................................... 30 929 64 27 930 673 9 786 17 28 32 31 45 30Manufacturing 42.......................................... D 10 D a D 23 D 60 D D DTransportation, communications, and utilities 210............... D 34 5 479 102 1 152 17 D 40 49 42 46Wholesale trade 60........................................ 27 714 24 27 276 157 4 040 20 47 37 48 34 46Retail trade 381............................................ 52 215 66 47 836 1 898 11 305 13 57 30 62 81 69Finance, insurance, and real estate 268....................... 19 965 20 D b D 16 52 31 D D DServices 1 986............................................... 155 032 258 123 847 2 532 59 764 5 8 20 11 17 14Industries not classified 434.................................. D 28 D e D 17 D 98 D D D
Agricultural services, forestry, fishing, and mining 229........... D 35 D b D 16 D 34 D D DConstruction 608........................................... 42 529 106 31 388 376 5 286 5 35 15 48 41 35Manufacturing 148.......................................... 6 384 14 1 935 24 453 13 9 31 24 18 12Transportation, communications, and utilities 562............... 25 496 23 D b D 8 9 33 D D DWholesale trade 28........................................ D 4 D c D 18 D 61 D D DRetail trade 855............................................ 149 608 96 135 259 593 8 957 10 4 23 4 12 8Finance, insurance, and real estate 207....................... 9 146 36 6 398 82 1 121 14 17 19 18 10 13Services 3 065............................................... 103 385 360 57 441 1 085 19 336 5 14 15 8 8 12Industries not classified 1 020.................................. 22 500 86 D b D 16 38 67 D D D
Agricultural services, forestry, fishing, and mining 68........... 2 247 18 D b D 24 45 60 D D DConstruction 649........................................... 59 643 119 43 294 456 10 635 5 13 16 18 20 21Manufacturing 51.......................................... 19 092 15 18 529 204 5 545 17 11 28 12 18 12Transportation, communications, and utilities 633............... 55 723 116 38 037 413 9 710 11 19 17 17 14 17Wholesale trade 66........................................ 16 326 9 12 793 16 536 21 30 34 38 41 45Retail trade 907............................................ 134 486 200 113 634 722 12 674 13 6 30 6 19 12Finance, insurance, and real estate 293....................... 24 762 21 16 253 229 3 869 14 17 40 22 11 20Services 3 807............................................... 194 689 303 152 088 2 582 88 322 7 36 16 46 50 67Industries not classified 776.................................. 21 195 56 D c D 22 38 99 D D D
See footnotes at end of table.
20 BLACK MINORITY~OWNED BUSINESS ENTERPRISESU.S. Census Bureau, 1997 Economic Census Mar. 15, 2001
Table 3. Statistics for Black~Owned Firms by Industry Division for States: 1997mCon.[Detail may not add to total because of rounding. This table is based on the 1987 SIC system. For meaning of abbreviations and symbols, see introductory text. For explanation of terms, seeAppendix A]
Geographic area and industry division
All firms1 Firms with paid employeesRelative standard error of
Agricultural services, forestry, fishing, and mining 63........... 5 402 16 D c D 18 70 61 D D DConstruction 154........................................... 31 811 31 28 037 321 6 847 6 36 25 41 36 33Manufacturing 13.......................................... D 1 D a D – D – D D DTransportation, communications, and utilities 256............... 16 315 51 9 248 219 1 787 12 24 32 38 59 44Wholesale trade 59........................................ 14 864 9 10 850 34 744 21 2 62 3 34 5Retail trade 302............................................ 22 425 46 18 624 344 3 030 11 25 34 32 31 31Finance, insurance, and real estate 101....................... D 16 D c D 15 D 26 D D DServices 1 480............................................... 78 465 149 63 581 2 206 26 124 9 13 13 16 28 19Industries not classified 278.................................. D 3 D a D 8 D 82 D D D
District of Columbia 10 909............................... 1 334 651 1 232 D j D 5 6 8 D D D
Agricultural services, forestry, fishing, and mining 86........... D 26 D c D 21 D 51 D D DConstruction 516........................................... D 66 D f D 11 D 19 D D DManufacturing 96.......................................... 55 738 30 D e D 17 49 46 D D DTransportation, communications, and utilities 1 254............... D 21 108 348 640 21 379 7 D 15 1 2 1Wholesale trade 93........................................ D 16 D c D 10 D 37 D D DRetail trade 987............................................ 117 440 180 97 810 1 375 18 774 8 8 12 10 15 13Finance, insurance, and real estate 594....................... 90 790 79 76 208 634 17 596 14 34 20 41 43 35Services 5 696............................................... D 712 D i D 6 D 11 D D DIndustries not classified 1 589.................................. D 104 D e D 8 D 41 D D D
Agricultural services, forestry, fishing, and mining S........... S S S S S S S S S S SConstruction 26........................................... 4 469 13 4 262 46 740 29 16 49 17 52 23Manufacturing 4.......................................... D 1 D a D – D – D D DTransportation, communications, and utilities 8............... D 2 D a D – D – D D DWholesale trade S........................................ S S S S S S S S S S SRetail trade 65............................................ 2 145 – – – – 20 38 – – – –Finance, insurance, and real estate 16....................... D 1 D a D 6 D – D D DServices 297............................................... 14 210 9 10 042 359 5 800 11 2 – – – –Industries not classified S.................................. S S S S S S S S S S S
Agricultural services, forestry, fishing, and mining 1........... D – – – – – D – – – –Construction 9........................................... D 1 D a D 23 D – D D DManufacturing –.......................................... – – – – – – – – – – –Transportation, communications, and utilities 3............... D – – – – – D – – – –Wholesale trade 1........................................ D – – – – – D – – – –Retail trade 15............................................ 1 322 4 D a D 28 5 55 D D DFinance, insurance, and real estate 4....................... D – – – – 57 D – – – –Services 74............................................... 13 873 11 D c D 8 44 16 D D DIndustries not classified S.................................. S S S S S S S S S S S
MINORITY~OWNED BUSINESS ENTERPRISES BLACK 21U.S. Census Bureau, 1997 Economic Census Mar. 15, 2001
Table 3. Statistics for Black~Owned Firms by Industry Division for States: 1997mCon.[Detail may not add to total because of rounding. This table is based on the 1987 SIC system. For meaning of abbreviations and symbols, see introductory text. For explanation of terms, seeAppendix A]
Geographic area and industry division
All firms1 Firms with paid employeesRelative standard error of
Agricultural services, forestry, fishing, and mining 45........... D 1 D a D 30 D – D D DConstruction 228........................................... 37 309 66 34 088 319 8 647 11 18 21 18 17 20Manufacturing 44.......................................... D 17 D b D 32 D 47 D D DTransportation, communications, and utilities 152............... 21 585 38 D c D 13 24 33 D D DWholesale trade 71........................................ 71 234 28 70 100 149 6 336 11 34 32 34 27 36Retail trade 426............................................ 114 098 101 108 634 1 233 18 925 16 20 25 21 28 31Finance, insurance, and real estate 163....................... D 18 D b D 15 D 37 D D DServices 1 935............................................... 225 121 184 205 762 3 161 60 269 5 56 14 61 28 40Industries not classified 332.................................. 111 839 71 D f D 24 94 82 D D D
Agricultural services, forestry, fishing, and mining 8........... D – – – – 66 D – – – –Construction 25........................................... 16 292 8 16 037 103 3 922 21 4 39 4 12 5Manufacturing 4.......................................... D 1 D a D 58 D – D D DTransportation, communications, and utilities 13............... D 2 D b D 56 D – D D DWholesale trade 3........................................ D 1 D a D – D – D D DRetail trade 28............................................ 2 695 12 2 387 104 569 19 60 43 67 71 74Finance, insurance, and real estate 7....................... D – – – – 35 D – – – –Services 96............................................... 3 197 13 D b D 9 19 42 D D DIndustries not classified 74.................................. 2 143 – – – – 37 59 – – – –
22 BLACK MINORITY~OWNED BUSINESS ENTERPRISESU.S. Census Bureau, 1997 Economic Census Mar. 15, 2001
Table 3. Statistics for Black~Owned Firms by Industry Division for States: 1997mCon.[Detail may not add to total because of rounding. This table is based on the 1987 SIC system. For meaning of abbreviations and symbols, see introductory text. For explanation of terms, seeAppendix A]
Geographic area and industry division
All firms1 Firms with paid employeesRelative standard error of
Agricultural services, forestry, fishing, and mining 144........... D 22 D a D 21 D 53 D D DConstruction 821........................................... 156 273 256 142 753 1 385 35 593 9 13 17 15 17 17Manufacturing 108.......................................... 40 182 31 D e D 20 18 30 D D DTransportation, communications, and utilities 851............... 164 858 100 133 152 1 353 29 931 11 38 19 49 36 34Wholesale trade 123........................................ 174 630 20 171 201 255 9 900 12 9 29 10 26 10Retail trade 1 412............................................ 255 960 301 233 453 3 430 42 247 4 9 10 8 14 11Finance, insurance, and real estate 765....................... 40 903 92 26 364 319 5 580 13 14 21 14 15 12Services 7 473............................................... 386 254 943 300 224 7 303 119 035 3 9 12 12 10 10Industries not classified 1 981.................................. D 376 D b D 23 D 85 D D D
Montana 62.......................................... D 15 D b D 23 D 20 D D D
Agricultural services, forestry, fishing, and mining 12........... D – – – – 91 D – – – –Construction 6........................................... D 1 D a D 23 D – D D DManufacturing 2.......................................... D 2 D a D – D – D D DTransportation, communications, and utilities –............... – – – – – – – – – – –Wholesale trade 1........................................ D – – – – – D – – – –Retail trade 3............................................ D – – – – 45 D – – – –Finance, insurance, and real estate 3....................... D 2 D a D – D – D D DServices 27............................................... D 10 D b D 15 D 28 D D DIndustries not classified 8.................................. D – – – – 35 D – – – –
Agricultural services, forestry, fishing, and mining 9........... D – – – – 64 D – – – –Construction 82........................................... D 11 3 515 78 832 14 D 40 43 33 58Manufacturing 16.......................................... D 13 D e D 45 D 56 D D DTransportation, communications, and utilities 41............... 5 568 3 D b D 22 7 – D D DWholesale trade 23........................................ D 13 D b D 29 D 55 D D DRetail trade 181............................................ D 55 18 324 211 1 981 12 D 28 13 11 10Finance, insurance, and real estate 60....................... 9 993 20 9 276 70 2 340 11 52 37 57 59 59Services 1 012............................................... 58 486 124 47 166 1 088 17 284 9 6 32 9 16 10Industries not classified 142.................................. D – – – – 31 D – – – –
Agricultural services, forestry, fishing, and mining 26........... D 1 D b D 55 D – D D DConstruction 128........................................... D 38 56 948 375 10 434 30 D 59 23 32 20Manufacturing 23.......................................... D 1 D a D 41 D – D D DTransportation, communications, and utilities 95............... 15 251 18 D e D 13 57 56 D D DWholesale trade 44........................................ D 3 D b D 23 D 80 D D DRetail trade 291............................................ D 29 D f D 17 D 37 D D DFinance, insurance, and real estate 265....................... D 14 D b D 10 D 44 D D DServices 1 557............................................... 93 870 200 73 647 1 058 30 461 10 11 28 14 11 15Industries not classified 369.................................. 9 031 43 D a D 35 37 99 D D D
Agricultural services, forestry, fishing, and mining –........... – – – – – – – – – – –Construction 29........................................... 4 707 11 4 255 70 1 371 18 41 48 46 44 41Manufacturing 21.......................................... 494 – – – – 45 61 – – – –Transportation, communications, and utilities 7............... D 1 D a D 49 D – D D DWholesale trade 10........................................ D 8 D b D 45 D 56 D D DRetail trade 65............................................ 3 105 11 D b D 19 48 66 D D DFinance, insurance, and real estate 7....................... D 1 D a D 32 D – D D DServices 171............................................... 17 111 22 13 626 375 8 519 6 13 31 17 8 11Industries not classified 15.................................. 267 – – – – 16 7 – – – –
MINORITY~OWNED BUSINESS ENTERPRISES BLACK 23U.S. Census Bureau, 1997 Economic Census Mar. 15, 2001
Table 3. Statistics for Black~Owned Firms by Industry Division for States: 1997mCon.[Detail may not add to total because of rounding. This table is based on the 1987 SIC system. For meaning of abbreviations and symbols, see introductory text. For explanation of terms, seeAppendix A]
Geographic area and industry division
All firms1 Firms with paid employeesRelative standard error of
North Dakota 99...................................... D 8 D c D 16 D – D D D
Agricultural services, forestry, fishing, and mining –........... – – – – – – – – – – –Construction –........................................... – – – – – – – – – – –Manufacturing –.......................................... – – – – – – – – – – –Transportation, communications, and utilities 11............... D 3 D b D 31 D – D D DWholesale trade 5........................................ D 1 D a D 43 D – D D DRetail trade 11............................................ D 2 D b D 31 D – D D DFinance, insurance, and real estate 1....................... D – – – – – D – – – –Services 69............................................... 7 257 2 D c D 25 17 – D D DIndustries not classified 3.................................. D – – – – 76 D – – – –
Agricultural services, forestry, fishing, and mining 36........... D 3 D a D 46 D 79 D D DConstruction 121........................................... 21 424 45 19 556 110 4 679 16 22 35 24 17 25Manufacturing 22.......................................... D – – – – 30 D – – – –Transportation, communications, and utilities 106............... 19 239 34 D c D 15 24 43 D D DWholesale trade 50........................................ 53 714 8 52 863 46 1 039 38 61 40 63 36 33Retail trade 214............................................ 254 336 68 250 138 638 20 321 14 37 34 38 29 37Finance, insurance, and real estate 83....................... D 7 D a D 19 D 78 D D DServices 1 140............................................... 74 399 108 55 230 1 899 32 782 9 24 24 33 50 42Industries not classified 450.................................. 8 243 87 D b D 25 29 70 D D D
24 BLACK MINORITY~OWNED BUSINESS ENTERPRISESU.S. Census Bureau, 1997 Economic Census Mar. 15, 2001
Table 3. Statistics for Black~Owned Firms by Industry Division for States: 1997mCon.[Detail may not add to total because of rounding. This table is based on the 1987 SIC system. For meaning of abbreviations and symbols, see introductory text. For explanation of terms, seeAppendix A]
Geographic area and industry division
All firms1 Firms with paid employeesRelative standard error of
Agricultural services, forestry, fishing, and mining 10........... 287 – – – – 44 50 – – – –Construction 99........................................... D 34 40 631 193 8 255 17 D 43 40 22 25Manufacturing 22.......................................... D 14 D b D 51 D 72 D D DTransportation, communications, and utilities 38............... D 5 D a D 14 D 88 D D DWholesale trade 6........................................ D – – – – 36 D – – – –Retail trade 203............................................ 32 934 64 D e D 14 17 27 D D DFinance, insurance, and real estate 46....................... D 1 D a D 17 D – D D DServices 666............................................... 33 815 65 23 817 1 179 12 164 8 6 14 9 4 8Industries not classified 180.................................. D – – – – 40 D – – – –
Agricultural services, forestry, fishing, and mining 646........... 19 864 65 D e D 11 14 28 D D DConstruction 2 785........................................... 275 557 1 030 219 518 4 729 62 526 4 18 7 24 11 21Manufacturing 272.......................................... 50 050 60 45 442 546 11 963 13 40 49 44 67 54Transportation, communications, and utilities 2 076............... 122 671 170 43 046 1 054 10 805 6 13 26 22 42 28Wholesale trade 212........................................ 95 852 43 91 938 344 5 793 14 43 25 45 29 27Retail trade 3 432............................................ 382 199 473 329 866 2 684 31 600 5 6 17 7 20 15Finance, insurance, and real estate 823....................... 48 292 97 33 320 295 7 504 8 19 13 24 21 35Services 10 874............................................... 380 330 1 191 254 114 7 711 99 818 1 6 13 8 10 7Industries not classified 2 097.................................. 34 109 21 D b D 10 29 98 D D D
South Dakota 150...................................... 17 294 22 D b D 24 9 42 D D D
Agricultural services, forestry, fishing, and mining 1........... D – – – – – D – – – –Construction 7........................................... D 7 D a D 75 D 75 D D DManufacturing 1.......................................... D – – – – – D – – – –Transportation, communications, and utilities 10............... D 2 D b D 44 D – D D DWholesale trade –........................................ – – – – – – – – – – –Retail trade 12............................................ 2 106 7 D b D 45 47 49 D D DFinance, insurance, and real estate 4....................... D – – – – 63 D – – – –Services 61............................................... D 5 D b D 13 D 14 D D DIndustries not classified 54.................................. D – – – – 59 D – – – –
Agricultural services, forestry, fishing, and mining –........... – – – – – – – – – – –Construction 24........................................... D 11 D b D 18 D 52 D D DManufacturing 2.......................................... D 2 D a D – D – D D DTransportation, communications, and utilities 24............... D – – – – 48 D – – – –Wholesale trade 5........................................ D – – – – 84 D – – – –Retail trade 41............................................ D 1 D a D 37 D – D D DFinance, insurance, and real estate 11....................... D – – – – 50 D – – – –Services 252............................................... 11 912 21 8 011 271 3 744 6 5 26 10 8 10Industries not classified 81.................................. D – – – – 70 D – – – –
Agricultural services, forestry, fishing, and mining 13........... D 13 D a D 73 D 73 D D DConstruction 14........................................... D 3 D b D 60 D 78 D D DManufacturing 10.......................................... D 7 D a D 54 D 77 D D DTransportation, communications, and utilities 3............... D – – – – 50 D – – – –Wholesale trade 10........................................ D 2 D a D 61 D – D D DRetail trade 18............................................ D 7 D e D 26 D 46 D D DFinance, insurance, and real estate 11....................... D – – – – 73 D – – – –Services 87............................................... D 4 D a D 28 D – D D DIndustries not classified 3.................................. 33 – – – – – – – – – –
MINORITY~OWNED BUSINESS ENTERPRISES BLACK 25U.S. Census Bureau, 1997 Economic Census Mar. 15, 2001
Table 3. Statistics for Black~Owned Firms by Industry Division for States: 1997mCon.[Detail may not add to total because of rounding. This table is based on the 1987 SIC system. For meaning of abbreviations and symbols, see introductory text. For explanation of terms, seeAppendix A]
Geographic area and industry division
All firms1 Firms with paid employeesRelative standard error of
Agricultural services, forestry, fishing, and mining 93........... 4 888 12 D b D 19 68 72 D D DConstruction 264........................................... 42 627 104 36 753 458 9 351 7 11 13 12 24 18Manufacturing 65.......................................... 9 347 23 D c D 19 20 32 D D DTransportation, communications, and utilities 434............... 30 636 40 17 544 554 7 709 14 19 35 27 23 24Wholesale trade 90........................................ 24 931 17 D b D 12 9 35 D D DRetail trade 504............................................ 121 325 86 114 809 1 388 16 275 19 10 31 10 54 38Finance, insurance, and real estate 361....................... 28 975 69 20 093 235 4 789 13 44 25 66 60 59Services 2 990............................................... 178 341 366 131 776 2 352 52 845 6 7 20 9 6 7Industries not classified 751.................................. 63 040 177 54 439 3 021 28 411 13 49 29 57 65 77
West Virginia 1 148...................................... 87 649 129 76 923 1 018 14 203 3 7 14 8 28 23
Agricultural services, forestry, fishing, and mining S........... S S S S S S S S S S SConstruction 73........................................... 20 472 17 19 403 136 2 619 14 3 33 3 48 13Manufacturing 12.......................................... D – – – – 12 D – – – –Transportation, communications, and utilities 36............... 2 685 6 D b D 22 54 89 D D DWholesale trade 7........................................ D 1 D a D – D – D D DRetail trade 134............................................ 38 931 19 37 679 289 4 119 14 6 23 6 27 27Finance, insurance, and real estate 38....................... D 5 D a D 18 D 48 D D DServices 749............................................... 22 440 80 17 217 563 6 829 3 25 12 34 51 46Industries not classified 97.................................. 1 338 – – – – 20 26 – – – –
Agricultural services, forestry, fishing, and mining 25........... D 3 D a D 43 D – D D DConstruction 237........................................... 97 120 65 94 530 671 26 569 12 26 23 26 28 32Manufacturing 73.......................................... D 12 D c D 23 D 91 D D DTransportation, communications, and utilities 384............... 55 417 83 45 222 837 30 142 15 10 27 12 6 17Wholesale trade 54........................................ 25 047 23 24 002 108 2 656 20 34 24 35 26 37Retail trade 621............................................ 159 972 118 142 813 1 994 18 868 10 8 26 10 24 12Finance, insurance, and real estate 250....................... 12 247 28 7 131 93 1 235 12 25 31 44 34 15Services 2 685............................................... 167 407 358 134 268 4 196 55 148 5 8 12 9 15 11Industries not classified 521.................................. 17 264 109 D c D 19 45 62 D D D
Wyoming 232.......................................... 12 670 64 D c D 32 44 84 D D D
Agricultural services, forestry, fishing, and mining 1........... D – – – – – D – – – –Construction 11........................................... D 4 D b D 22 D 57 D D DManufacturing –.......................................... – – – – – – – – – – –Transportation, communications, and utilities 1............... D – – – – – D – – – –Wholesale trade 2........................................ D 2 D a D – D – D D DRetail trade 17............................................ D – – – – 50 D – – – –Finance, insurance, and real estate 7....................... D 1 D a D 74 D – D D DServices 70............................................... D 3 D a D 19 D – D D DIndustries not classified 123.................................. D 54 D b D 57 D 97 D D D
1All firms data include both firms with paid employees and firms with no paid employees.2For explanation of relative standard errors, see Reliability of Estimates in the introductory text.
26 BLACK MINORITY~OWNED BUSINESS ENTERPRISESU.S. Census Bureau, 1997 Economic Census Mar. 15, 2001
Table 4. Statistics by Industry Division for Selected Metropolitan Areas With 100 or MoreBlack~Owned Firms: 1997
[Detail may not add to total because of rounding. This table is based on the 1987 SIC system. For meaning of abbreviations and symbols, see introductory text. For explanation of terms, see AppendixA. For definition of MAs, see Appendix B]
Geographic area and industry division
All firms1 Firms with paid employeesRelative standard error of
Agricultural services, forestry, fishing, and mining 4............... D – – – – 82 D – – – –Construction 135............................................... 23 444 21 21 287 193 5 117 15 38 31 42 40 42Manufacturing 30.............................................. D 14 D b D 20 D 39 D D DTransportation, communications, and utilities 115................... D 1 D a D 51 D – D D DWholesale trade 19............................................ D – – – – 60 D – – – –Retail trade 165................................................ 8 996 12 6 291 61 1 168 41 49 70 70 65 75Finance, insurance, and real estate 45........................... 4 465 10 D a D 38 69 49 D D DServices 884................................................... 37 100 63 27 591 581 12 090 21 47 59 57 68 62Industries not classified 123...................................... 3 717 – – – – 38 58 – – – –
Albany, GA MSA 942................................... D 216 D g D 15 D 26 D D D
Agricultural services, forestry, fishing, and mining 13............... D 4 D c D 87 D 83 D D DConstruction 74............................................... 17 265 18 16 430 148 1 117 22 55 34 58 51 42Manufacturing 22.............................................. D 3 D a D 40 D 78 D D DTransportation, communications, and utilities 61................... D – – – – 63 D – – – –Wholesale trade 1............................................ D 1 D a D – D – D D DRetail trade 87................................................ D 17 D c D 59 D 35 D D DFinance, insurance, and real estate 46........................... D 15 D b D 25 D 54 D D DServices 546................................................... 37 459 159 33 619 760 18 755 26 50 35 55 39 56Industries not classified 93...................................... D – – – – 26 D – – – –
Agricultural services, forestry, fishing, and mining 10............... D – – – – 90 D – – – –Construction 56............................................... 2 517 35 D a D 28 27 51 D D DManufacturing 1.............................................. D – – – – – D – – – –Transportation, communications, and utilities 16................... D – – – – 59 D – – – –Wholesale trade 1............................................ D – – – – – D – – – –Retail trade 43................................................ D 8 15 631 195 2 664 73 D 65 67 34 54Finance, insurance, and real estate 20........................... D 2 D a D 38 D – D D DServices 497................................................... 9 088 17 D b D 24 33 79 D D DIndustries not classified S...................................... S S S S S S S S S S S
Construction 38............................................... 4 299 6 D b D 19 65 89 D D DManufacturing 5.............................................. D – – – – 85 D – – – –Transportation, communications, and utilities 3................... D – – – – 45 D – – – –Wholesale trade 23............................................ 933 – – – – 49 60 – – – –Retail trade 70................................................ D 14 D c D 31 D 50 D D DFinance, insurance, and real estate 51........................... D 7 D a D 22 D 78 D D DServices 223................................................... 18 091 19 15 434 233 6 430 10 1 14 1 1 1Industries not classified 233...................................... D 29 D a D 23 D 97 D D D
Agricultural services, forestry, fishing, and mining 13............... D 3 D b D 87 D 79 D D DConstruction 39............................................... D 4 D b D 39 D 84 D D DManufacturing 1.............................................. D – – – – – D – – – –Transportation, communications, and utilities S................... S S S S S S S S S S SWholesale trade 1............................................ D 1 D a D – D – D D DRetail trade 39................................................ 842 7 317 8 63 23 24 61 24 – 13Finance, insurance, and real estate 24........................... D 7 530 15 178 41 D 45 7 39 22Services 399................................................... 7 251 23 1 698 33 392 29 32 87 62 60 66Industries not classified 11...................................... D – – – – 90 D – – – –
Construction 8............................................... 546 3 D a D 38 35 79 D D DManufacturing S.............................................. S S S S S S S S S S STransportation, communications, and utilities 6................... D 3 D a D 76 D 77 D D DWholesale trade 7............................................ D 7 D b D 88 D 88 D D DRetail trade 44................................................ 27 695 28 27 396 209 3 768 42 16 69 16 43 35Finance, insurance, and real estate 8........................... D 4 D a D 45 D 81 D D DServices 157................................................... 39 444 16 23 298 205 8 223 26 35 68 38 67 70Industries not classified 16...................................... D – – – – 92 D – – – –
Agricultural services, forestry, fishing, and mining 2............... D – – – – – D – – – –Construction 29............................................... D 12 4 978 46 1 512 25 D 38 37 63 47Manufacturing 1.............................................. D – – – – – D – – – –Transportation, communications, and utilities 38................... 4 409 8 D a D 39 69 65 D D DWholesale trade 1............................................ D – – – – – D – – – –Retail trade 45................................................ 988 3 D a D 16 25 – D D DFinance, insurance, and real estate 15........................... D 2 D a D 26 D – D D DServices 419................................................... 27 707 35 22 076 494 8 275 8 10 36 13 7 14Industries not classified 104...................................... D – – – – 57 D – – – –
Agricultural services, forestry, fishing, and mining 25............... D 4 D c D 46 D 84 D D DConstruction 54............................................... 10 230 11 2 128 32 660 26 67 54 54 60 71Manufacturing 8.............................................. D 4 D f D 38 D – D D DTransportation, communications, and utilities 32................... 718 4 D a D 33 47 86 D D DWholesale trade 19............................................ D – – – – 71 D – – – –Retail trade 90................................................ 47 448 35 46 985 189 4 807 33 10 56 10 15 18Finance, insurance, and real estate 33........................... D 1 D a D 46 D – D D DServices 707................................................... 24 985 24 15 776 533 9 815 23 20 36 17 5 19Industries not classified 242...................................... 4 057 – – – – 31 39 – – – –
Agricultural services, forestry, fishing, and mining 9............... D – – – – 90 D – – – –Construction 14............................................... D 3 D b D 44 D 75 D D DTransportation, communications, and utilities 8................... D – – – – 34 D – – – –Retail trade S................................................ S S S S S S S S S S S
See footnotes at end of table.
MINORITY~OWNED BUSINESS ENTERPRISES BLACK 27U.S. Census Bureau, 1997 Economic Census Mar. 15, 2001
Table 4. Statistics by Industry Division for Selected Metropolitan Areas With 100 or MoreBlack~Owned Firms: 1997mCon.
[Detail may not add to total because of rounding. This table is based on the 1987 SIC system. For meaning of abbreviations and symbols, see introductory text. For explanation of terms, see AppendixA. For definition of MAs, see Appendix B]
Geographic area and industry division
All firms1 Firms with paid employeesRelative standard error of
estimate (percent)2
for columnmFirms(number)
Sales andreceipts($1,000)
Firms(number)
Sales andreceipts($1,000)
Employees(number)
Annualpayroll
($1,000)
A B C D E F A B C D E F
Anniston, AL MSAmCon.
Finance, insurance, and real estate 7........................... D 4 D a D 51 D 82 D D DServices 260................................................... 7 510 29 6 424 128 2 044 31 28 25 32 44 41Industries not classified 63...................................... D – – – – 80 D – – – –
Agricultural services, forestry, fishing, and mining 19............... D – – – – 56 D – – – –Construction 31............................................... 1 342 10 D b D 14 20 49 D D DTransportation, communications, and utilities 6................... D 3 D a D 48 D 78 D D DWholesale trade 5............................................ D – – – – 47 D – – – –Retail trade 85................................................ D 4 D a D 62 D 84 D D DFinance, insurance, and real estate 7........................... D – – – – 55 D – – – –Services 343................................................... 6 236 20 3 249 146 1 273 30 56 47 67 66 58Industries not classified 41...................................... D 34 D b D 75 D 94 D D D
Agricultural services, forestry, fishing, and mining 9............... D – – – – 90 D – – – –Construction 73............................................... D 31 D c D 16 D 44 D D DManufacturing 10.............................................. D – – – – 60 D – – – –Transportation, communications, and utilities 18................... D 8 D b D 34 D 83 D D DRetail trade 36................................................ D 23 D e D 42 D 71 D D DFinance, insurance, and real estate 3........................... D – – – – 74 D – – – –Services 255................................................... D 50 D c D 27 D 74 D D DIndustries not classified 67...................................... D – – – – 29 D – – – –
Agricultural services, forestry, fishing, and mining 9............... D – – – – 89 D – – – –Construction 77............................................... 67 135 35 D f D 11 84 25 D D DManufacturing 6.............................................. D – – – – 36 D – – – –Transportation, communications, and utilities 64................... D 7 D b D 19 D 77 D D DWholesale trade 8............................................ D – – – – 89 D – – – –Retail trade 170................................................ D 3 D c D 48 D – D D DFinance, insurance, and real estate 3........................... D – – – – 76 D – – – –Services 472................................................... 32 818 98 16 472 313 7 231 28 27 60 16 36 9Industries not classified 107...................................... D – – – – 59 D – – – –
Agricultural services, forestry, fishing, and mining 96............... 6 111 13 D c D 16 9 64 D D DConstruction 497............................................... 42 701 86 35 422 205 1 995 18 63 40 78 38 44Manufacturing 22.............................................. D 6 D b D 33 D 70 D D DTransportation, communications, and utilities 137................... 25 985 36 22 021 391 3 701 16 56 52 67 78 66Wholesale trade 33............................................ D 1 D a D 26 D – D D DRetail trade 625................................................ 26 509 100 20 374 512 5 478 18 11 32 14 5 12Finance, insurance, and real estate 187........................... 2 498 8 D a D 39 16 80 D D DServices 1 747................................................... 114 246 158 95 023 1 725 43 074 10 26 27 30 30 31Industries not classified 284...................................... 6 556 – – – – 29 68 – – – –
Agricultural services, forestry, fishing, and mining 46............... D 17 D b D 43 D 93 D D DConstruction 244............................................... 22 837 51 15 114 292 3 552 33 61 78 87 88 82Manufacturing 19.............................................. D 4 D b D 22 D – D D DTransportation, communications, and utilities 155................... 13 947 23 D c D 37 86 97 D D DWholesale trade 29............................................ D 12 D c D 58 D 91 D D DRetail trade 110................................................ D 3 D c D 52 D – D D DFinance, insurance, and real estate S........................... S S S S S S S S S S SServices 1 387................................................... 43 978 94 29 932 990 15 176 26 20 44 31 18 28Industries not classified 338...................................... 13 775 69 D b D 20 57 98 D D D
Agricultural services, forestry, fishing, and mining 137............... D 10 D b D 18 D 42 D D DConstruction 597............................................... D 216 D g D 14 D 24 D D DManufacturing 152.............................................. D 28 D e D 17 D 21 D D DTransportation, communications, and utilities 1 736................... 111 131 203 67 944 1 356 18 198 10 21 32 34 20 22Wholesale trade 162............................................ D 35 D c D 26 D 47 D D DRetail trade 2 011................................................ 407 498 371 D i D 10 22 25 D D DFinance, insurance, and real estate 951........................... D 91 D e D 13 D 32 D D DServices 8 836................................................... 423 756 649 D i D 5 9 13 D D DIndustries not classified 2 133...................................... 77 203 196 D e D 10 30 51 D D D
Barnstable–Yarmouth, MA MSA 233..................... 5 791 9 D b D 29 21 37 D D D
Agricultural services, forestry, fishing, and mining 7............... D – – – – 88 D – – – –Construction 26............................................... D 3 D a D 51 D 80 D D DManufacturing 1.............................................. D – – – – – D – – – –Transportation, communications, and utilities 6................... 698 2 D a D 38 43 73 D D DRetail trade 15................................................ D 4 D a D 31 D 54 D D DServices 115................................................... 2 096 – – – – 42 42 – – – –Industries not classified 64...................................... D – – – – 87 D – – – –
See footnotes at end of table.
28 BLACK MINORITY~OWNED BUSINESS ENTERPRISESU.S. Census Bureau, 1997 Economic Census Mar. 15, 2001
Table 4. Statistics by Industry Division for Selected Metropolitan Areas With 100 or MoreBlack~Owned Firms: 1997mCon.
[Detail may not add to total because of rounding. This table is based on the 1987 SIC system. For meaning of abbreviations and symbols, see introductory text. For explanation of terms, see AppendixA. For definition of MAs, see Appendix B]
Geographic area and industry division
All firms1 Firms with paid employeesRelative standard error of
Agricultural services, forestry, fishing, and mining 52............... D – – – – 75 D – – – –Construction 117............................................... 1 673 2 D a D 26 24 – D D DManufacturing 36.............................................. 10 270 13 9 582 119 3 088 21 27 54 29 34 29Transportation, communications, and utilities 76................... 11 256 25 10 476 50 1 338 35 55 60 59 30 36Wholesale trade 26............................................ D – – – – 91 D – – – –Retail trade 342................................................ 66 625 74 64 293 436 7 825 27 29 47 31 54 67Finance, insurance, and real estate S........................... S S S S S S S S S S SServices 645................................................... 7 471 – – – – 25 34 – – – –Industries not classified S...................................... S S S S S S S S S S S
Bellingham, WA MSA 109.............................. 3 950 2 D a D 41 6 – D D D
Construction 3............................................... D – – – – 77 D – – – –Transportation, communications, and utilities 4................... D – – – – 83 D – – – –Retail trade 2................................................ D 2 D a D – D – D D DFinance, insurance, and real estate 3........................... D – – – – 78 D – – – –Services 27................................................... D – – – – 46 D – – – –Industries not classified 69...................................... D – – – – 54 D – – – –
Benton Harbor, MI MSA 380............................ 42 082 43 D e D 19 29 43 D D D
Agricultural services, forestry, fishing, and mining 10............... D – – – – 90 D – – – –Construction 9............................................... D 1 D a D 30 D – D D DManufacturing 4.............................................. D 3 D e D 55 D 75 D D DTransportation, communications, and utilities 30................... D 1 D a D 55 D – D D DWholesale trade 15............................................ D – – – – 92 D – – – –Retail trade 46................................................ 17 344 27 16 715 47 1 287 35 14 62 14 31 24Services 210................................................... 7 432 11 D b D 28 13 57 D D DIndustries not classified 56...................................... D – – – – 94 D – – – –
Agricultural services, forestry, fishing, and mining 21............... D – – – – 55 D – – – –Construction 208............................................... 14 215 34 D b D 17 33 36 D D DManufacturing 37.............................................. D 5 D a D 16 D 58 D D DTransportation, communications, and utilities 296................... D 13 D a D 26 D 60 D D DWholesale trade 62............................................ 14 380 24 12 179 78 1 210 25 46 55 48 49 53Retail trade 288................................................ 47 078 28 39 827 348 4 100 21 56 47 61 45 28Finance, insurance, and real estate 314........................... 23 278 33 D b D 26 6 79 D D DServices 1 537................................................... 102 021 129 46 689 625 15 933 12 31 40 29 36 34Industries not classified 119...................................... D – – – – 52 D – – – –
Agricultural services, forestry, fishing, and mining S............... S S S S S S S S S S SConstruction 175............................................... D 19 D c D 27 D 75 D D DManufacturing 11.............................................. D – – – – 68 D – – – –Transportation, communications, and utilities 82................... D 5 D b D 26 D 53 D D DWholesale trade 5............................................ D 1 D a D 67 D – D D DRetail trade S................................................ S S S S S S S S S S SFinance, insurance, and real estate 47........................... D 1 D a D 47 D – D D DServices 700................................................... 29 944 109 20 471 479 6 476 16 21 49 26 20 17Industries not classified 114...................................... D – – – – 47 D – – – –
Construction 4............................................... D – – – – 83 D – – – –Wholesale trade 6............................................ D 6 D a D 86 D 86 D D DRetail trade 3................................................ D – – – – 75 D – – – –Services 143................................................... D 13 D e D 32 D 80 D D D
Boise City, ID MSA 112................................. 6 007 5 D b D 43 7 – D D D
Agricultural services, forestry, fishing, and mining 1............... D – – – – – D – – – –Construction 3............................................... D – – – – – D – – – –Retail trade 5................................................ D – – – – 47 D – – – –Finance, insurance, and real estate 4........................... D – – – – 57 D – – – –Services 45................................................... D 5 D b D 17 D – D D DIndustries not classified S...................................... S S S S S S S S S S S
See footnotes at end of table.
MINORITY~OWNED BUSINESS ENTERPRISES BLACK 29U.S. Census Bureau, 1997 Economic Census Mar. 15, 2001
Table 4. Statistics by Industry Division for Selected Metropolitan Areas With 100 or MoreBlack~Owned Firms: 1997mCon.
[Detail may not add to total because of rounding. This table is based on the 1987 SIC system. For meaning of abbreviations and symbols, see introductory text. For explanation of terms, see AppendixA. For definition of MAs, see Appendix B]
Geographic area and industry division
All firms1 Firms with paid employeesRelative standard error of
Agricultural services, forestry, fishing, and mining 28............... D 3 D a D 50 D 51 D D DConstruction 406............................................... 106 569 91 100 073 655 25 823 11 13 23 14 19 21Manufacturing 64.............................................. 41 657 15 D e D 14 57 29 D D DTransportation, communications, and utilities 1 090................... 47 161 26 25 663 130 4 503 7 22 23 35 22 22Wholesale trade 91............................................ 38 684 22 34 102 49 2 852 14 58 38 61 55 48Retail trade 610................................................ 116 802 188 107 578 952 12 032 14 9 17 11 14 19Finance, insurance, and real estate 268........................... 51 033 25 D c D 19 14 59 D D DServices 4 369................................................... 250 979 402 186 999 3 136 78 159 5 13 32 18 27 22Industries not classified 1 118...................................... D 76 D b D 18 D 76 D D D
Boulder–Longmont, CO PMSA 130...................... 5 581 7 D a D 24 63 76 D D D
Agricultural services, forestry, fishing, and mining 10............... D – – – – 90 D – – – –Construction 9............................................... D – – – – 27 D – – – –Manufacturing 5.............................................. D – – – – 63 D – – – –Transportation, communications, and utilities 4................... D – – – – 82 D – – – –Wholesale trade 6............................................ D – – – – 48 D – – – –Retail trade 14................................................ D – – – – 91 D – – – –Finance, insurance, and real estate 9........................... D – – – – 79 D – – – –Services 73................................................... 4 954 7 D a D 32 69 74 D D DIndustries not classified 1...................................... D – – – – – D – – – –
Brazoria, TX PMSA 457................................. 3 772 6 D a D 43 21 37 D D D
Agricultural services, forestry, fishing, and mining 53............... D – – – – 46 D – – – –Construction 3............................................... D – – – – – D – – – –Transportation, communications, and utilities 18................... 504 3 D a D 44 67 76 D D DRetail trade 60................................................ D – – – – 85 D – – – –Finance, insurance, and real estate 3........................... D – – – – 79 D – – – –Services 113................................................... 983 3 561 13 170 25 11 – – – –Industries not classified 207...................................... D – – – – 92 D – – – –
Bremerton, WA PMSA 164.............................. 3 145 1 D a D 27 31 – D D D
Agricultural services, forestry, fishing, and mining 8............... D – – – – 89 D – – – –Construction 5............................................... D – – – – 41 D – – – –Manufacturing 3.............................................. D – – – – 48 D – – – –Transportation, communications, and utilities 5................... D – – – – 46 D – – – –Wholesale trade S............................................ S S S S S S S S S S SRetail trade 18................................................ 78 – – – – 48 54 – – – –Finance, insurance, and real estate 38........................... D – – – – 53 D – – – –Services 85................................................... 1 519 1 D a D 48 58 – D D D
Construction 46............................................... 4 331 10 3 935 39 1 525 17 43 41 49 53 50Manufacturing 10.............................................. D 2 D a D 40 D 74 D D DTransportation, communications, and utilities 45................... 989 – – – – 22 14 – – – –Wholesale trade 5............................................ D 5 D b D 68 D 68 D D DRetail trade 62................................................ 1 511 10 D b D 32 47 93 D D DFinance, insurance, and real estate 24........................... D – – – – 49 D – – – –Services 389................................................... 8 657 29 4 900 191 1 607 30 28 58 57 74 63Industries not classified 53...................................... D – – – – 34 D – – – –
Bryan–College Station, TX MSA 248..................... D 38 D c D 32 D 83 D D D
Agricultural services, forestry, fishing, and mining 35............... 284 – – – – 46 58 – – – –Construction 68............................................... 2 978 34 D b D 46 83 92 D D DRetail trade 17................................................ D 1 D c D 50 D – D D DFinance, insurance, and real estate 4........................... D 3 D a D 58 D 77 D D DServices 125................................................... D – – – – 59 D – – – –
Agricultural services, forestry, fishing, and mining 20............... D – – – – 90 D – – – –Construction 86............................................... 35 901 57 35 044 364 5 764 22 41 33 42 34 33Manufacturing 9.............................................. D 6 D a D 56 D 87 D D DTransportation, communications, and utilities 142................... 11 944 2 D b D 45 13 – D D DRetail trade 204................................................ 16 225 25 6 693 243 1 741 42 40 60 12 6 11Finance, insurance, and real estate 107........................... D 12 D a D 74 D 83 D D DServices 859................................................... 51 644 57 42 073 963 25 880 23 73 42 82 52 82Industries not classified 488...................................... D 24 D c D 36 D 95 D D D
Canton–Massillon, OH MSA 544........................ 44 328 52 D f D 20 26 50 D D D
Agricultural services, forestry, fishing, and mining 9............... D – – – – 89 D – – – –Construction 26............................................... D 5 D b D 62 D 68 D D DManufacturing 20.............................................. D – – – – 63 D – – – –Transportation, communications, and utilities 32................... 4 230 2 D b D 30 10 – D D DWholesale trade 1............................................ D 1 D a D – D – D D DRetail trade 73................................................ 10 812 38 D e D 38 27 51 D D DFinance, insurance, and real estate 11........................... D – – – – 39 D – – – –Services 322................................................... D 6 594 3 41 32 D 58 40 – 17Industries not classified 50...................................... D – – – – 94 D – – – –
See footnotes at end of table.
30 BLACK MINORITY~OWNED BUSINESS ENTERPRISESU.S. Census Bureau, 1997 Economic Census Mar. 15, 2001
Table 4. Statistics by Industry Division for Selected Metropolitan Areas With 100 or MoreBlack~Owned Firms: 1997mCon.
[Detail may not add to total because of rounding. This table is based on the 1987 SIC system. For meaning of abbreviations and symbols, see introductory text. For explanation of terms, see AppendixA. For definition of MAs, see Appendix B]
Geographic area and industry division
All firms1 Firms with paid employeesRelative standard error of
estimate (percent)2
for columnmFirms(number)
Sales andreceipts($1,000)
Firms(number)
Sales andreceipts($1,000)
Employees(number)
Annualpayroll
($1,000)
A B C D E F A B C D E F
Cedar Rapids, IA MSA 149.............................. 11 974 33 10 519 179 2 198 27 13 67 13 49 21
Construction 8............................................... 129 – – – – 44 7 – – – –Manufacturing 20.............................................. D 19 D b D 88 D 92 D D DTransportation, communications, and utilities 4................... D 1 D b D 37 D – D D DWholesale trade 1............................................ D 1 D a D – D – D D DRetail trade 22................................................ D 8 D b D 56 D 47 D D DFinance, insurance, and real estate S........................... S S S S S S S S S S SServices 71................................................... 3 679 4 2 845 40 715 20 5 – – – –Industries not classified S...................................... S S S S S S S S S S S
Champaign–Urbana, IL MSA 706........................ D 24 D b D 18 D 38 D D D
Agricultural services, forestry, fishing, and mining 9............... D – – – – 89 D – – – –Construction 16............................................... D 4 D a D 41 D 83 D D DTransportation, communications, and utilities 5................... D – – – – 46 D – – – –Retail trade 17................................................ D 1 D b D 86 D – D D DFinance, insurance, and real estate 9........................... D 2 D a D 84 D 72 D D DServices 644................................................... 6 286 17 2 115 34 471 20 19 49 29 46 29Industries not classified 5...................................... D – – – – 86 D – – – –
Construction 32............................................... D 8 D a D 33 D 65 D D DManufacturing 4.............................................. 45 – – – – 34 6 – – – –Transportation, communications, and utilities 6................... D – – – – 20 D – – – –Wholesale trade 2............................................ D 1 D a D – D – D D DRetail trade 25................................................ D 2 D b D 31 D – D D DFinance, insurance, and real estate 14........................... D – – – – 35 D – – – –Services 236................................................... 11 385 38 D e D 12 53 27 D D DIndustries not classified 37...................................... D – – – – 46 D – – – –
Construction 23............................................... D 6 D a D 21 D 54 D D DManufacturing 12.............................................. D – – – – 37 D – – – –Transportation, communications, and utilities 86................... D 20 D b D 56 D 22 D D DRetail trade 13................................................ D 6 D c D 28 D 53 D D DFinance, insurance, and real estate 78........................... D – – – – 62 D – – – –Services 622................................................... 22 046 84 15 742 311 6 674 22 26 44 36 47 32Industries not classified 77...................................... D – – – – 69 D – – – –
Chattanooga, TN–GA MSA 857.......................... 75 999 164 D g D 9 20 21 D D D
Agricultural services, forestry, fishing, and mining 9............... D – – – – 89 D – – – –Construction 59............................................... 3 054 26 2 439 67 706 26 20 56 27 44 29Manufacturing 6.............................................. D – – – – 52 D – – – –Transportation, communications, and utilities 55................... D – – – – 17 D – – – –Wholesale trade 16............................................ D 4 D b D 18 D 58 D D DRetail trade 73................................................ 7 261 27 5 589 202 1 293 23 16 30 16 5 8Finance, insurance, and real estate 33........................... D 12 D b D 35 D 76 D D DServices 508................................................... 40 848 96 36 934 953 18 432 19 27 34 30 34 29Industries not classified 99...................................... D – – – – 49 D – – – –
Agricultural services, forestry, fishing, and mining 25............... D – – – – 40 D – – – –Construction 359............................................... 113 626 131 110 118 961 24 048 14 35 21 36 31 35Manufacturing 55.............................................. 25 012 3 D c D 36 5 54 D D DTransportation, communications, and utilities 337................... 63 467 28 57 683 650 25 515 27 47 43 53 44 51Wholesale trade 78............................................ D 30 D b D 34 D 52 D D DRetail trade 499................................................ 93 399 129 D g D 26 15 26 D D DFinance, insurance, and real estate 289........................... D 60 D g D 18 D 39 D D DServices 2 790................................................... 162 881 219 121 345 2 620 54 629 10 16 24 21 43 25
See footnotes at end of table.
MINORITY~OWNED BUSINESS ENTERPRISES BLACK 31U.S. Census Bureau, 1997 Economic Census Mar. 15, 2001
Table 4. Statistics by Industry Division for Selected Metropolitan Areas With 100 or MoreBlack~Owned Firms: 1997mCon.
[Detail may not add to total because of rounding. This table is based on the 1987 SIC system. For meaning of abbreviations and symbols, see introductory text. For explanation of terms, see AppendixA. For definition of MAs, see Appendix B]
Geographic area and industry division
All firms1 Firms with paid employeesRelative standard error of
estimate (percent)2
for columnmFirms(number)
Sales andreceipts($1,000)
Firms(number)
Sales andreceipts($1,000)
Employees(number)
Annualpayroll
($1,000)
A B C D E F A B C D E F
Cincinnati, OH–KY–IN PMSAmCon.
Industries not classified 295...................................... D – – – – 19 D – – – –
Agricultural services, forestry, fishing, and mining 10............... D – – – – 90 D – – – –Construction 80............................................... 3 049 3 D a D 33 21 – D D DTransportation, communications, and utilities S................... S S S S S S S S S S SWholesale trade 6............................................ D – – – – 48 D – – – –Retail trade 71................................................ 4 100 7 D a D 32 46 55 D D DFinance, insurance, and real estate 28........................... D 7 D a D 25 D 67 D D DServices 234................................................... 5 980 23 3 527 79 1 493 13 36 48 60 55 60Industries not classified 96...................................... D – – – – 54 D – – – –
Colorado Springs, CO MSA 704......................... 67 931 74 55 135 549 14 217 8 4 27 5 10 5
Agricultural services, forestry, fishing, and mining 5............... D 5 D b D 84 D 84 D D DConstruction 82............................................... 7 056 7 D b D 22 35 48 D D DManufacturing 8.............................................. D 3 D b D 53 D 78 D D DTransportation, communications, and utilities 64................... 3 090 1 D a D 19 30 – D D DWholesale trade 6............................................ D 1 D a D 56 D – D D DRetail trade 190................................................ D 13 D b D 29 D 62 D D DFinance, insurance, and real estate 55........................... D 1 D a D 42 D – D D DServices 230................................................... 49 094 43 46 388 348 11 873 17 3 49 3 2 2Industries not classified 65...................................... 1 159 – – – – 28 63 – – – –
Columbia, MO MSA 415................................ D 34 D b D 33 D 40 D D D
Agricultural services, forestry, fishing, and mining 29............... D – – – – 41 D – – – –Construction 69............................................... D 7 D a D 82 D 80 D D DManufacturing 1.............................................. D – – – – – D – – – –Transportation, communications, and utilities 6................... D 3 D a D 50 D 80 D D DWholesale trade 8............................................ D – – – – 89 D – – – –Retail trade 30................................................ D 9 D a D 41 D 91 D D DFinance, insurance, and real estate 9........................... D – – – – 89 D – – – –Services 150................................................... D 14 D a D 38 D 61 D D DIndustries not classified 112...................................... D – – – – 59 D – – – –
Agricultural services, forestry, fishing, and mining 54............... D – – – – 27 D – – – –Construction 110............................................... 22 969 25 D c D 28 69 26 D D DManufacturing 21.............................................. D 4 D a D 27 D 59 D D DTransportation, communications, and utilities 46................... 3 055 16 D b D 23 29 46 D D DRetail trade 134................................................ D 4 536 6 79 27 D – – – –Finance, insurance, and real estate 90........................... D 2 D a D 67 D – D D DServices 1 180................................................... 119 003 162 103 108 1 236 43 653 12 49 34 55 22 59Industries not classified 366...................................... D – – – – 29 D – – – –
Agricultural services, forestry, fishing, and mining 42............... 787 12 D a D 35 40 61 D D DConstruction 312............................................... 109 062 109 94 493 830 18 559 16 18 21 18 35 13Manufacturing 43.............................................. D 18 D e D 13 D 42 D D DTransportation, communications, and utilities 468................... 22 438 16 D b D 21 38 37 D D DWholesale trade 65............................................ 113 079 30 112 049 210 7 717 33 36 61 37 47 39Retail trade 339................................................ 37 344 118 31 821 421 4 130 22 31 34 33 18 23Finance, insurance, and real estate 291........................... D 40 D c D 31 D 47 D D DServices 2 919................................................... 167 973 358 128 186 1 960 40 571 7 21 27 25 22 22Industries not classified 476...................................... 18 739 56 D c D 16 76 99 D D D
Corpus Christi, TX MSA 188............................ 8 181 7 D b D 38 49 34 D D D
Agricultural services, forestry, fishing, and mining 2............... D 1 D a D – D – D D DConstruction S............................................... S S S S S S S S S S SManufacturing 5.............................................. D – – – – 84 D – – – –Retail trade 52................................................ D 5 D b D 52 D 47 D D DFinance, insurance, and real estate 105........................... D – – – – 58 D – – – –Services 1................................................... D 1 D a D – D – D D D
Agricultural services, forestry, fishing, and mining 353............... D 52 D e D 22 D 81 D D DConstruction 622............................................... 142 064 127 126 348 1 240 21 050 13 35 28 40 48 39Manufacturing 198.............................................. 142 518 40 139 974 617 16 734 9 30 43 31 23 32
See footnotes at end of table.
32 BLACK MINORITY~OWNED BUSINESS ENTERPRISESU.S. Census Bureau, 1997 Economic Census Mar. 15, 2001
Table 4. Statistics by Industry Division for Selected Metropolitan Areas With 100 or MoreBlack~Owned Firms: 1997mCon.
[Detail may not add to total because of rounding. This table is based on the 1987 SIC system. For meaning of abbreviations and symbols, see introductory text. For explanation of terms, see AppendixA. For definition of MAs, see Appendix B]
Geographic area and industry division
All firms1 Firms with paid employeesRelative standard error of
estimate (percent)2
for columnmFirms(number)
Sales andreceipts($1,000)
Firms(number)
Sales andreceipts($1,000)
Employees(number)
Annualpayroll
($1,000)
A B C D E F A B C D E F
Dallas, TX PMSAmCon.
Transportation, communications, and utilities 2 003................... 823 328 265 763 321 676 18 494 19 73 56 79 60 38Wholesale trade 295............................................ 269 819 191 266 338 1 138 41 562 26 41 39 41 42 54Retail trade 801................................................ 239 588 64 211 504 686 17 189 17 4 41 2 5 6Finance, insurance, and real estate 582........................... D 17 21 409 117 7 500 22 D 13 – 2 –Services 7 250................................................... 500 060 1 086 394 525 8 939 180 018 12 29 30 37 41 46Industries not classified 1 917...................................... 62 936 87 D g D 29 47 70 D D D
Agricultural services, forestry, fishing, and mining 18............... D – – – – 56 D – – – –Construction 34............................................... D 4 D a D 34 D 55 D D DManufacturing 1.............................................. D – – – – 39 D – – – –Transportation, communications, and utilities 11................... D – – – – 70 D – – – –Wholesale trade S............................................ S S S S S S S S S S SRetail trade 38................................................ 3 190 12 D b D 26 62 94 D D DServices 208................................................... D 8 D b D 31 D 60 D D DIndustries not classified 76...................................... D – – – – 91 D – – – –
Danville, VA MSA 720.................................. D 61 D e D 20 D 38 D D D
Agricultural services, forestry, fishing, and mining 1............... D – – – – – D – – – –Construction 31............................................... D 20 D b D 53 D 84 D D DManufacturing 14.............................................. D – – – – 50 D – – – –Transportation, communications, and utilities 79................... D 7 D b D 66 D 53 D D DWholesale trade 17............................................ D 7 D a D 68 D 50 D D DRetail trade 165................................................ D 1 D c D 33 D – D D DFinance, insurance, and real estate 43........................... D – – – – 50 D – – – –Services 371................................................... D 26 3 015 94 1 313 33 D 62 50 55 58
Construction 18............................................... D 1 D a D 32 D – D D DTransportation, communications, and utilities 9................... D 2 D c D 48 D – D D DWholesale trade 1............................................ D 1 D b D – D – D D DRetail trade 54................................................ D 50 D b D 82 D 88 D D DFinance, insurance, and real estate 28........................... D 1 D a D 23 D – D D DServices 213................................................... 4 447 14 2 959 52 948 24 16 45 25 28 18Industries not classified 100...................................... D 55 D c D 59 D 95 D D D
Agricultural services, forestry, fishing, and mining 26............... 529 – – – – 38 72 – – – –Construction 164............................................... 30 701 45 24 644 175 5 164 22 15 25 14 16 16Manufacturing 31.............................................. D 15 D c D 21 D 29 D D DTransportation, communications, and utilities 74................... 25 580 10 22 177 256 10 354 20 3 44 1 9 1Wholesale trade 33............................................ D 6 D b D 54 D 88 D D DRetail trade 323................................................ 179 128 112 177 032 2 579 25 306 40 32 52 32 57 50Finance, insurance, and real estate 158........................... D 5 D a D 35 D – D D DServices 1 442................................................... 106 383 194 85 381 2 153 35 833 14 9 31 10 27 16Industries not classified 209...................................... D – – – – 41 D – – – –
Agricultural services, forestry, fishing, and mining 103............... 2 687 9 D b D 34 32 92 D D DConstruction 30............................................... 3 876 6 2 341 29 329 44 22 40 28 57 57Manufacturing 11.............................................. D 1 D c D 38 D – D D DTransportation, communications, and utilities 44................... D 6 D a D 34 D 89 D D DRetail trade 18................................................ D 1 D a D 57 D – D D DFinance, insurance, and real estate 98........................... D – – – – 31 D – – – –Services 488................................................... 6 854 21 3 860 70 1 224 21 18 47 29 11 5Industries not classified 302...................................... D – – – – 73 D – – – –
Agricultural services, forestry, fishing, and mining S............... S S S S S S S S S S SConstruction 50............................................... 2 416 14 D b D 42 64 93 D D DManufacturing 2.............................................. D – – – – – D – – – –Transportation, communications, and utilities S................... S S S S S S S S S S SRetail trade 32................................................ 4 550 9 D b D 27 62 67 D D DFinance, insurance, and real estate 3........................... D – – – – 78 D – – – –Services 59................................................... 3 106 19 D c D 14 34 28 D D D
Decatur, IL MSA 509................................... 26 647 8 D b D 22 3 66 D D D
Construction 39............................................... D 6 D a D 42 D 87 D D DTransportation, communications, and utilities 3................... D – – – – 78 D – – – –Wholesale trade 14............................................ D – – – – 57 D – – – –Retail trade 11................................................ D 1 D b D 34 D – D D DServices 442................................................... D 1 D a D 26 D – D D D
Agricultural services, forestry, fishing, and mining 43............... 1 314 3 D a D 39 45 78 D D DConstruction 168............................................... 43 168 49 39 621 232 6 432 16 7 40 6 17 14Manufacturing 48.............................................. 33 451 25 D e D 15 13 25 D D DTransportation, communications, and utilities 386................... 16 258 13 6 936 99 1 106 9 7 29 9 5 9Wholesale trade 64............................................ 93 535 16 D c D 23 42 45 D D DRetail trade 433................................................ 44 935 78 34 885 745 7 164 12 15 24 17 28 23Finance, insurance, and real estate 266........................... 21 610 26 D b D 17 34 29 D D DServices 1 788................................................... 123 152 242 101 402 1 519 32 626 10 30 26 36 27 32Industries not classified 468...................................... 11 809 104 D b D 18 28 58 D D D
Des Moines, IA MSA 460............................... 146 865 86 141 491 679 20 576 8 14 19 15 20 30
Agricultural services, forestry, fishing, and mining 11............... 44 – – – – 36 48 – – – –Construction 45............................................... 29 652 24 29 233 35 7 945 23 63 45 64 50 74Manufacturing 32.............................................. D 13 D c D 44 D 86 D D DTransportation, communications, and utilities 6................... D 1 D b D – D – D D D
See footnotes at end of table.
MINORITY~OWNED BUSINESS ENTERPRISES BLACK 33U.S. Census Bureau, 1997 Economic Census Mar. 15, 2001
Table 4. Statistics by Industry Division for Selected Metropolitan Areas With 100 or MoreBlack~Owned Firms: 1997mCon.
[Detail may not add to total because of rounding. This table is based on the 1987 SIC system. For meaning of abbreviations and symbols, see introductory text. For explanation of terms, see AppendixA. For definition of MAs, see Appendix B]
Geographic area and industry division
All firms1 Firms with paid employeesRelative standard error of
estimate (percent)2
for columnmFirms(number)
Sales andreceipts($1,000)
Firms(number)
Sales andreceipts($1,000)
Employees(number)
Annualpayroll
($1,000)
A B C D E F A B C D E F
Des Moines, IA MSAmCon.
Wholesale trade 9............................................ D 3 D a D 31 D 78 D D DRetail trade 42................................................ 86 763 16 86 007 252 5 517 33 2 35 2 12 3Finance, insurance, and real estate 7........................... D 4 D b D 32 D 40 D D DServices 267................................................... 10 476 26 7 027 150 2 209 14 18 43 23 12 13Industries not classified 42...................................... 404 – – – – 22 19 – – – –
Agricultural services, forestry, fishing, and mining 9............... D – – – – 90 D – – – –Construction 86............................................... 3 023 20 D b D 25 47 81 D D DManufacturing 9.............................................. D 1 D a D 60 D – D D DTransportation, communications, and utilities S................... S S S S S S S S S S SRetail trade 30................................................ D 7 D b D 26 D 58 D D DFinance, insurance, and real estate 2........................... D 1 D a D – D – D D DServices 155................................................... 6 400 23 5 789 211 3 228 21 50 30 54 42 64Industries not classified 72...................................... D – – – – 70 D – – – –
Agricultural services, forestry, fishing, and mining 15............... D – – – – 92 D – – – –Construction 15............................................... D 3 D b D 16 D 82 D D DManufacturing 3.............................................. D – – – – – D – – – –Transportation, communications, and utilities 48................... D 6 D a D 16 D 53 D D DWholesale trade 1............................................ D – – – – – D – – – –Retail trade 31................................................ D 2 D b D 24 D – D D DFinance, insurance, and real estate 17........................... D 2 D a D 24 D – D D DServices 280................................................... 14 095 31 11 605 250 4 168 21 27 19 33 27 32Industries not classified 60...................................... 794 – – – – 20 49 – – – –
Dutchess County, NY PMSA 441........................ 15 244 14 5 226 60 1 808 32 40 66 53 62 58
Construction 29............................................... D – – – – 34 D – – – –Manufacturing 3.............................................. D 3 D a D 78 D 78 D D DTransportation, communications, and utilities 2................... D – – – – – D – – – –Wholesale trade 1............................................ D – – – – – D – – – –Retail trade S................................................ S S S S S S S S S S SFinance, insurance, and real estate 84........................... D 1 D a D 80 D – D D DServices 220................................................... 3 223 10 D b D 39 67 93 D D D
Agricultural services, forestry, fishing, and mining 15............... D 9 D a D 58 D 90 D D DConstruction 1............................................... D 1 D a D – D – D D DManufacturing 1.............................................. D 1 D c D – D – D D DRetail trade 47................................................ D 10 D b D 33 D 63 D D DFinance, insurance, and real estate 4........................... D – – – – 83 D – – – –Services 257................................................... 6 117 83 D e D 36 59 66 D D DIndustries not classified 58...................................... D – – – – 92 D – – – –
Evansville–Henderson, IN–KY MSA 253................. D 17 7 689 234 2 216 10 D 41 40 71 63
Construction 14............................................... D 6 D b D 39 D 54 D D DManufacturing 3.............................................. D – – – – 79 D – – – –Transportation, communications, and utilities 11................... D 2 D a D 54 D 68 D D DWholesale trade S............................................ S S S S S S S S S S SRetail trade 15................................................ D – – – – 56 D – – – –Finance, insurance, and real estate 17........................... D 1 D a D 46 D – D D DServices 119................................................... 1 546 5 D c D 17 39 69 D D DIndustries not classified 70...................................... 976 – – – – 33 57 – – – –
Agricultural services, forestry, fishing, and mining 39............... 146 – – – – 31 46 – – – –Construction 87............................................... D 3 D a D 29 D 81 D D DManufacturing 17.............................................. D 6 D e D 28 D 52 D D DTransportation, communications, and utilities 37................... 3 333 16 D b D 39 44 46 D D DWholesale trade 17............................................ 84 – – – – 43 43 – – – –Retail trade 173................................................ 216 605 58 216 227 426 11 784 34 54 36 54 42 51Finance, insurance, and real estate 100........................... 7 747 – – – – 29 83 – – – –Services 1 024................................................... 37 629 92 25 313 361 7 241 11 24 35 37 46 56Industries not classified 186...................................... 2 223 – – – – 38 45 – – – –
See footnotes at end of table.
34 BLACK MINORITY~OWNED BUSINESS ENTERPRISESU.S. Census Bureau, 1997 Economic Census Mar. 15, 2001
Table 4. Statistics by Industry Division for Selected Metropolitan Areas With 100 or MoreBlack~Owned Firms: 1997mCon.
[Detail may not add to total because of rounding. This table is based on the 1987 SIC system. For meaning of abbreviations and symbols, see introductory text. For explanation of terms, see AppendixA. For definition of MAs, see Appendix B]
Geographic area and industry division
All firms1 Firms with paid employeesRelative standard error of
Agricultural services, forestry, fishing, and mining 9............... D – – – – 90 D – – – –Construction 44............................................... 3 300 13 2 649 37 420 33 56 46 73 57 66Manufacturing 5.............................................. D – – – – 50 D – – – –Transportation, communications, and utilities 3................... D – – – – 75 D – – – –Wholesale trade 4............................................ D 1 D a D 54 D – D D DRetail trade 44................................................ 3 098 5 D c D 25 61 88 D D DFinance, insurance, and real estate 42........................... D – – – – 94 D – – – –Services 209................................................... 2 452 8 D b D 33 25 42 D D DIndustries not classified 17...................................... D – – – – 41 D – – – –
Agricultural services, forestry, fishing, and mining 18............... D – – – – 56 D – – – –Construction 167............................................... 11 393 53 6 216 115 1 555 24 32 35 23 26 25Manufacturing 7.............................................. D 4 D a D 33 D 58 D D DTransportation, communications, and utilities 133................... 3 574 44 D a D 42 44 90 D D DWholesale trade 8............................................ 1 597 2 D a D 31 49 72 D D DRetail trade 247................................................ 4 097 21 D b D 33 35 52 D D DFinance, insurance, and real estate 34........................... D 9 D a D 55 D 54 D D DServices 523................................................... 17 896 40 10 637 316 2 981 24 26 35 44 39 32Industries not classified S...................................... S S S S S S S S S S S
Agricultural services, forestry, fishing, and mining 332............... D 83 D b D 15 D 43 D D DConstruction 773............................................... D 99 D e D 10 D 25 D D DManufacturing 143.............................................. D 40 D c D 19 D 30 D D DTransportation, communications, and utilities 1 166................... D 300 D a D 28 D 98 D D DWholesale trade 48............................................ D – – – – 29 D – – – –Retail trade 613................................................ 86 937 131 76 901 1 951 17 203 23 47 30 54 67 55Finance, insurance, and real estate 275........................... 31 900 64 25 630 207 3 330 30 35 53 38 43 33Services 7 272................................................... 227 445 434 135 982 2 730 38 178 10 27 29 43 39 36Industries not classified 2 246...................................... 89 033 103 D e D 24 32 65 D D D
Agricultural services, forestry, fishing, and mining 3............... D – – – – 80 D – – – –Construction 134............................................... D 9 D b D 19 D 58 D D DManufacturing S.............................................. S S S S S S S S S S STransportation, communications, and utilities 298................... D – – – – 75 D – – – –Retail trade 77................................................ D – – – – 81 D – – – –Finance, insurance, and real estate 1........................... D – – – – – D – – – –Services 307................................................... D 1 D b D 59 D – D D DIndustries not classified 350...................................... D – – – – 61 D – – – –
Agricultural services, forestry, fishing, and mining 43............... D 34 D c D 42 D 57 D D DConstruction 82............................................... D 20 D c D 32 D 43 D D DManufacturing 3.............................................. D – – – – 79 D – – – –Transportation, communications, and utilities 51................... D 6 D c D 74 D 88 D D DWholesale trade 1............................................ D – – – – – D – – – –Retail trade 51................................................ 3 374 11 D b D 43 43 92 D D DFinance, insurance, and real estate 43........................... D – – – – 94 D – – – –Services 283................................................... 28 229 25 25 314 197 5 509 43 35 73 34 36 21Industries not classified 53...................................... D – – – – 94 D – – – –
Agricultural services, forestry, fishing, and mining 15............... D – – – – 92 D – – – –Construction 33............................................... D 4 D b D 32 D 85 D D DManufacturing 2.............................................. D 1 D a D – D – D D DTransportation, communications, and utilities 18................... D – – – – 58 D – – – –Retail trade 27................................................ D – – – – 59 D – – – –Services 24................................................... D 3 D a D 19 D 77 D D DIndustries not classified 7...................................... D – – – – 88 D – – – –
Fort Walton Beach, FL MSA 489........................ 83 379 157 D f D 22 40 65 D D D
Construction 130............................................... 21 467 40 20 634 291 4 899 18 70 40 73 61 73Transportation, communications, and utilities 20................... D 7 D b D 41 D 89 D D DWholesale trade 3............................................ D – – – – 76 D – – – –Retail trade 39................................................ D 2 D c D 49 D – D D DServices 163................................................... 20 986 9 19 730 174 7 734 34 2 – – – –Industries not classified 135...................................... D 99 D b D 68 D 96 D D D
Fort Wayne, IN MSA 572............................... 48 510 87 40 612 1 073 15 744 20 15 23 18 8 7
Construction 32............................................... 1 604 9 D b D 14 44 57 D D DManufacturing 3.............................................. D – – – – 74 D – – – –Transportation, communications, and utilities 16................... D 1 D b D 38 D – D D DWholesale trade 9............................................ D 1 D a D 52 D – D D DRetail trade 50................................................ 9 955 16 9 267 61 1 227 31 73 47 79 50 68Finance, insurance, and real estate 10........................... D – – – – 61 D – – – –Services 419................................................... 27 527 60 22 829 964 13 767 28 9 36 11 10 6Industries not classified 36...................................... D – – – – 29 D – – – –
Agricultural services, forestry, fishing, and mining 96............... D – – – – 30 D – – – –Construction 399............................................... 34 915 131 29 349 551 5 575 19 40 37 47 45 49Manufacturing 86.............................................. D 2 D a D 24 D 76 D D DTransportation, communications, and utilities 390................... 21 814 17 D c D 28 25 42 D D DWholesale trade S............................................ S S S S S S S S S S SRetail trade 353................................................ 71 910 39 67 961 296 5 158 43 13 37 14 28 12Finance, insurance, and real estate 246........................... D 92 D e D 43 D 65 D D DServices 1 546................................................... 772 030 229 755 983 15 933 379 178 14 91 51 94 97 94
See footnotes at end of table.
MINORITY~OWNED BUSINESS ENTERPRISES BLACK 35U.S. Census Bureau, 1997 Economic Census Mar. 15, 2001
Table 4. Statistics by Industry Division for Selected Metropolitan Areas With 100 or MoreBlack~Owned Firms: 1997mCon.
[Detail may not add to total because of rounding. This table is based on the 1987 SIC system. For meaning of abbreviations and symbols, see introductory text. For explanation of terms, see AppendixA. For definition of MAs, see Appendix B]
Geographic area and industry division
All firms1 Firms with paid employeesRelative standard error of
estimate (percent)2
for columnmFirms(number)
Sales andreceipts($1,000)
Firms(number)
Sales andreceipts($1,000)
Employees(number)
Annualpayroll
($1,000)
A B C D E F A B C D E F
Fort Worth–Arlington, TX PMSAmCon.
Industries not classified 224...................................... D – – – – 45 D – – – –
Agricultural services, forestry, fishing, and mining 3............... D – – – – 74 D – – – –Construction 21............................................... D – – – – 93 D – – – –Manufacturing 6.............................................. D – – – – 86 D – – – –Transportation, communications, and utilities 1................... D – – – – – D – – – –Wholesale trade 3............................................ D – – – – 74 D – – – –Retail trade 1................................................ D 1 D a D – D – D D DFinance, insurance, and real estate 40........................... D 6 D a D 70 D 88 D D DServices 1 345................................................... 118 610 69 D g D 40 81 80 D D DIndustries not classified 176...................................... D 147 D c D 78 D 95 D D D
Construction 11............................................... D – – – – 33 D – – – –Manufacturing 9.............................................. D – – – – 89 D – – – –Transportation, communications, and utilities 4................... D 1 D b D 55 D – D D DWholesale trade 3............................................ D – – – – 77 D – – – –Retail trade 17................................................ 235 1 D a D 36 20 – D D DServices 84................................................... 1 510 15 D c D 16 19 39 D D DIndustries not classified 17...................................... D – – – – 28 D – – – –
Agricultural services, forestry, fishing, and mining 34............... D – – – – 45 D – – – –Construction 62............................................... 6 075 31 5 016 163 2 037 26 39 40 49 41 48Manufacturing 12.............................................. D 7 D a D 39 D 56 D D DTransportation, communications, and utilities 159................... 10 611 69 D c D 44 43 96 D D DRetail trade 35................................................ D – – – – 72 D – – – –Finance, insurance, and real estate 3........................... D – – – – 80 D – – – –Services 349................................................... D 13 1 458 33 326 32 D 51 34 20 29Industries not classified 27...................................... D 21 D b D 69 D 93 D D D
Construction 59............................................... D 10 D a D 51 D 83 D D DManufacturing 8.............................................. D 5 D b D 55 D 86 D D DTransportation, communications, and utilities 182................... D 1 D a D 54 D – D D DWholesale trade 17............................................ D – – – – 92 D – – – –Retail trade 237................................................ 9 413 36 7 829 311 2 272 43 69 71 85 93 89Finance, insurance, and real estate S........................... S S S S S S S S S S SServices 602................................................... 9 162 83 5 632 246 2 017 31 42 70 70 91 82
Agricultural services, forestry, fishing, and mining 9............... D – – – – 90 D – – – –Construction 150............................................... 44 856 28 41 653 279 9 676 11 26 32 27 32 32Manufacturing 21.............................................. D 3 D a D 55 D 80 D D DTransportation, communications, and utilities 153................... 15 726 27 8 790 338 3 435 36 29 23 28 43 23Wholesale trade 11............................................ D 1 D a D 40 D – D D DRetail trade 323................................................ 31 541 65 23 711 207 1 871 19 15 19 18 20 23Finance, insurance, and real estate 119........................... D 13 D b D 18 D 33 D D DServices 1 545................................................... 74 612 172 61 199 2 018 30 775 10 23 20 27 43 29Industries not classified 224...................................... 23 322 91 D c D 36 58 67 D D D
Agricultural services, forestry, fishing, and mining 14............... D 10 D a D 63 D 91 D D DConstruction 64............................................... 7 887 5 D b D 25 12 53 D D DManufacturing 10.............................................. D 2 D a D 44 D – D D DTransportation, communications, and utilities 72................... D 26 D a D 25 D 66 D D DWholesale trade 13............................................ D 1 D b D 53 D – D D DRetail trade 115................................................ 38 546 41 37 806 569 4 790 28 51 45 52 23 31Finance, insurance, and real estate 62........................... D – – – – 82 D – – – –Services 687................................................... 30 839 24 22 800 432 12 278 18 26 36 35 19 42Industries not classified 191...................................... 9 908 – – – – 35 84 – – – –
Agricultural services, forestry, fishing, and mining 60............... D 4 D b D 38 D 84 D D DConstruction 91............................................... 7 421 16 6 146 67 1 062 29 60 23 70 48 65Manufacturing 9.............................................. D – – – – 36 D – – – –
See footnotes at end of table.
36 BLACK MINORITY~OWNED BUSINESS ENTERPRISESU.S. Census Bureau, 1997 Economic Census Mar. 15, 2001
Table 4. Statistics by Industry Division for Selected Metropolitan Areas With 100 or MoreBlack~Owned Firms: 1997mCon.
[Detail may not add to total because of rounding. This table is based on the 1987 SIC system. For meaning of abbreviations and symbols, see introductory text. For explanation of terms, see AppendixA. For definition of MAs, see Appendix B]
Geographic area and industry division
All firms1 Firms with paid employeesRelative standard error of
estimate (percent)2
for columnmFirms(number)
Sales andreceipts($1,000)
Firms(number)
Sales andreceipts($1,000)
Employees(number)
Annualpayroll
($1,000)
A B C D E F A B C D E F
Greenville, NC MSAmCon.
Transportation, communications, and utilities 116................... 10 036 30 6 490 58 1 343 46 35 54 52 39 42Retail trade 192................................................ D 14 D a D 41 D 95 D D DFinance, insurance, and real estate 7........................... D 4 D a D 54 D 84 D D DServices 683................................................... 18 670 101 13 432 452 6 167 17 16 55 20 28 23Industries not classified 176...................................... 7 703 22 D c D 34 67 96 D D D
Agricultural services, forestry, fishing, and mining 78............... D 10 D b D 20 D 92 D D DConstruction 364............................................... 43 377 146 37 118 846 11 855 16 23 29 27 24 30Manufacturing 47.............................................. D 13 D c D 33 D 82 D D DTransportation, communications, and utilities 172................... 8 038 13 4 580 101 1 280 33 19 34 12 12 18Wholesale trade 54............................................ 6 327 9 D b D 29 75 85 D D DRetail trade 313................................................ 20 755 57 17 226 297 2 895 23 34 27 40 57 62Finance, insurance, and real estate 153........................... 6 079 19 D b D 41 45 36 D D DServices 1 133................................................... 59 581 152 41 630 1 658 19 655 15 17 28 12 3 7Industries not classified 241...................................... 2 657 – – – – 42 49 – – – –
Construction S............................................... S S S S S S S S S S SManufacturing 1.............................................. D – – – – – D – – – –Transportation, communications, and utilities 9................... D – – – – 83 D – – – –Wholesale trade 7............................................ D – – – – 51 D – – – –Retail trade 81................................................ D 5 D e D 67 D 33 D D DFinance, insurance, and real estate 7........................... D 1 D a D 44 D – D D DServices 149................................................... D 17 D b D 28 D 73 D D DIndustries not classified 7...................................... D – – – – 60 D – – – –
Agricultural services, forestry, fishing, and mining 9............... D 1 D b D 80 D – D D DConstruction 25............................................... 6 560 8 6 306 92 2 557 40 42 39 44 47 48Manufacturing 1.............................................. D – – – – – D – – – –Transportation, communications, and utilities 86................... D – – – – 61 D – – – –Wholesale trade 4............................................ D 1 D a D 58 D – D D DRetail trade 56................................................ 14 016 32 13 409 234 1 917 30 39 53 41 17 13Finance, insurance, and real estate 14........................... D 1 D a D 25 D – D D DServices 319................................................... 10 814 19 D c D 28 28 30 D D DIndustries not classified S...................................... S S S S S S S S S S S
Agricultural services, forestry, fishing, and mining 18............... D 18 D b D 56 D 56 D D DConstruction 265............................................... 27 712 89 24 294 263 6 115 10 25 21 28 29 34Manufacturing 21.............................................. D 10 D c D 20 D 36 D D DTransportation, communications, and utilities 180................... 21 524 54 18 389 190 4 346 14 17 28 19 11 13Wholesale trade 43............................................ D – – – – 27 D – – – –Retail trade 333................................................ 56 447 46 48 436 173 4 975 20 7 32 6 11 10Finance, insurance, and real estate 110........................... 14 708 1 D c D 18 7 – D D DServices 1 370................................................... 46 498 86 32 251 390 10 504 13 25 16 37 41 41Industries not classified 439...................................... 13 503 56 D c D 27 52 99 D D D
Agricultural services, forestry, fishing, and mining 20............... D – – – – 54 D – – – –Construction 26............................................... D 1 D a D 45 D – D D DManufacturing 3.............................................. D – – – – 77 D – – – –Transportation, communications, and utilities 11................... D – – – – 38 D – – – –Wholesale trade 5............................................ D 1 D a D 67 D – D D DRetail trade 27................................................ D 6 D b D 21 D 38 D D DFinance, insurance, and real estate 5........................... D 2 D a D 49 D – D D DServices 99................................................... 1 545 7 D b D 15 19 34 D D DIndustries not classified 57...................................... D – – – – 63 D – – – –
Agricultural services, forestry, fishing, and mining 9............... D – – – – 90 D – – – –Construction 43............................................... D 11 D b D 44 D 65 D D DManufacturing 6.............................................. D – – – – 47 D – – – –Transportation, communications, and utilities 18................... 557 3 D a D 23 51 82 D D DWholesale trade S............................................ S S S S S S S S S S SRetail trade 22................................................ 4 221 6 D a D 35 42 51 D D DServices 222................................................... 9 201 27 5 859 386 3 702 23 49 53 69 84 77Industries not classified 60...................................... D – – – – 81 D – – – –
Construction 18............................................... D 12 D b D 35 D 53 D D DManufacturing 1.............................................. D – – – – – D – – – –Transportation, communications, and utilities 7................... D 1 D a D – D – D D DWholesale trade S............................................ S S S S S S S S S S SRetail trade 57................................................ D – – – – 17 D – – – –Finance, insurance, and real estate 16........................... D 1 D a D 6 D – D D DServices 242................................................... 13 316 8 D e D 14 2 – D D DIndustries not classified 186...................................... D 129 D c D 64 D 96 D D D
Agricultural services, forestry, fishing, and mining S............... S S S S S S S S S S SConstruction 55............................................... D 4 D b D 27 D 60 D D DManufacturing 2.............................................. D – – – – – D – – – –Transportation, communications, and utilities 31................... 1 400 – – – – 15 33 – – – –Wholesale trade S............................................ S S S S S S S S S S SRetail trade 21................................................ 5 588 12 5 430 165 1 183 33 34 56 35 28 27Finance, insurance, and real estate 4........................... D 1 D a D 61 D – D D DServices 165................................................... 32 598 47 31 468 847 20 074 17 67 38 70 71 77
See footnotes at end of table.
MINORITY~OWNED BUSINESS ENTERPRISES BLACK 37U.S. Census Bureau, 1997 Economic Census Mar. 15, 2001
Table 4. Statistics by Industry Division for Selected Metropolitan Areas With 100 or MoreBlack~Owned Firms: 1997mCon.
[Detail may not add to total because of rounding. This table is based on the 1987 SIC system. For meaning of abbreviations and symbols, see introductory text. For explanation of terms, see AppendixA. For definition of MAs, see Appendix B]
Geographic area and industry division
All firms1 Firms with paid employeesRelative standard error of
estimate (percent)2
for columnmFirms(number)
Sales andreceipts($1,000)
Firms(number)
Sales andreceipts($1,000)
Employees(number)
Annualpayroll
($1,000)
A B C D E F A B C D E F
Houma, LA MSAmCon.
Industries not classified 12...................................... D – – – – 64 D – – – –
Huntington–Ashland, WV–KY–OH MSA 192.............. 35 072 11 D c D 42 1 20 D D D
Construction 4............................................... D 2 D a D 17 D – D D DManufacturing 18.............................................. D – – – – 87 D – – – –Transportation, communications, and utilities 9................... D 3 D a D 50 D 76 D D DWholesale trade 2............................................ D – – – – – D – – – –Retail trade 14................................................ D 2 D c D 61 D – D D DFinance, insurance, and real estate 1........................... D 1 D a D – D – D D DServices 143................................................... D 3 D a D 46 D – D D DIndustries not classified 1...................................... D – – – – – D – – – –
Agricultural services, forestry, fishing, and mining 56............... D 21 D a D 30 D 50 D D DConstruction 310............................................... 141 335 71 134 261 885 28 552 13 41 19 43 29 43Manufacturing 42.............................................. D 6 D a D 33 D 72 D D DTransportation, communications, and utilities 304................... 70 084 66 63 471 413 14 577 14 34 26 37 34 46Wholesale trade 64............................................ 138 143 14 136 944 161 7 472 17 4 50 4 10 7Retail trade 582................................................ 112 547 111 108 069 880 12 034 16 13 31 13 36 28Finance, insurance, and real estate 340........................... 13 050 36 D b D 15 19 31 D D DServices 2 937................................................... 118 595 313 86 246 2 654 36 314 6 11 23 15 32 17Industries not classified 780...................................... 19 526 95 D b D 18 39 71 D D D
Jackson, MI MSA 127.................................. 6 271 9 D b D 42 39 50 D D D
Transportation, communications, and utilities 3................... D 3 D b D 79 D 79 D D DRetail trade 4................................................ D 4 D a D 83 D 83 D D DFinance, insurance, and real estate 5........................... D – – – – 84 D – – – –Services 115................................................... 3 600 1 D a D 47 61 – D D D
Construction 79............................................... 1 517 20 704 21 129 25 35 75 67 71 57Manufacturing 1.............................................. D – – – – – D – – – –Transportation, communications, and utilities 16................... D 6 D a D 23 D 50 D D DRetail trade 121................................................ 143 371 8 138 425 524 10 579 47 50 40 52 42 54Finance, insurance, and real estate 83........................... D 9 D b D 71 D 70 D D DServices 341................................................... 15 879 78 D f D 21 16 37 D D DIndustries not classified 17...................................... D – – – – 43 D – – – –
Agricultural services, forestry, fishing, and mining 19............... D – – – – 56 D – – – –Construction 36............................................... D 6 D a D 63 D 50 D D DManufacturing 11.............................................. D – – – – 55 D – – – –Transportation, communications, and utilities 26................... D 1 D a D 67 D – D D DWholesale trade S............................................ S S S S S S S S S S SRetail trade 62................................................ D 4 D a D 27 D 83 D D D
See footnotes at end of table.
38 BLACK MINORITY~OWNED BUSINESS ENTERPRISESU.S. Census Bureau, 1997 Economic Census Mar. 15, 2001
Table 4. Statistics by Industry Division for Selected Metropolitan Areas With 100 or MoreBlack~Owned Firms: 1997mCon.
[Detail may not add to total because of rounding. This table is based on the 1987 SIC system. For meaning of abbreviations and symbols, see introductory text. For explanation of terms, see AppendixA. For definition of MAs, see Appendix B]
Geographic area and industry division
All firms1 Firms with paid employeesRelative standard error of
estimate (percent)2
for columnmFirms(number)
Sales andreceipts($1,000)
Firms(number)
Sales andreceipts($1,000)
Employees(number)
Annualpayroll
($1,000)
A B C D E F A B C D E F
Jacksonville, NC MSAmCon.
Finance, insurance, and real estate 7........................... D – – – – 56 D – – – –Services 285................................................... 12 608 57 10 278 301 4 781 31 37 31 42 44 58Industries not classified 11...................................... D – – – – 91 D – – – –
Construction 6............................................... D – – – – 77 D – – – –Manufacturing 1.............................................. D – – – – – D – – – –Wholesale trade 3............................................ D – – – – 79 D – – – –Retail trade 20................................................ D 14 D b D 59 D 89 D D DFinance, insurance, and real estate 9........................... D – – – – 89 D – – – –Services 138................................................... D 9 D a D 46 D 93 D D D
Construction 76............................................... D 8 D b D 13 D 48 D D DManufacturing 20.............................................. D 3 D b D 14 D 43 D D DTransportation, communications, and utilities 234................... 9 458 62 D b D 29 25 85 D D DWholesale trade 30............................................ D 14 D e D 47 D 60 D D DRetail trade 359................................................ 13 711 56 8 880 135 1 951 19 46 57 68 60 73Finance, insurance, and real estate 7........................... D – – – – 44 D – – – –Services 1 327................................................... 43 058 260 30 242 521 10 395 8 26 39 38 37 36Industries not classified 289...................................... D 76 D f D 27 D 70 D D D
Johnson City–Kingsport–Bristol, TN–VA MSA 175........ 17 981 4 D c D 32 2 – D D D
Agricultural services, forestry, fishing, and mining 9............... D – – – – 90 D – – – –Construction 19............................................... D 2 D c D 18 D – D D DManufacturing 1.............................................. D – – – – – D – – – –Transportation, communications, and utilities 11................... D 1 D b D 40 D – D D DRetail trade 28................................................ D – – – – 32 D – – – –Finance, insurance, and real estate 3........................... D – – – – 76 D – – – –Services 103................................................... D 1 D a D 52 D – D D D
Kalamazoo–Battle Creek, MI MSA 831................... 66 875 91 52 002 598 11 831 14 38 33 50 38 48
Agricultural services, forestry, fishing, and mining 19............... D – – – – 90 D – – – –Construction 41............................................... D – – – – 24 D – – – –Manufacturing 13.............................................. D 4 D b D 60 D 83 D D DTransportation, communications, and utilities 34................... 2 762 – – – – 38 62 – – – –Wholesale trade 23............................................ D 4 D b D 74 D 82 D D DRetail trade 44................................................ D 5 D c D 28 D 51 D D DFinance, insurance, and real estate 17........................... D 4 D a D 43 D 62 D D DServices 545................................................... 26 347 74 18 610 356 7 978 23 43 44 59 55 66Industries not classified S...................................... S S S S S S S S S S S
Agricultural services, forestry, fishing, and mining 18............... D – – – – 88 D – – – –Construction 17............................................... 168 – – – – 38 43 – – – –Transportation, communications, and utilities 127................... D 1 D b D 73 D – D D DRetail trade 196................................................ 12 985 15 D e D 48 71 70 D D DFinance, insurance, and real estate 8........................... 116 – – – – 37 13 – – – –Services 573................................................... 13 636 11 989 26 367 46 63 58 7 – 3Industries not classified 111...................................... D – – – – 59 D – – – –
Agricultural services, forestry, fishing, and mining 20............... D 11 D c D 54 D 82 D D DConstruction 78............................................... 45 241 25 D f D 30 61 58 D D DManufacturing 9.............................................. D – – – – 78 D – – – –Transportation, communications, and utilities 32................... D 12 D c D 33 D 57 D D DWholesale trade 25............................................ D 4 D a D 43 D 60 D D DRetail trade S................................................ S S S S S S S S S S SFinance, insurance, and real estate S........................... S S S S S S S S S S SServices 498................................................... 18 362 28 13 921 299 10 144 29 12 24 13 22 8Industries not classified 113...................................... 2 236 – – – – 48 80 – – – –
Transportation, communications, and utilities 55................... D 1 D b D 92 D – D D DWholesale trade 3............................................ D 3 D a D 79 D 79 D D DRetail trade 11................................................ D 1 D a D 49 D – D D DFinance, insurance, and real estate 7........................... D 3 D a D 81 D 74 D D DServices 81................................................... 12 166 10 11 616 82 2 251 42 59 45 62 51 61Industries not classified 66...................................... D – – – – 83 D – – – –
Agricultural services, forestry, fishing, and mining 53............... 1 847 8 D a D 29 43 36 D D DConstruction 320............................................... 16 670 107 12 585 358 3 491 17 28 45 37 42 32Manufacturing 10.............................................. D 1 D a D 71 D – D D DTransportation, communications, and utilities 110................... 4 682 60 D c D 40 70 77 D D DWholesale trade 15............................................ D 10 D b D 21 D 38 D D DRetail trade 166................................................ 62 426 71 60 519 409 5 155 19 62 40 64 32 43Finance, insurance, and real estate 72........................... 10 938 16 8 948 148 1 926 19 62 28 72 71 69
See footnotes at end of table.
MINORITY~OWNED BUSINESS ENTERPRISES BLACK 39U.S. Census Bureau, 1997 Economic Census Mar. 15, 2001
Table 4. Statistics by Industry Division for Selected Metropolitan Areas With 100 or MoreBlack~Owned Firms: 1997mCon.
[Detail may not add to total because of rounding. This table is based on the 1987 SIC system. For meaning of abbreviations and symbols, see introductory text. For explanation of terms, see AppendixA. For definition of MAs, see Appendix B]
Geographic area and industry division
All firms1 Firms with paid employeesRelative standard error of
Transportation, communications, and utilities 10................... 766 3 D a D 35 49 80 D D DWholesale trade 1............................................ D 1 D a D – D – D D DRetail trade 12................................................ D 1 D b D 58 D – D D DFinance, insurance, and real estate 43........................... D – – – – 75 D – – – –Services 43................................................... D – – – – 35 D – – – –
Lake Charles, LA MSA 909............................. 75 516 93 62 952 1 417 23 902 13 35 26 40 46 53
Agricultural services, forestry, fishing, and mining 28............... D 10 D b D 90 D 90 D D DConstruction 106............................................... 7 115 11 4 956 80 1 538 33 16 35 13 15 6Manufacturing 44.............................................. 1 019 – – – – 36 48 – – – –Transportation, communications, and utilities 29................... 2 056 9 1 055 36 205 18 32 50 63 35 32Wholesale trade 20............................................ D – – – – 43 D – – – –Retail trade 246................................................ 21 990 30 18 566 181 2 024 27 42 50 52 44 51Finance, insurance, and real estate 10........................... D 4 D a D 56 D 54 D D DServices 379................................................... 41 784 29 37 302 1 081 19 704 18 62 35 69 62 65Industries not classified 47...................................... D – – – – 64 D – – – –
Agricultural services, forestry, fishing, and mining 60............... D – – – – 51 D – – – –Construction 80............................................... D 20 D e D 32 D 65 D D DManufacturing 13.............................................. 563 7 D a D 37 56 55 D D DTransportation, communications, and utilities 3................... D 2 D a D – D – D D DRetail trade S................................................ S S S S S S S S S S SFinance, insurance, and real estate 1........................... D 1 D a D – D – D D DServices 360................................................... 9 771 38 5 823 155 2 080 29 27 61 47 61 50Industries not classified 309...................................... D – – – – 90 D – – – –
Construction 29............................................... 401 – – – – 44 46 – – – –Manufacturing 2.............................................. D 2 D b D – D – D D DTransportation, communications, and utilities 5................... D 1 D a D 46 D – D D DRetail trade 15................................................ D 1 D a D 37 D – D D DFinance, insurance, and real estate 24........................... D 4 D a D 45 D 84 D D DServices 69................................................... 11 242 13 D c D 20 62 56 D D D
Agricultural services, forestry, fishing, and mining 19............... D – – – – 57 D – – – –Construction 38............................................... D 7 D c D 27 D 55 D D DManufacturing 9.............................................. D 4 D c D 42 D 61 D D DTransportation, communications, and utilities 37................... 7 327 5 D b D 34 46 69 D D DWholesale trade 8............................................ D – – – – 51 D – – – –Retail trade 139................................................ 35 371 39 33 473 981 6 396 31 57 40 58 57 56Finance, insurance, and real estate 8........................... D 1 D a D 35 D – D D DServices 493................................................... 58 401 51 51 646 508 15 517 23 73 45 84 79 81Industries not classified S...................................... S S S S S S S S S S S
Agricultural services, forestry, fishing, and mining 25............... D – – – – 57 D – – – –Construction 124............................................... 57 612 34 D e D 28 23 57 D D DManufacturing 20.............................................. D 1 D a D 43 D – D D DTransportation, communications, and utilities 86................... D 15 D e D 14 D 68 D D DWholesale trade 44............................................ D 3 D b D 23 D 80 D D DRetail trade 295................................................ D 28 16 911 264 3 026 17 D 38 22 19 9Finance, insurance, and real estate 265........................... 9 100 15 D b D 10 10 41 D D DServices 1 383................................................... 85 243 178 65 980 1 030 25 809 10 11 31 15 12 14Industries not classified 294...................................... 5 597 – – – – 30 37 – – – –
Lawrence, KS MSA 102................................ 3 778 34 D b D 29 35 77 D D D
Construction 7............................................... D – – – – 60 D – – – –Manufacturing 1.............................................. D – – – – – D – – – –Transportation, communications, and utilities 1................... D – – – – – D – – – –Retail trade 32................................................ D 32 D b D 78 D 78 D D DFinance, insurance, and real estate 6........................... D 1 D a D 71 D – D D DServices 46................................................... D 1 D a D 22 D – D D DIndustries not classified 10...................................... D – – – – 53 D – – – –
Construction 55............................................... 5 521 46 D b D 35 58 46 D D DManufacturing 3.............................................. D – – – – 73 D – – – –Transportation, communications, and utilities 20................... 2 058 4 D a D 19 68 58 D D DWholesale trade 11............................................ D 5 D a D 39 D 87 D D DRetail trade 70................................................ 4 456 7 D a D 24 26 54 D D DFinance, insurance, and real estate 6........................... D – – – – 49 D – – – –Services 253................................................... 5 971 8 3 415 34 1 257 35 26 62 39 26 37Industries not classified 48...................................... D – – – – 63 D – – – –
Lawton, OK MSA 257.................................. 8 997 37 D c D 12 26 26 D D D
Construction 27............................................... D – – – – 23 D – – – –Transportation, communications, and utilities 24................... 951 4 D a D 40 27 56 D D DRetail trade 29................................................ D 5 D b D 24 D 47 D D DFinance, insurance, and real estate 20........................... D 4 D a D 37 D 54 D D DServices 139................................................... 6 352 24 D c D 11 32 33 D D DIndustries not classified 18...................................... D – – – – 37 D – – – –
See footnotes at end of table.
40 BLACK MINORITY~OWNED BUSINESS ENTERPRISESU.S. Census Bureau, 1997 Economic Census Mar. 15, 2001
Table 4. Statistics by Industry Division for Selected Metropolitan Areas With 100 or MoreBlack~Owned Firms: 1997mCon.
[Detail may not add to total because of rounding. This table is based on the 1987 SIC system. For meaning of abbreviations and symbols, see introductory text. For explanation of terms, see AppendixA. For definition of MAs, see Appendix B]
Geographic area and industry division
All firms1 Firms with paid employeesRelative standard error of
Agricultural services, forestry, fishing, and mining 1............... D 1 D a D – D – D D DConstruction 80............................................... D 3 D a D 13 D – D D DManufacturing 7.............................................. D 1 D a D 62 D – D D DTransportation, communications, and utilities 32................... D 3 D a D 51 D 76 D D DWholesale trade 12............................................ D 11 5 320 36 896 27 D 34 39 40 43Retail trade 64................................................ 36 377 18 35 892 137 2 603 34 71 45 72 36 57Finance, insurance, and real estate 29........................... D – – – – 51 D – – – –Services 507................................................... 12 199 33 7 733 144 2 371 18 25 17 37 32 43Industries not classified S...................................... S S S S S S S S S S S
Agricultural services, forestry, fishing, and mining 8............... D – – – – 89 D – – – –Construction 13............................................... D 4 D b D 37 D 60 D D DManufacturing S.............................................. S S S S S S S S S S STransportation, communications, and utilities 11................... D 11 D b D 54 D 54 D D DRetail trade 21................................................ D 4 D c D 57 D 35 D D DFinance, insurance, and real estate 4........................... D – – – – 82 D – – – –Services 61................................................... D 4 D a D 32 D 86 D D DIndustries not classified 27...................................... D – – – – 57 D – – – –
Lincoln, NE MSA 167................................... D 19 D c D 20 D 43 D D D
Agricultural services, forestry, fishing, and mining 1............... D – – – – – D – – – –Construction 5............................................... D – – – – 10 D – – – –Transportation, communications, and utilities 3................... D – – – – – D – – – –Wholesale trade 8............................................ D 4 D a D 52 D 84 D D DRetail trade 8................................................ D – – – – 78 D – – – –Finance, insurance, and real estate 18........................... 6 476 8 D b D 40 79 83 D D DServices 118................................................... D 6 D c D 28 D 59 D D DIndustries not classified 6...................................... D – – – – 48 D – – – –
Little Rock–North Little Rock, AR MSA 2 648.............. 221 349 336 164 914 1 413 24 357 5 7 12 8 13 8
Agricultural services, forestry, fishing, and mining 82............... D 16 D b D 13 D 61 D D DConstruction 223............................................... 28 722 59 23 782 245 3 502 10 51 19 61 54 47Manufacturing 14.............................................. D 3 D a D 19 D 79 D D DTransportation, communications, and utilities 150................... D 11 D b D 16 D 67 D D DWholesale trade 21............................................ D 4 D c D 22 D 61 D D DRetail trade 303................................................ 85 612 17 78 565 251 4 912 27 4 39 3 22 11Finance, insurance, and real estate 135........................... 5 933 26 3 733 45 718 16 21 28 31 20 21Services 1 193................................................... 57 442 164 31 070 619 11 024 9 17 12 10 14 14Industries not classified 527...................................... 10 527 35 D b D 19 29 98 D D D
Longview–Marshall, TX MSA 1 183....................... 357 049 77 D g D 24 68 53 D D D
Agricultural services, forestry, fishing, and mining 36............... D – – – – 57 D – – – –Construction 34............................................... D – – – – 39 D – – – –Manufacturing 44.............................................. D 4 D b D 45 D 83 D D DTransportation, communications, and utilities 13................... D – – – – 91 D – – – –Wholesale trade 16............................................ D – – – – 92 D – – – –Retail trade 105................................................ D 30 D f D 78 D 94 D D DFinance, insurance, and real estate 67........................... D 6 D b D 85 D 71 D D DServices 835................................................... D 5 872 56 540 32 D 45 31 37 28Industries not classified 33...................................... D 33 D f D 93 D 93 D D D
Los Angeles–Long Beach, CA PMSA 38 277................ 3 321 671 3 359 2 444 226 32 268 568 300 5 10 13 14 29 25
Agricultural services, forestry, fishing, and mining 15............... D 7 D a D 55 D 89 D D DConstruction 255............................................... 16 860 57 13 186 298 3 555 9 22 19 26 32 35Manufacturing 20.............................................. D 8 D b D 20 D 46 D D DTransportation, communications, and utilities 198................... 56 489 48 52 629 891 20 602 17 29 46 32 28 23Wholesale trade 31............................................ 11 193 10 9 774 101 2 577 16 48 41 55 55 65Retail trade 430................................................ 168 781 116 163 735 1 768 20 138 18 16 24 16 17 12Finance, insurance, and real estate 144........................... 9 908 25 D b D 17 48 48 D D DServices 1 413................................................... 70 159 134 54 777 2 259 27 053 10 15 20 19 34 24Industries not classified 399...................................... D – – – – 27 D – – – –
Lowell, MA–NH PMSA 211.............................. D 1 D a D 36 D – D D D
Manufacturing 1.............................................. D – – – – – D – – – –Wholesale trade 5............................................ D 1 D a D 66 D – D D DRetail trade 41................................................ D – – – – 91 D – – – –Finance, insurance, and real estate 7........................... D – – – – 88 D – – – –Services 97................................................... D – – – – 65 D – – – –Industries not classified 59...................................... D – – – – 92 D – – – –
Agricultural services, forestry, fishing, and mining 14............... D – – – – 55 D – – – –Construction 166............................................... D 44 D b D 26 D 54 D D DManufacturing 38.............................................. D 2 D c D 20 D – D D DTransportation, communications, and utilities 70................... D 10 D c D 73 D 51 D D DWholesale trade 6............................................ D 6 D a D 69 D 69 D D DRetail trade 68................................................ D 10 D f D 19 D 40 D D DFinance, insurance, and real estate 20........................... 228 4 D a D 21 30 84 D D D
See footnotes at end of table.
MINORITY~OWNED BUSINESS ENTERPRISES BLACK 41U.S. Census Bureau, 1997 Economic Census Mar. 15, 2001
Table 4. Statistics by Industry Division for Selected Metropolitan Areas With 100 or MoreBlack~Owned Firms: 1997mCon.
[Detail may not add to total because of rounding. This table is based on the 1987 SIC system. For meaning of abbreviations and symbols, see introductory text. For explanation of terms, see AppendixA. For definition of MAs, see Appendix B]
Geographic area and industry division
All firms1 Firms with paid employeesRelative standard error of
estimate (percent)2
for columnmFirms(number)
Sales andreceipts($1,000)
Firms(number)
Sales andreceipts($1,000)
Employees(number)
Annualpayroll
($1,000)
A B C D E F A B C D E F
Lynchburg, VA MSAmCon.
Services 368................................................... 8 350 13 D b D 25 38 38 D D DIndustries not classified 125...................................... 858 – – – – 39 45 – – – –
Agricultural services, forestry, fishing, and mining 46............... D 9 D a D 33 D 91 D D DConstruction 281............................................... 17 766 52 9 227 174 2 536 20 14 60 19 20 19Manufacturing 22.............................................. 683 9 D b D 46 60 90 D D DTransportation, communications, and utilities 76................... 8 889 8 D b D 20 62 58 D D DWholesale trade 12............................................ D 9 D a D 56 D 53 D D DRetail trade 393................................................ 21 941 49 15 248 507 3 993 29 36 45 55 50 58Finance, insurance, and real estate 164........................... 13 198 20 7 238 49 1 140 37 52 61 75 53 57Services 1 736................................................... 58 410 210 32 900 563 8 907 21 19 39 31 20 24Industries not classified 231...................................... 6 631 – – – – 43 48 – – – –
Construction 15............................................... D 4 D c D 27 D 84 D D DManufacturing 7.............................................. D 4 D b D 49 D 84 D D DTransportation, communications, and utilities 37................... D 3 D a D 58 D 81 D D DRetail trade 13................................................ D 2 D c D 51 D – D D DFinance, insurance, and real estate 18........................... D 10 D b D 53 D 80 D D DServices 155................................................... 7 621 30 6 007 112 3 191 18 11 34 16 10 12Industries not classified 43...................................... D – – – – 68 D – – – –
Construction 13............................................... D 6 D b D 34 D 49 D D DTransportation, communications, and utilities 1................... D 1 D a D – D – D D DWholesale trade 13............................................ D 13 D b D 91 D 91 D D DRetail trade 52................................................ D 37 D b D 54 D 73 D D DServices 43................................................... D 1 D a D 23 D – D D DIndustries not classified 29...................................... D – – – – 58 D – – – –
Agricultural services, forestry, fishing, and mining 68............... D – – – – 22 D – – – –Construction 83............................................... D 10 D b D 27 D 63 D D DManufacturing 21.............................................. D 10 D b D 31 D 65 D D DTransportation, communications, and utilities 25................... D 1 D a D 52 D – D D DRetail trade 194................................................ 3 818 19 1 828 7 146 44 55 66 58 63 68Finance, insurance, and real estate 55........................... D 1 D a D 54 D – D D DServices 365................................................... 13 288 32 11 189 284 6 654 44 24 75 29 42 23Industries not classified S...................................... S S S S S S S S S S S
Agricultural services, forestry, fishing, and mining 271............... D 29 D e D 17 D 48 D D DConstruction 914............................................... 96 756 190 73 493 932 14 077 7 18 26 22 23 21Manufacturing 157.............................................. D 28 24 532 159 3 775 19 D 36 5 22 7Transportation, communications, and utilities 876................... 57 094 90 D e D 13 24 62 D D DWholesale trade 119............................................ D 27 D b D 19 D 32 D D DRetail trade 1 200................................................ 123 997 179 D g D 14 12 18 D D DFinance, insurance, and real estate 479........................... D 40 21 964 237 5 476 20 D 15 20 15 10Services 5 675................................................... 284 507 641 199 609 3 984 88 649 5 14 14 19 15 24Industries not classified 1 240...................................... 41 041 110 D c D 8 27 66 D D D
Agricultural services, forestry, fishing, and mining 18............... D – – – – 56 D – – – –Construction 126............................................... D 12 D b D 20 D 44 D D DManufacturing 33.............................................. 32 156 10 D c D 18 6 51 D D DTransportation, communications, and utilities 374................... 23 046 35 9 399 131 4 100 27 18 32 22 35 25Wholesale trade 79............................................ D 13 D c D 23 D 79 D D DRetail trade 235................................................ 15 733 30 11 722 244 4 958 32 17 84 17 10 6Finance, insurance, and real estate 168........................... D 22 D b D 31 D 67 D D DServices 1 151................................................... 49 206 177 D f D 18 19 40 D D DIndustries not classified 450...................................... D 1 D a D 34 D – D D D
Agricultural services, forestry, fishing, and mining 6............... D 2 D a D 35 D – D D DConstruction 194............................................... 77 904 55 D e D 14 29 21 D D DManufacturing 55.............................................. D 8 D b D 24 D 93 D D DTransportation, communications, and utilities 311................... 31 984 77 22 449 426 11 429 17 16 29 25 12 46Wholesale trade 41............................................ 24 571 23 24 002 108 2 656 22 34 23 34 25 36Retail trade 531................................................ 96 818 80 80 775 1 515 13 231 10 14 29 18 32 17Finance, insurance, and real estate 220........................... 6 188 17 D b D 13 19 33 D D DServices 2 109................................................... 118 655 253 90 059 3 645 47 019 5 10 17 12 18 13Industries not classified 406...................................... D 61 D a D 26 D 88 D D D
Agricultural services, forestry, fishing, and mining 17............... D – – – – 56 D – – – –Construction 136............................................... D 22 D c D 10 D 43 D D DManufacturing 47.............................................. D 19 60 615 669 22 120 22 D 36 43 40 41
See footnotes at end of table.
42 BLACK MINORITY~OWNED BUSINESS ENTERPRISESU.S. Census Bureau, 1997 Economic Census Mar. 15, 2001
Table 4. Statistics by Industry Division for Selected Metropolitan Areas With 100 or MoreBlack~Owned Firms: 1997mCon.
[Detail may not add to total because of rounding. This table is based on the 1987 SIC system. For meaning of abbreviations and symbols, see introductory text. For explanation of terms, see AppendixA. For definition of MAs, see Appendix B]
Geographic area and industry division
All firms1 Firms with paid employeesRelative standard error of
estimate (percent)2
for columnmFirms(number)
Sales andreceipts($1,000)
Firms(number)
Sales andreceipts($1,000)
Employees(number)
Annualpayroll
($1,000)
A B C D E F A B C D E F
Minneapolis–St. Paul, MN–WI MSAmCon.
Transportation, communications, and utilities 484................... D 6 D b D 13 D 45 D D DWholesale trade 70............................................ 40 037 11 38 119 240 6 677 20 18 34 17 7 9Retail trade 354................................................ 208 664 101 D f D 13 25 17 D D DFinance, insurance, and real estate 222........................... 46 055 60 D e D 14 15 37 D D DServices 1 946................................................... 101 774 180 D g D 10 5 11 D D DIndustries not classified 466...................................... D 55 D a D 34 D 99 D D D
Agricultural services, forestry, fishing, and mining 9............... D – – – – 89 D – – – –Construction 98............................................... 5 594 14 D b D 17 43 52 D D DManufacturing 22.............................................. 10 926 7 10 835 285 3 287 21 44 70 44 68 49Transportation, communications, and utilities 60................... D 2 D a D 41 D 69 D D DWholesale trade 9............................................ D 1 D a D 79 D – D D DRetail trade 193................................................ D 9 D b D 29 D 52 D D DFinance, insurance, and real estate 97........................... D 1 D a D 55 D – D D DServices 948................................................... 67 267 122 53 506 395 13 969 11 41 47 50 52 40Industries not classified 125...................................... D – – – – 84 D – – – –
Agricultural services, forestry, fishing, and mining 26............... D 9 D a D 61 D 90 D D DConstruction 21............................................... D 20 D c D 37 D 39 D D DTransportation, communications, and utilities 17................... D – – – – 92 D – – – –Retail trade 1................................................ D – – – – – D – – – –Services S................................................... S S S S S S S S S S S
Agricultural services, forestry, fishing, and mining 47............... D 9 D a D 34 D 91 D D DConstruction 363............................................... 31 602 109 23 063 297 6 967 24 42 69 58 38 58Manufacturing 44.............................................. D 2 D a D 34 D – D D DTransportation, communications, and utilities 162................... 19 337 45 D e D 16 10 31 D D DWholesale trade 56............................................ 61 737 25 57 787 64 2 673 20 38 41 42 64 57Retail trade 550................................................ 88 346 138 83 248 734 9 930 27 52 55 55 34 40Finance, insurance, and real estate 310........................... 83 600 121 80 707 588 19 615 32 31 54 32 25 33Services 3 044................................................... 149 096 400 108 395 2 005 52 218 10 16 17 20 15 27Industries not classified 666...................................... D 77 D a D 27 D 99 D D D
Agricultural services, forestry, fishing, and mining 85............... D 6 D a D 35 D 89 D D DConstruction 476............................................... 80 058 114 71 880 736 26 509 14 22 32 23 32 27
See footnotes at end of table.
MINORITY~OWNED BUSINESS ENTERPRISES BLACK 43U.S. Census Bureau, 1997 Economic Census Mar. 15, 2001
Table 4. Statistics by Industry Division for Selected Metropolitan Areas With 100 or MoreBlack~Owned Firms: 1997mCon.
[Detail may not add to total because of rounding. This table is based on the 1987 SIC system. For meaning of abbreviations and symbols, see introductory text. For explanation of terms, see AppendixA. For definition of MAs, see Appendix B]
Geographic area and industry division
All firms1 Firms with paid employeesRelative standard error of
estimate (percent)2
for columnmFirms(number)
Sales andreceipts($1,000)
Firms(number)
Sales andreceipts($1,000)
Employees(number)
Annualpayroll
($1,000)
A B C D E F A B C D E F
Nassau–Suffolk, NY PMSAmCon.
Manufacturing 82.............................................. 16 809 7 15 787 91 3 726 14 3 57 3 7 6Transportation, communications, and utilities 777................... 135 094 102 D g D 23 73 69 D D DWholesale trade 40............................................ D – – – – 37 D – – – –Retail trade 1 047................................................ 76 380 145 54 849 204 2 414 22 22 56 21 61 29Finance, insurance, and real estate 645........................... 23 130 24 D b D 25 25 44 D D DServices 5 033................................................... 209 992 440 89 977 1 490 28 650 5 17 55 35 36 26Industries not classified 721...................................... D – – – – 24 D – – – –
New Bedford, MA PMSA 295............................ 75 960 80 60 063 375 9 047 31 23 46 21 29 37
Agricultural services, forestry, fishing, and mining 7............... D 5 D a D 60 D 85 D D DConstruction 12............................................... D 9 D b D 26 D 36 D D DTransportation, communications, and utilities 21................... D 5 D a D 34 D 86 D D DWholesale trade 1............................................ D 1 D a D – D – D D DRetail trade 51................................................ 10 065 16 6 557 192 1 019 19 25 59 45 52 59Finance, insurance, and real estate 4........................... D 1 D b D 58 D – D D DServices 143................................................... 24 354 19 D b D 36 59 86 D D DIndustries not classified 55...................................... D 24 D b D 64 D 93 D D D
Agricultural services, forestry, fishing, and mining 18............... D – – – – 56 D – – – –Construction 96............................................... 5 539 8 D b D 11 30 41 D D DManufacturing 13.............................................. D 4 D a D 34 D 62 D D DTransportation, communications, and utilities 143................... 8 138 35 5 556 80 1 251 39 34 40 49 50 62Wholesale trade 4............................................ D 4 D a D 53 D 53 D D DRetail trade 183................................................ 8 892 24 D b D 23 28 38 D D DFinance, insurance, and real estate 36........................... 1 941 6 D a D 27 43 72 D D DServices 674................................................... 16 175 42 7 321 71 1 532 14 28 37 56 31 43Industries not classified 93...................................... D – – – – 61 D – – – –
New London–Norwich, CT–RI MSA 247.................. D 31 D g D 22 D 52 D D D
Construction 18............................................... D – – – – 29 D – – – –Transportation, communications, and utilities 15................... D 14 D b D 66 D 71 D D DRetail trade 11................................................ D 1 D b D 52 D – D D DFinance, insurance, and real estate 8........................... D – – – – 77 D – – – –Services 195................................................... D 16 D g D 28 D 42 D D D
Agricultural services, forestry, fishing, and mining 59............... D 20 D c D 29 D 45 D D DConstruction 466............................................... D 73 D e D 10 D 32 D D DManufacturing 102.............................................. 51 939 16 D e D 11 11 36 D D DTransportation, communications, and utilities 1 728................... 101 081 138 55 333 1 155 19 270 14 18 24 20 33 28Wholesale trade 106............................................ 44 121 29 41 489 274 6 206 25 26 43 25 30 42Retail trade 1 122................................................ 143 730 220 122 899 1 521 19 606 15 26 27 27 39 32Finance, insurance, and real estate 607........................... 76 163 57 67 614 626 8 631 19 65 70 74 79 55Services 4 747................................................... 239 728 376 129 243 2 005 50 029 6 31 25 25 31 26Industries not classified 1 584...................................... 54 673 131 D e D 13 26 45 D D D
Agricultural services, forestry, fishing, and mining 10............... D – – – – 90 D – – – –Construction 4............................................... D – – – – 59 D – – – –Transportation, communications, and utilities 80................... D – – – – 78 D – – – –Wholesale trade 13............................................ D 1 D a D 84 D – D D DRetail trade 191................................................ 6 624 74 D b D 42 79 95 D D DFinance, insurance, and real estate 72........................... D – – – – 75 D – – – –Services 485................................................... D 2 D a D 47 D – D D DIndustries not classified 34...................................... D – – – – 93 D – – – –
Agricultural services, forestry, fishing, and mining 233............... D 20 D c D 21 D 60 D D DConstruction 922............................................... 198 055 324 186 914 1 686 36 634 8 28 18 30 14 23Manufacturing 97.............................................. D 20 D b D 18 D 30 D D DTransportation, communications, and utilities 828................... 29 726 128 11 825 210 3 047 22 13 55 20 25 23Wholesale trade 86............................................ 32 455 23 29 886 86 1 409 17 54 37 59 38 42Retail trade 1 434................................................ 114 737 176 101 581 3 158 22 775 12 44 32 50 62 55Finance, insurance, and real estate 411........................... 35 035 86 30 069 161 2 983 25 48 34 53 40 42Services 5 124................................................... 281 513 836 235 455 8 755 104 720 8 12 11 14 33 20
See footnotes at end of table.
44 BLACK MINORITY~OWNED BUSINESS ENTERPRISESU.S. Census Bureau, 1997 Economic Census Mar. 15, 2001
Table 4. Statistics by Industry Division for Selected Metropolitan Areas With 100 or MoreBlack~Owned Firms: 1997mCon.
[Detail may not add to total because of rounding. This table is based on the 1987 SIC system. For meaning of abbreviations and symbols, see introductory text. For explanation of terms, see AppendixA. For definition of MAs, see Appendix B]
Geographic area and industry division
All firms1 Firms with paid employeesRelative standard error of
Agricultural services, forestry, fishing, and mining 48............... 816 – – – – 46 47 – – – –Construction 463............................................... 44 948 133 36 534 380 8 133 20 20 31 28 25 23Manufacturing 57.............................................. 776 – – – – 35 24 – – – –Transportation, communications, and utilities 217................... 9 228 10 D b D 37 24 83 D D DWholesale trade 54............................................ 6 914 19 D b D 40 74 89 D D DRetail trade 757................................................ 130 995 132 124 796 3 231 25 518 42 64 45 67 81 76Finance, insurance, and real estate 319........................... 44 484 73 5 037 124 2 172 26 67 55 42 50 48Services 6 971................................................... 341 032 740 168 440 2 026 46 954 20 14 48 19 23 19Industries not classified 1 894...................................... 32 077 – – – – 25 30 – – – –
Ocala, FL MSA 632.................................... 12 718 19 D b D 27 35 42 D D D
Agricultural services, forestry, fishing, and mining 25............... D – – – – 62 D – – – –Construction 85............................................... D 6 D a D 20 D 35 D D DManufacturing 6.............................................. D 3 D a D 76 D 78 D D DTransportation, communications, and utilities 143................... D – – – – 55 D – – – –Retail trade 94................................................ D – – – – 54 D – – – –Services 242................................................... D 10 D b D 49 D 74 D D DIndustries not classified 37...................................... D – – – – 94 D – – – –
Odessa–Midland, TX MSA 363.......................... D 4 D a D 46 D 84 D D D
Agricultural services, forestry, fishing, and mining 62............... 910 – – – – 27 36 – – – –Construction 13............................................... D – – – – 91 D – – – –Manufacturing 1.............................................. D – – – – – D – – – –Retail trade S................................................ S S S S S S S S S S SServices 253................................................... D 4 D a D 60 D 82 D D DIndustries not classified 7...................................... D – – – – 87 D – – – –
Agricultural services, forestry, fishing, and mining 8............... D – – – – 89 D – – – –Construction 6............................................... D 4 D b D 42 D 81 D D DManufacturing 1.............................................. D – – – – – D – – – –Transportation, communications, and utilities 15................... D – – – – 57 D – – – –Wholesale trade 3............................................ D – – – – 76 D – – – –Retail trade 10................................................ D 1 D b D 48 D – D D DFinance, insurance, and real estate 3........................... D – – – – 75 D – – – –Services 98................................................... 2 749 7 D b D 19 11 66 D D DIndustries not classified 18...................................... D – – – – 92 D – – – –
Agricultural services, forestry, fishing, and mining 3............... D – – – – 76 D – – – –Construction 71............................................... 3 734 5 D b D 16 16 – D D DManufacturing 10.............................................. D 7 D b D 61 D 88 D D DTransportation, communications, and utilities 33................... D 3 D b D 20 D – D D DWholesale trade 14............................................ D 8 D b D 48 D 79 D D DRetail trade 168................................................ 20 520 54 D c D 11 11 29 D D DFinance, insurance, and real estate 42........................... 3 517 12 D b D 10 11 31 D D DServices 868................................................... D 118 44 723 959 16 249 10 D 34 9 18 11Industries not classified 136...................................... D – – – – 32 D – – – –
Agricultural services, forestry, fishing, and mining 3............... D 3 D a D 74 D 74 D D DConstruction 160............................................... 107 624 78 106 560 599 22 660 29 23 30 24 16 17Manufacturing 5.............................................. D 4 D e D 43 D 54 D D DTransportation, communications, and utilities S................... S S S S S S S S S S SWholesale trade 29............................................ D 10 D c D 60 D 82 D D DRetail trade 149................................................ 12 879 5 D b D 48 29 – D D DFinance, insurance, and real estate 133........................... 16 089 45 13 512 53 1 755 32 63 64 77 57 57Services 823................................................... 47 017 192 34 679 574 8 423 24 42 63 51 51 47Industries not classified S...................................... S S S S S S S S S S S
Agricultural services, forestry, fishing, and mining 170............... D 9 D b D 14 D 83 D D DConstruction 454............................................... 64 637 160 D f D 8 9 16 D D DManufacturing 54.............................................. D 10 D a D 19 D 61 D D DTransportation, communications, and utilities 614................... 94 710 36 D e D 17 6 58 D D DWholesale trade 9............................................ D – – – – 79 D – – – –Retail trade 510................................................ 55 859 40 22 974 163 1 697 29 50 47 55 43 42Finance, insurance, and real estate 88........................... D 2 D a D 34 D – D D DServices 2 527................................................... 139 352 286 107 530 1 503 41 661 10 28 39 38 22 38Industries not classified 432...................................... D 50 D c D 11 D 98 D D D
Owensboro, KY MSA 214............................... 22 339 13 D c D 35 77 64 D D D
Construction 3............................................... D – – – – 80 D – – – –Manufacturing 3.............................................. D 3 D b D 80 D 80 D D D
See footnotes at end of table.
MINORITY~OWNED BUSINESS ENTERPRISES BLACK 45U.S. Census Bureau, 1997 Economic Census Mar. 15, 2001
Table 4. Statistics by Industry Division for Selected Metropolitan Areas With 100 or MoreBlack~Owned Firms: 1997mCon.
[Detail may not add to total because of rounding. This table is based on the 1987 SIC system. For meaning of abbreviations and symbols, see introductory text. For explanation of terms, see AppendixA. For definition of MAs, see Appendix B]
Geographic area and industry division
All firms1 Firms with paid employeesRelative standard error of
estimate (percent)2
for columnmFirms(number)
Sales andreceipts($1,000)
Firms(number)
Sales andreceipts($1,000)
Employees(number)
Annualpayroll
($1,000)
A B C D E F A B C D E F
Owensboro, KY MSAmCon.
Transportation, communications, and utilities 9................... D 9 D b D 89 D 89 D D DWholesale trade S............................................ S S S S S S S S S S SRetail trade 12................................................ D – – – – 48 D – – – –Services 185................................................... D 1 D a D 41 D – D D D
Panama City, FL MSA 172.............................. 15 669 28 13 999 187 5 195 29 17 70 20 18 5
Construction 39............................................... 3 432 15 D b D 47 73 87 D D DManufacturing 3.............................................. D 1 D a D 38 D – D D DTransportation, communications, and utilities 13................... D 6 D a D 44 D 88 D D DWholesale trade 1............................................ D – – – – – D – – – –Retail trade 1................................................ D 1 D a D – D – D D DFinance, insurance, and real estate 22........................... D – – – – 93 D – – – –Services 87................................................... 10 536 5 9 912 134 4 590 37 2 – – – –Industries not classified 8...................................... D – – – – 88 D – – – –
Agricultural services, forestry, fishing, and mining 12............... D – – – – 62 D – – – –Construction 103............................................... 7 995 29 D c D 29 24 49 D D DManufacturing 25.............................................. 881 5 D a D 28 58 74 D D DTransportation, communications, and utilities 17................... D 5 D b D 28 D 86 D D DWholesale trade 4............................................ D 1 D a D 56 D – D D DRetail trade 29................................................ D 1 D e D 43 D – D D DFinance, insurance, and real estate S........................... S S S S S S S S S S SServices 536................................................... 13 278 65 6 421 349 3 637 20 18 87 24 65 17Industries not classified 41...................................... D – – – – 84 D – – – –
Agricultural services, forestry, fishing, and mining 10............... D 10 D a D 90 D 90 D D DConstruction 22............................................... D 4 D a D 40 D 84 D D DManufacturing 8.............................................. D – – – – 52 D – – – –Transportation, communications, and utilities 30................... 1 595 4 D a D 47 28 60 D D DRetail trade 117................................................ D 58 D c D 38 D 75 D D DFinance, insurance, and real estate 8........................... D 1 D a D 77 D – D D DServices 429................................................... 7 858 4 4 278 41 1 065 23 25 – – – –Industries not classified 1...................................... D – – – – – D – – – –
Agricultural services, forestry, fishing, and mining 11............... D – – – – 74 D – – – –Construction 125............................................... 15 558 37 D e D 14 19 28 D D DManufacturing 25.............................................. D 6 D a D 31 D 89 D D DTransportation, communications, and utilities 186................... D 26 D b D 19 D 39 D D DWholesale trade 47............................................ D 20 D c D 22 D 44 D D DRetail trade 233................................................ 47 782 45 D g D 18 62 45 D D DFinance, insurance, and real estate 210........................... 15 075 11 D b D 19 57 35 D D DServices 1 460................................................... 128 204 210 104 778 1 829 48 073 7 11 26 14 9 18Industries not classified 209...................................... D 28 D e D 19 D 97 D D D
Pine Bluff, AR MSA 580................................ 37 442 80 28 226 283 3 598 10 4 15 6 9 6
Agricultural services, forestry, fishing, and mining 26............... D 9 D a D 40 D 90 D D DConstruction 54............................................... 2 544 15 D b D 12 31 45 D D DManufacturing 5.............................................. D 3 D a D 46 D 77 D D DTransportation, communications, and utilities 75................... D – – – – 24 D – – – –Retail trade 110................................................ 23 746 23 D c D 16 3 17 D D DFinance, insurance, and real estate 14........................... D 4 D a D 26 D 61 D D DServices 217................................................... 6 723 26 3 751 80 1 336 17 13 17 16 24 11Industries not classified 79...................................... D – – – – 70 D – – – –
Agricultural services, forestry, fishing, and mining 35............... D 1 D b D 29 D – D D DConstruction 278............................................... 61 179 78 58 481 501 13 977 15 10 32 10 24 19Manufacturing 29.............................................. D 7 D b D 23 D 34 D D DTransportation, communications, and utilities 162................... 22 824 9 D c D 33 41 40 D D DWholesale trade 27............................................ 21 359 5 D b D 48 40 32 D D DRetail trade 613................................................ 116 962 163 110 906 983 17 203 14 38 31 40 19 28Finance, insurance, and real estate 170........................... 14 264 29 6 637 144 2 172 31 33 33 27 20 13Services 1 567................................................... 75 680 266 55 220 2 093 30 432 9 19 28 28 42 39Industries not classified 262...................................... D – – – – 48 D – – – –
Agricultural services, forestry, fishing, and mining 13............... D – – – – 51 D – – – –Construction 109............................................... 20 678 43 D c D 11 19 26 D D DManufacturing 13.............................................. 204 – – – – 29 67 – – – –Transportation, communications, and utilities 105................... 18 804 32 D c D 15 24 41 D D DWholesale trade 44............................................ 53 306 8 52 863 46 1 039 37 62 40 63 36 33Retail trade 199................................................ 188 940 48 184 729 397 15 317 15 51 29 52 34 49Finance, insurance, and real estate 78........................... D 7 D a D 20 D 78 D D DServices 946................................................... 65 805 105 52 681 1 854 31 255 10 27 25 34 52 45
See footnotes at end of table.
46 BLACK MINORITY~OWNED BUSINESS ENTERPRISESU.S. Census Bureau, 1997 Economic Census Mar. 15, 2001
Table 4. Statistics by Industry Division for Selected Metropolitan Areas With 100 or MoreBlack~Owned Firms: 1997mCon.
[Detail may not add to total because of rounding. This table is based on the 1987 SIC system. For meaning of abbreviations and symbols, see introductory text. For explanation of terms, see AppendixA. For definition of MAs, see Appendix B]
Geographic area and industry division
All firms1 Firms with paid employeesRelative standard error of
estimate (percent)2
for columnmFirms(number)
Sales andreceipts($1,000)
Firms(number)
Sales andreceipts($1,000)
Employees(number)
Annualpayroll
($1,000)
A B C D E F A B C D E F
Portland–Vancouver, OR–WA PMSAmCon.
Industries not classified 415...................................... D 79 D e D 24 D 51 D D D
Agricultural services, forestry, fishing, and mining 10............... 287 – – – – 44 50 – – – –Construction 101............................................... 41 793 34 40 631 193 8 255 17 38 43 40 22 25Manufacturing 21.............................................. D 14 D b D 47 D 73 D D DTransportation, communications, and utilities 51................... 3 071 6 D a D 19 33 72 D D DWholesale trade 8............................................ D – – – – 30 D – – – –Retail trade 206................................................ 32 714 64 28 567 526 4 655 14 17 27 20 36 30Finance, insurance, and real estate 36........................... D 1 D a D 20 D – D D DServices 681................................................... 38 680 92 29 385 1 942 15 897 7 20 23 27 6 31Industries not classified 197...................................... 2 716 – – – – 36 34 – – – –
Punta Gorda, FL MSA 109.............................. 3 556 1 D a D 47 28 – D D D
Construction 6............................................... D – – – – 49 D – – – –Transportation, communications, and utilities 8................... D – – – – 89 D – – – –Retail trade S................................................ S S S S S S S S S S SFinance, insurance, and real estate 1........................... D – – – – – D – – – –Services 68................................................... D 1 D a D 78 D – D D DIndustries not classified 8...................................... D – – – – 76 D – – – –
Agricultural services, forestry, fishing, and mining 9............... D – – – – 70 D – – – –Construction 7............................................... D – – – – 33 D – – – –Manufacturing 4.............................................. D – – – – 82 D – – – –Transportation, communications, and utilities 14................... D – – – – 55 D – – – –Wholesale trade S............................................ S S S S S S S S S S SRetail trade 47................................................ 41 973 23 41 718 112 1 865 31 2 53 2 11 9Services 121................................................... D 19 D c D 17 D 44 D D DIndustries not classified 66...................................... D 48 D c D 66 D 95 D D D
Agricultural services, forestry, fishing, and mining 8............... D – – – – 89 D – – – –Construction 1............................................... D 1 D a D – D – D D DTransportation, communications, and utilities 9................... D 1 D a D 33 D – D D DWholesale trade 1............................................ D 1 D a D – D – D D DRetail trade 32................................................ D – – – – 62 D – – – –Finance, insurance, and real estate 6........................... D 4 D a D 50 D 81 D D DServices 190................................................... 22 566 60 D f D 38 76 89 D D D
Construction 6............................................... D 3 D a D 50 D 79 D D DManufacturing 7.............................................. D – – – – 88 D – – – –Transportation, communications, and utilities 7................... D 1 D b D 62 D – D D DRetail trade 7................................................ D 2 D e D 62 D – D D DServices 104................................................... D 12 D b D 20 D 35 D D DIndustries not classified 44...................................... D 43 D a D 92 D 94 D D D
Agricultural services, forestry, fishing, and mining 12............... D 3 D a D 66 D 78 D D DConstruction 39............................................... 2 691 8 D a D 15 29 48 D D DManufacturing 5.............................................. D – – – – 84 D – – – –Transportation, communications, and utilities 16................... D – – – – 37 D – – – –Retail trade 25................................................ D 2 D a D 28 D – D D DFinance, insurance, and real estate 26........................... 964 4 D a D 16 41 86 D D DServices 540................................................... 49 242 69 D h D 23 81 49 D D D
See footnotes at end of table.
MINORITY~OWNED BUSINESS ENTERPRISES BLACK 47U.S. Census Bureau, 1997 Economic Census Mar. 15, 2001
Table 4. Statistics by Industry Division for Selected Metropolitan Areas With 100 or MoreBlack~Owned Firms: 1997mCon.
[Detail may not add to total because of rounding. This table is based on the 1987 SIC system. For meaning of abbreviations and symbols, see introductory text. For explanation of terms, see AppendixA. For definition of MAs, see Appendix B]
Geographic area and industry division
All firms1 Firms with paid employeesRelative standard error of
estimate (percent)2
for columnmFirms(number)
Sales andreceipts($1,000)
Firms(number)
Sales andreceipts($1,000)
Employees(number)
Annualpayroll
($1,000)
A B C D E F A B C D E F
Roanoke, VA MSAmCon.
Industries not classified 38...................................... D – – – – 75 D – – – –
Agricultural services, forestry, fishing, and mining 9............... D – – – – 90 D – – – –Construction 22............................................... D 1 D a D 42 D – D D DManufacturing 15.............................................. D 1 D a D 18 D 40 D D DTransportation, communications, and utilities S................... S S S S S S S S S S SRetail trade 88................................................ 6 872 17 D b D 43 76 86 D D DFinance, insurance, and real estate 11........................... D 1 D a D 53 D – D D DServices 293................................................... 11 643 16 8 566 73 1 868 19 12 49 5 11 6Industries not classified 63...................................... D – – – – 68 D – – – –
Agricultural services, forestry, fishing, and mining 23............... D – – – – 44 D – – – –Construction 109............................................... 7 262 41 6 206 86 1 916 19 39 41 47 25 36Manufacturing 27.............................................. D 1 D c D 33 D – D D DTransportation, communications, and utilities 84................... 1 385 1 D b D 35 27 – D D DWholesale trade 8............................................ D – – – – 35 D – – – –Retail trade 144................................................ 8 126 19 D b D 29 20 50 D D DFinance, insurance, and real estate 58........................... D 21 D a D 21 D 63 D D DServices 468................................................... 10 830 50 6 310 226 2 172 12 16 33 25 42 32Industries not classified 69...................................... D – – – – 19 D – – – –
Agricultural services, forestry, fishing, and mining 33............... D 9 D a D 42 D 90 D D DConstruction 113............................................... 10 533 28 9 795 189 2 606 32 47 83 51 73 67Manufacturing 12.............................................. D – – – – 91 D – – – –Transportation, communications, and utilities 7................... D 6 D a D 74 D 87 D D DWholesale trade 16............................................ D 16 D b D 92 D 92 D D DRetail trade S................................................ S S S S S S S S S S SFinance, insurance, and real estate 87........................... 14 902 19 D c D 40 57 74 D D DServices 1 161................................................... 56 532 102 44 058 1 944 17 902 39 52 59 66 90 78Industries not classified 394...................................... D – – – – 41 D – – – –
Construction 17............................................... 2 213 4 D a D 32 48 54 D D DManufacturing S.............................................. S S S S S S S S S S STransportation, communications, and utilities 21................... D 4 D b D 46 D 84 D D DWholesale trade 18............................................ D 18 D b D 69 D 69 D D DRetail trade 89................................................ D 42 D e D 27 D 65 D D DFinance, insurance, and real estate S........................... S S S S S S S S S S SServices 374................................................... 3 866 10 D b D 21 12 44 D D DIndustries not classified S...................................... S S S S S S S S S S S
Agricultural services, forestry, fishing, and mining 71............... D 18 D a D 20 D 54 D D DConstruction 507............................................... 90 394 136 D f D 5 19 16 D D DManufacturing 67.............................................. D 18 D c D 25 D 29 D D DTransportation, communications, and utilities 559................... 49 523 43 30 597 482 8 731 14 14 17 19 15 21Wholesale trade 112............................................ 151 926 22 149 766 239 9 235 16 3 57 3 32 11Retail trade 1 007................................................ 135 648 237 121 518 2 345 21 657 5 13 19 15 21 20Finance, insurance, and real estate 536........................... 33 162 85 D e D 15 13 24 D D DServices 5 601................................................... 296 222 630 229 905 4 677 85 535 5 12 15 16 14 14Industries not classified 1 215...................................... 27 351 56 D b D 12 41 99 D D D
Salem, OR PMSA 123.................................. 3 790 4 D b D 25 35 38 D D D
Construction 5............................................... D – – – – 74 D – – – –Transportation, communications, and utilities S................... S S S S S S S S S S SWholesale trade 1............................................ D – – – – – D – – – –Retail trade 5................................................ D – – – – 85 D – – – –Finance, insurance, and real estate 1........................... D – – – – – D – – – –Services 91................................................... 3 305 2 D b D 30 40 – D D DIndustries not classified 18...................................... D – – – – 87 D – – – –
Salinas, CA MSA 362................................... 52 159 31 D f D 41 35 60 D D D
Agricultural services, forestry, fishing, and mining 4............... D – – – – 82 D – – – –Construction 31............................................... D 30 D b D 56 D 58 D D DManufacturing 13.............................................. D – – – – 91 D – – – –Transportation, communications, and utilities 40................... D – – – – 91 D – – – –Retail trade 3................................................ D – – – – – D – – – –Services 272................................................... D 1 D f D 38 D – D D D
Salt Lake City–Ogden, UT MSA 378..................... 15 734 21 D e D 16 10 26 D D D
Construction 12............................................... D 1 D a D 28 D – D D DTransportation, communications, and utilities 19................... D – – – – 62 D – – – –Retail trade 41................................................ D 1 D a D 37 D – D D DFinance, insurance, and real estate 11........................... D – – – – 50 D – – – –Services 222................................................... 10 754 19 D c D 8 7 29 D D D
See footnotes at end of table.
48 BLACK MINORITY~OWNED BUSINESS ENTERPRISESU.S. Census Bureau, 1997 Economic Census Mar. 15, 2001
Table 4. Statistics by Industry Division for Selected Metropolitan Areas With 100 or MoreBlack~Owned Firms: 1997mCon.
[Detail may not add to total because of rounding. This table is based on the 1987 SIC system. For meaning of abbreviations and symbols, see introductory text. For explanation of terms, see AppendixA. For definition of MAs, see Appendix B]
Geographic area and industry division
All firms1 Firms with paid employeesRelative standard error of
estimate (percent)2
for columnmFirms(number)
Sales andreceipts($1,000)
Firms(number)
Sales andreceipts($1,000)
Employees(number)
Annualpayroll
($1,000)
A B C D E F A B C D E F
Salt Lake City–Ogden, UT MSAmCon.
Industries not classified 73...................................... D – – – – 68 D – – – –
San Antonio, TX MSA 2 100.............................. 146 689 244 D g D 16 23 23 D D D
Agricultural services, forestry, fishing, and mining 75............... D – – – – 33 D – – – –Construction 132............................................... 44 201 75 42 712 512 8 298 35 58 43 60 45 42Manufacturing 33.............................................. 5 247 22 5 168 28 862 25 67 44 68 45 60Transportation, communications, and utilities S................... S S S S S S S S S S SWholesale trade S............................................ S S S S S S S S S S SRetail trade 334................................................ 12 497 19 10 809 473 4 212 26 6 61 5 10 3Finance, insurance, and real estate 100........................... D 7 D a D 46 D 61 D D DServices 1 237................................................... 62 964 98 35 599 705 12 945 20 22 34 24 27 27Industries not classified 8...................................... D – – – – 76 D – – – –
Construction 114............................................... 36 841 19 31 790 127 4 438 25 8 75 6 11 6Manufacturing 39.............................................. D 9 D b D 33 D 91 D D DTransportation, communications, and utilities 91................... 8 200 14 D a D 18 64 80 D D DWholesale trade 34............................................ D 18 D c D 58 D 93 D D DRetail trade 100................................................ 2 580 2 D a D 41 12 – D D DFinance, insurance, and real estate 118........................... 44 769 25 42 810 118 11 738 24 23 29 25 37 47Services 3 066................................................... 145 171 290 92 345 1 596 26 909 30 30 42 33 73 34Industries not classified 860...................................... 489 945 223 482 357 1 819 63 895 38 58 39 59 60 56
San Jose, CA PMSA 1 665............................... 151 107 78 95 551 907 40 412 32 15 32 12 11 5
Agricultural services, forestry, fishing, and mining 4............... D – – – – 82 D – – – –Construction 64............................................... 14 773 20 13 519 141 2 800 30 59 87 67 70 58Manufacturing 81.............................................. 16 179 7 D b D 36 38 55 D D DTransportation, communications, and utilities S................... S S S S S S S S S S SWholesale trade 19............................................ D 19 D a D 88 D 88 D D DRetail trade 25................................................ D 1 D a D 29 D – D D DFinance, insurance, and real estate 82........................... 3 961 14 D a D 47 55 89 D D DServices 1 227................................................... 103 167 18 66 510 697 35 673 40 20 40 4 2 3Industries not classified S...................................... S S S S S S S S S S S
Santa Cruz–Watsonville, CA PMSA 140.................. 1 986 – – – – 37 46 – – – –
Agricultural services, forestry, fishing, and mining 12............... D – – – – 91 D – – – –Services 127................................................... D – – – – 43 D – – – –
Agricultural services, forestry, fishing, and mining 49............... 559 – – – – 35 46 – – – –Construction 47............................................... D 14 D c D 54 D 92 D D DManufacturing 4.............................................. D – – – – 28 D – – – –Transportation, communications, and utilities 7................... D – – – – 55 D – – – –Wholesale trade 8............................................ D – – – – 76 D – – – –Retail trade 102................................................ 4 891 6 D a D 23 55 90 D D DFinance, insurance, and real estate 70........................... D 8 D a D 52 D 68 D D DServices 407................................................... 10 908 3 D b D 37 55 – D D D
Agricultural services, forestry, fishing, and mining 36............... D 9 D b D 30 D 91 D D DConstruction 250............................................... 17 605 44 13 757 155 2 845 33 11 50 15 30 34Manufacturing 7.............................................. D – – – – 88 D – – – –Transportation, communications, and utilities 217................... 12 497 4 D b D 37 17 62 D D DWholesale trade 25............................................ D 22 D b D 72 D 84 D D DRetail trade 162................................................ 11 386 63 10 190 30 1 422 29 65 42 74 69 53Finance, insurance, and real estate S........................... S S S S S S S S S S SServices 1 192................................................... 41 506 169 29 916 517 9 942 12 25 27 37 31 34Industries not classified 173...................................... D – – – – 35 D – – – –
Agricultural services, forestry, fishing, and mining 45............... D 3 D a D 25 D 78 D D DConstruction 152............................................... 27 264 63 24 407 341 6 631 10 20 23 21 30 28Manufacturing 26.............................................. D 7 D b D 13 D 34 D D DTransportation, communications, and utilities 333................... 25 521 38 D f D 14 24 36 D D DWholesale trade 55............................................ D 13 D b D 18 D 45 D D DRetail trade 259................................................ 67 818 62 63 697 1 160 10 875 14 18 44 18 66 58Finance, insurance, and real estate 214........................... 9 708 44 D b D 16 19 12 D D DServices 1 917................................................... 131 797 273 96 679 1 623 35 307 6 9 17 12 8 10Industries not classified 426...................................... 41 211 56 D g D 18 78 66 D D D
Construction 4............................................... D – – – – 82 D – – – –Manufacturing 1.............................................. D – – – – – D – – – –Transportation, communications, and utilities 3................... D – – – – 74 D – – – –Services 94................................................... D 67 5 218 58 623 42 D 63 67 94 62Industries not classified 42...................................... D – – – – 58 D – – – –
See footnotes at end of table.
MINORITY~OWNED BUSINESS ENTERPRISES BLACK 49U.S. Census Bureau, 1997 Economic Census Mar. 15, 2001
Table 4. Statistics by Industry Division for Selected Metropolitan Areas With 100 or MoreBlack~Owned Firms: 1997mCon.
[Detail may not add to total because of rounding. This table is based on the 1987 SIC system. For meaning of abbreviations and symbols, see introductory text. For explanation of terms, see AppendixA. For definition of MAs, see Appendix B]
Geographic area and industry division
All firms1 Firms with paid employeesRelative standard error of
Agricultural services, forestry, fishing, and mining 121............... D 9 D b D 16 D 94 D D DConstruction 226............................................... 50 601 85 47 721 533 8 381 23 35 51 37 55 43Manufacturing 46.............................................. D – – – – 43 D – – – –Transportation, communications, and utilities 267................... 22 277 20 5 915 182 2 617 33 32 53 66 55 70Wholesale trade 8............................................ D 3 D a D 51 D 77 D D DRetail trade 265................................................ 8 674 34 4 743 64 520 22 18 27 37 36 37Finance, insurance, and real estate 190........................... 4 663 8 D b D 36 31 29 D D DServices 1 443................................................... 26 306 86 12 705 391 3 656 20 17 43 26 31 26Industries not classified 218...................................... D – – – – 20 D – – – –
South Bend, IN MSA 832............................... 76 597 53 62 951 322 8 897 23 8 27 4 11 7
Construction 37............................................... 8 121 13 8 015 49 1 145 23 8 49 8 53 18Manufacturing 5.............................................. D – – – – 65 D – – – –Transportation, communications, and utilities 67................... D 1 D c D 76 D – D D DRetail trade 119................................................ 34 166 22 D b D 43 5 60 D D DFinance, insurance, and real estate 39........................... D 1 D a D 85 D – D D DServices 377................................................... 6 144 17 3 186 60 1 235 27 33 34 58 40 50Industries not classified 188...................................... D – – – – 38 D – – – –
Construction 8............................................... D – – – – 78 D – – – –Manufacturing 3.............................................. D 2 D b D – D – D D DTransportation, communications, and utilities 1................... D – – – – – D – – – –Retail trade 30................................................ D 2 D b D 46 D – D D DFinance, insurance, and real estate 12........................... D 4 D a D 55 D 82 D D DServices 43................................................... 12 635 13 12 508 94 7 222 32 12 51 12 37 7Industries not classified 79...................................... D 26 D e D 39 D 95 D D D
Construction 7............................................... D – – – – 51 D – – – –Manufacturing 4.............................................. D – – – – 81 D – – – –Transportation, communications, and utilities 8................... D 1 D b D 63 D – D D DWholesale trade 6............................................ D – – – – 86 D – – – –Retail trade S................................................ S S S S S S S S S S SFinance, insurance, and real estate S........................... S S S S S S S S S S SServices 141................................................... 7 027 24 D b D 28 19 37 D D D
Agricultural services, forestry, fishing, and mining 18............... D 9 D a D 56 D 90 D D DConstruction 71............................................... D 5 D b D 22 D 67 D D DManufacturing 8.............................................. D 1 D a D 31 D – D D DTransportation, communications, and utilities 31................... D – – – – 23 D – – – –Wholesale trade 16............................................ D 5 D e D 39 D 69 D D DRetail trade 102................................................ 12 158 21 10 054 283 2 303 25 30 44 33 36 29Finance, insurance, and real estate 45........................... D 8 D b D 36 D 46 D D DServices 824................................................... 12 851 24 2 267 36 489 20 27 40 31 40 32Industries not classified 153...................................... D – – – – 30 D – – – –
Agricultural services, forestry, fishing, and mining 5............... D – – – – 84 D – – – –Construction 99............................................... D 5 D a D 23 D 71 D D DManufacturing 12.............................................. D 1 D a D 53 D – D D DTransportation, communications, and utilities 196................... 17 133 15 D c D 32 40 49 D D DWholesale trade 12............................................ D 3 D a D 26 D 75 D D DRetail trade 134................................................ 40 058 79 38 259 167 3 503 46 11 52 11 51 19Finance, insurance, and real estate 47........................... D 1 D a D 39 D – D D DServices 650................................................... 22 769 91 13 980 381 4 421 27 15 19 20 37 20Industries not classified 116...................................... 3 499 – – – – 46 41 – – – –
Stockton–Lodi, CA MSA 759............................ 52 611 30 D c D 33 53 49 D D D
Agricultural services, forestry, fishing, and mining 9............... D – – – – 89 D – – – –Construction 55............................................... D 18 D b D 42 D 76 D D DManufacturing 6.............................................. D – – – – 86 D – – – –Transportation, communications, and utilities 15................... D – – – – 74 D – – – –Retail trade 198................................................ D – – – – 95 D – – – –Finance, insurance, and real estate 8........................... D – – – – 89 D – – – –Services S................................................... S S S S S S S S S S SIndustries not classified 97...................................... D – – – – 69 D – – – –
Agricultural services, forestry, fishing, and mining 3............... D – – – – 77 D – – – –Construction 86............................................... D 39 D c D 30 D 55 D D DManufacturing 22.............................................. D 1 D b D 69 D – D D DTransportation, communications, and utilities 47................... D 20 D b D 38 D 63 D D DWholesale trade 8............................................ D 2 D b D 35 D 73 D D DRetail trade 138................................................ D 2 D a D 39 D – D D DFinance, insurance, and real estate 14........................... D 3 D a D 29 D 77 D D DServices 776................................................... 12 586 23 8 130 202 4 571 19 18 22 27 17 35Industries not classified 42...................................... 787 – – – – 21 39 – – – –
Agricultural services, forestry, fishing, and mining 11............... D – – – – 82 D – – – –Construction 42............................................... 5 689 17 5 195 67 1 503 19 22 40 25 36 28Manufacturing 8.............................................. 2 974 2 D b D 38 31 – D D DTransportation, communications, and utilities 22................... D – – – – 52 D – – – –Wholesale trade 1............................................ D 1 D a D – D – D D DRetail trade 20................................................ D 5 D b D 62 D 65 D D DFinance, insurance, and real estate 11........................... D – – – – 91 D – – – –Services 338................................................... 21 433 12 10 078 219 3 766 43 37 38 2 2 1
See footnotes at end of table.
50 BLACK MINORITY~OWNED BUSINESS ENTERPRISESU.S. Census Bureau, 1997 Economic Census Mar. 15, 2001
Table 4. Statistics by Industry Division for Selected Metropolitan Areas With 100 or MoreBlack~Owned Firms: 1997mCon.
[Detail may not add to total because of rounding. This table is based on the 1987 SIC system. For meaning of abbreviations and symbols, see introductory text. For explanation of terms, see AppendixA. For definition of MAs, see Appendix B]
Geographic area and industry division
All firms1 Firms with paid employeesRelative standard error of
estimate (percent)2
for columnmFirms(number)
Sales andreceipts($1,000)
Firms(number)
Sales andreceipts($1,000)
Employees(number)
Annualpayroll
($1,000)
A B C D E F A B C D E F
Syracuse, NY MSAmCon.
Industries not classified 113...................................... D – – – – 94 D – – – –
Agricultural services, forestry, fishing, and mining 17............... D 9 D b D 56 D 90 D D DConstruction 57............................................... 7 679 16 6 459 45 1 460 17 44 36 45 53 51Manufacturing 21.............................................. 1 982 9 D b D 38 43 49 D D DTransportation, communications, and utilities S................... S S S S S S S S S S SWholesale trade 26............................................ D 1 D a D 28 D – D D DRetail trade 114................................................ 6 844 11 6 132 74 612 33 64 35 73 55 69Finance, insurance, and real estate 62........................... 4 158 4 D a D 27 44 84 D D DServices 702................................................... 25 605 34 17 944 566 8 895 18 7 21 6 4 2Industries not classified 101...................................... D 47 D e D 36 D 62 D D D
Agricultural services, forestry, fishing, and mining 59............... D – – – – 58 D – – – –Construction 204............................................... 15 414 82 12 649 486 5 564 27 29 38 37 37 49Manufacturing 15.............................................. D 1 D b D 48 D – D D DTransportation, communications, and utilities 140................... D 2 D a D 53 D – D D DWholesale trade 13............................................ D 1 D a D 84 D – D D DRetail trade 64................................................ D 16 D a D 27 D 61 D D DFinance, insurance, and real estate 31........................... 1 226 10 D a D 33 35 58 D D DServices 715................................................... 12 179 62 5 780 73 1 971 19 20 83 37 – 18Industries not classified S...................................... S S S S S S S S S S S
Agricultural services, forestry, fishing, and mining 9............... D – – – – 90 D – – – –Construction 12............................................... D – – – – 42 D – – – –Manufacturing 2.............................................. D 1 D a D – D – D D DTransportation, communications, and utilities 1................... D 1 D a D – D – D D DWholesale trade 3............................................ D – – – – 77 D – – – –Retail trade 10................................................ D 1 D a D 81 D – D D DFinance, insurance, and real estate 6........................... D 3 D a D 39 D 75 D D DServices 49................................................... 364 – – – – 25 41 – – – –Industries not classified 13...................................... D – – – – 55 D – – – –
Agricultural services, forestry, fishing, and mining 9............... D – – – – 90 D – – – –Construction 30............................................... D – – – – 46 D – – – –Manufacturing 2.............................................. D – – – – – D – – – –Transportation, communications, and utilities 14................... D 6 D b D 35 D 89 D D DRetail trade 26................................................ D 5 D a D 24 D 87 D D DFinance, insurance, and real estate 6........................... D 1 D a D 69 D – D D DServices S................................................... S S S S S S S S S S SIndustries not classified 97...................................... D – – – – 85 D – – – –
Agricultural services, forestry, fishing, and mining 18............... D – – – – 53 D – – – –Construction 134............................................... 74 283 47 D c D 15 65 34 D D DManufacturing 6.............................................. D 1 D c D 55 D – D D DTransportation, communications, and utilities 127................... 7 238 13 D b D 47 44 87 D D DWholesale trade 18............................................ D – – – – 66 D – – – –Retail trade 146................................................ D 34 D c D 37 D 51 D D DFinance, insurance, and real estate 44........................... D 1 D a D 39 D – D D DServices 989................................................... 33 870 83 D e D 14 31 44 D D DIndustries not classified 69...................................... D – – – – 68 D – – – –
Construction 23............................................... D 13 D b D 37 D 62 D D DManufacturing 8.............................................. D 7 D a D 77 D 88 D D DTransportation, communications, and utilities 22................... D 2 D a D 49 D – D D DWholesale trade 2............................................ D – – – – – D – – – –Retail trade 23................................................ D 9 D b D 31 D 45 D D DFinance, insurance, and real estate 27........................... D – – – – 62 D – – – –Services 323................................................... D 34 D c D 30 D 30 D D DIndustries not classified 78...................................... D 59 D f D 75 D 96 D D D
Agricultural services, forestry, fishing, and mining 18............... D – – – – 56 D – – – –Construction 51............................................... 2 493 6 D a D 17 11 44 D D DManufacturing 12.............................................. D – – – – 54 D – – – –Transportation, communications, and utilities 62................... D – – – – 43 D – – – –Wholesale trade 9............................................ D 9 D a D 89 D 89 D D DRetail trade 121................................................ 5 829 23 4 840 126 804 47 36 45 44 75 49Finance, insurance, and real estate 40........................... D 11 D a D 64 D 73 D D DServices 684................................................... 38 360 150 28 015 259 10 440 12 19 53 23 48 28Industries not classified 91...................................... D – – – – 55 D – – – –
See footnotes at end of table.
MINORITY~OWNED BUSINESS ENTERPRISES BLACK 51U.S. Census Bureau, 1997 Economic Census Mar. 15, 2001
Table 4. Statistics by Industry Division for Selected Metropolitan Areas With 100 or MoreBlack~Owned Firms: 1997mCon.
[Detail may not add to total because of rounding. This table is based on the 1987 SIC system. For meaning of abbreviations and symbols, see introductory text. For explanation of terms, see AppendixA. For definition of MAs, see Appendix B]
Geographic area and industry division
All firms1 Firms with paid employeesRelative standard error of
Construction 50............................................... D 23 D e D 34 D 72 D D DManufacturing 10.............................................. D 4 D a D 37 D 81 D D DTransportation, communications, and utilities 12................... D 8 D b D 35 D 54 D D DWholesale trade 6............................................ D 2 D a D 30 D 65 D D DRetail trade 59................................................ D 5 D a D 31 D 69 D D DFinance, insurance, and real estate 47........................... D 5 D a D 32 D 66 D D DServices 278................................................... 4 603 12 D c D 25 21 47 D D DIndustries not classified 91...................................... D – – – – 30 D – – – –
Agricultural services, forestry, fishing, and mining 64............... D 4 D a D 35 D 54 D D DConstruction 118............................................... 3 475 12 D c D 24 39 36 D D DManufacturing 14.............................................. D 1 D a D 34 D – D D DTransportation, communications, and utilities 77................... 12 684 16 D c D 19 55 64 D D DWholesale trade 7............................................ 285 – – – – 21 33 – – – –Retail trade 216................................................ 24 457 36 22 099 675 5 001 27 51 41 55 45 46Finance, insurance, and real estate 76........................... 1 581 1 D a D 34 36 – D D DServices 1 111................................................... 33 221 99 19 544 303 5 424 15 10 21 14 19 14Industries not classified 218...................................... D 9 D a D 30 D 93 D D D
Construction 101............................................... 6 250 37 4 527 120 667 22 47 52 66 48 56Transportation, communications, and utilities 14................... 625 – – – – 32 32 – – – –Wholesale trade 1............................................ D – – – – – D – – – –Retail trade 162................................................ 5 007 12 3 859 233 783 37 46 50 61 74 57Finance, insurance, and real estate S........................... S S S S S S S S S S SServices 489................................................... 12 541 24 D b D 24 32 28 D D DIndustries not classified 74...................................... D – – – – 68 D – – – –
Agricultural services, forestry, fishing, and mining 9............... D – – – – 90 D – – – –Construction 69............................................... D 18 819 18 222 45 D 82 57 82 85Manufacturing 10.............................................. 580 – – – – 30 10 – – – –Transportation, communications, and utilities 20................... D – – – – 63 D – – – –Retail trade 17................................................ D 5 D a D 33 D 86 D D DFinance, insurance, and real estate 2........................... D 2 D a D – D – D D DServices 173................................................... 4 533 13 D c D 46 56 86 D D DIndustries not classified 7...................................... D – – – – 87 D – – – –
Utica–Rome, NY MSA 208.............................. 2 779 6 D a D 36 37 74 D D D
Construction 5............................................... D 5 D a D 85 D 85 D D DTransportation, communications, and utilities 11................... D – – – – 82 D – – – –Retail trade 14................................................ D 1 D a D 54 D – D D DServices 178................................................... D – – – – 38 D – – – –
Construction 58............................................... D 1 D a D 32 D – D D DManufacturing 3.............................................. D 3 D a D 77 D 77 D D DTransportation, communications, and utilities 23................... D 1 D a D 77 D – D D DWholesale trade 3............................................ D – – – – 74 D – – – –Retail trade 73................................................ 19 262 2 D b D 34 2 – D D DFinance, insurance, and real estate 80........................... 3 959 38 3 346 15 1 694 42 54 76 66 77 78Services 740................................................... 16 558 87 3 217 98 891 45 38 94 69 83 73Industries not classified S...................................... S S S S S S S S S S S
Agricultural services, forestry, fishing, and mining 12............... D – – – – 91 D – – – –Construction S............................................... S S S S S S S S S S SManufacturing 17.............................................. D 7 D b D 56 D 74 D D DTransportation, communications, and utilities 10................... D – – – – 81 D – – – –Retail trade 3................................................ 3 770 2 D a D – – – D D DFinance, insurance, and real estate 2........................... D 2 D a D – D – D D DServices 1 264................................................... 61 477 95 13 610 275 7 367 39 59 92 49 41 48
Agricultural services, forestry, fishing, and mining 9............... D – – – – 89 D – – – –Construction 5............................................... D – – – – 63 D – – – –Manufacturing 4.............................................. D 3 D a D 61 D 80 D D DTransportation, communications, and utilities 3................... D – – – – 80 D – – – –Retail trade S................................................ S S S S S S S S S S SFinance, insurance, and real estate 9........................... D – – – – 61 D – – – –Services S................................................... S S S S S S S S S S SIndustries not classified 33...................................... D – – – – 80 D – – – –
Construction 8............................................... D 1 D a D 77 D – D D DManufacturing 17.............................................. D 17 D c D 92 D 92 D D DTransportation, communications, and utilities 68................... D – – – – 90 D – – – –Retail trade 29................................................ D – – – – 92 D – – – –Finance, insurance, and real estate 4........................... D 1 D a D 56 D – D D DServices 357................................................... 10 285 64 D c D 38 49 87 D D D
52 BLACK MINORITY~OWNED BUSINESS ENTERPRISESU.S. Census Bureau, 1997 Economic Census Mar. 15, 2001
Table 4. Statistics by Industry Division for Selected Metropolitan Areas With 100 or MoreBlack~Owned Firms: 1997mCon.
[Detail may not add to total because of rounding. This table is based on the 1987 SIC system. For meaning of abbreviations and symbols, see introductory text. For explanation of terms, see AppendixA. For definition of MAs, see Appendix B]
Geographic area and industry division
All firms1 Firms with paid employeesRelative standard error of
Waterbury, CT PMSA 239............................... 5 506 19 D b D 26 17 42 D D D
Construction 16............................................... D – – – – 26 D – – – –Manufacturing 2.............................................. D – – – – – D – – – –Transportation, communications, and utilities 9................... D – – – – 89 D – – – –Wholesale trade 3............................................ D – – – – 76 D – – – –Retail trade 52................................................ D 9 D b D 23 D 81 D D DFinance, insurance, and real estate 21........................... D 9 D a D 49 D 54 D D DServices 125................................................... D 2 D a D 52 D – D D DIndustries not classified 11...................................... D – – – – 91 D – – – –
Waterloo–Cedar Falls, IA MSA 184...................... 12 548 15 9 845 181 3 785 17 11 34 9 21 11
Construction 6............................................... D 2 D a D 15 D – D D DManufacturing 8.............................................. D – – – – 89 D – – – –Transportation, communications, and utilities 11................... D 3 D b D 40 D 51 D D DWholesale trade 1............................................ D – – – – – D – – – –Retail trade 4................................................ D – – – – 62 D – – – –Finance, insurance, and real estate 6........................... D – – – – 50 D – – – –Services 145................................................... 8 500 10 D c D 21 9 53 D D DIndustries not classified 3...................................... D – – – – 51 D – – – –
Construction 1............................................... D – – – – – D – – – –Transportation, communications, and utilities 3................... D – – – – 41 D – – – –Retail trade 6................................................ D – – – – 52 D – – – –Services S................................................... S S S S S S S S S S SIndustries not classified 3...................................... D – – – – 50 D – – – –
Wichita, KS MSA 978.................................. 92 236 155 D g D 11 13 15 D D D
Agricultural services, forestry, fishing, and mining 44............... D – – – – 31 D – – – –Construction 57............................................... 17 051 22 D c D 14 33 24 D D DManufacturing 4.............................................. D – – – – 18 D – – – –Transportation, communications, and utilities 49................... 5 210 18 D b D 26 25 63 D D DWholesale trade 17............................................ D 10 D a D 62 D 85 D D DRetail trade 136................................................ 11 538 28 D c D 20 56 20 D D DFinance, insurance, and real estate 67........................... D 11 D a D 14 D 44 D D DServices 482................................................... 45 533 53 40 339 1 391 18 139 19 7 34 9 20 10Industries not classified 123...................................... D 12 D b D 15 D 96 D D D
Wichita Falls, TX MSA 194.............................. 7 831 23 D b D 35 58 63 D D D
Agricultural services, forestry, fishing, and mining 9............... D – – – – 89 D – – – –Construction 15............................................... D 14 D b D 85 D 91 D D DManufacturing 1.............................................. D – – – – – D – – – –Retail trade 8................................................ D 8 D a D 89 D 89 D D DServices 160................................................... D – – – – 42 D – – – –Industries not classified 1...................................... D – – – – – D – – – –
Construction 1............................................... D – – – – – D – – – –Retail trade 16................................................ D – – – – 92 D – – – –Finance, insurance, and real estate 4........................... D – – – – 83 D – – – –Services 130................................................... D – – – – 53 D – – – –
Agricultural services, forestry, fishing, and mining 10............... D 7 D b D 76 D 88 D D DConstruction 92............................................... 28 286 19 D e D 10 41 28 D D DManufacturing 6.............................................. D 1 D a D – D – D D DTransportation, communications, and utilities 119................... 10 508 33 7 818 195 1 477 26 40 48 45 66 54Wholesale trade 37............................................ 14 790 9 10 850 34 744 22 2 61 3 34 5Retail trade 253................................................ D 38 12 859 290 2 597 17 D 34 35 36 36Finance, insurance, and real estate 86........................... 10 705 16 D c D 15 46 26 D D DServices 902................................................... 61 074 110 50 536 1 819 21 355 11 14 16 18 34 24Industries not classified 160...................................... D 3 D a D 14 D 82 D D D
Agricultural services, forestry, fishing, and mining 9............... D – – – – 90 D – – – –Construction 117............................................... 7 698 73 6 323 172 1 688 29 33 53 39 53 39Manufacturing 5.............................................. D 1 D a D 66 D – D D DTransportation, communications, and utilities 127................... 10 334 4 D a D 46 56 56 D D DWholesale trade 4............................................ D – – – – 82 D – – – –Retail trade 111................................................ 5 335 16 2 297 22 404 40 39 59 46 44 20Finance, insurance, and real estate S........................... S S S S S S S S S S SServices 352................................................... 9 846 34 5 669 156 1 292 12 32 48 47 60 46
See footnotes at end of table.
MINORITY~OWNED BUSINESS ENTERPRISES BLACK 53U.S. Census Bureau, 1997 Economic Census Mar. 15, 2001
Table 4. Statistics by Industry Division for Selected Metropolitan Areas With 100 or MoreBlack~Owned Firms: 1997mCon.
[Detail may not add to total because of rounding. This table is based on the 1987 SIC system. For meaning of abbreviations and symbols, see introductory text. For explanation of terms, see AppendixA. For definition of MAs, see Appendix B]
Geographic area and industry division
All firms1 Firms with paid employeesRelative standard error of
estimate (percent)2
for columnmFirms(number)
Sales andreceipts($1,000)
Firms(number)
Sales andreceipts($1,000)
Employees(number)
Annualpayroll
($1,000)
A B C D E F A B C D E F
Wilmington, NC MSAmCon.
Industries not classified 52...................................... D – – – – 26 D – – – –
Worcester, MA–CT PMSA 318........................... 86 746 49 D c D 17 62 41 D D D
Agricultural services, forestry, fishing, and mining 18............... D 9 D a D 56 D 90 D D DConstruction 35............................................... D 4 D a D 20 D 84 D D DManufacturing 4.............................................. D 1 D a D 53 D – D D DTransportation, communications, and utilities 28................... D – – – – 24 D – – – –Wholesale trade 9............................................ D – – – – 37 D – – – –Retail trade 43................................................ D 16 D c D 27 D 75 D D DFinance, insurance, and real estate 3........................... D 3 D a D 79 D 79 D D DServices 169................................................... 7 556 16 D a D 23 43 97 D D DIndustries not classified 10...................................... D – – – – 41 D – – – –
York, PA MSA 332..................................... 15 566 31 D c D 28 34 63 D D D
Construction 45............................................... 3 251 5 2 853 36 712 31 5 50 6 14 8Transportation, communications, and utilities 7................... D 4 D a D 50 D 81 D D DRetail trade 90................................................ 9 802 22 D c D 36 51 86 D D DFinance, insurance, and real estate 9........................... D – – – – 90 D – – – –Services 67................................................... 472 – – – – 40 58 – – – –Industries not classified 113...................................... D – – – – 59 D – – – –
Agricultural services, forestry, fishing, and mining 16............... D 8 D a D 56 D 89 D D DConstruction 86............................................... 7 973 21 D b D 37 28 71 D D DManufacturing 11.............................................. D 1 D e D 35 D – D D DTransportation, communications, and utilities 31................... D – – – – 27 D – – – –Wholesale trade 3............................................ D – – – – 80 D – – – –Retail trade 114................................................ D 24 D b D 35 D 83 D D DFinance, insurance, and real estate 22........................... D – – – – 81 D – – – –Services 510................................................... 31 759 68 27 098 1 085 15 542 38 67 41 80 83 87Industries not classified 90...................................... D – – – – 51 D – – – –
1All firms data include both firms with paid employees and firms with no paid employees.2For explanation of relative standard errors, see Reliability of Estimates in the introductory text.
54 BLACK MINORITY~OWNED BUSINESS ENTERPRISESU.S. Census Bureau, 1997 Economic Census Mar. 15, 2001
Table 5. Statistics for Selected Counties With 100 or More Black~Owned Firms: 1997[Detail may not add to total because of rounding. For meaning of abbreviations and symbols, see introductory text. For explanation of terms, see Appendix A. For information on geographic areasfollowed by *, see Appendix C]
Geographic area
All firms1 Firms with paid employeesRelative standard error of
Baldwin County, AL 254......................................... 9 888 11 4 850 66 312 28 36 40 62 57 48Bullock County, AL 159.......................................... 4 272 19 3 309 258 1 267 41 59 55 77 92 91Butler County, AL 144........................................... 1 439 – – – – 45 40 – – – –Calhoun County, AL 420......................................... 21 270 45 15 723 305 4 361 33 22 22 30 40 34Chambers County, AL 145....................................... 2 620 7 650 8 62 36 30 46 41 63 33
Choctaw County, AL 122........................................ 2 246 1 D a D 46 57 – D D DClarke County, AL 120.......................................... 2 189 7 544 3 156 15 15 45 27 – 40Colbert County, AL 255.......................................... 3 331 7 667 26 101 41 22 62 29 79 21Dale County, AL 202............................................ 10 417 84 8 316 169 3 687 37 35 69 47 58 51Dallas County, AL 250........................................... 9 010 26 5 437 99 1 575 23 19 29 25 25 36
Elmore County, AL 106.......................................... 4 014 25 3 070 71 842 29 56 59 72 79 75Escambia County, AL 129....................................... 1 657 2 D a D 48 27 – D D DEtowah County, AL 144......................................... 2 807 17 1 372 165 2 521 14 10 35 21 13 3Greene County, AL 103......................................... 6 970 35 5 796 252 2 109 14 32 45 41 49 47Hale County, AL 198............................................ 4 052 58 3 131 204 785 36 48 83 65 71 50
Houston County, AL 251......................................... 6 075 27 3 267 149 1 167 15 18 23 25 26 26Jefferson County, AL 4 764........................................ 206 975 582 143 697 3 067 57 302 7 7 13 8 10 9Lauderdale County, AL 123...................................... 12 415 20 10 844 150 1 644 14 25 38 25 64 51Lee County, AL 518............................................. 28 273 59 22 450 426 4 271 24 9 27 12 16 16Limestone County, AL 153....................................... 5 848 15 3 897 69 800 36 12 30 10 11 10
Macon County, AL 303.......................................... 33 615 44 29 733 381 7 197 25 32 23 37 26 32Madison County, AL 1 556......................................... 226 458 186 208 510 2 551 74 322 12 3 13 4 6 4Marengo County, AL 168........................................ 3 578 11 1 139 23 243 34 24 32 20 15 15Mobile County, AL 2 517.......................................... 101 855 260 57 061 1 473 16 938 10 9 13 7 14 9Monroe County, AL 134......................................... 8 767 7 D b D 42 51 64 D D D
Montgomery County, AL 1 863..................................... 124 791 287 87 182 1 318 25 263 11 8 11 14 17 17Morgan County, AL 113......................................... 7 756 28 D c D 17 39 27 D D DPerry County, AL 144........................................... 8 109 60 7 197 116 754 26 44 65 51 64 43Pike County, AL 143............................................ 2 119 6 D b D 31 24 53 D D DRussell County, AL 336.......................................... 7 396 18 3 930 51 1 300 34 35 36 54 31 60
Shelby County, AL 184.......................................... 13 222 33 D b D 18 52 61 D D DSumter County, AL 109.......................................... 7 790 16 6 327 83 784 26 43 44 54 51 57Talladega County, AL 306....................................... 6 933 14 1 643 108 444 28 35 54 52 58 59Tallapoosa County, AL 229...................................... 5 343 17 1 204 26 194 49 41 27 32 38 33Tuscaloosa County, AL 882...................................... 26 394 78 13 806 419 2 030 17 18 30 32 42 29Washington County, AL 146...................................... 3 849 4 923 20 185 37 41 41 42 18 34
Cochise County, AZ 169......................................... 11 081 20 10 481 476 6 756 25 37 71 40 76 54Maricopa County, AZ 2 455........................................ 252 257 374 D h D 5 14 23 D D DPima County, AZ 553........................................... 27 939 58 22 791 445 6 208 18 22 33 29 30 22
Arkansas County, AR 105....................................... 4 142 11 2 733 24 561 41 38 41 62 74 71Columbia County, AR 143....................................... 3 159 2 D a D 44 62 – D D DCrittenden County, AR 427....................................... 8 966 60 3 905 37 1 625 23 20 84 46 31 54Faulkner County, AR 181........................................ 20 241 19 D c D 23 5 42 D D DJefferson County, AR 580....................................... 37 442 80 28 226 283 3 598 10 4 15 6 9 6
Miller County, AR 107........................................... 2 828 10 D b D 15 31 69 D D DMississippi County, AR 175...................................... 4 395 10 1 567 6 453 26 18 32 42 37 44Monroe County, AR 113......................................... 1 625 9 909 9 110 47 33 51 60 70 62Ouachita County, AR 104........................................ 3 700 14 2 615 24 366 20 13 47 20 27 29Phillips County, AR 214......................................... 10 522 16 4 451 68 1 168 11 18 22 34 34 48
Pulaski County, AR 2 409......................................... 198 722 316 D g D 6 8 13 D D DSt. Francis County, AR 316...................................... 9 742 17 6 940 108 1 119 24 40 30 56 43 41Union County, AR 134........................................... 29 921 10 27 108 68 3 131 14 7 33 8 24 47
Alameda County, CA 7 640........................................ 459 785 864 256 140 5 061 63 722 21 22 42 37 55 33Contra Costa County, CA 3 139.................................... 151 482 243 89 025 770 20 830 23 21 41 32 57 38Fresno County, CA 1 500.......................................... D 166 D c D 33 D 88 D D DLos Angeles County, CA 38 277..................................... 3 321 671 3 359 2 444 226 32 268 568 300 5 10 13 14 29 25Monterey County, CA 362....................................... 52 159 31 D f D 41 35 60 D D D
Orange County, CA 1 702......................................... 278 151 344 236 125 1 763 53 971 22 11 41 12 17 10Riverside County, CA 3 489....................................... 164 405 341 106 508 1 493 34 901 33 29 42 44 75 57Sacramento County, CA 1 898..................................... D 182 D g D 24 D 46 D D DSan Bernardino County, CA 5 520.................................. 295 566 633 134 720 1 286 38 112 25 48 73 79 41 76San Diego County, CA 3 978...................................... 121 417 99 67 344 1 509 27 561 17 13 37 20 14 19
San Francisco County, CA 3 484................................... 671 650 503 628 747 3 561 102 577 27 49 38 51 56 42San Joaquin County, CA 759..................................... 52 611 30 D c D 33 53 49 D D DSanta Clara County, CA 1 665..................................... 151 107 78 95 551 907 40 412 32 15 32 12 11 5Santa Cruz County, CA 140...................................... 1 986 – – – – 37 46 – – – –Solano County, CA 1 248.......................................... D 131 D c D 33 D 63 D D DVentura County, CA 1 352......................................... 69 426 106 19 608 326 8 291 40 54 83 35 35 43
Adams County, CO 232......................................... 21 359 59 D e D 16 36 36 D D DArapahoe County, CO 969....................................... 86 383 73 59 199 239 7 189 10 8 30 4 9 11Boulder County, CO 130......................................... 5 581 7 D a D 24 63 76 D D DDenver County, CO 2 178......................................... 204 456 365 173 085 1 991 38 446 10 12 18 14 14 13El Paso County, CO 704......................................... 67 931 74 55 135 549 14 217 8 4 27 5 10 5Jefferson County, CO 196....................................... 73 645 50 69 443 426 13 265 23 53 37 57 39 49
See footnotes at end of table.
MINORITY~OWNED BUSINESS ENTERPRISES BLACK 55U.S. Census Bureau, 1997 Economic Census Mar. 15, 2001
Table 5. Statistics for Selected Counties With 100 or More Black~Owned Firms: 1997mCon.[Detail may not add to total because of rounding. For meaning of abbreviations and symbols, see introductory text. For explanation of terms, see Appendix A. For information on geographic areasfollowed by *, see Appendix C]
Geographic area
All firms1 Firms with paid employeesRelative standard error of
Kent County, DE 470............................................ 22 625 44 15 964 385 5 423 10 17 17 24 17 25New Castle County, DE 1 632...................................... D 232 D h D 8 D 16 D D DSussex County, DE 606......................................... D 46 D e D 14 D 29 D D D
District of Columbia 10 909............................. 1 334 651 1 232 D j D 5 6 8 D D D
District of Columbia, DC 10 909..................................... 1 334 651 1 232 D j D 5 6 8 D D D
Baldwin County, GA 270......................................... 21 263 109 20 020 770 6 558 27 62 57 65 66 62Bibb County, GA 1 953............................................ 80 478 243 43 894 836 12 847 14 19 30 26 26 27Brooks County, GA 194......................................... 1 631 – – – – 40 67 – – – –Bulloch County, GA 212......................................... 10 376 32 8 082 144 1 792 21 48 43 57 30 41Burke County, GA 152.......................................... 2 103 – – – – 48 40 – – – –
Camden County, GA 159........................................ 17 394 36 16 519 127 6 621 41 49 46 50 46 55Carroll County, GA 156.......................................... 4 652 6 1 918 32 976 44 22 41 45 53 69Chatham County, GA 2 057....................................... 93 017 311 D f D 9 13 14 D D DClarke County, GA 412.......................................... 67 679 92 59 532 605 8 667 16 15 44 18 49 26Clayton County, GA 2 590......................................... 267 024 150 232 432 2 061 42 452 11 27 21 32 45 35
Cobb County, GA 3 493........................................... 327 213 506 263 537 3 940 52 400 12 15 24 20 40 27Coffee County, GA 225.......................................... 3 685 1 D a D 35 40 – D D DColumbia County, GA 238....................................... 20 798 29 18 510 271 6 019 31 57 49 64 73 79Coweta County, GA 421......................................... 49 906 43 D f D 32 78 53 D D DDecatur County, GA 263......................................... 3 661 8 1 200 33 284 41 39 48 42 36 36
DeKalb County, GA 11 987......................................... 581 964 949 338 055 4 932 96 242 5 8 13 16 23 18Dodge County, GA 177.......................................... 5 588 2 D a D 40 57 – D D DDougherty County, GA 935...................................... D 216 D g D 15 D 26 D D DDouglas County, GA 407........................................ 98 657 52 91 710 404 9 267 19 59 42 65 44 60Emanuel County, GA 111........................................ 3 858 32 D a D 49 50 96 D D D
Fayette County, GA 561......................................... 33 218 22 21 769 306 13 254 27 49 44 77 80 84Floyd County, GA 120........................................... 3 333 10 2 820 144 1 055 48 36 45 42 35 44Fulton County, GA 11 234.......................................... 1 233 689 1 357 1 002 910 12 760 232 655 5 7 8 9 13 7Glynn County, GA 330.......................................... 8 868 87 5 373 148 1 036 26 25 77 40 69 45Greene County, GA 175......................................... 6 482 13 D c D 37 75 95 D D D
Gwinnett County, GA 2 081........................................ 215 735 179 182 289 1 520 39 030 12 26 20 31 42 39Hancock County, GA 125........................................ 2 761 15 1 375 52 437 30 25 44 44 54 65Henry County, GA 467.......................................... 62 258 25 50 006 271 4 854 29 16 29 8 38 20Houston County, GA 700........................................ 35 078 97 23 411 521 4 933 24 25 67 37 44 33Jefferson County, GA 172....................................... 9 090 5 D b D 41 12 66 D D D
Jones County, GA 102.......................................... 5 852 4 D a D 40 47 84 D D DLaurens County, GA 368........................................ 8 920 36 5 340 210 1 060 34 26 38 33 36 34Liberty County, GA 452.......................................... 14 714 41 9 705 216 2 914 21 45 54 61 72 63Lowndes County, GA 316........................................ 21 622 82 18 392 325 6 181 18 39 40 48 49 61Macon County, GA 247.......................................... 16 936 54 3 804 126 955 31 60 72 23 45 35
See footnotes at end of table.
56 BLACK MINORITY~OWNED BUSINESS ENTERPRISESU.S. Census Bureau, 1997 Economic Census Mar. 15, 2001
Table 5. Statistics for Selected Counties With 100 or More Black~Owned Firms: 1997mCon.[Detail may not add to total because of rounding. For meaning of abbreviations and symbols, see introductory text. For explanation of terms, see Appendix A. For information on geographic areasfollowed by *, see Appendix C]
Geographic area
All firms1 Firms with paid employeesRelative standard error of
estimate (percent)2
for columnmFirms(number)
Sales andreceipts($1,000)
Firms(number)
Sales andreceipts($1,000)
Employees(number)
Annualpayroll
($1,000)
A B C D E F A B C D E F
GeorgiamCon.
Mitchell County, GA 173......................................... 2 899 16 D b D 48 54 90 D D DMonroe County, GA 216......................................... 8 054 4 D a D 35 42 60 D D DMuscogee County, GA 1 583...................................... 150 810 192 124 071 1 413 46 654 10 39 27 45 18 55Newton County, GA 302......................................... 13 888 19 D c D 31 61 56 D D DPeach County, GA 141.......................................... 7 246 22 D b D 35 43 57 D D D
Putnam County, GA 112......................................... 3 588 35 1 756 12 434 38 32 87 45 – 70Richmond County, GA 2 267....................................... 162 891 205 133 821 2 164 43 739 8 19 18 25 25 30Rockdale County, GA 491....................................... 7 822 17 1 294 74 401 24 23 36 49 42 53Spalding County, GA 173........................................ 41 697 45 D c D 25 3 69 D D DSumter County, GA 304......................................... 21 675 44 D c D 28 51 91 D D D
Tattnall County, GA 181......................................... 6 372 36 D b D 36 38 86 D D DTelfair County, GA 152.......................................... 1 385 – – – – 39 56 – – – –Thomas County, GA 411........................................ 15 856 49 12 517 325 2 791 26 42 59 55 64 51Tift County, GA 224............................................. 4 436 2 D a D 33 47 – D D DToombs County, GA 132........................................ 5 891 25 3 837 69 1 238 42 39 46 65 54 77
Troup County, GA 368.......................................... 7 918 19 3 759 124 1 027 29 29 42 48 63 52Ware County, GA 160........................................... 3 952 33 D b D 33 33 94 D D DWashington County, GA 184..................................... 4 488 13 1 891 91 814 42 27 39 37 38 37Whitfield County, GA 150........................................ 815 6 D a D 43 22 89 D D DWilkes County, GA 227.......................................... 7 280 10 D b D 24 49 65 D D DWorth County, GA 131.......................................... 1 187 3 743 14 169 43 11 – – – –
Champaign County, IL 706....................................... D 24 D b D 18 D 38 D D DCook County, IL 32 377............................................ 2 980 727 2 965 2 447 558 29 586 664 329 2 9 4 11 20 12DuPage County, IL 689.......................................... 52 759 19 29 267 239 8 021 20 17 19 11 6 2Jackson County, IL 259......................................... 3 255 17 1 633 15 553 34 39 70 69 – 50Kane County, IL 487............................................ 36 813 52 31 940 83 3 160 16 6 52 7 34 12
Lake County, IL 799............................................ 260 407 139 249 463 995 32 070 19 63 42 66 28 27McLean County, IL 156.......................................... 8 624 19 7 517 309 2 845 29 59 59 69 85 78Macon County, IL 509........................................... 26 647 8 D b D 22 3 66 D D DMadison County, IL 369......................................... D 29 12 347 128 3 454 27 D 38 47 21 56Peoria County, IL 608........................................... 16 091 80 D c D 18 27 56 D D D
Rock Island County, IL 185...................................... 47 562 52 45 631 271 11 506 34 43 87 46 29 38St. Clair County, IL 1 147.......................................... 43 581 91 29 793 568 8 410 15 17 37 23 19 26Sangamon County, IL 271....................................... 19 185 28 11 308 130 2 582 37 22 32 5 11 5Will County, IL 1 110.............................................. 40 122 59 D e D 21 45 57 D D DWinnebago County, IL 548....................................... 31 918 37 17 470 132 2 920 23 31 44 31 26 13
Allen County, IN 570............................................ D 86 D g D 20 D 23 D D DClark County, IN 130............................................ D 17 D c D 21 D 35 D D DDelaware County, IN 114........................................ 4 411 9 1 079 36 515 15 52 52 62 83 81Hamilton County, IN 123......................................... 73 738 28 71 107 185 10 129 25 34 38 35 74 72Howard County, IN 221.......................................... D 14 D b D 47 D 41 D D D
Lake County, IN 2 475............................................ D 398 D h D 9 D 14 D D DLa Porte County, IN 284......................................... 15 627 29 13 094 73 1 389 27 63 32 76 54 66Madison County, IN 159......................................... 43 637 11 D c D 35 3 37 D D DMarion County, IN 5 086.......................................... 502 302 690 435 758 4 854 88 672 4 14 17 17 23 19St. Joseph County, IN 832....................................... 76 597 53 62 951 322 8 897 23 8 27 4 11 7Tippecanoe County, IN 107...................................... D 4 D b D 28 D 63 D D DVanderburgh County, IN 211..................................... D 12 D c D 13 D 33 D D D
Black Hawk County, IA 184...................................... 12 548 15 9 845 181 3 785 17 11 34 9 21 11Linn County, IA 149............................................. 11 974 33 10 519 179 2 198 27 13 67 13 49 21Polk County, IA 433............................................. D 84 D f D 8 D 20 D D DScott County, IA 236............................................ 22 571 70 20 547 267 3 234 33 18 76 18 60 33
Douglas County, KS 102......................................... 3 778 34 D b D 29 35 77 D D DGeary County, KS 135.......................................... D 24 D f D 26 D 62 D D DJohnson County, KS 352........................................ 115 680 61 107 837 814 19 193 14 23 20 24 38 32Leavenworth County, KS 149.................................... 30 619 11 D c D 40 72 34 D D DSedgwick County, KS 947....................................... 91 751 153 D g D 12 13 16 D D DShawnee County, KS 507........................................ 123 626 124 118 373 1 033 79 124 17 84 43 88 61 91Wyandotte County, KS 797...................................... 48 404 80 D f D 10 21 17 D D D
Calloway County, KY 225........................................ 2 855 4 D a D 32 53 86 D D DChristian County, KY 173........................................ D 5 D a D 11 D 46 D D DDaviess County, KY 214......................................... 22 339 13 D c D 35 77 64 D D DFayette County, KY 515......................................... 23 159 57 D c D 11 10 17 D D DHardin County, KY 139.......................................... 7 835 20 5 924 172 2 218 22 36 41 45 36 48Jefferson County, KY 2 653........................................ 295 810 381 263 626 5 261 72 817 6 7 14 9 15 10McCracken County, KY 180...................................... 2 664 4 779 9 169 34 16 – – – –
Ascension Parish, LA 223........................................ 10 299 34 D b D 26 38 44 D D DAvoyelles Parish, LA 199........................................ 5 153 12 3 377 72 1 011 28 25 35 34 48 54Bossier Parish, LA 624.......................................... 17 905 38 9 760 186 3 103 21 28 44 44 52 61Caddo Parish, LA 1 951........................................... 106 347 184 D g D 14 18 39 D D DCalcasieu Parish, LA 909........................................ 75 516 93 62 952 1 417 23 902 13 35 26 40 46 53
See footnotes at end of table.
MINORITY~OWNED BUSINESS ENTERPRISES BLACK 57U.S. Census Bureau, 1997 Economic Census Mar. 15, 2001
Table 5. Statistics for Selected Counties With 100 or More Black~Owned Firms: 1997mCon.[Detail may not add to total because of rounding. For meaning of abbreviations and symbols, see introductory text. For explanation of terms, see Appendix A. For information on geographic areasfollowed by *, see Appendix C]
Geographic area
All firms1 Firms with paid employeesRelative standard error of
estimate (percent)2
for columnmFirms(number)
Sales andreceipts($1,000)
Firms(number)
Sales andreceipts($1,000)
Employees(number)
Annualpayroll
($1,000)
A B C D E F A B C D E F
LouisianamCon.
Claiborne Parish, LA 138........................................ 2 006 – – – – 49 65 – – – –Concordia Parish, LA 128........................................ 16 446 30 D e D 29 72 50 D D DEast Baton Rouge Parish, LA 3 811................................. 244 353 379 162 416 3 385 49 963 5 13 13 17 35 26Franklin Parish, LA 105.......................................... 1 373 1 D a D 39 28 – D D DIberia Parish, LA 400............................................ 10 543 13 2 751 68 857 20 13 37 38 47 41
Berrien County, MI 380.......................................... 42 082 43 D e D 19 29 43 D D DCalhoun County, MI 370......................................... 44 830 55 41 493 414 8 479 29 53 49 56 49 62Eaton County, MI 118........................................... 3 710 – – – – 43 66 – – – –Genesee County, MI 1 677........................................ 283 584 172 257 511 1 080 27 121 7 43 29 46 20 26Ingham County, MI 685.......................................... 138 065 76 123 902 1 711 27 783 24 45 38 51 56 58
Jackson County, MI 127......................................... 6 271 9 D b D 42 39 50 D D DKalamazoo County, MI 345...................................... 16 741 32 D c D 19 23 48 D D DKent County, MI 987............................................ 120 636 103 98 554 776 18 177 17 18 20 21 19 29Macomb County, MI 279......................................... 217 776 63 213 498 4 174 59 601 19 12 34 12 46 34Muskegon County, MI 170....................................... D 6 8 367 344 2 363 37 D 44 13 2 12
Oakland County, MI 4 177......................................... 1 236 203 562 1 149 667 6 036 200 502 10 44 19 47 16 34Saginaw County, MI 580......................................... 106 719 76 102 003 445 9 044 18 71 52 74 51 69Van Buren County, MI 116....................................... 5 305 4 D b D 42 59 86 D D DWashtenaw County, MI 1 181...................................... D 73 D g D 16 D 39 D D DWayne County, MI 13 140.......................................... 2 014 470 1 463 1 775 209 19 293 482 948 4 18 9 21 24 36
Dakota County, MN 309......................................... 50 757 21 D e D 29 8 29 D D DHennepin County, MN 2 285....................................... 246 009 308 206 871 2 220 52 007 7 7 22 9 23 14Ramsey County, MN 869........................................ 94 697 96 80 233 1 279 27 092 11 27 24 34 25 34Washington County, MN 129..................................... D 9 D e D 40 D 54 D D D
See footnotes at end of table.
58 BLACK MINORITY~OWNED BUSINESS ENTERPRISESU.S. Census Bureau, 1997 Economic Census Mar. 15, 2001
Table 5. Statistics for Selected Counties With 100 or More Black~Owned Firms: 1997mCon.[Detail may not add to total because of rounding. For meaning of abbreviations and symbols, see introductory text. For explanation of terms, see Appendix A. For information on geographic areasfollowed by *, see Appendix C]
Geographic area
All firms1 Firms with paid employeesRelative standard error of
Adams County, MS 323......................................... 8 251 13 3 372 63 653 24 17 30 28 21 24Attala County, MS 185.......................................... 8 065 77 6 523 377 1 605 35 41 67 47 69 46Bolivar County, MS 605......................................... 11 608 99 7 252 244 2 004 19 16 35 24 35 28Calhoun County, MS 136........................................ 1 158 3 D a D 46 48 82 D D DChickasaw County, MS 178...................................... 10 378 22 D b D 38 30 79 D D D
Clarke County, MS 163.......................................... 3 395 8 1 167 15 128 34 27 49 43 52 54Coahoma County, MS 231....................................... 12 112 96 9 621 252 2 633 25 18 49 21 19 15DeSoto County, MS 480......................................... 25 687 79 9 482 413 2 203 33 52 74 56 61 58Forrest County, MS 220......................................... 7 523 17 4 505 81 1 111 19 18 18 30 12 16Grenada County, MS 223........................................ 10 753 20 8 925 103 1 393 34 49 68 61 61 61
Harrison County, MS 687........................................ 32 350 41 20 718 337 3 827 14 15 22 12 15 16Hinds County, MS 3 672.......................................... 226 467 436 160 722 3 376 46 509 9 9 12 11 15 16Holmes County, MS 193......................................... 9 500 22 4 044 75 782 31 25 35 40 36 36Jackson County, MS 556........................................ 23 199 86 15 896 342 4 738 22 21 64 25 20 17Jefferson Davis County, MS 112.................................. 5 482 8 D b D 48 10 41 D D D
Jones County, MS 207.......................................... 43 536 23 37 617 115 2 726 38 26 60 30 18 17Lafayette County, MS 169....................................... 3 583 6 1 749 52 445 35 23 – – – –Lauderdale County, MS 737...................................... 17 558 39 8 856 366 3 336 19 17 22 23 25 16Leake County, MS 134.......................................... 3 510 16 D b D 31 37 97 D D DLee County, MS 252............................................ 43 811 26 40 217 170 4 021 27 3 19 2 8 9
Leflore County, MS 295......................................... 20 964 92 16 373 317 2 850 31 47 44 61 37 39Lincoln County, MS 209......................................... 3 417 33 2 033 38 470 30 25 52 37 57 37Lowndes County, MS 462........................................ 13 098 45 4 596 66 730 19 30 43 39 19 22Madison County, MS 696........................................ 36 064 124 26 607 385 3 960 21 18 45 25 26 23Marshall County, MS 344........................................ 15 185 31 9 587 174 3 636 30 28 31 44 48 65
Montgomery County, MS 111.................................... 1 795 7 D b D 47 52 56 D D DNeshoba County, MS 132........................................ 1 303 7 620 8 222 48 32 46 50 40 68Oktibbeha County, MS 188...................................... 3 968 22 1 827 76 522 20 11 47 25 33 18Pike County, MS 368............................................ 19 641 77 12 015 133 2 867 22 41 61 68 35 70Quitman County, MS 146........................................ 4 392 55 3 492 118 752 45 46 88 60 82 68
Rankin County, MS 573......................................... 20 921 35 7 068 45 1 172 22 34 45 42 46 33Scott County, MS 124........................................... 3 572 15 1 427 16 151 42 30 57 54 52 54Simpson County, MS 159........................................ 2 541 1 D a D 34 28 – D D DSunflower County, MS 117....................................... 5 279 10 3 539 27 253 49 19 39 25 14 13Tate County, MS 115........................................... 5 250 6 474 14 63 45 61 42 10 18 8
Warren County, MS 475......................................... 14 990 70 8 834 102 1 788 21 41 42 58 37 48Washington County, MS 675..................................... 31 241 163 22 217 445 4 788 18 29 41 35 49 43Wilkinson County, MS 113....................................... 3 767 1 D a D 49 52 – D D DYalobusha County, MS 151...................................... 2 880 3 D b D 47 13 – D D DYazoo County, MS 168.......................................... 13 182 21 4 525 43 547 42 58 33 50 33 46
Boone County, MO 415......................................... D 34 D b D 33 D 40 D D DCape Girardeau County, MO 140................................. 6 490 12 D b D 46 15 37 D D DCass County, MO 106........................................... D 36 5 989 126 1 689 48 D 72 68 71 61Clay County, MO 121........................................... 35 439 15 32 445 374 9 157 45 47 57 51 30 38Cole County, MO 103........................................... 1 649 1 D a D 39 56 – D D D
Jackson County, MO 3 438........................................ 355 556 823 299 752 4 050 79 338 16 18 37 21 10 13Pemiscot County, MO 265....................................... 3 332 3 D a D 25 40 79 D D DSt. Charles County, MO 201..................................... 26 215 32 23 230 522 6 301 30 20 26 18 36 30St. Louis County, MO 4 482....................................... 438 075 590 366 857 4 351 71 330 5 9 16 11 16 16St. Louis, MO (IC) 3 431.......................................... 255 471 498 210 874 3 363 61 952 6 8 10 11 17 13
Montana 62........................................ D 15 D b D 23 D 20 D D D
Douglas County, NE 1 148........................................ 90 248 194 77 578 1 274 21 313 10 7 20 8 13 10Lancaster County, NE 167....................................... D 19 D c D 20 D 43 D D DSarpy County, NE 184........................................... D 9 D c D 12 D 38 D D D
Clark County, NV 2 494........................................... D 271 D g D 7 D 25 D D DWashoe County, NV 175........................................ 22 092 60 20 593 312 6 273 26 12 74 13 1 34
MINORITY~OWNED BUSINESS ENTERPRISES BLACK 59U.S. Census Bureau, 1997 Economic Census Mar. 15, 2001
Table 5. Statistics for Selected Counties With 100 or More Black~Owned Firms: 1997mCon.[Detail may not add to total because of rounding. For meaning of abbreviations and symbols, see introductory text. For explanation of terms, see Appendix A. For information on geographic areasfollowed by *, see Appendix C]
Geographic area
All firms1 Firms with paid employeesRelative standard error of
estimate (percent)2
for columnmFirms(number)
Sales andreceipts($1,000)
Firms(number)
Sales andreceipts($1,000)
Employees(number)
Annualpayroll
($1,000)
A B C D E F A B C D E F
New JerseymCon.
Somerset County, NJ 674....................................... 32 764 43 D c D 18 25 36 D D DUnion County, NJ 2 940........................................... 116 722 219 59 572 1 021 19 835 10 7 21 12 16 10Warren County, NJ 109......................................... 1 663 – – – – 49 24 – – – –
Albany County, NY 432.......................................... 13 791 30 7 442 197 2 172 23 25 47 19 14 24Bronx County, NY 11 848........................................... 501 472 712 333 634 3 616 58 864 6 29 21 46 21 23Dutchess County, NY 441....................................... 15 244 14 5 226 60 1 808 32 40 66 53 62 58Erie County, NY 1 861............................................ D 181 D g D 16 D 37 D D DJefferson County, NY 268....................................... 1 300 – – – – 44 51 – – – –
Kings County, NY 24 629........................................... 1 090 377 1 790 612 616 12 486 215 412 6 20 18 33 44 40Monroe County, NY 1 877......................................... 195 735 188 178 872 1 709 37 716 13 23 25 25 22 30Nassau County, NY 5 450......................................... 414 919 536 269 551 4 145 94 471 8 24 32 36 51 48New York County, NY 12 254....................................... 1 404 971 2 056 1 124 843 8 643 314 430 5 14 14 15 17 12Onondaga County, NY 549...................................... 40 862 28 D e D 47 21 35 D D D
Orange County, NY 841......................................... 20 883 77 6 972 104 596 26 27 94 79 84 59Queens County, NY 13 545......................................... 677 475 1 076 412 218 7 749 156 733 7 22 26 37 65 64Richmond County, NY 1 057....................................... 22 344 20 8 615 109 3 221 21 28 69 48 14 64Rockland County, NY 1 047....................................... 19 918 58 D b D 23 25 52 D D DSuffolk County, NY 3 456.......................................... 142 183 300 93 344 768 18 198 8 14 33 21 32 23Ulster County, NY 358........................................... 5 225 5 D a D 37 51 71 D D DWestchester County, NY 5 000..................................... 271 893 603 193 461 3 247 43 835 10 17 31 24 57 37
60 BLACK MINORITY~OWNED BUSINESS ENTERPRISESU.S. Census Bureau, 1997 Economic Census Mar. 15, 2001
Table 5. Statistics for Selected Counties With 100 or More Black~Owned Firms: 1997mCon.[Detail may not add to total because of rounding. For meaning of abbreviations and symbols, see introductory text. For explanation of terms, see Appendix A. For information on geographic areasfollowed by *, see Appendix C]
Geographic area
All firms1 Firms with paid employeesRelative standard error of
estimate (percent)2
for columnmFirms(number)
Sales andreceipts($1,000)
Firms(number)
Sales andreceipts($1,000)
Employees(number)
Annualpayroll
($1,000)
A B C D E F A B C D E F
North CarolinamCon.
Warren County, NC 220......................................... 9 633 37 5 559 145 1 836 28 24 47 17 16 13Wayne County, NC 520......................................... 13 074 46 6 221 152 1 150 18 19 21 21 23 28Wilkes County, NC 119.......................................... D 3 D b D 45 D 82 D D DWilson County, NC 470.......................................... 20 517 67 13 975 284 3 090 19 16 34 22 14 20
North Dakota 99.................................... D 8 D c D 16 D – D D D
Allen County, OH 144........................................... D 23 D c D 19 D 40 D D DButler County, OH 287.......................................... 90 389 25 86 105 336 8 615 21 36 51 38 29 39Clark County, OH 149........................................... 18 350 18 D c D 36 2 34 D D DCuyahoga County, OH 7 832...................................... 992 676 938 864 956 8 440 173 771 5 13 8 15 23 21Delaware County, OH 165....................................... 17 710 24 D e D 34 26 49 D D D
Franklin County, OH 4 548........................................ 758 867 725 681 894 3 598 84 249 5 33 18 37 13 12Greene County, OH 209......................................... 99 568 47 D g D 28 36 42 D D DHamilton County, OH 4 535........................................ D 577 D i D 7 D 15 D D DHighland County, OH 103........................................ 415 – – – – 45 44 – – – –Licking County, OH 133......................................... D 3 D a D 48 D 75 D D D
Lorain County, OH 531.......................................... 86 391 48 81 350 510 12 969 26 47 39 49 27 24Lucas County, OH 1 538.......................................... D 178 D f D 14 D 29 D D DMahoning County, OH 535....................................... 35 898 64 D f D 27 64 48 D D DMontgomery County, OH 2 072.................................... 248 040 318 214 801 3 033 39 474 9 21 23 25 26 19Muskingum County, OH 114..................................... 14 058 13 11 876 74 1 851 40 19 35 22 41 23
Richland County, OH 135........................................ D 59 14 961 143 1 972 21 D 49 55 42 44Stark County, OH 544........................................... 44 328 52 D f D 20 26 50 D D DSummit County, OH 1 448......................................... 71 103 113 48 643 753 16 152 10 19 33 26 40 36Trumbull County, OH 260........................................ 100 015 58 D e D 30 3 29 D D D
Cleveland County, OK 125....................................... 21 511 10 D c D 15 27 52 D D DComanche County, OK 257...................................... 8 997 37 D c D 12 26 26 D D DMuskogee County, OK 202...................................... 10 878 94 9 167 293 2 172 29 49 57 58 56 65Oklahoma County, OK 2 020...................................... 183 573 210 153 506 2 407 50 936 8 8 14 8 13 12Osage County, OK 108.......................................... 1 193 8 D a D 15 15 80 D D DTulsa County, OK 1 699........................................... 73 031 156 47 448 1 188 12 966 12 18 19 28 31 25
Marion County, OR 121......................................... D 2 D b D 24 D – D D DMultnomah County, OR 1 534...................................... 333 592 220 310 421 2 453 53 979 10 31 21 33 38 27Washington County, OR 183..................................... D 20 D b D 18 D 35 D D D
Allegheny County, PA 2 526....................................... 265 485 477 230 326 3 636 64 327 11 19 21 23 25 22Berks County, PA 249........................................... 26 789 66 22 950 834 9 564 36 64 80 76 83 81Bucks County, PA 593.......................................... 55 841 42 47 115 396 7 780 24 10 45 10 16 13Chester County, PA 475......................................... 90 427 170 77 479 497 15 398 24 51 49 60 49 53Dauphin County, PA 570........................................ 32 082 59 22 560 347 5 252 25 23 30 26 17 24
Delaware County, PA 1 439....................................... 88 767 210 67 577 672 14 891 10 20 20 24 12 16Erie County, PA 383............................................ 40 112 105 38 766 479 7 540 23 9 51 9 44 28Lancaster County, PA 145....................................... 31 257 21 28 543 267 7 444 17 22 36 25 39 36Lehigh County, PA 187.......................................... 67 396 55 D e D 23 19 47 D D DLycoming County, PA 151....................................... 1 152 – – – – 46 45 – – – –
Mercer County, PA 144.......................................... 7 843 67 5 218 58 623 27 46 66 70 96 65Monroe County, PA 212......................................... 5 315 12 D b D 38 45 56 D D DMontgomery County, PA 1 812..................................... 240 492 180 204 344 2 053 75 202 14 46 19 54 41 59Philadelphia County, PA 9 285..................................... 830 185 1 306 684 542 8 896 196 354 5 13 16 16 18 16Washington County, PA 251..................................... 20 342 24 17 736 272 3 635 32 37 40 43 39 48Westmoreland County, PA 176................................... 22 639 4 D b D 39 52 41 D D DYork County, PA 332............................................ 15 566 31 D c D 28 34 63 D D D
MINORITY~OWNED BUSINESS ENTERPRISES BLACK 61U.S. Census Bureau, 1997 Economic Census Mar. 15, 2001
Table 5. Statistics for Selected Counties With 100 or More Black~Owned Firms: 1997mCon.[Detail may not add to total because of rounding. For meaning of abbreviations and symbols, see introductory text. For explanation of terms, see Appendix A. For information on geographic areasfollowed by *, see Appendix C]
Geographic area
All firms1 Firms with paid employeesRelative standard error of
Anderson County, TN 196....................................... 46 232 9 45 251 729 22 678 38 60 29 62 62 49Davidson County, TN 4 026........................................ 349 974 753 291 178 3 216 79 729 6 11 18 13 12 18Dyer County, TN 157............................................ 5 303 7 D b D 45 55 91 D D DFayette County, TN 102......................................... 2 805 25 D b D 27 34 92 D D DGibson County, TN 178.......................................... 6 361 6 1 761 46 266 35 42 55 23 21 13
Hamilton County, TN 835........................................ D 162 D g D 9 D 21 D D DHardeman County, TN 155....................................... 4 500 18 1 034 22 223 39 33 84 66 69 53Haywood County, TN 112........................................ 59 552 10 D c D 45 70 37 D D DKnox County, TN 729........................................... 34 960 134 D f D 12 19 44 D D DMadison County, TN 651........................................ D 120 156 910 1 216 17 104 20 D 24 47 19 33
Maury County, TN 115.......................................... 1 452 18 941 3 327 43 47 85 74 – 88Montgomery County, TN 418..................................... D 35 D c D 18 D 31 D D DRutherford County, TN 380...................................... 67 676 45 63 071 350 8 796 23 60 31 65 38 46Shelby County, TN 9 796.......................................... 665 998 1 156 461 464 8 099 137 169 4 6 9 10 10 15Sumner County, TN 212......................................... 21 561 81 D a D 45 64 93 D D D
Tipton County, TN 127.......................................... 1 418 16 D a D 19 22 96 D D DWashington County, TN 112..................................... D 1 D a D 47 D – D D DWilliamson County, TN 166...................................... 4 299 4 D a D 41 48 57 D D DWilson County, TN 317.......................................... 14 292 30 12 296 273 4 241 39 55 58 65 61 74
Bell County, TX 717............................................. 33 374 20 D e D 31 34 54 D D DBexar County, TX 1 789........................................... 132 906 236 D g D 18 26 23 D D DBowie County, TX 205........................................... 2 288 6 D b D 48 60 90 D D DBrazoria County, TX 457......................................... 3 772 6 D a D 43 21 37 D D DBrazos County, TX 248.......................................... D 38 D c D 32 D 83 D D D
Collin County, TX 850........................................... 32 038 66 22 077 398 6 185 28 37 42 44 48 39Coryell County, TX 333.......................................... 8 943 7 D a D 47 87 90 D D DDallas County, TX 12 333.......................................... 2 027 028 1 793 1 793 813 13 405 290 970 7 29 23 33 28 28Denton County, TX 505.......................................... 111 099 9 102 305 257 10 138 40 6 – – – –Ellis County, TX 185............................................ 44 608 51 D f D 40 81 50 D D D
Fort Bend County, TX 3 234....................................... 89 031 95 23 011 549 7 202 29 29 55 55 76 69Galveston County, TX 1 107....................................... 63 361 136 54 847 670 7 141 20 52 42 61 51 38Gregg County, TX 761.......................................... D 13 2 434 106 1 097 31 D 56 55 43 44Hardin County, TX 122.......................................... 29 288 58 D e D 30 60 49 D D DHarris County, TX 20 440........................................... 1 605 160 2 504 1 212 298 24 143 463 144 6 13 19 18 30 36
Harrison County, TX 405........................................ D 64 D g D 33 D 62 D D DJasper County, TX 209.......................................... 9 610 67 D c D 26 75 84 D D DJefferson County, TX 1 272........................................ 39 917 48 24 528 266 4 474 20 32 60 51 42 27Lamar County, TX 173.......................................... 5 375 – – – – 48 67 – – – –McLennan County, TX 483....................................... 35 150 83 26 785 370 3 500 29 54 69 72 58 70
Midland County, TX 175......................................... 2 230 – – – – 31 29 – – – –Montgomery County, TX 308..................................... 141 699 25 D e D 39 61 53 D D DNavarro County, TX 172......................................... 4 889 10 D c D 41 51 82 D D DNewton County, TX 214......................................... D 67 D h D 41 D 98 D D DNueces County, TX 188......................................... 8 181 7 D b D 38 49 34 D D D
Orange County, TX 286......................................... 38 742 15 D c D 40 7 76 D D DRandall County, TX 175......................................... D – – – – 42 D – – – –Smith County, TX 307........................................... 10 954 38 5 526 245 1 757 39 31 46 48 82 60Tarrant County, TX 3 299......................................... 957 574 512 D j D 11 74 25 D D DTravis County, TX 1 826........................................... 99 729 262 D g D 20 17 29 D D D
Walker County, TX 109.......................................... 18 620 5 D b D 26 48 68 D D DWichita County, TX 194......................................... 7 831 23 D b D 35 58 63 D D DWilliamson County, TX 536...................................... 81 288 2 D b D 26 8 – D D D
62 BLACK MINORITY~OWNED BUSINESS ENTERPRISESU.S. Census Bureau, 1997 Economic Census Mar. 15, 2001
Table 5. Statistics for Selected Counties With 100 or More Black~Owned Firms: 1997mCon.[Detail may not add to total because of rounding. For meaning of abbreviations and symbols, see introductory text. For explanation of terms, see Appendix A. For information on geographic areasfollowed by *, see Appendix C]
Geographic area
All firms1 Firms with paid employeesRelative standard error of
Accomack County, VA 134....................................... 7 547 9 5 184 59 1 536 11 40 36 53 42 49Albemarle County, VA 133....................................... 9 186 17 6 817 148 2 774 40 18 24 5 2 3Amherst County, VA 165........................................ D 4 D a D 41 D 61 D D DArlington County, VA 733........................................ 247 838 79 231 621 2 350 93 288 22 4 26 4 5 3Brunswick County, VA 226....................................... 35 997 95 33 723 348 10 559 31 43 55 47 43 62
Campbell County, VA 124....................................... 6 621 31 5 268 122 949 23 37 50 48 56 46Caroline County, VA 215........................................ 6 678 12 3 938 58 938 32 29 45 49 51 58Chesterfield County, VA 1 173..................................... 46 719 132 30 314 1 264 11 063 15 21 47 28 67 22Culpeper County, VA 103........................................ D 7 D b D 42 D 46 D D DDinwiddie County, VA 121....................................... 5 992 68 5 866 86 1 553 47 72 86 74 77 79
Essex County, VA 140.......................................... 4 459 16 2 127 53 247 37 35 44 67 51 40Fairfax County, VA 3 336.......................................... 628 236 389 566 999 6 829 226 324 8 16 14 18 16 18Fauquier County, VA 197........................................ 12 998 36 11 904 132 4 192 41 51 31 57 49 59Fluvanna County, VA 181........................................ D 11 2 027 19 494 34 D 41 54 84 73Franklin County, VA 140......................................... 8 607 19 D a D 45 67 90 D D D
Gloucester County, VA 173...................................... 12 149 17 8 649 89 953 34 35 28 49 28 27Halifax County, VA * 376........................................ 14 244 30 2 115 55 404 19 40 61 41 45 40Hanover County, VA 317........................................ 24 763 53 17 788 237 5 156 29 26 39 35 43 51Henrico County, VA 1 348......................................... 140 830 162 118 100 1 135 22 710 14 11 15 13 21 18Henry County, VA 182........................................... 8 590 20 4 485 124 775 35 25 59 41 19 20
King George County, VA 143..................................... 18 501 35 15 516 370 3 337 43 22 85 26 65 20Loudoun County, VA 556........................................ 32 769 48 12 075 189 5 519 29 43 48 25 47 19Louisa County, VA 175.......................................... 6 825 11 5 819 61 1 291 39 33 35 39 37 41Mecklenburg County, VA 223.................................... 3 667 15 1 298 17 302 39 29 37 35 18 36Northampton County, VA 204.................................... 4 277 33 3 082 21 579 32 36 55 53 57 64
Nottoway County, VA 238........................................ 7 563 44 1 582 265 931 30 43 55 36 80 43Pittsylvania County, VA 316...................................... D 40 D c D 27 D 44 D D DPrince William County, VA 989................................... 51 832 87 38 057 812 14 554 15 29 42 39 37 36Richmond County, VA 123....................................... 1 873 12 913 19 295 46 35 38 54 46 60Spotsylvania County, VA 212..................................... D 25 2 774 33 593 30 D 34 31 56 30
Stafford County, VA 486......................................... 12 310 7 2 937 91 853 24 39 46 14 7 6Sussex County, VA 113......................................... 4 577 77 3 925 148 1 018 46 37 70 46 47 47Westmoreland County, VA 111................................... 7 700 30 5 580 81 2 068 22 55 62 76 49 81York County, VA 288............................................ 10 987 34 8 030 297 3 861 21 11 34 8 16 3Alexandria, VA (IC) 1 266......................................... 424 235 135 405 236 4 785 145 100 14 37 28 39 26 21
Charlottesville, VA (IC) 591...................................... 21 559 89 14 784 356 5 548 25 29 42 38 41 39Chesapeake, VA (IC) 1 093........................................ 170 541 131 158 536 1 682 29 118 14 29 28 31 46 27Danville, VA (IC) 404............................................ 17 620 21 D c D 25 37 55 D D DFairfax, VA (IC) 186............................................. 18 853 75 15 528 101 5 511 44 30 69 32 15 22Fredericksburg, VA (IC) 219..................................... 30 717 64 23 483 125 2 243 37 66 82 88 80 78
Hampton, VA (IC) 1 659........................................... 96 407 294 82 302 1 181 18 983 11 15 15 17 18 18Lynchburg, VA (IC) 486......................................... 123 283 28 D f D 21 76 27 D D DManassas, VA (IC) 215.......................................... 46 267 32 38 452 939 15 258 29 25 35 23 56 28Martinsville, VA (IC) 395......................................... 9 579 44 5 121 77 1 969 30 24 51 33 44 38Newport News, VA (IC) 1 397...................................... 78 931 226 64 309 3 531 35 172 12 32 47 40 72 48
Norfolk, VA (IC) 1 664............................................ 115 133 256 89 855 2 021 22 101 17 22 41 26 51 28Petersburg, VA (IC) 662......................................... 90 970 109 85 936 592 11 425 20 10 32 10 31 32Portsmouth, VA (IC) 842......................................... 51 296 126 42 650 1 104 15 290 19 8 42 8 24 8Richmond, VA (IC) 2 435.......................................... 210 662 567 175 160 3 156 48 637 6 8 16 11 15 14Roanoke, VA (IC) 597........................................... 50 946 66 D h D 20 79 51 D D DSuffolk, VA (IC) 725............................................. 40 345 206 31 480 376 6 099 20 28 41 35 37 37Virginia Beach, VA (IC) 2 290...................................... 143 848 464 121 689 3 914 43 678 12 20 15 22 45 37
Clark County, WA 140........................................... 10 776 70 10 175 281 3 065 23 39 42 43 54 45King County, WA 3 231........................................... 303 592 534 242 840 4 994 75 212 6 12 8 14 41 30Kitsap County, WA 164.......................................... 3 145 1 D a D 27 31 – D D DPierce County, WA 1 134.......................................... 61 883 132 46 434 1 234 14 955 14 17 25 23 31 15Snohomish County, WA 195..................................... D 26 23 704 953 12 241 18 D 32 29 60 38
Spokane County, WA 175....................................... 48 113 47 45 671 456 10 952 31 8 55 7 55 8Thurston County, WA 162....................................... 17 175 12 14 159 89 2 190 26 10 46 9 30 21Whatcom County, WA 109....................................... 3 950 2 D a D 41 6 – D D D
West Virginia 1 148.................................... 87 649 129 76 923 1 018 14 203 3 7 14 8 28 23
Kanawha County, WV 350....................................... D 45 D e D 14 D 25 D D DRaleigh County, WV 121......................................... 1 294 7 571 5 49 25 20 47 50 43 44
Dane County, WI 287........................................... 42 133 52 38 241 476 13 287 15 32 20 36 31 48Milwaukee County, WI 3 613....................................... 329 545 522 258 559 5 694 84 005 5 10 16 12 15 16Racine County, WI 271.......................................... 79 531 90 78 076 460 5 504 17 6 58 6 33 18Rock County, WI 177........................................... 3 033 23 1 421 35 369 37 35 63 62 92 61Waukesha County, WI 160....................................... 39 121 37 D e D 19 10 29 D D D
Wyoming 232........................................ 12 670 64 D c D 32 44 84 D D D
1All firms data include both firms with paid employees and firms with no paid employees.2For explanation of relative standard errors, see Reliability of Estimates in the introductory text.
MINORITY~OWNED BUSINESS ENTERPRISES BLACK 63U.S. Census Bureau, 1997 Economic Census Mar. 15, 2001
Table 6. Statistics for Selected Places With 100 or More Black~Owned Firms: 1997[Detail may not add to total because of rounding. For meaning of abbreviations and symbols, see introductory text. For explanation of terms, see Appendix A. For information on geographic areasfollowed by *, see Appendix C]
Geographic area
All firms1 Firms with paid employeesRelative standard error of
Anniston, AL 346............................................... 16 170 34 D c D 42 26 25 D D DBessemer, AL 203.............................................. 8 562 27 6 130 75 978 30 12 23 12 34 24Birmingham, AL * 3 477........................................... 157 951 463 118 253 2 715 50 950 8 7 15 8 11 9Dothan, AL * 216............................................... 4 854 26 D c D 17 23 24 D D DFairfield, AL 257................................................ 5 451 16 1 477 49 567 32 22 43 56 44 59
Florence, AL 104............................................... D 11 D c D 14 D 58 D D DGadsden, AL 129............................................... 2 724 14 D c D 13 10 42 D D DGreenville, AL 132.............................................. 1 392 – – – – 48 39 – – – –Huntsville, AL * 1 121............................................. 175 346 133 161 702 1 888 56 500 12 4 13 5 7 6Irondale, AL 125................................................ 3 497 6 D b D 36 64 72 D D D
Madison, AL * 105.............................................. 4 475 14 3 628 104 1 114 45 23 36 30 35 41Mobile, AL 1 828................................................. 64 931 174 36 088 1 014 11 852 12 9 20 8 11 8Montgomery, AL 1 770............................................ 115 353 263 82 623 1 222 23 881 12 8 13 14 15 17Northport, AL 134............................................... 4 916 5 D a D 49 80 89 D D DOpelika, AL 205................................................ 6 041 28 D c D 29 14 50 D D D
Phenix City, AL * 233............................................ 5 344 13 D b D 27 33 42 D D DPrichard, AL 442................................................ 20 636 48 11 755 170 2 394 19 24 32 16 21 31Selma, AL 104................................................. 5 197 21 4 231 68 1 135 15 27 36 32 36 49Troy, AL 121................................................... 993 – – – – 39 35 – – – –Tuscaloosa, AL 596............................................. 14 200 53 D e D 20 23 30 D D DTuskegee, AL 270.............................................. 32 992 43 D e D 30 33 24 D D D
Blytheville, AR 117.............................................. 3 181 7 D a D 38 28 45 D D DConway, AR 146............................................... 17 140 14 D b D 28 4 62 D D DForrest City, AR 185............................................ 7 794 16 D c D 22 49 31 D D DLittle Rock, AR 1 783............................................. 118 573 259 78 536 943 15 871 9 6 16 5 14 10North Little Rock, AR 430........................................ 29 000 43 D e D 22 50 21 D D D
Pine Bluff, AR 521.............................................. 35 917 72 27 338 267 3 447 11 4 15 6 10 7Texarkana, AR 106............................................. D 10 D b D 15 D 69 D D DWest Memphis, AR 288......................................... 5 690 55 2 777 20 1 195 31 30 92 62 – 72
Anaheim, CA 530............................................... 35 540 104 29 936 364 6 256 27 50 49 58 58 62Berkeley, CA 574............................................... 32 418 18 21 230 259 6 673 47 25 40 20 19 38Beverly Hills, CA 274............................................ 18 954 3 D b D 26 7 – D D DCampbell, CA 139.............................................. 2 129 – – – – 41 43 – – – –Carson, CA 1 104................................................ 98 281 87 17 336 212 6 145 40 70 86 66 40 81
Cerritos, CA 222................................................ 4 783 10 D b D 46 54 83 D D DCompton, CA 654............................................... 85 004 31 69 489 439 8 069 49 14 48 9 31 13Corona, CA 884................................................ 106 947 207 78 453 1 247 29 631 31 35 64 50 85 65Culver City, CA 307............................................. 33 599 15 25 125 213 5 434 38 17 48 16 49 35Fairfield, CA 242................................................ 24 875 8 D b D 45 20 68 D D D
Fontana, CA 1 728............................................... D 467 D e D 35 D 98 D D DFremont, CA 409............................................... 13 290 11 2 449 14 641 30 25 76 47 – 4Fresno, CA 1 413................................................ D 166 D c D 35 D 88 D D DGardena, CA 510............................................... 94 990 113 D f D 32 61 86 D D DGlendale, CA 112............................................... 7 790 – – – – 29 58 – – – –
Hawthorne, CA 823............................................. 21 336 56 11 546 112 1 442 24 35 74 71 74 79Inglewood, CA 1 717.............................................. 75 190 151 26 568 469 7 205 23 34 58 45 61 57La Mesa, CA 230............................................... 2 658 – – – – 46 52 – – – –Lancaster, CA 463.............................................. 2 382 1 D a D 39 36 – D D DLong Beach, CA 1 619............................................ 663 054 278 D f D 43 6 50 D D D
Los Angeles, CA 17 593............................................ 884 268 1 418 538 139 4 546 158 306 11 10 21 8 20 8Lynwood, CA 1 609............................................... 49 916 1 D a D 36 78 – D D DMontclair, CA 157............................................... 545 – – – – 42 42 – – – –Oakland, CA 4 714............................................... 317 227 353 179 285 4 438 50 023 19 31 37 53 63 42Oceanside, CA 143............................................. 10 291 2 D e D 36 17 – D D D
Ontario, CA 326................................................ 10 362 6 3 540 57 711 45 43 36 34 14 29Oxnard, CA 178................................................ 7 765 2 D b D 38 41 – D D DPalmdale, CA 307.............................................. 3 365 1 D a D 36 40 – D D DPasadena, CA 792.............................................. 25 429 17 7 715 31 2 886 29 24 51 18 29 2Pomona, CA 550............................................... 32 083 4 17 820 258 4 824 35 23 – – – –
Rancho Cucamonga, CA 327.................................... 9 345 26 1 674 92 447 27 49 78 57 67 28Rialto, CA 490.................................................. 9 757 51 4 000 332 1 389 23 22 95 43 15 28Riverside, CA 908.............................................. 6 810 46 3 281 54 1 516 48 30 79 60 62 54Sacramento, CA 1 200............................................ 94 053 92 48 944 2 056 22 040 34 42 61 60 86 66San Bernardino, CA 295......................................... 17 729 59 D e D 47 73 95 D D D
San Diego, CA 2 270............................................. 76 294 23 44 312 810 18 404 28 19 32 27 26 27San Francisco, CA 3 484.......................................... 671 650 503 628 747 3 561 102 577 27 49 38 51 56 42San Jose, CA 824.............................................. 48 439 30 12 268 106 3 505 39 44 36 29 23 36San Pablo, CA 355............................................. 8 144 3 1 372 13 230 36 58 – – – –Santa Clarita, CA 357........................................... 39 144 174 D e D 31 52 48 D D D
See footnotes at end of table.
64 BLACK MINORITY~OWNED BUSINESS ENTERPRISESU.S. Census Bureau, 1997 Economic Census Mar. 15, 2001
Table 6. Statistics for Selected Places With 100 or More Black~Owned Firms: 1997mCon.[Detail may not add to total because of rounding. For meaning of abbreviations and symbols, see introductory text. For explanation of terms, see Appendix A. For information on geographic areasfollowed by *, see Appendix C]
Geographic area
All firms1 Firms with paid employeesRelative standard error of
estimate (percent)2
for columnmFirms(number)
Sales andreceipts($1,000)
Firms(number)
Sales andreceipts($1,000)
Employees(number)
Annualpayroll
($1,000)
A B C D E F A B C D E F
CaliforniamCon.
Tustin, CA 167................................................. 5 602 5 D a D 32 35 88 D D DUpland, CA 105................................................ D 8 D a D 37 D 92 D D DVallejo, CA 588................................................. 14 800 91 4 412 104 1 047 39 42 90 53 78 63Victorville, CA 265.............................................. 3 616 – – – – 46 51 – – – –
Belle Glade, FL 157............................................. 6 563 3 382 11 113 39 46 – – – –Boynton Beach, FL 384.......................................... 15 584 1 D e D 34 25 – D D DBradenton, FL 188.............................................. 3 922 1 D b D 40 20 – D D DClearwater, FL 174............................................. 10 536 39 8 078 268 2 970 24 37 47 52 61 56Coral Springs, FL 580........................................... 10 788 8 D b D 40 50 80 D D D
Fort Lauderdale, FL 1 283......................................... 42 603 97 23 633 509 8 632 20 13 34 16 44 13Fort Myers, FL 164............................................. D 1 D b D 26 D – D D DFort Walton Beach, FL 194...................................... D 25 D c D 33 D 56 D D DGainesville, FL 366............................................. 18 508 109 14 724 256 1 835 34 50 63 55 56 37Hialeah, FL 600................................................ 29 106 13 D b D 49 79 60 D D D
Lauderdale Lakes, FL 644....................................... 11 738 1 D b D 22 21 – D D DLauderhill, FL 1 490.............................................. 77 325 149 62 635 1 129 14 912 21 72 83 91 89 86Margate, FL 324................................................ 16 533 34 D c D 37 60 94 D D DMiami, FL 2 954.................................................. 194 620 468 156 457 2 718 45 129 13 27 29 33 57 34Miami Beach, FL 242............................................ 7 881 8 D a D 25 33 94 D D D
Miami Shores, FL 247........................................... 12 171 30 3 704 68 1 709 30 41 61 64 62 90Miramar, FL 1 173................................................ 18 285 21 3 035 51 990 23 20 66 44 55 55North Lauderdale, FL 573........................................ 13 594 15 D a D 29 37 73 D D DNorth Miami, FL 1 076............................................ 31 948 15 D b D 19 41 69 D D DNorth Miami Beach, FL 1 224...................................... 35 182 2 D c D 27 25 – D D D
Opa~locka, FL 551.............................................. 25 058 62 16 310 152 2 188 28 50 74 76 60 61Orlando, FL 1 593................................................ 242 477 210 194 348 1 517 35 068 16 25 31 32 25 44Palm Bay, FL 127............................................... 3 986 6 D a D 18 20 74 D D DPanama City, FL 103............................................ D 4 D b D 45 D – D D DPembroke Pines, FL 781........................................ 36 325 126 24 652 565 4 955 49 45 79 54 68 52
St. Petersburg, FL 1 160.......................................... 42 047 63 26 095 523 11 699 21 27 44 47 47 59Sunrise, FL 1 247................................................ D 327 D c D 33 D 90 D D DTallahassee, FL 1 009............................................ 36 735 156 D e D 28 11 49 D D DTamarac, FL 119............................................... 2 729 – – – – 49 64 – – – –Tampa, FL 1 747................................................. 160 444 110 142 207 857 34 444 28 8 29 8 22 14
See footnotes at end of table.
MINORITY~OWNED BUSINESS ENTERPRISES BLACK 65U.S. Census Bureau, 1997 Economic Census Mar. 15, 2001
Table 6. Statistics for Selected Places With 100 or More Black~Owned Firms: 1997mCon.[Detail may not add to total because of rounding. For meaning of abbreviations and symbols, see introductory text. For explanation of terms, see Appendix A. For information on geographic areasfollowed by *, see Appendix C]
Geographic area
All firms1 Firms with paid employeesRelative standard error of
Albany, GA 741................................................ 67 373 207 D g D 15 33 28 D D DAlpharetta, GA 248............................................. D – – – – 36 D – – – –Americus, GA 170.............................................. 12 384 43 D c D 35 85 93 D D DAthens~Clarke County, GA * 412.................................. 67 679 92 59 532 605 8 667 16 15 44 18 49 26Atlanta, GA * 7 853............................................... 1 012 038 982 D j D 5 9 10 D D D
Augusta~Richmond County (balance), GA * 2 125.................... 160 830 205 133 821 2 164 43 739 8 19 18 25 25 30Austell, GA * 243............................................... 5 988 4 D b D 37 43 86 D D DBainbridge, GA 164............................................. 2 618 8 1 200 33 284 47 35 48 42 36 36Brunswick, GA 276............................................. 8 174 83 D c D 31 27 81 D D DCollege Park, GA * 739.......................................... 40 238 57 25 004 435 5 162 18 22 36 27 61 33
Columbus city, GA * 1 583......................................... 150 810 192 124 071 1 413 46 654 10 39 27 45 18 55Conyers, GA 310............................................... 6 048 9 D b D 24 20 58 D D DCovington, GA 288.............................................. 13 435 18 D b D 32 63 59 D D DDecatur, GA 569............................................... 14 450 58 7 491 91 1 815 18 34 61 58 39 27Douglas, GA 178............................................... D 1 D a D 42 D – D D D
Douglasville, GA 129............................................ 5 612 4 D b D 30 49 85 D D DDublin, GA 338................................................. 5 695 12 D c D 37 34 43 D D DDuluth, GA 249................................................. 6 476 28 3 725 42 2 642 31 40 80 69 60 87Eastman, GA 114............................................... D 2 D a D 45 D – D D DEast Point, GA 716............................................. 45 039 98 34 355 1 086 13 427 18 17 30 26 41 35
Greensboro, GA 126............................................ 6 059 13 D c D 47 80 94 D D DHinesville, GA 213.............................................. 5 386 18 D b D 23 44 79 D D DKennesaw, GA 186............................................. 45 355 4 D c D 45 2 60 D D DLaGrange, GA * 254............................................ 4 444 8 1 643 30 465 32 35 49 50 67 69Lawrenceville, GA 308.......................................... 32 765 35 28 413 220 7 968 27 42 67 49 58 61
McDonough, GA 141............................................ 45 078 5 D b D 45 3 69 D D DMacon, GA * 1 489............................................... 70 294 207 40 404 708 11 162 13 19 29 25 27 27Marietta, GA 312............................................... 25 453 50 21 072 563 6 867 26 65 61 76 81 86Milledgeville, GA 133............................................ 18 513 41 17 865 626 6 014 31 71 73 73 81 67Montezuma, GA 227............................................ 16 124 54 3 804 126 955 32 63 71 22 44 34
Newnan, GA 172............................................... 47 355 39 D f D 38 82 57 D D DNorcross, GA 239.............................................. 27 337 15 25 508 61 1 387 37 67 39 71 64 46Powder Springs, GA 252........................................ 5 045 13 D a D 37 26 54 D D DRiverdale, GA 464.............................................. 16 611 46 12 160 206 3 384 31 47 48 62 52 55Roswell, GA 137................................................ 6 690 12 4 795 61 1 478 36 31 49 41 58 48
Savannah, GA 1 550.............................................. 74 560 282 55 561 714 13 878 8 15 17 21 24 23Smyrna, GA 310................................................ 21 304 25 17 666 113 5 528 31 53 51 63 55 60Statesboro, GA 184............................................. 8 960 28 D c D 26 54 47 D D DStone Mountain, GA 464........................................ 25 083 10 D b D 28 42 55 D D DSylvester, GA 114.............................................. 729 2 D a D 47 17 – D D D
Thomasville, GA 347............................................ 15 643 49 12 517 325 2 791 32 42 59 55 64 51Valdosta, GA 247............................................... 19 548 77 17 422 313 6 049 22 43 43 50 51 61Vidalia, GA * 122............................................... D 25 3 837 69 1 238 44 D 46 65 54 77Warner Robins, GA 531......................................... 23 276 82 13 453 367 2 218 25 32 80 57 64 35Washington, GA 140............................................ 6 052 10 D b D 41 60 64 D D DWaycross, GA * 128............................................ D 1 D a D 40 D – D D D
Alton, IL 137................................................... 3 158 11 2 287 85 606 40 18 55 23 27 20Aurora, IL * 333................................................ 6 854 5 D b D 18 13 53 D D DBellwood, IL 402................................................ 8 303 11 D b D 28 42 95 D D DBloomington, IL 111............................................. D 19 7 517 309 2 845 40 D 58 68 85 78Blue Island, IL 103.............................................. 792 2 D a D 49 54 – D D D
Bolingbrook, IL * 415............................................ 11 224 1 D a D 30 61 – D D DBroadview, IL 313.............................................. 20 934 85 18 031 218 6 303 29 55 60 62 64 60Calumet City, IL 454............................................ 26 176 97 14 420 192 4 202 31 59 73 63 52 56Carbondale, IL 175............................................. 1 642 3 D a D 48 49 53 D D DCentreville, IL 146.............................................. 2 379 3 D a D 38 51 80 D D D
Champaign, IL 407.............................................. 6 097 16 3 029 51 637 27 14 47 11 18 16Chicago, IL * 23 576............................................... 2 452 633 2 186 2 071 103 24 815 570 686 4 11 6 13 24 13Chicago Heights, IL 300......................................... 29 649 41 D b D 27 90 91 D D DCountry Club Hills, IL 615........................................ 11 447 10 433 6 155 26 30 52 49 57 61Decatur, IL 502................................................. D 7 D a D 21 D 76 D D D
Dolton, IL 327.................................................. 9 149 19 4 268 88 677 21 19 46 6 7 1East St. Louis, IL 451........................................... 15 576 57 10 835 193 1 608 22 36 59 52 41 53Elgin, IL * 126.................................................. 29 162 43 28 294 58 2 473 26 6 62 7 47 15Evanston, IL 742............................................... 52 192 95 43 275 777 12 574 27 23 60 28 29 19Flossmoor, IL 139.............................................. 4 954 8 D a D 44 37 91 D D D
Forest Park, IL 174............................................. 3 054 1 D a D 41 31 – D D DGlenwood, IL 178............................................... 1 511 10 D a D 38 39 93 D D DHarvey, IL 611................................................. 23 022 37 15 737 175 2 885 23 45 65 67 51 49Hazel Crest, IL 418............................................. 21 753 40 9 243 48 1 597 17 34 94 70 78 83Joliet, IL * 313.................................................. 11 026 43 9 023 163 2 063 24 57 77 69 81 64
See footnotes at end of table.
66 BLACK MINORITY~OWNED BUSINESS ENTERPRISESU.S. Census Bureau, 1997 Economic Census Mar. 15, 2001
Table 6. Statistics for Selected Places With 100 or More Black~Owned Firms: 1997mCon.[Detail may not add to total because of rounding. For meaning of abbreviations and symbols, see introductory text. For explanation of terms, see Appendix A. For information on geographic areasfollowed by *, see Appendix C]
Geographic area
All firms1 Firms with paid employeesRelative standard error of
estimate (percent)2
for columnmFirms(number)
Sales andreceipts($1,000)
Firms(number)
Sales andreceipts($1,000)
Employees(number)
Annualpayroll
($1,000)
A B C D E F A B C D E F
IllinoismCon.
Lynwood, IL 108................................................ 1 145 – – – – 35 47 – – – –Markham, IL 203............................................... 6 982 20 5 455 139 1 371 25 53 69 70 79 65Matteson, IL * 181.............................................. 4 396 14 D b D 30 39 88 D D DMaywood, IL 375............................................... 8 536 13 1 605 30 319 20 24 74 6 33 9North Chicago, IL 149........................................... 10 867 14 10 154 239 4 869 40 13 48 15 7 7
Oak Park, IL 353............................................... 14 187 39 5 861 150 1 476 34 23 44 36 42 44Park Forest, IL * 184............................................ 2 015 – – – – 30 36 – – – –Peoria, IL 600.................................................. D 79 10 733 221 1 610 19 D 56 39 61 22Rantoul, IL 176................................................. D – – – – 30 D – – – –Richton Park, IL 105............................................ 1 038 4 D b D 39 47 85 D D D
Riverdale, IL 199............................................... 10 067 6 D c D 34 45 72 D D DRockford, IL 426................................................ 22 638 29 16 987 122 2 779 18 24 56 31 29 14Rock Island, IL 157............................................. 31 435 49 D c D 39 63 93 D D DSchaumburg, IL * 148........................................... 21 462 57 21 140 486 10 381 45 82 92 83 86 84Skokie, IL 117.................................................. 13 011 16 11 678 213 5 321 43 11 41 13 13 10
South Holland, IL 320........................................... 12 049 16 4 490 83 1 830 29 43 62 78 80 80Springfield, IL 259.............................................. D 28 D c D 39 D 32 D D DWaukegan, IL 439.............................................. 19 531 54 12 438 329 4 574 25 38 71 45 80 59
Anderson, IN 150............................................... D 11 D c D 37 D 37 D D DEast Chicago, IN 134............................................ 7 205 20 2 833 53 617 23 31 26 28 34 35Evansville, IN 204.............................................. D 12 D c D 14 D 33 D D DFort Wayne, IN 520............................................. 43 862 74 38 016 1 061 15 029 21 17 28 19 9 7Gary, IN 1 961................................................... 166 839 330 141 417 2 636 40 315 10 14 19 14 37 22
Hammond, IN 134.............................................. 5 735 3 D b D 16 30 55 D D DIndianapolis city (balance), IN * 4 910............................... 495 309 675 430 977 4 732 85 890 5 15 18 17 24 20Kokomo, IN 151................................................ 24 775 13 D b D 34 29 44 D D DLawrence, IN * 150............................................. D 9 D c D 37 D 44 D D DMerrillville, IN 127............................................... 5 255 27 3 720 126 2 310 40 42 53 59 64 71Michigan City, IN 254........................................... D 12 D a D 30 D 56 D D DSouth Bend, IN 735............................................. D 50 D e D 28 D 29 D D D
Cedar Rapids, IA 140........................................... 11 843 30 D c D 28 13 73 D D DDavenport, IA 223.............................................. 22 203 69 D e D 35 17 78 D D DDes Moines, IA 365............................................. 52 271 67 48 748 424 12 843 10 40 28 43 33 48Waterloo, IA 171............................................... 12 357 14 D c D 19 11 37 D D D
Junction City, KS 118........................................... 10 431 22 9 312 107 5 688 29 73 66 81 58 90Kansas City, KS 779............................................ D 76 D f D 10 D 18 D D DLawrence, KS 102.............................................. 3 778 34 D b D 29 35 77 D D DLeavenworth, KS 123........................................... D 8 D b D 47 D 39 D D DOverland Park, KS 127.......................................... 17 405 17 13 958 413 8 402 21 50 44 62 77 69Topeka, KS 478................................................ 118 812 111 D f D 18 87 50 D D DWichita, KS 898................................................ 78 052 140 D g D 12 14 19 D D D
Hopkinsville, KY 127............................................ 3 793 2 D a D 15 31 – D D DLexington~Fayette, KY 515....................................... 23 159 57 D c D 11 10 17 D D DLouisville, KY 1 397............................................... 169 163 290 151 671 3 828 52 995 10 12 16 14 20 13Owensboro, KY 205............................................. D 4 D b D 36 D 65 D D DPaducah, KY 171............................................... D 4 779 9 169 35 D – – – –
Alexandria, LA 376.............................................. 17 458 44 D c D 24 41 44 D D DBaker, LA 132.................................................. 6 214 38 D e D 19 35 46 D D DBastrop, LA 136................................................ 13 408 2 D a D 16 77 75 D D DBaton Rouge, LA 2 480........................................... 180 323 281 122 333 1 837 34 402 8 10 10 13 37 24Bossier City, LA 358............................................ 10 725 11 7 390 130 2 363 30 41 45 56 73 79
Breaux Bridge, LA 212.......................................... 59 754 29 D c D 37 65 58 D D DCarencro, LA 119............................................... 2 248 36 D b D 25 37 62 D D DGonzales, LA 115............................................... 5 486 21 3 972 27 1 785 46 50 67 72 43 84Grambling, LA 215.............................................. 2 133 – – – – 32 61 – – – –Gretna, LA 196................................................. 14 350 32 D c D 35 36 55 D D D
Hammond, LA 195.............................................. 12 194 16 4 980 194 1 424 43 23 46 13 11 6Houma, LA 104................................................. 11 002 39 9 735 247 3 933 18 58 39 67 71 82Kenner, LA 463................................................. 33 019 33 26 165 466 9 279 22 52 38 63 47 65Lafayette, LA 615............................................... 53 380 148 45 534 1 008 16 227 12 31 21 37 26 40Lake Charles, LA 708........................................... 69 080 93 D g D 14 38 26 D D D
Monroe, LA 442................................................ 32 790 83 25 850 301 7 573 22 28 19 33 43 49Natchitoches, LA 122........................................... 15 431 21 D c D 21 34 33 D D DNew Iberia, LA 224............................................. 6 274 10 D b D 10 14 45 D D DNew Orleans, LA 6 425........................................... 644 365 906 521 779 10 348 200 378 5 18 13 22 30 32Opelousas, LA 166............................................. 13 646 24 11 414 172 2 291 20 47 35 57 61 59
Ruston, LA 251................................................. 27 747 72 D e D 32 78 80 D D DSt. Martinville, LA 112........................................... D 12 945 59 252 17 D 60 42 51 44Shreveport, LA * 1 754............................................ 87 891 171 57 613 886 10 764 16 12 36 17 32 23Slidell, LA 216.................................................. D 6 D b D 35 D 40 D D D
MINORITY~OWNED BUSINESS ENTERPRISES BLACK 67U.S. Census Bureau, 1997 Economic Census Mar. 15, 2001
Table 6. Statistics for Selected Places With 100 or More Black~Owned Firms: 1997mCon.[Detail may not add to total because of rounding. For meaning of abbreviations and symbols, see introductory text. For explanation of terms, see Appendix A. For information on geographic areasfollowed by *, see Appendix C]
Geographic area
All firms1 Firms with paid employeesRelative standard error of
Aberdeen, MD 196.............................................. 12 342 6 D c D 34 36 54 D D DAnnapolis, MD 546.............................................. 38 117 58 30 144 410 12 207 25 12 43 14 34 13Baltimore, MD (IC) 7 255.......................................... 731 236 914 601 235 8 191 121 889 7 13 9 16 9 10Berwyn Heights, MD 160........................................ 2 177 1 D a D 42 42 – D D DBowie, MD 542................................................. 13 907 57 6 854 77 1 380 27 32 43 49 42 58
Brentwood, MD 163............................................. 6 241 4 D b D 43 45 62 D D DCheverly, MD 207.............................................. 2 524 1 D a D 33 38 – D D DCollege Park, MD 156........................................... 3 007 19 1 697 84 954 34 35 88 66 86 72District Heights, MD 272......................................... 4 362 35 D b D 34 36 97 D D DFrederick, MD 204.............................................. 5 033 30 D b D 39 12 64 D D D
Gaithersburg, MD 367........................................... 56 691 50 D f D 21 64 47 D D DGlenarden, MD 153............................................. 16 517 5 D b D 14 5 49 D D DGreenbelt, MD 559............................................. 114 440 42 110 261 443 25 729 27 7 73 7 18 16Hyattsville, MD 218............................................. 15 219 5 12 364 84 2 498 31 43 50 53 39 34Laurel, MD 329................................................. 21 608 10 15 947 48 1 119 45 10 34 2 – 9
Mount Rainier, MD 127.......................................... 11 080 56 10 018 196 2 758 38 74 86 83 74 64New Carrollton, MD 156......................................... 6 842 15 4 311 54 403 33 31 33 42 63 44Pocomoke City, MD 167......................................... D 3 D a D 37 D 81 D D DRockville, MD 194.............................................. 131 124 42 128 582 1 270 48 897 47 19 61 19 18 10Salisbury, MD 270.............................................. 13 076 59 7 043 146 1 112 35 43 39 32 19 24Takoma Park, MD * 404......................................... 18 732 31 15 163 505 11 018 31 13 63 12 4 6
Amherst town, MA 130.......................................... 1 895 – – – – 49 10 – – – –Ashland town, MA 109.......................................... 2 539 4 D a D 43 48 84 D D DBarnstable, MA 180............................................. 4 934 7 D b D 36 21 46 D D DBoston, MA 4 239................................................ 304 540 474 D h D 6 9 15 D D DBrockton, MA 536.............................................. 10 715 43 5 878 241 1 978 22 23 42 47 59 52
Cambridge, MA 483............................................. 36 667 107 30 460 252 10 445 18 32 52 39 29 39Lawrence, MA 289.............................................. 10 199 47 D b D 23 31 52 D D DLowell, MA 204................................................. D – – – – 37 D – – – –Lynn, MA 231.................................................. 4 651 5 1 481 16 779 24 26 54 60 74 77Milton town, MA 152............................................ 1 793 4 D a D 41 18 85 D D D
New Bedford, MA 177........................................... D 27 9 817 106 920 34 D 35 28 55 16Randolph town, MA 471......................................... 17 110 27 D f D 22 45 72 D D DSharon town, MA 142........................................... 10 189 10 D a D 37 37 82 D D DSomerville, MA 151............................................. 3 549 – – – – 24 29 – – – –Springfield, MA 832............................................. 81 993 48 70 325 527 16 498 15 51 32 60 57 67Wareham town, MA 126......................................... 10 616 21 D b D 37 53 60 D D DWorcester, MA 229............................................. D 32 D a D 13 D 50 D D D
Ann Arbor, MI 388.............................................. 20 663 9 13 596 513 8 259 24 14 38 8 4 6Battle Creek, MI 210............................................ D 32 D c D 35 D 73 D D DBenton township, MI 169........................................ 29 656 4 D e D 35 41 56 D D DDelta township, MI 108.......................................... D – – – – 48 D – – – –Detroit, MI 11 282................................................. 1 358 703 1 273 1 146 057 12 114 243 089 5 15 8 16 13 13
East Lansing, MI 156............................................ 6 148 2 D b D 44 39 – D D DFarmington Hills, MI 190......................................... 8 892 12 5 122 149 1 401 40 13 60 17 10 23Flint, MI 1 184................................................... 45 448 138 37 681 711 15 068 12 23 35 29 24 31Flint township, MI 163........................................... D 1 D a D 19 D – D D DGrand Rapids, MI 772........................................... 40 761 83 32 983 550 12 482 20 20 25 24 27 41
Highland Park, MI 272........................................... 69 182 28 D g D 30 75 49 D D DInkster, MI 185................................................. 7 586 13 4 689 117 1 343 15 24 39 40 51 49Kalamazoo, MI 273............................................. 12 532 26 5 387 88 1 595 19 32 59 61 70 83Lansing, MI * 424............................................... 107 030 54 98 007 948 22 522 26 40 33 44 43 55Oak Park, MI 510............................................... 125 331 32 113 008 440 10 504 23 8 43 6 22 13
Pontiac, MI 463................................................ 37 500 88 34 126 677 7 619 30 51 75 56 73 60Redford township, MI 105........................................ 33 127 23 31 573 307 10 274 29 14 48 16 18 30Romulus, MI 163............................................... 15 786 9 D c D 32 73 77 D D DSaginaw, MI 451................................................ D 51 D c D 25 D 51 D D DSouthfield, MI 2 133.............................................. 252 150 274 207 085 2 178 49 518 16 6 25 7 22 16
Van Buren township, MI 139..................................... 9 556 3 D b D 44 67 82 D D DWest Bloomfield township, MI 158................................ 4 243 – – – – 25 40 – – – –Ypsilanti, MI 204................................................ 37 344 29 34 253 332 9 188 45 18 68 19 43 40Ypsilanti township, MI 474....................................... 19 258 33 7 791 91 1 373 16 45 64 70 25 65
Brandon, MS 237............................................... 7 129 20 D b D 43 42 80 D D DBrookhaven, MS 110............................................ 848 4 D a D 47 21 87 D D DCanton, MS 237................................................ 16 845 32 11 171 184 1 967 39 20 17 19 10 16Carthage, MS 114.............................................. 3 354 16 D b D 35 39 97 D D DClarksdale, MS 182............................................. 10 590 88 8 737 242 2 524 32 20 53 22 20 14
Cleveland, MS 269.............................................. 5 174 50 D b D 31 23 46 D D DClinton, MS 167................................................ D 4 D b D 44 D 84 D D DColumbus, MS 385............................................. 9 913 23 3 017 52 581 23 34 31 35 23 22Greenville, MS 540............................................. 23 239 107 15 637 281 2 825 16 15 27 19 26 14Greenwood, MS 103............................................ 7 239 55 D c D 26 29 43 D D D
See footnotes at end of table.
68 BLACK MINORITY~OWNED BUSINESS ENTERPRISESU.S. Census Bureau, 1997 Economic Census Mar. 15, 2001
Table 6. Statistics for Selected Places With 100 or More Black~Owned Firms: 1997mCon.[Detail may not add to total because of rounding. For meaning of abbreviations and symbols, see introductory text. For explanation of terms, see Appendix A. For information on geographic areasfollowed by *, see Appendix C]
Geographic area
All firms1 Firms with paid employeesRelative standard error of
estimate (percent)2
for columnmFirms(number)
Sales andreceipts($1,000)
Firms(number)
Sales andreceipts($1,000)
Employees(number)
Annualpayroll
($1,000)
A B C D E F A B C D E F
MississippimCon.
Grenada, MS 202............................................... D 3 D a D 38 D 79 D D DGulfport, MS 476............................................... 21 268 31 11 363 194 2 099 18 20 25 16 22 19Hattiesburg, MS * 178........................................... 6 308 14 3 621 56 709 24 22 22 37 17 25Hernando, MS 118.............................................. 8 070 68 7 727 399 2 086 45 58 84 62 59 58Holly Springs, MS 193........................................... 11 308 24 8 927 162 3 524 29 37 40 47 52 67
Moss Point, MS 229............................................ 8 173 14 6 703 89 1 191 35 50 27 61 58 60Natchez, MS 144............................................... 5 021 11 D b D 23 22 35 D D DOxford, MS 102................................................ 2 004 4 D b D 42 15 – D D DPearl, MS 177.................................................. 4 378 3 D a D 32 33 79 D D DPhiladelphia, MS 131............................................ D 6 D a D 49 D 54 D D D
Starkville, MS 155.............................................. 3 326 11 D b D 25 13 23 D D DTupelo, MS 167................................................ 36 693 22 34 182 98 2 818 37 3 24 2 12 13Vicksburg, MS 355.............................................. 11 767 62 7 978 90 1 660 26 43 49 65 44 53
Berkeley, MO 151.............................................. 1 938 – – – – 35 53 – – – –Black Jack, MO 123............................................. 2 766 8 D b D 32 33 93 D D DBlue Springs, MO 109........................................... D 5 D a D 43 D 86 D D DCape Girardeau, MO * 132....................................... D 4 D b D 47 D 58 D D DCaruthersville, MO 103.......................................... 558 – – – – 46 52 – – – –
Columbia, MO 358.............................................. 7 446 30 D b D 38 37 38 D D DFlorissant, MO 227............................................. 5 285 24 2 191 63 310 26 20 36 36 28 26Grandview, MO 259............................................. 3 661 17 1 393 42 321 31 33 59 57 59 59Hayti, MO 147.................................................. 2 717 3 D a D 40 47 78 D D DJennings, MO 398.............................................. 20 490 20 11 342 299 4 733 19 19 36 20 9 12
Bellevue, NE 102............................................... 5 119 5 D b D 14 36 46 D D DLincoln, NE 166................................................ D 19 D c D 20 D 43 D D DOmaha, NE 1 104................................................ 89 688 190 D g D 11 7 21 D D D
MINORITY~OWNED BUSINESS ENTERPRISES BLACK 69U.S. Census Bureau, 1997 Economic Census Mar. 15, 2001
Table 6. Statistics for Selected Places With 100 or More Black~Owned Firms: 1997mCon.[Detail may not add to total because of rounding. For meaning of abbreviations and symbols, see introductory text. For explanation of terms, see Appendix A. For information on geographic areasfollowed by *, see Appendix C]
Geographic area
All firms1 Firms with paid employeesRelative standard error of
estimate (percent)2
for columnmFirms(number)
Sales andreceipts($1,000)
Firms(number)
Sales andreceipts($1,000)
Employees(number)
Annualpayroll
($1,000)
A B C D E F A B C D E F
New JerseymCon.
Sayreville, NJ 139.............................................. 2 213 – – – – 44 60 – – – –Scotch Plains township, NJ 177.................................. 2 444 4 D a D 45 38 65 D D DSouth Brunswick township, NJ 234................................ 10 519 54 D b D 38 67 97 D D DSouth Orange Village township, NJ 205............................ 10 526 5 D b D 43 55 69 D D DTeaneck township, NJ 586....................................... 16 641 51 7 304 263 2 315 18 22 62 44 62 52
Trenton, NJ 586................................................ 13 462 122 7 800 75 3 210 16 31 59 55 78 69Union township, NJ 170......................................... 5 209 3 2 303 46 555 41 19 – – – –Union City, NJ 309.............................................. 22 586 168 21 458 342 4 812 46 53 64 55 65 67Vineland, NJ 173............................................... 9 481 55 7 440 331 3 929 41 69 62 73 83 86Voorhees township, NJ 137...................................... 9 825 17 D b D 41 44 59 D D D
West New York, NJ 153......................................... D 64 D f D 46 D 82 D D DWest Orange township, NJ 323................................... 63 821 58 D f D 31 77 64 D D DWillingboro township, NJ 541..................................... 13 162 43 6 658 86 1 617 27 41 56 68 78 73Winslow township, NJ 281....................................... 25 420 45 13 155 233 1 446 33 36 85 47 83 28
Albany, NY 348................................................. 8 988 10 2 926 54 453 26 26 57 26 19 14Amherst town balance, NY * 118................................. 42 701 21 D f D 43 80 65 D D DBabylon town balance, NY * 740.................................. 14 295 40 7 635 83 2 217 24 12 59 18 31 18Brookhaven town balance, NY * 349.............................. 11 956 30 3 578 29 587 27 23 60 41 77 52Buffalo, NY 1 654................................................ 76 246 139 47 233 1 131 11 161 17 22 34 31 29 23
Clarkstown town balance, NY * 296............................... 3 124 – – – – 31 45 – – – –Freeport, NY * 413.............................................. 29 319 18 21 851 75 2 385 24 10 61 11 40 44Greenburgh town balance, NY * 738.............................. 25 255 63 D b D 23 44 96 D D DHempstead, NY * 852........................................... 122 456 127 107 533 2 260 47 657 21 80 58 90 95 96Hempstead town balance, NY * 2 397............................... 105 220 205 55 124 858 17 908 11 26 56 37 32 22
Huntington town balance, NY * 354............................... 12 174 26 3 165 24 1 279 31 45 56 53 92 60Islip town balance, NY * 1 471..................................... 42 785 133 26 999 275 3 510 16 19 71 30 69 54Mount Vernon, NY 1 740.......................................... 117 783 239 86 812 2 192 22 810 15 29 37 38 80 57Newburgh, NY 404.............................................. 5 828 19 D b D 45 34 80 D D DNew Rochelle, NY 698.......................................... 34 244 163 25 147 345 6 047 39 60 83 71 86 78
New York, NY * 63 327............................................. 3 696 638 5 648 2 491 925 32 603 748 660 3 7 11 11 20 16North Hempstead town balance, NY * 445......................... 46 772 70 D e D 33 26 88 D D DOyster Bay town balance, NY * 276............................... 12 427 9 4 170 58 1 368 33 24 47 19 14 22Penfield town, NY 116........................................... 905 1 D a D 45 28 – D D DPoughkeepsie, NY 135.......................................... 2 090 – – – – 44 80 – – – –
Rochester, NY 1 351.............................................. 131 104 132 119 625 1 446 31 456 16 34 22 37 26 36Spring Valley, NY * 335.......................................... 4 419 27 D b D 30 32 62 D D DWestbury, NY * 371............................................. 6 628 3 D a D 27 55 82 D D DWhite Plains, NY 309............................................ 19 547 23 14 607 78 2 114 27 42 46 57 18 14Yonkers, NY 726............................................... 24 359 38 10 195 136 1 851 26 32 44 43 43 45
Edenton, NC 166............................................... 9 595 2 D a D 47 81 – D D DElizabeth City, NC * 311......................................... 9 209 65 D c D 26 31 83 D D DElizabethtown, NC 109.......................................... 2 699 1 D a D 46 59 – D D DEnfield, NC 126................................................ 2 322 3 D a D 34 36 79 D D DFairmont, NC 124............................................... 1 196 4 D a D 38 19 55 D D D
Fayetteville, NC 1 541............................................ 66 500 306 47 174 1 338 15 129 14 21 24 27 27 26Forest City, NC 128............................................. 5 907 1 D a D 49 58 – D D DGarner, NC 215................................................ 5 548 13 D a D 35 41 60 D D DGastonia, NC 206............................................... 12 780 29 9 777 340 4 497 32 29 34 28 25 20Goldsboro, NC 353............................................. 10 105 34 5 024 118 908 18 26 27 27 28 37
Greensboro, NC 2 333............................................ 270 671 430 237 030 2 625 42 407 13 29 19 34 20 16Greenville, NC 1 030.............................................. 42 516 173 30 890 647 8 950 13 17 45 24 34 19Henderson, NC 362............................................. 16 766 21 D c D 21 36 31 D D DHickory, NC * 132............................................... 4 480 6 D b D 40 40 45 D D DHigh Point, NC * 431............................................ D 23 D b D 20 D 32 D D D
Hillsborough, NC 218........................................... 7 849 12 D b D 32 42 62 D D DJacksonville, NC 183............................................ 4 853 28 3 629 100 1 647 32 48 53 65 61 80Kinston, NC 347................................................ 16 519 131 D e D 23 37 49 D D DLaurinburg, NC 189............................................. 13 589 73 D e D 36 55 76 D D DLexington, NC 102.............................................. 5 150 2 D b D 48 37 – D D D
Louisburg, NC 167.............................................. 2 532 3 D a D 42 56 78 D D DLumberton, NC 105............................................. 10 937 20 D c D 21 51 61 D D DMonroe, NC 155................................................ 10 516 64 9 645 302 2 076 37 38 51 43 37 46New Bern, NC 259.............................................. 11 626 38 8 540 117 1 582 30 32 42 43 30 37Oxford, NC 162................................................ 9 090 35 D c D 19 50 53 D D D
70 BLACK MINORITY~OWNED BUSINESS ENTERPRISESU.S. Census Bureau, 1997 Economic Census Mar. 15, 2001
Table 6. Statistics for Selected Places With 100 or More Black~Owned Firms: 1997mCon.[Detail may not add to total because of rounding. For meaning of abbreviations and symbols, see introductory text. For explanation of terms, see Appendix A. For information on geographic areasfollowed by *, see Appendix C]
Geographic area
All firms1 Firms with paid employeesRelative standard error of
estimate (percent)2
for columnmFirms(number)
Sales andreceipts($1,000)
Firms(number)
Sales andreceipts($1,000)
Employees(number)
Annualpayroll
($1,000)
A B C D E F A B C D E F
North CarolinamCon.
Roxboro, NC 176............................................... 6 344 9 D b D 36 53 73 D D DSalisbury, NC 301.............................................. 3 309 2 D b D 29 25 – D D DSanford, NC 224................................................ 9 790 18 3 676 86 1 077 41 44 48 51 52 43Shelby, NC 103................................................ 6 079 39 5 414 177 1 883 17 33 59 39 40 40Siler City, NC 110............................................... 1 402 – – – – 26 40 – – – –
Spring Lake, NC 151............................................ 1 931 – – – – 38 20 – – – –Statesville, NC 218............................................. 3 288 2 D a D 41 39 76 D D DThomasville, NC * 234........................................... 8 074 13 D c D 33 38 54 D D DWadesboro, NC 128............................................ 1 855 1 D a D 46 36 – D D DWendell, NC 179............................................... 2 499 3 D a D 30 44 80 D D D
Williamston, NC 120............................................ 1 839 22 1 183 48 271 45 32 78 52 74 59Wilmington, NC 452............................................. 23 925 102 D e D 12 24 38 D D DWilson, NC 359................................................. 15 964 46 9 975 198 1 992 24 18 47 26 18 30Winston~Salem, NC 1 489......................................... 39 279 72 13 773 326 4 178 16 20 41 18 29 24Zebulon, NC 101............................................... 5 276 17 D b D 44 40 76 D D D
North Dakota 99.................................... D 8 D c D 16 D – D D D
Euclid, OH 134................................................. 9 965 17 D b D 13 55 77 D D DForest Park, OH 292............................................ 30 289 46 22 841 446 7 928 23 67 44 87 61 84Lorain, OH 195................................................. 20 054 9 D b D 34 58 58 D D DMansfield, OH 109.............................................. 6 255 42 D c D 25 40 67 D D DMaple Heights, OH 359.......................................... 13 149 11 D b D 32 57 62 D D D
Shaker Heights, OH 590......................................... 24 801 58 11 264 203 3 373 18 27 40 42 45 49South Euclid, OH 124........................................... 6 044 4 D a D 38 6 55 D D DSpringdale, OH 150............................................. 22 039 13 21 304 106 7 017 45 71 46 74 55 70Springfield, OH 125............................................. D 17 2 146 33 832 45 D 36 16 32 4Toledo, OH 1 418................................................ D 121 D e D 15 D 25 D D D
Trotwood, OH 516.............................................. 19 907 8 5 874 74 1 540 19 22 – – – –University Heights, OH 310...................................... 18 012 5 D a D 26 36 68 D D DWarrensville Heights, OH 395.................................... 30 123 68 26 247 342 7 397 27 41 37 47 38 56Yellow Springs, OH 108......................................... 1 125 5 D b D 42 37 87 D D DYoungstown, OH * 421.......................................... 34 402 65 D f D 26 67 48 D D DZanesville, OH 101............................................. 13 865 13 11 876 74 1 851 45 19 34 22 41 23
Broken Arrow, OK * 141......................................... 2 172 13 D b D 37 46 91 D D DLawton, OK 255................................................ D 35 D c D 12 D 28 D D DMidwest City, OK 150........................................... 4 038 6 1 692 51 581 17 31 45 59 57 50Muskogee, OK 185............................................. 10 502 91 D e D 32 51 59 D D DOklahoma City, OK * 1 504........................................ 144 950 174 123 437 1 858 43 832 6 10 15 10 16 13Spencer, OK 119............................................... 2 246 6 442 54 191 44 39 44 47 63 51Tulsa, OK * 1 596................................................ 67 032 136 42 850 981 11 335 10 19 14 29 32 26
Abington township, PA 183...................................... 7 999 19 4 708 50 1 743 37 26 33 30 36 53Bensalem township, PA 102..................................... 4 069 1 D a D 35 11 – D D DCheltenham township, PA 376.................................... 11 996 10 3 789 52 1 107 29 29 41 61 76 66Chester, PA 397................................................ 21 604 91 18 076 113 2 423 32 47 51 59 63 53Erie, PA 363................................................... 39 870 104 D e D 24 9 52 D D D
Harrisburg, PA 420............................................. 20 455 44 14 728 192 2 965 23 31 41 40 29 36Lower Merion township, PA 359.................................. 14 445 25 4 717 123 1 722 34 33 47 15 18 22Norristown, PA 222............................................. 14 311 20 D c D 32 9 76 D D DPenn Hills township, PA 129..................................... 5 158 13 2 238 106 1 206 27 49 46 36 63 60Philadelphia, PA 9 285............................................ 830 185 1 306 684 542 8 896 196 354 5 13 16 16 18 16
Pittsburgh, PA 1 292.............................................. 109 075 258 91 943 2 124 36 077 11 36 27 43 39 39Washington, PA 112............................................ 5 159 2 D b D 49 8 – D D DWilkinsburg, PA 245............................................ 56 548 8 54 106 200 4 783 31 70 44 74 72 71Williamsport, PA 151............................................ 1 152 – – – – 46 45 – – – –Yeadon, PA 263................................................ 6 727 27 D a D 20 33 93 D D DYork, PA 236................................................... 5 291 22 3 268 105 879 36 24 88 24 76 41
Aiken, SC 340.................................................. 19 180 62 15 113 220 5 355 23 36 76 45 26 30Anderson, SC 182.............................................. 3 882 55 2 788 102 675 43 38 71 48 39 35Beaufort, SC 267............................................... 102 504 14 D c D 25 1 27 D D DCamden, SC 138............................................... 3 666 42 D b D 43 52 77 D D DCharleston, SC * 863............................................ 40 609 127 28 118 700 8 775 19 20 44 23 44 37
See footnotes at end of table.
MINORITY~OWNED BUSINESS ENTERPRISES BLACK 71U.S. Census Bureau, 1997 Economic Census Mar. 15, 2001
Table 6. Statistics for Selected Places With 100 or More Black~Owned Firms: 1997mCon.[Detail may not add to total because of rounding. For meaning of abbreviations and symbols, see introductory text. For explanation of terms, see Appendix A. For information on geographic areasfollowed by *, see Appendix C]
Geographic area
All firms1 Firms with paid employeesRelative standard error of
Georgetown, SC 318............................................ 12 077 46 5 876 159 1 545 19 16 44 34 38 35Goose Creek, SC * 143......................................... 2 231 2 D b D 35 9 – D D DGreenville, SC 320.............................................. 30 187 62 26 598 842 11 621 22 12 17 13 8 14Greenwood, SC 221............................................ 14 341 48 11 961 488 4 168 35 38 45 47 70 43Hilton Head Island, SC 113...................................... D 44 D b D 25 D 45 D D D
Lake City, SC 153.............................................. 2 862 3 D b D 45 31 80 D D DLaurens, SC 196............................................... 8 372 11 D b D 40 67 50 D D DManning, SC 229............................................... 7 574 11 D b D 33 47 72 D D DMarion, SC 225................................................. 5 476 40 D b D 48 37 53 D D DMount Pleasant, SC 156......................................... 1 720 3 D a D 45 46 78 D D D
Myrtle Beach, SC 132........................................... 11 999 16 D c D 41 44 44 D D DNorth Augusta, SC * 166........................................ D 4 4 925 135 1 546 41 D – – – –North Charleston, SC * 487...................................... 30 388 33 25 143 1 019 13 183 21 19 20 23 25 24Orangeburg, SC 337............................................ 16 473 88 13 306 255 4 717 41 34 68 39 66 65Rock Hill, SC 395............................................... 22 007 52 15 229 303 3 839 19 26 15 37 35 28
Seneca, SC 110................................................ 2 761 9 D b D 47 50 50 D D DSpartanburg, SC 216............................................ 13 657 26 D e D 30 11 24 D D DSummerville, SC * 163.......................................... 28 838 24 26 825 129 2 591 33 7 43 8 23 26Sumter, SC 616................................................ 28 857 39 23 166 265 6 540 23 9 50 9 14 25Walterboro, SC 232............................................. 5 396 9 1 955 51 814 34 19 59 14 30 6
South Dakota 150.................................... 17 294 22 D b D 24 9 42 D D D
Bolivar, TN 100................................................. 2 573 1 D a D 48 40 – D D DChattanooga, TN * 712.......................................... 69 796 154 61 778 1 237 23 620 10 21 21 24 25 22Clarksville, TN 382.............................................. D 31 D c D 20 D 36 D D DDyersburg, TN 148.............................................. D 7 D b D 47 D 91 D D DJackson, TN 577............................................... 165 007 100 155 702 1 192 16 941 22 44 28 47 20 33
Knoxville, TN 590............................................... 32 231 123 24 646 500 6 367 14 19 47 25 35 26Lebanon, TN 114............................................... 12 771 29 D e D 42 62 60 D D DMemphis, TN 8 080............................................... 573 370 1 074 408 495 7 667 127 324 4 7 9 12 10 16Murfreesboro, TN 214........................................... 65 646 41 D e D 35 62 30 D D DNashville~Davidson (balance), TN * 3 942........................... 346 402 753 291 178 3 216 79 729 6 11 18 13 12 18Oak Ridge, TN * 183............................................ D 9 45 251 729 22 678 41 D 29 62 62 49
Arlington, TX 1 021............................................... D 199 D j D 23 D 50 D D DAustin, TX * 1 737................................................ 150 641 259 129 270 1 254 23 653 21 11 29 12 26 22Beaumont, TX 688.............................................. 27 705 29 D c D 18 25 43 D D DBryan, TX 178.................................................. 4 797 37 D b D 39 51 86 D D DCedar Hill, TX * 484............................................. 8 742 10 4 227 73 824 32 26 64 55 26 34
Corpus Christi, TX * 182......................................... D 7 D b D 39 D 34 D D DCorsicana, TX 160.............................................. D 10 D c D 39 D 82 D D DDallas, TX * 7 661................................................ 1 546 748 1 326 1 407 849 10 649 218 589 8 40 32 43 33 35DeSoto, TX 694................................................ 28 673 19 7 023 172 3 252 28 27 80 67 70 75Euless, TX 222................................................. 4 262 11 D a D 34 30 84 D D D
Forest Hill, TX 200.............................................. 9 365 34 D c D 36 36 95 D D DFort Worth, TX * 1 442............................................ 143 594 203 121 982 1 356 39 069 14 55 45 64 54 76Garland, TX * 781.............................................. 31 658 84 14 855 279 7 835 23 32 62 66 73 82Grand Prairie, TX * 314.......................................... 23 666 39 17 910 164 3 702 24 52 52 71 43 59Hitchcock, TX 134.............................................. D 57 D c D 49 D 96 D D D
Houston, TX * 16 855.............................................. 1 418 893 2 216 1 120 166 22 409 426 757 6 14 23 19 33 39Irving, TX 902.................................................. 55 298 28 45 146 276 6 931 39 48 60 57 82 25Jasper, TX 187................................................. 9 210 67 D c D 29 77 83 D D DKilleen, TX 417................................................. 13 687 6 D b D 21 29 35 D D DLancaster, TX 338.............................................. 9 036 – – – – 31 59 – – – –
Longview, TX * 490............................................. 5 217 9 D b D 46 43 47 D D DMcKinney, TX 131.............................................. 2 730 26 D c D 48 71 95 D D DMesquite, TX 280............................................... 10 650 9 D a D 24 51 82 D D DMidland, TX * 175............................................... 2 230 – – – – 31 29 – – – –Missouri City, TX * 1 284.......................................... 52 567 110 30 338 435 7 027 31 39 62 63 97 74
Orange, TX 284................................................ D 13 D b D 40 D 87 D D DParis, TX 173.................................................. 5 375 – – – – 48 67 – – – –Plano, TX * 617................................................ 25 778 31 17 790 169 4 604 40 39 42 46 44 45Port Arthur, TX 532............................................. D – – – – 41 D – – – –Richardson, TX * 213........................................... 153 053 97 150 051 1 320 29 915 46 36 67 37 47 49
Round Rock, TX * 380........................................... D 1 D a D 40 D – D D DSan Antonio, TX 1 614............................................ 116 043 159 90 636 1 587 25 906 18 28 22 29 16 17Texas City, TX * 621............................................ 12 840 28 D e D 29 49 94 D D DTyler, TX 213.................................................. 7 511 37 D c D 39 33 46 D D DWaco, TX 447.................................................. 34 295 80 D e D 32 55 72 D D DWaxahachie, TX 137............................................ D 26 D a D 34 D 93 D D DWichita Falls, TX * 194.......................................... 7 831 23 D b D 35 58 63 D D D
72 BLACK MINORITY~OWNED BUSINESS ENTERPRISESU.S. Census Bureau, 1997 Economic Census Mar. 15, 2001
Table 6. Statistics for Selected Places With 100 or More Black~Owned Firms: 1997mCon.[Detail may not add to total because of rounding. For meaning of abbreviations and symbols, see introductory text. For explanation of terms, see Appendix A. For information on geographic areasfollowed by *, see Appendix C]
Geographic area
All firms1 Firms with paid employeesRelative standard error of
Bellevue, WA 157............................................... 17 311 50 14 516 169 6 248 15 13 32 16 21 18Federal Way, WA 179........................................... 2 007 30 D b D 22 22 98 D D DKirkland, WA 159............................................... 5 841 – – – – 41 81 – – – –Renton, WA 116................................................ 42 423 8 D c D 31 1 29 D D DSeattle, WA 1 744................................................ 186 443 343 155 526 4 055 57 248 10 21 14 23 52 40
Spokane, WA 134.............................................. 45 637 39 D e D 33 7 62 D D DTacoma, WA 660............................................... 35 697 82 27 248 858 8 781 13 27 40 36 44 23Vancouver, WA 129............................................. D 67 D e D 26 D 45 D D D
West Virginia 1 148.................................... 87 649 129 76 923 1 018 14 203 3 7 14 8 28 23
Beckley, WV 103............................................... 1 045 6 D a D 30 25 54 D D DCharleston, WV 178............................................. 9 276 19 7 968 342 3 970 19 69 45 77 87 82
Beloit, WI 114.................................................. 2 520 23 1 421 35 369 44 40 63 61 92 61Madison, WI 219............................................... 33 163 26 30 376 350 10 943 19 41 32 45 40 58Milwaukee, WI * 3 325............................................ 256 593 485 190 318 5 023 59 407 6 8 17 8 14 8Racine, WI 243................................................. D 88 D e D 17 D 59 D D D
Wyoming 232........................................ 12 670 64 D c D 32 44 84 D D D
1All firms data include both firms with paid employees and firms with no paid employees.2For explanation of relative standard errors, see Reliability of Estimates in the introductory text.
MINORITY~OWNED BUSINESS ENTERPRISES BLACK 73U.S. Census Bureau, 1997 Economic Census Mar. 15, 2001
Table 7. Statistics for Black~Owned Firms by Industry Division and Legal Form ofOrganization: 1997
[Detail may not add to total because of rounding. This table is based on the 1987 SIC system. For meaning of abbreviations and symbols, see introductory text. For explanation of terms, see Appendix A]
Industry division and legal form of organization
All firms1 Firms with paid employeesRelative standard error of
C corporations 1 179.............................................. 2 249 123 846 2 232 938 16 819 429 337 6 12 7 13 12 9Subchapter S corporations 902................................... 1 008 510 611 993 515 7 751 185 580 10 9 14 9 9 8Individual proprietorships 8 161.................................... D 394 D g D 2 D 9 D D DPartnerships 189............................................... D 63 D c D 14 D 27 D D DOther3 17..................................................... D 17 D f D 26 D 26 D D D
C corporations 1 269.............................................. 2 395 177 1 000 2 362 989 7 286 228 481 9 18 10 18 15 16Subchapter S corporations 834................................... 2 356 431 656 2 335 766 4 871 147 873 9 9 10 9 12 14Individual proprietorships 5 856.................................... D 426 D g D 3 D 11 D D DPartnerships 154............................................... 679 588 51 673 714 195 77 547 21 78 33 79 12 89Other3 7..................................................... D 7 D b D 50 D 50 D D D
1All firms data include both firms with paid employees and firms with no paid employees.2For explanation of relative standard errors, see Reliability of Estimates in the introductory text.3Included in this group are cooperatives, estates, receiverships, and businesses classified as unknown legal forms of organization.
74 BLACK MINORITY~OWNED BUSINESS ENTERPRISESU.S. Census Bureau, 1997 Economic Census Mar. 15, 2001
Table 8. Statistics for Black~Owned Firms by Industry Division and Receipts Size of Firm:1997
[Detail may not add to total because of rounding. This table is based on the 1987 SIC system. For meaning of abbreviations and symbols, see introductory text. For explanation of terms, see Appendix A]
Industry division and receipts size
All firms1 Firms with paid employeesRelative standard error of
Less than $5,000 4 684........................................... D 19 D b D 3 D 82 D D D$5,000 to $9,999 2 912........................................... D 34 237 16 153 6 D 33 36 63 38$10,000 to $24,999 2 658......................................... 39 102 128 2 487 117 800 5 5 17 18 23 23$25,000 to $49,999 963......................................... 33 992 225 9 002 320 2 389 10 10 17 16 23 20$50,000 to $99,999 605......................................... 41 977 279 20 673 533 6 320 12 14 14 16 28 17
$100,000 to $249,999 504....................................... 78 107 382 60 742 1 588 17 640 15 15 19 18 31 21$250,000 to $499,999 238....................................... 83 731 177 61 042 969 18 002 19 20 21 20 20 19$500,000 to $999,999 97....................................... 61 344 93 D g D 19 23 21 D D D$1,000,000 or more 35......................................... D 33 D f D 31 D 33 D D D
Less than $5,000 2 937........................................... D – – – – 6 D – – – –$5,000 to $9,999 1 667........................................... D 3 D a D 5 D 47 D D D$10,000 to $24,999 1 946......................................... 30 071 109 1 664 89 657 8 9 24 25 18 35$25,000 to $49,999 1 081......................................... 38 254 158 D c D 7 7 16 D D D$50,000 to $99,999 1 044......................................... 71 310 256 18 363 345 4 637 11 12 7 8 13 8
$100,000 to $249,999 669....................................... 105 706 408 68 104 1 139 18 967 9 9 17 16 15 16$250,000 to $499,999 373....................................... 126 184 316 105 958 1 688 31 991 11 12 12 13 15 17$500,000 to $999,999 330....................................... 236 131 280 D h D 14 16 20 D D D$1,000,000 or more 402......................................... D 401 D j D 9 D 9 D D D
MINORITY~OWNED BUSINESS ENTERPRISES BLACK 75U.S. Census Bureau, 1997 Economic Census Mar. 15, 2001
Table 8. Statistics for Black~Owned Firms by Industry Division and Receipts Size of Firm:1997mCon.
[Detail may not add to total because of rounding. This table is based on the 1987 SIC system. For meaning of abbreviations and symbols, see introductory text. For explanation of terms, see Appendix A]
Industry division and receipts size
All firms1 Firms with paid employeesRelative standard error of
1All firms data include both firms with paid employees and firms with no paid employees.2For explanation of relative standard errors, see Reliability of Estimates in the introductory text.
76 BLACK MINORITY~OWNED BUSINESS ENTERPRISESU.S. Census Bureau, 1997 Economic Census Mar. 15, 2001
Table 9. Statistics for Black~Owned Firms With Paid Employees by Industry Division andEmployment Size of Firm: 1997
[Detail may not add to total because of rounding. This table is based on the 1987 SIC system. For meaning of abbreviations and symbols, see introductory text. For explanation of terms, see Appendix A]
MINORITY~OWNED BUSINESS ENTERPRISES BLACK 77U.S. Census Bureau, 1997 Economic Census Mar. 15, 2001
Table 9. Statistics for Black~Owned Firms With Paid Employees by Industry Division andEmployment Size of Firm: 1997mCon.
[Detail may not add to total because of rounding. This table is based on the 1987 SIC system. For meaning of abbreviations and symbols, see introductory text. For explanation of terms, see Appendix A]
No employees2 2 171.................................................... 155 552 – 41 496 23 53 – 711 to 4 employees 3 078.................................................. 606 050 5 233 66 215 18 30 18 215 to 9 employees 408.................................................. 344 899 2 713 54 382 20 68 22 4310 to 19 employees 368................................................ D h D 37 D D D20 to 49 employees 291................................................ 670 201 6 962 153 562 20 21 17 2950 to 99 employees 30................................................ D g D 93 D D D100 to 499 employees –............................................. – – – – – – –500 employees or more –............................................ – – – – – – –
1For explanation of relative standard errors, see Reliability of Estimates in the introductory text.2Firms reported annual payroll, but did not report any employees on their payroll during specified period in 1997.
78 BLACK MINORITY~OWNED BUSINESS ENTERPRISESU.S. Census Bureau, 1997 Economic Census Mar. 15, 2001
Table 10. Statistics for Black~Owned Firms With No Paid Employees by Industry Division: 1997[Detail may not add to total because of rounding. This table is based on the 1987 SIC system. For meaning of abbreviations and symbols, see introductory text. For explanation of terms, see Appendix A]
Industry division
Relative standard error ofestimate (percent)1
for columnmFirms
(number)
Sales andreceipts($1,000)
A B A B
All industries 730 264................................................... 14 836 803 1 2
1For explanation of relative standard errors, see Reliability of Estimates in the introductory text.
MINORITY~OWNED BUSINESS ENTERPRISES BLACK 79U.S. Census Bureau, 1997 Economic Census Mar. 15, 2001
Table 11. Statistics for All U.S. Firms by Major Industry Group: 1997[This table is based on the 1987 SIC system. For meaning of abbreviations and symbols, see introductory text. For explanation of terms, see Appendix A]
80 BLACK MINORITY~OWNED BUSINESS ENTERPRISESU.S. Census Bureau, 1997 Economic Census Mar. 15, 2001
Table 11. Statistics for All U.S. Firms by Major Industry Group: 1997mCon.[This table is based on the 1987 SIC system. For meaning of abbreviations and symbols, see introductory text. For explanation of terms, see Appendix A]
1All firms data include both firms with paid employees and firms with no paid employees.2Excludes 4512 (part), domestically scheduled airlines.3Excludes 6371 (part), pension, health, and welfare funds; and 6399 (part), other insurance carriers.4Excludes 6552 (land subdividers and developers, except cemeteries), which is included in construction industries.5Excludes 6722, management investment offices; 6726, unit investment trusts, face~amount certificate offices, and closed~end management investment offices; and 6733 (part), trusts and
vacation funds.
MINORITY~OWNED BUSINESS ENTERPRISES BLACK 81U.S. Census Bureau, 1997 Economic Census Mar. 15, 2001
Table 12. Statistics for All U.S. Firms by Industry Division for States: 1997[This table is based on the 1987 SIC system. For meaning of abbreviations and symbols, see introductory text. For explanation of terms, see Appendix A]
82 BLACK MINORITY~OWNED BUSINESS ENTERPRISESU.S. Census Bureau, 1997 Economic Census Mar. 15, 2001
Table 12. Statistics for All U.S. Firms by Industry Division for States: 1997mCon.[This table is based on the 1987 SIC system. For meaning of abbreviations and symbols, see introductory text. For explanation of terms, see Appendix A]
MINORITY~OWNED BUSINESS ENTERPRISES BLACK 83U.S. Census Bureau, 1997 Economic Census Mar. 15, 2001
Table 12. Statistics for All U.S. Firms by Industry Division for States: 1997mCon.[This table is based on the 1987 SIC system. For meaning of abbreviations and symbols, see introductory text. For explanation of terms, see Appendix A]
84 BLACK MINORITY~OWNED BUSINESS ENTERPRISESU.S. Census Bureau, 1997 Economic Census Mar. 15, 2001
Table 12. Statistics for All U.S. Firms by Industry Division for States: 1997mCon.[This table is based on the 1987 SIC system. For meaning of abbreviations and symbols, see introductory text. For explanation of terms, see Appendix A]
MINORITY~OWNED BUSINESS ENTERPRISES BLACK 85U.S. Census Bureau, 1997 Economic Census Mar. 15, 2001
Table 12. Statistics for All U.S. Firms by Industry Division for States: 1997mCon.[This table is based on the 1987 SIC system. For meaning of abbreviations and symbols, see introductory text. For explanation of terms, see Appendix A]
86 BLACK MINORITY~OWNED BUSINESS ENTERPRISESU.S. Census Bureau, 1997 Economic Census Mar. 15, 2001
Table 12. Statistics for All U.S. Firms by Industry Division for States: 1997mCon.[This table is based on the 1987 SIC system. For meaning of abbreviations and symbols, see introductory text. For explanation of terms, see Appendix A]
MINORITY~OWNED BUSINESS ENTERPRISES BLACK 87U.S. Census Bureau, 1997 Economic Census Mar. 15, 2001
Table 12. Statistics for All U.S. Firms by Industry Division for States: 1997mCon.[This table is based on the 1987 SIC system. For meaning of abbreviations and symbols, see introductory text. For explanation of terms, see Appendix A]
1All firms data include both firms with paid employees and firms with no paid employees.
88 BLACK MINORITY~OWNED BUSINESS ENTERPRISESU.S. Census Bureau, 1997 Economic Census Mar. 15, 2001
Table 13. Statistics for All U.S. Firms by Industry Division and Legal Form of Organization:1997
[This table is based on the 1987 SIC system. For meaning of abbreviations and symbols, see introductory text. For explanation of terms, see Appendix A]
1All firms data include both firms with paid employees and firms with no paid employees.2Included in this group are cooperatives, estates, receiverships, and businesses classified as unknown legal forms of organization.
MINORITY~OWNED BUSINESS ENTERPRISES BLACK 89U.S. Census Bureau, 1997 Economic Census Mar. 15, 2001
Table 14. Statistics for All U.S. Firms by Industry Division and Receipts Size of Firm:1997
[This table is based on the 1987 SIC system. For meaning of abbreviations and symbols, see introductory text. For explanation of terms, see Appendix A]
90 BLACK MINORITY~OWNED BUSINESS ENTERPRISESU.S. Census Bureau, 1997 Economic Census Mar. 15, 2001
Table 14. Statistics for All U.S. Firms by Industry Division and Receipts Size of Firm:1997mCon.
[This table is based on the 1987 SIC system. For meaning of abbreviations and symbols, see introductory text. For explanation of terms, see Appendix A]
1All firms data include both firms with paid employees and firms with no paid employees.
MINORITY~OWNED BUSINESS ENTERPRISES BLACK 91U.S. Census Bureau, 1997 Economic Census Mar. 15, 2001
Table 15. Statistics for All U.S. Firms With Paid Employees by Industry Division andEmployment Size of Firm: 1997
[This table is based on the 1987 SIC system. For meaning of abbreviations and symbols, see introductory text. For explanation of terms, see Appendix A]
Industry division and employment size Firms(number)
92 BLACK MINORITY~OWNED BUSINESS ENTERPRISESU.S. Census Bureau, 1997 Economic Census Mar. 15, 2001
Table 15. Statistics for All U.S. Firms With Paid Employees by Industry Division andEmployment Size of Firm: 1997mCon.
[This table is based on the 1987 SIC system. For meaning of abbreviations and symbols, see introductory text. For explanation of terms, see Appendix A]
Industry division and employment size Firms(number)
No employees1 22 726................................................................. 1 780 243 – 420 4741 to 4 employees 6 617............................................................... 572 052 11 389 115 4255 to 9 employees 1 154............................................................... 232 482 7 388 63 17510 to 19 employees 239............................................................. 78 057 3 044 26 07020 to 49 employees 82............................................................. 56 342 2 307 19 19550 to 99 employees 13............................................................. 18 219 865 7 443100 to 499 employees 4........................................................... D f D500 employees or more 1......................................................... D f D
1Firms reported annual payroll, but did not report any employees on their payroll during specified period in 1997.
MINORITY~OWNED BUSINESS ENTERPRISES BLACK 93U.S. Census Bureau, 1997 Economic Census Mar. 15, 2001
Table 16. Statistics for All U.S. Firms With No Paid Employees by Industry Division: 1997[This table is based on the 1987 SIC system. For meaning of abbreviations and symbols, see introductory text. For explanation of terms, see Appendix A]
Industry division Firms(number)
Sales and receipts($1,000)
All industries 15 526 783.......................................................... 645 302 726
94 BLACK MINORITY~OWNED BUSINESS ENTERPRISESU.S. Census Bureau, 1997 Economic Census Mar. 15, 2001
Appendix A.Explanation of Terms
Annual payroll. Annual payroll consists of the combinedamount of wages paid, tips reported, and other compensa-tion including salaries, vacation allowances, bonuses,commissions, sick-leave pay, and the value of payments-in-kind (such as free meals and lodging) paid to allemployees during the calendar year before deductions forsocial security, income tax, insurance, union dues, etc.All forms of compensation are included, whether or notsubject to income tax or FICA tax, with the exception ofannuities, third-party sick pay, and supplemental unem-ployment compensation benefits (even if income tax waswithheld). For corporations, total payroll includes compen-sation paid to officers and executives; for unincorporatedbusinesses, it does not include profit or other compensa-tion of proprietors or partners.
Employment. Employment includes all employees, full-time and part-time, reported on a firm’s payroll duringspecified pay periods in 1997. Persons on paid sick leave,paid holidays, and paid vacations are included asemployees, as are salaried officers and executives of cor-porations. However, proprietors and partners of unincor-porated businesses are not considered as employees.
The derivation of the 1997 employment figures varysomewhat among the different industries. For firms in theminerals, manufacturing, and construction industries,employment represents an annual average of the numberof ‘‘production workers’’ on the payroll for any part of thepay periods including the 12th of March, May, August, andNovember, plus the number of ‘‘all other employees’’ onthe payroll during the March 12th pay period. For theother industries covered by the economic censuses andfor those industries not covered, employment consists ofall employees on the payroll of a firm during the payperiod including March 12.
Ethnicity. The ethnic categories listed on the surveyquestionnaires are consistent with those mandated by theOffice of Management and Budget. These standards weredeveloped by both the Executive Branch and Congress.
Firm. A firm is a business consisting of one domesticestablishment or more that the reporting firm specifiedunder its ownership or control at the end of 1997. If acompany owned or controlled other companies, all estab-lishments of the subsidiaries are included as part of theowning or controlling company. In this report, the termscompany and firm are used interchangeably.
Legal form of organization. The five legal forms oforganization included in this report are:
1. C corporation. Any legally incorporated business,except subchapter S, under state laws.
2. Subchapter S corporation. A legally incorporatedbusiness under state laws. A subchapter S corporationis a special IRS designation for legally incorporatedbusinesses with 75 or fewer shareholders who,because of tax advantages, elect to be taxed as indi-vidual shareholders rather than as corporations.
3. Individual proprietorship. An unincorporatedbusiness owned by an individual. Also included in thiscategory are self-employed persons. The businessmay be the only occupation of an individual or thesecondary activity of an individual who works fulltime for someone else.
4. Partnership. An unincorporated business owned bytwo or more persons.
5. Other. Included in this group are cooperatives,estates, receiverships, and businesses classified asunknown legal forms of organization.
Race. The race categories listed on the survey question-naires are consistent with those mandated by the Office ofManagement and Budget. These standards were developedby both the Executive Branch and Congress.
Sales and receipts. Sales and receipts are defined asthe receipts for goods produced or distributed or servicesprovided. Excluded from sales are nonoperating receipts,returns on investments, and interest.
For firms with multiple locations, sales and receipts arereported for each location or establishment of the firm.These sales and receipts include estimated valuesassigned to intra-company transfers of goods and servicesamong establishments within the same company. Thevalue of a firm’s sales and receipts as shown in this publi-cation is the aggregate of these establishment receipts.Because of duplication, the aggregates of these establish-ments’ sales and receipts ordinarily exceed a firm’s totalnet sales and receipts, which reflect only commercialtransactions with outside customers.
APPENDIX A A–1MINORITY-OWNED BUSINESS ENTERPRISES
U.S. Census Bureau, 1997 Economic Census
Appendix B.Metropolitan Areas
Abilene, TX MSA
Taylor County, TX
Akron, OH PMSA
Portage County, OH
Summit County, OH
Albany, GA MSA
Dougherty County, GA
Lee County, GA
Albany–Schenectady–Troy, NY MSA
Albany County, NY
Montgomery County, NY
Rensselaer County, NY
Saratoga County, NY
Schenectady County, NY
Schoharie County, NY
Albuquerque, NM MSA
Bernalillo County, NM
Sandoval County, NM
Valencia County, NM
Alexandria, LA MSA
Rapides Parish, LA
Allentown–Bethlehem–Easton, PA MSA
Carbon County, PA
Lehigh County, PA
Northampton County, PA
Altoona, PA MSA
Blair County, PA
Amarillo, TX MSA
Potter County, TX
Randall County, TX
Anchorage, AK MSA
Anchorage Borough, AK
Ann Arbor, MI PMSA
Lenawee County, MI
Livingston County, MI
Washtenaw County, MI
Anniston, AL MSA
Calhoun County, AL
Appleton–Oshkosh–Neenah, WI MSA
Calumet County, WI
Outagamie County, WI
Winnebago County, WI
Asheville, NC MSA
Buncombe County, NC
Madison County, NC
Athens, GA MSA
Clarke County, GA
Madison County, GA
Oconee County, GA
Atlanta, GA MSA
Barrow County, GA
Bartow County, GA
Carroll County, GA
Cherokee County, GA
Clayton County, GA
Cobb County, GA
Coweta County, GA
DeKalb County, GA
Douglas County, GA
Fayette County, GA
Forsyth County, GA
Fulton County, GA
Gwinnett County, GA
Henry County, GA
APPENDIX B B–11997 ECONOMIC CENSUS
U.S. Census Bureau, 1997 Economic Census
Atlanta, GA MSA—Con.
Newton County, GA
Paulding County, GA
Pickens County, GA
Rockdale County, GA
Spalding County, GA
Walton County, GA
Atlantic–Cape May, NJ PMSA
Atlantic County, NJ
Cape May County, NJ
Augusta–Aiken, GA–SC MSA
Columbia County, GA
McDuffie County, GA
Richmond County, GA
Aiken County, SC
Edgefield County, SC
Austin–San Marcos, TX MSA
Bastrop County, TX
Caldwell County, TX
Hays County, TX
Travis County, TX
Williamson County, TX
Bakersfield, CA MSA
Kern County, CA
Baltimore, MD PMSA
Anne Arundel County, MD
Baltimore County, MD
Carroll County, MD
Harford County, MD
Howard County, MD
Queen Anne’s County, MD
Baltimore, MD (IC)
Bangor, ME MSA
Penobscot County, ME (Part)
Bangor city, ME
Brewer city, ME
Old Town city, ME
Orono town, ME
Waldo County, ME (Part)
Barnstable–Yarmouth, MA MSA
Barnstable County, MA
Barnstable city, MA
Dennis town, MA
Harwich town, MA
Sandwich town, MA
Yarmouth town, MA
Baton Rouge, LA MSA
Ascension Parish, LA
East Baton Rouge Parish, LA
Livingston Parish, LA
West Baton Rouge Parish, LA
Beaumont–Port Arthur, TX MSA
Hardin County, TX
Jefferson County, TX
Orange County, TX
Bellingham, WA MSA
Whatcom County, WA
Benton Harbor, MI MSA
Berrien County, MI
Bergen–Passaic, NJ PMSA
Bergen County, NJ
Passaic County, NJ
Billings, MT MSA
Yellowstone County, MT
Biloxi–Gulfport–Pascagoula, MS MSA
Hancock County, MS
Harrison County, MS
Jackson County, MS
Binghamton, NY MSA
Broome County, NY
Tioga County, NY
Birmingham, AL MSA
Blount County, AL
Jefferson County, AL
St. Clair County, AL
Shelby County, AL
B–2 APPENDIX B 1997 ECONOMIC CENSUS
U.S. Census Bureau, 1997 Economic Census
Bismarck, ND MSA
Burleigh County, ND
Morton County, ND
Bloomington, IN MSA
Monroe County, IN
Bloomington–Normal, IL MSA
McLean County, IL
Boise City, ID MSA
Ada County, ID
Canyon County, ID
Boston, MA–NH PMSA
Bristol County, MA (Part)
Mansfield town, MA
Norton town, MA
Taunton city, MA
Essex County, MA (Part)
Amesbury town, MA
Beverly city, MA
Danvers town, MA
Gloucester city, MA
Ipswich town, MA
Lynn city, MA
Lynnfield town, MA
Marblehead town, MA
Newburyport city, MA
Peabody city, MA
Salem city, MA
Saugus town, MA
Swampscott town, MA
Middlesex County, MA (Part)
Acton town, MA
Arlington town, MA
Ashland town, MA
Bedford town, MA
Belmont town, MA
Burlington town, MA
Cambridge city, MA
Concord town, MA
Boston, MA–NH PMSA—Con.
Middlesex County, MA (Part)—Con.
Everett city, MA
Framingham town, MA
Holliston town, MA
Hopkinton town, MA
Hudson town, MA
Lexington town, MA
Malden city, MA
Marlborough city, MA
Maynard town, MA
Medford city, MA
Melrose city, MA
Natick town, MA
Newton city, MA
North Reading town, MA
Reading town, MA
Somerville city, MA
Stoneham town, MA
Sudbury town, MA
Wakefield town, MA
Waltham city, MA
Watertown city, MA
Wayland town, MA
Weston town, MA
Wilmington town, MA
Winchester town, MA
Woburn city, MA
Norfolk County, MA (Part)
Bellingham town, MA
Braintree town, MA
Brookline town, MA
Canton town, MA
Dedham town, MA
Foxborough town, MA
Franklin city, MA
Holbrook town, MA
Medfield town, MA
APPENDIX B B–31997 ECONOMIC CENSUS
U.S. Census Bureau, 1997 Economic Census
Boston, MA–NH PMSA—Con.
Norfolk County, MA (Part)—Con.
Medway town, MA
Milton town, MA
Needham town, MA
Norfolk town, MA
Norwood town, MA
Quincy city, MA
Randolph town, MA
Sharon town, MA
Stoughton town, MA
Walpole town, MA
Wellesley town, MA
Westwood town, MA
Weymouth town, MA
Wrentham town, MA
Plymouth County, MA (Part)
Carver town, MA
Duxbury town, MA
Hanover town, MA
Hingham town, MA
Hull town, MA
Kingston town, MA
Marshfield town, MA
Pembroke town, MA
Plymouth town, MA
Rockland town, MA
Scituate town, MA
Wareham town, MA
Suffolk County, MA
Boston city, MA
Chelsea city, MA
Revere city, MA
Winthrop town, MA
Boston, MA–NH PMSA—Con.
Worcester County, MA (Part)
Harvard town, MA
Milford town, MA
Rockingham County, NH (Part)
Boston–Worcester–Lawrence, MA–NH–ME–CT CMSA
Boston, MA–NH PMSA
Bristol County, MA (Part)
Mansfield town, MA
Norton town, MA
Taunton city, MA
Essex County, MA (Part)
Amesbury town, MA
Beverly city, MA
Danvers town, MA
Gloucester city, MA
Ipswich town, MA
Lynn city, MA
Lynnfield town, MA
Marblehead town, MA
Newburyport city, MA
Peabody city, MA
Salem city, MA
Saugus town, MA
Swampscott town, MA
Middlesex County, MA (Part)
Acton town, MA
Arlington town, MA
Ashland town, MA
Bedford town, MA
Belmont town, MA
Burlington town, MA
Cambridge city, MA
Concord town, MA
Everett city, MA
Framingham town, MA
Holliston town, MA
Hopkinton town, MA
B–4 APPENDIX B 1997 ECONOMIC CENSUS
U.S. Census Bureau, 1997 Economic Census
Boston–Worcester–Lawrence, MA–NH–ME–CTCMSA—Con.
Boston, MA–NH PMSA—Con.
Middlesex County, MA (Part)—Con.
Hudson town, MA
Lexington town, MA
Malden city, MA
Marlborough city, MA
Maynard town, MA
Medford city, MA
Melrose city, MA
Natick town, MA
Newton city, MA
North Reading town, MA
Reading town, MA
Somerville city, MA
Stoneham town, MA
Sudbury town, MA
Wakefield town, MA
Waltham city, MA
Watertown city, MA
Wayland town, MA
Weston town, MA
Wilmington town, MA
Winchester town, MA
Woburn city, MA
Norfolk County, MA (Part)
Bellingham town, MA
Braintree town, MA
Brookline town, MA
Canton town, MA
Dedham town, MA
Foxborough town, MA
Franklin city, MA
Holbrook town, MA
Medfield town, MA
Medway town, MA
Milton town, MA
Boston–Worcester–Lawrence, MA–NH–ME–CTCMSA—Con.
Boston, MA–NH PMSA—Con.
Norfolk County, MA (Part)—Con.
Needham town, MA
Norfolk town, MA
Norwood town, MA
Quincy city, MA
Randolph town, MA
Sharon town, MA
Stoughton town, MA
Walpole town, MA
Wellesley town, MA
Westwood town, MA
Weymouth town, MA
Wrentham town, MA
Plymouth County, MA (Part)
Carver town, MA
Duxbury town, MA
Hanover town, MA
Hingham town, MA
Hull town, MA
Kingston town, MA
Marshfield town, MA
Pembroke town, MA
Plymouth town, MA
Rockland town, MA
Scituate town, MA
Wareham town, MA
Suffolk County, MA
Boston city, MA
Chelsea city, MA
Revere city, MA
Winthrop town, MA
Worcester County, MA (Part)
Harvard town, MA
Milford town, MA
Rockingham County, NH (Part)
APPENDIX B B–51997 ECONOMIC CENSUS
U.S. Census Bureau, 1997 Economic Census
Boston–Worcester–Lawrence, MA–NH–ME–CTCMSA—Con.
Brockton, MA PMSA
Bristol County, MA (Part)
Easton town, MA
Raynham town, MA
Norfolk County, MA (Part)
Plymouth County, MA (Part)
Abington town, MA
Bridgewater town, MA
Brockton city, MA
East Bridgewater town, MA
Middleborough town, MA
Whitman town, MA
Fitchburg–Leominster, MA PMSA
Middlesex County, MA (Part)
Worcester County, MA (Part)
Fitchburg city, MA
Gardner city, MA
Leominster city, MA
Lawrence, MA–NH PMSA
Essex County, MA (Part)
Andover town, MA
Haverhill city, MA
Lawrence city, MA
Methuen city, MA
North Andover town, MA
Rockingham County, NH (Part)
Derry town, NH
Salem town, NH
Lowell, MA–NH PMSA
Middlesex County, MA (Part)
Billerica town, MA
Chelmsford town, MA
Dracut town, MA
Lowell city, MA
Pepperell town, MA
Tewksbury town, MA
Westford town, MA
Boston–Worcester–Lawrence, MA–NH–ME–CTCMSA—Con.
Lowell, MA–NH PMSA—Con.
Hillsborough County, NH (Part)
Pelham town, NH
Manchester, NH PMSA
Hillsborough County, NH (Part)
Bedford town, NH
Goffstown town, NH
Manchester city, NH
Merrimack County, NH (Part)
Rockingham County, NH (Part)
Londonderry town, NH
Nashua, NH PMSA
Hillsborough County, NH (Part)
Hudson town, NH
Merrimack town, NH
Milford town, NH
Nashua city, NH
New Bedford, MA PMSA
Bristol County, MA (Part)
Dartmouth town, MA
Fairhaven town, MA
New Bedford city, MA
Plymouth County, MA (Part)
Portsmouth–Rochester, NH–ME PMSA
York County, ME (Part)
York town, ME
Rockingham County, NH (Part)
Exeter town, NH
Hampton town, NH
Portsmouth city, NH
Strafford County, NH (Part)
Dover city, NH
Durham town, NH
Rochester city, NH
Somersworth city, NH
B–6 APPENDIX B 1997 ECONOMIC CENSUS
U.S. Census Bureau, 1997 Economic Census
Boston–Worcester–Lawrence, MA–NH–ME–CTCMSA—Con.
Worcester, MA–CT PMSA
Windham County, CT (Part)
Hampden County, MA (Part)
Worcester County, MA (Part)
Auburn town, MA
Charlton town, MA
Clinton town, MA
Grafton town, MA
Holden town, MA
Leicester town, MA
Millbury town, MA
Northborough town, MA
Northbridge town, MA
Oxford town, MA
Shrewsbury town, MA
Southbridge town, MA
Spencer town, MA
Uxbridge town, MA
Webster town, MA
Westborough town, MA
Worcester city, MA
Boulder–Longmont, CO PMSA
Boulder County, CO
Brazoria, TX PMSA
Brazoria County, TX
Bremerton, WA PMSA
Kitsap County, WA
Bridgeport, CT PMSA
Fairfield County, CT (Part)
Bridgeport city, CT
Fairfield town, CT
Monroe town, CT
Shelton city, CT
Stratford town, CT
Trumbull town, CT
Bridgeport, CT PMSA—Con.
New Haven County, CT (Part)
Ansonia city, CT
Derby city, CT
Milford city, CT
Seymour town, CT
Brockton, MA PMSA
Bristol County, MA (Part)
Easton town, MA
Raynham town, MA
Norfolk County, MA (Part)
Plymouth County, MA (Part)
Abington town, MA
Bridgewater town, MA
Brockton city, MA
East Bridgewater town, MA
Middleborough town, MA
Whitman town, MA
Brownsville–Harlingen–San Benito, TX MSA
Cameron County, TX
Bryan–College Station, TX MSA
Brazos County, TX
Buffalo–Niagara Falls, NY MSA
Erie County, NY
Niagara County, NY
Burlington, VT MSA
Chittenden County, VT (Part)
Burlington city, VT
Colchester town, VT
Essex Junction village, VT
South Burlington city, VT
Winooski city, VT
Franklin County, VT (Part)
St. Albans city, VT
Swanton village, VT
Grand Isle County, VT (Part)
Canton–Massillon, OH MSA
Carroll County, OH
Stark County, OH
APPENDIX B B–71997 ECONOMIC CENSUS
U.S. Census Bureau, 1997 Economic Census
Casper, WY MSA
Natrona County, WY
Cedar Rapids, IA MSA
Linn County, IA
Champaign–Urbana, IL MSA
Champaign County, IL
Charleston–North Charleston, SC MSA
Berkeley County, SC
Charleston County, SC
Dorchester County, SC
Charleston, WV MSA
Kanawha County, WV
Putnam County, WV
Charlotte–Gastonia–Rock Hill, NC–SC MSA
Cabarrus County, NC
Gaston County, NC
Lincoln County, NC
Mecklenburg County, NC
Rowan County, NC
Union County, NC
York County, SC
Charlottesville, VA MSA
Albemarle County, VA
Fluvanna County, VA
Greene County, VA
Charlottesville, VA (IC)
Chattanooga, TN–GA MSA
Catoosa County, GA
Dade County, GA
Walker County, GA
Hamilton County, TN
Marion County, TN
Cheyenne, WY MSA
Laramie County, WY
Chicago, IL PMSA
Cook County, IL
DeKalb County, IL
DuPage County, IL
Chicago, IL PMSA—Con.
Grundy County, IL
Kane County, IL
Kendall County, IL
Lake County, IL
McHenry County, IL
Will County, IL
Chicago–Gary–Kenosha, IL–IN–WI CMSA
Chicago, IL PMSA
Cook County, IL
DeKalb County, IL
DuPage County, IL
Grundy County, IL
Kane County, IL
Kendall County, IL
Lake County, IL
McHenry County, IL
Will County, IL
Gary, IN PMSA
Lake County, IN
Porter County, IN
Kankakee, IL PMSA
Kankakee County, IL
Kenosha, WI PMSA
Kenosha County, WI
Chico–Paradise, CA MSA
Butte County, CA
Cincinnati, OH–KY–IN PMSA
Dearborn County, IN
Ohio County, IN
Boone County, KY
Campbell County, KY
Gallatin County, KY
Grant County, KY
Kenton County, KY
Pendleton County, KY
Brown County, OH
Clermont County, OH
B–8 APPENDIX B 1997 ECONOMIC CENSUS
U.S. Census Bureau, 1997 Economic Census
Cincinnati, OH–KY–IN PMSA—Con.
Hamilton County, OH
Warren County, OH
Cincinnati–Hamilton, OH–KY–IN CMSA
Cincinnati, OH–KY–IN PMSA
Dearborn County, IN
Ohio County, IN
Boone County, KY
Campbell County, KY
Gallatin County, KY
Grant County, KY
Kenton County, KY
Pendleton County, KY
Brown County, OH
Clermont County, OH
Hamilton County, OH
Warren County, OH
Hamilton–Middletown, OH PMSA
Butler County, OH
Clarksville–Hopkinsville, TN–KY MSA
Christian County, KY
Montgomery County, TN
Cleveland–Lorain–Elyria, OH PMSA
Ashtabula County, OH
Cuyahoga County, OH
Geauga County, OH
Lake County, OH
Lorain County, OH
Medina County, OH
Cleveland–Akron, OH CMSA
Akron, OH PMSA
Portage County, OH
Summit County, OH
Cleveland–Lorain–Elyria, OH PMSA
Ashtabula County, OH
Cuyahoga County, OH
Geauga County, OH
Lake County, OH
Cleveland–Akron, OH CMSA—Con.
Cleveland–Lorain–Elyria, OH PMSA—Con.
Lorain County, OH
Medina County, OH
Colorado Springs, CO MSA
El Paso County, CO
Columbia, MO MSA
Boone County, MO
Columbia, SC MSA
Lexington County, SC
Richland County, SC
Columbus, GA–AL MSA
Russell County, AL
Chattahoochee County, GA
Harris County, GA
Muscogee County, GA
Columbus, OH MSA
Delaware County, OH
Fairfield County, OH
Franklin County, OH
Licking County, OH
Madison County, OH
Pickaway County, OH
Corpus Christi, TX MSA
Nueces County, TX
San Patricio County, TX
Cumberland, MD–WV MSA
Allegany County, MD
Mineral County, WV
Dallas, TX PMSA
Collin County, TX
Dallas County, TX
Denton County, TX
Ellis County, TX
Henderson County, TX
Hunt County, TX
Kaufman County, TX
Rockwall County, TX
APPENDIX B B–91997 ECONOMIC CENSUS
U.S. Census Bureau, 1997 Economic Census
Dallas–Fort Worth, TX CMSA
Dallas, TX PMSA
Collin County, TX
Dallas County, TX
Denton County, TX
Ellis County, TX
Henderson County, TX
Hunt County, TX
Kaufman County, TX
Rockwall County, TX
Fort Worth–Arlington, TX PMSA
Hood County, TX
Johnson County, TX
Parker County, TX
Tarrant County, TX
Danbury, CT PMSA
Fairfield County, CT (Part)
Bethel town, CT
Brookfield town, CT
Danbury city, CT
New Fairfield town, CT
Newtown town, CT
Ridgefield town, CT
Litchfield County, CT (Part)
New Milford town, CT
Danville, VA MSA
Pittsylvania County, VA
Danville, VA (IC)
Davenport–Moline–Rock Island, IA–IL MSA
Henry County, IL
Rock Island County, IL
Scott County, IA
Dayton–Springfield, OH MSA
Clark County, OH
Greene County, OH
Miami County, OH
Montgomery County, OH
Daytona Beach, FL MSA
Flagler County, FL
Volusia County, FL
Decatur, AL MSA
Lawrence County, AL
Morgan County, AL
Decatur, IL MSA
Macon County, IL
Denver, CO PMSA
Adams County, CO
Arapahoe County, CO
Denver County, CO
Douglas County, CO
Jefferson County, CO
Denver–Boulder–Greeley, CO CMSA
Boulder–Longmont, CO PMSA
Boulder County, CO
Denver, CO PMSA
Adams County, CO
Arapahoe County, CO
Denver County, CO
Douglas County, CO
Jefferson County, CO
Greeley, CO PMSA
Weld County, CO
Des Moines, IA MSA
Dallas County, IA
Polk County, IA
Warren County, IA
Detroit, MI PMSA
Lapeer County, MI
Macomb County, MI
Monroe County, MI
Oakland County, MI
St. Clair County, MI
Wayne County, MI
B–10 APPENDIX B 1997 ECONOMIC CENSUS
U.S. Census Bureau, 1997 Economic Census
Detroit–Ann Arbor–Flint, MI CMSA
Ann Arbor, MI PMSA
Lenawee County, MI
Livingston County, MI
Washtenaw County, MI
Detroit, MI PMSA
Lapeer County, MI
Macomb County, MI
Monroe County, MI
Oakland County, MI
St. Clair County, MI
Wayne County, MI
Flint, MI PMSA
Genesee County, MI
Dothan, AL MSA
Dale County, AL
Houston County, AL
Dover, DE MSA
Kent County, DE
Dubuque, IA MSA
Dubuque County, IA
Duluth–Superior, MN–WI MSA
St. Louis County, MN
Douglas County, WI
Dutchess County, NY PMSA
Dutchess County, NY
Eau Claire, WI MSA
Chippewa County, WI
Eau Claire County, WI
El Paso, TX MSA
El Paso County, TX
Elkhart–Goshen, IN MSA
Elkhart County, IN
Elmira, NY MSA
Chemung County, NY
Enid, OK MSA
Garfield County, OK
Erie, PA MSA
Erie County, PA
Eugene–Springfield, OR MSA
Lane County, OR
Evansville–Henderson, IN–KY MSA
Posey County, IN
Vanderburgh County, IN
Warrick County, IN
Henderson County, KY
Fargo–Moorhead, ND–MN MSA
Clay County, MN
Cass County, ND
Fayetteville, NC MSA
Cumberland County, NC
Fayetteville–Springdale–Rogers, AR MSA
Benton County, AR
Washington County, AR
Fitchburg–Leominster, MA PMSA
Middlesex County, MA (Part)
Worcester County, MA (Part)
Fitchburg city, MA
Gardner city, MA
Leominster city, MA
Flagstaff, AZ–UT MSA
Coconino County, AZ
Kane County, UT
Flint, MI PMSA
Genesee County, MI
Florence, AL MSA
Colbert County, AL
Lauderdale County, AL
Florence, SC MSA
Florence County, SC
Fort Collins–Loveland, CO MSA
Larimer County, CO
Fort Lauderdale, FL PMSA
Broward County, FL
Fort Myers–Cape Coral, FL MSA
Lee County, FL
APPENDIX B B–111997 ECONOMIC CENSUS
U.S. Census Bureau, 1997 Economic Census
Fort Pierce–Port St. Lucie, FL MSA
Martin County, FL
St. Lucie County, FL
Fort Smith, AR–OK MSA
Crawford County, AR
Sebastian County, AR
Sequoyah County, OK
Fort Walton Beach, FL MSA
Okaloosa County, FL
Fort Wayne, IN MSA
Adams County, IN
Allen County, IN
De Kalb County, IN
Huntington County, IN
Wells County, IN
Whitley County, IN
Fort Worth–Arlington, TX PMSA
Hood County, TX
Johnson County, TX
Parker County, TX
Tarrant County, TX
Fresno, CA MSA
Fresno County, CA
Madera County, CA
Gadsden, AL MSA
Etowah County, AL
Gainesville, FL MSA
Alachua County, FL
Galveston–Texas City, TX PMSA
Galveston County, TX
Gary, IN PMSA
Lake County, IN
Porter County, IN
Glens Falls, NY MSA
Warren County, NY
Washington County, NY
Goldsboro, NC MSA
Wayne County, NC
Grand Forks, ND–MN MSA
Polk County, MN
Grand Forks County, ND
Grand Junction, CO MSA
Mesa County, CO
Grand Rapids–Muskegon–Holland, MI MSA
Allegan County, MI
Kent County, MI
Muskegon County, MI
Ottawa County, MI
Great Falls, MT MSA
Cascade County, MT
Greeley, CO PMSA
Weld County, CO
Green Bay, WI MSA
Brown County, WI
Greensboro–Winston-Salem–High Point, NC MSA
Alamance County, NC
Davidson County, NC
Davie County, NC
Forsyth County, NC
Guilford County, NC
Randolph County, NC
Stokes County, NC
Yadkin County, NC
Greenville, NC MSA
Pitt County, NC
Greenville–Spartanburg–Anderson, SC MSA
Anderson County, SC
Cherokee County, SC
Greenville County, SC
Pickens County, SC
Spartanburg County, SC
Hagerstown, MD PMSA
Washington County, MD
Hamilton–Middletown, OH PMSA
Butler County, OH
B–12 APPENDIX B 1997 ECONOMIC CENSUS
U.S. Census Bureau, 1997 Economic Census
Harrisburg–Lebanon–Carlisle, PA MSA
Cumberland County, PA
Dauphin County, PA
Lebanon County, PA
Perry County, PA
Hartford, CT MSA
Hartford County, CT (Part)
Avon town, CT
Berlin town, CT
Bloomfield town, CT
Bristol city, CT
East Hartford town, CT
East Windsor town, CT
Enfield town, CT
Farmington town, CT
Glastonbury town, CT
Hartford city, CT
Manchester town, CT
New Britain city, CT
Newington town, CT
Plainville town, CT
Rocky Hill town, CT
Simsbury town, CT
Southington town, CT
South Windsor town, CT
Suffield town, CT
West Hartford town, CT
Wethersfield town, CT
Windsor town, CT
Windsor Locks town, CT
Litchfield County, CT (Part)
Plymouth town, CT
Winchester town, CT
Middlesex County, CT (Part)
Cromwell town, CT
East Hampton town, CT
Middletown city, CT
New London County, CT (Part)
Colchester town, CT
Hartford, CT MSA—Con.
Tolland County, CT (Part)
Coventry town, CT
Ellington town, CT
Mansfield town, CT
Stafford town, CT
Tolland town, CT
Vernon town, CT
Windham County, CT (Part)
Windham town, CT
Hattiesburg, MS MSA
Forrest County, MS
Lamar County, MS
Hickory–Morganton–Lenoir, NC MSA
Alexander County, NC
Burke County, NC
Caldwell County, NC
Catawba County, NC
Honolulu, HI MSA
Honolulu County, HI
Houma, LA MSA
Lafourche Parish, LA
Terrebonne Parish, LA
Houston, TX PMSA
Chambers County, TX
Fort Bend County, TX
Harris County, TX
Liberty County, TX
Montgomery County, TX
Waller County, TX
Houston–Galveston–Brazoria, TX CMSA
Brazoria, TX PMSA
Brazoria County, TX
Galveston–Texas City, TX PMSA
Galveston County, TX
Houston, TX PMSA
Chambers County, TX
Fort Bend County, TX
APPENDIX B B–131997 ECONOMIC CENSUS
U.S. Census Bureau, 1997 Economic Census
Houston–Galveston–Brazoria, TX CMSA—Con.
Houston, TX PMSA—Con.
Harris County, TX
Liberty County, TX
Montgomery County, TX
Waller County, TX
Huntington–Ashland, WV–KY–OH MSA
Boyd County, KY
Carter County, KY
Greenup County, KY
Lawrence County, OH
Cabell County, WV
Wayne County, WV
Huntsville, AL MSA
Limestone County, AL
Madison County, AL
Indianapolis, IN MSA
Boone County, IN
Hamilton County, IN
Hancock County, IN
Hendricks County, IN
Johnson County, IN
Madison County, IN
Marion County, IN
Morgan County, IN
Shelby County, IN
Iowa City, IA MSA
Johnson County, IA
Jackson, MI MSA
Jackson County, MI
Jackson, MS MSA
Hinds County, MS
Madison County, MS
Rankin County, MS
Jackson, TN MSA
Chester County, TN
Madison County, TN
Jacksonville, FL MSA
Clay County, FL
Duval County, FL
Nassau County, FL
St. Johns County, FL
Jacksonville, NC MSA
Onslow County, NC
Jamestown, NY MSA
Chautauqua County, NY
Janesville–Beloit, WI MSA
Rock County, WI
Jersey City, NJ PMSA
Hudson County, NJ
Johnson City–Kingsport–Bristol, TN–VA MSA
Carter County, TN
Hawkins County, TN
Sullivan County, TN
Unicoi County, TN
Washington County, TN
Scott County, VA
Washington County, VA
Bristol, VA (IC)
Johnstown, PA MSA
Cambria County, PA
Somerset County, PA
Jonesboro, AR MSA
Craighead County, AR
Joplin, MO MSA
Jasper County, MO
Newton County, MO
Kalamazoo–Battle Creek, MI MSA
Calhoun County, MI
Kalamazoo County, MI
Van Buren County, MI
Kankakee, IL PMSA
Kankakee County, IL
Kansas City, MO–KS MSA
Johnson County, KS
Leavenworth County, KS
B–14 APPENDIX B 1997 ECONOMIC CENSUS
U.S. Census Bureau, 1997 Economic Census
Kansas City, MO–KS MSA—Con.
Miami County, KS
Wyandotte County, KS
Cass County, MO
Clay County, MO
Clinton County, MO
Jackson County, MO
Lafayette County, MO
Platte County, MO
Ray County, MO
Kenosha, WI PMSA
Kenosha County, WI
Killeen–Temple, TX MSA
Bell County, TX
Coryell County, TX
Knoxville, TN MSA
Anderson County, TN
Blount County, TN
Knox County, TN
Loudon County, TN
Sevier County, TN
Union County, TN
Kokomo, IN MSA
Howard County, IN
Tipton County, IN
La Crosse, WI–MN MSA
Houston County, MN
La Crosse County, WI
Lafayette, LA MSA
Acadia Parish, LA
Lafayette Parish, LA
St. Landry Parish, LA
St. Martin Parish, LA
Lafayette, IN MSA
Clinton County, IN
Tippecanoe County, IN
Lake Charles, LA MSA
Calcasieu Parish, LA
Lakeland–Winter Haven, FL MSA
Polk County, FL
Lancaster, PA MSA
Lancaster County, PA
Lansing–East Lansing, MI MSA
Clinton County, MI
Eaton County, MI
Ingham County, MI
Laredo, TX MSA
Webb County, TX
Las Cruces, NM MSA
Dona Ana County, NM
Las Vegas, NV–AZ MSA
Mohave County, AZ
Clark County, NV
Nye County, NV
Lawrence, KS MSA
Douglas County, KS
Lawrence, MA–NH PMSA
Essex County, MA (Part)
Andover town, MA
Haverhill city, MA
Lawrence city, MA
Methuen city, MA
North Andover town, MA
Rockingham County, NH (Part)
Derry town, NH
Salem town, NH
Lawton, OK MSA
Comanche County, OK
Lewiston–Auburn, ME MSA
Androscoggin County, ME
Auburn city, ME
Lewiston city, ME
Lexington, KY MSA
Bourbon County, KY
Clark County, KY
APPENDIX B B–151997 ECONOMIC CENSUS
U.S. Census Bureau, 1997 Economic Census
Lexington, KY MSA—Con.
Fayette County, KY
Jessamine County, KY
Madison County, KY
Scott County, KY
Woodford County, KY
Lima, OH MSA
Allen County, OH
Auglaize County, OH
Lincoln, NE MSA
Lancaster County, NE
Little Rock–North Little Rock, AR MSA
Faulkner County, AR
Lonoke County, AR
Pulaski County, AR
Saline County, AR
Longview–Marshall, TX MSA
Gregg County, TX
Harrison County, TX
Upshur County, TX
Los Angeles–Riverside–Orange County, CA CMSA
Los Angeles–Long Beach, CA PMSA
Los Angeles County, CA
Orange County, CA PMSA
Orange County, CA
Riverside–San Bernardino, CA PMSA
Riverside County, CA
San Bernardino County, CA
Ventura, CA PMSA
Ventura County, CA
Los Angeles–Long Beach, CA PMSA
Los Angeles County, CA
Louisville, KY–IN MSA
Clark County, IN
Floyd County, IN
Harrison County, IN
Scott County, IN
Louisville, KY–IN MSA—Con.
Bullitt County, KY
Jefferson County, KY
Oldham County, KY
Lowell, MA–NH PMSA
Middlesex County, MA (Part)
Billerica town, MA
Chelmsford town, MA
Dracut town, MA
Lowell city, MA
Pepperell town, MA
Tewksbury town, MA
Westford town, MA
Hillsborough County, NH (Part)
Pelham town, NH
Lubbock, TX MSA
Lubbock County, TX
Lynchburg, VA MSA
Amherst County, VA
Bedford County, VA
Campbell County, VA
Bedford, VA (IC)
Lynchburg, VA (IC)
Macon, GA MSA
Bibb County, GA
Houston County, GA
Jones County, GA
Peach County, GA
Twiggs County, GA
Madison, WI MSA
Dane County, WI
Manchester, NH PMSA
Hillsborough County, NH (Part)
Bedford town, NH
Goffstown town, NH
Manchester city, NH
Merrimack County, NH (Part)
Rockingham County, NH (Part)
Londonderry town, NH
B–16 APPENDIX B 1997 ECONOMIC CENSUS
U.S. Census Bureau, 1997 Economic Census
Mansfield, OH MSA
Crawford County, OH
Richland County, OH
McAllen–Edinburg–Mission, TX MSA
Hidalgo County, TX
Medford–Ashland, OR MSA
Jackson County, OR
Melbourne–Titusville–Palm Bay, FL MSA
Brevard County, FL
Memphis, TN–AR–MS MSA
Crittenden County, AR
DeSoto County, MS
Fayette County, TN
Shelby County, TN
Tipton County, TN
Merced, CA MSA
Merced County, CA
Miami–Fort Lauderdale, FL CMSA
Fort Lauderdale, FL PMSA
Broward County, FL
Miami, FL PMSA
Dade County, FL
Miami, FL PMSA
Dade County, FL
Middlesex–Somerset–Hunterdon, NJ PMSA
Hunterdon County, NJ
Middlesex County, NJ
Somerset County, NJ
Milwaukee–Waukesha, WI PMSA
Milwaukee County, WI
Ozaukee County, WI
Washington County, WI
Waukesha County, WI
Milwaukee–Racine, WI CMSA
Milwaukee–Waukesha, WI PMSA
Milwaukee County, WI
Ozaukee County, WI
Washington County, WI
Waukesha County, WI
Milwaukee–Racine, WI CMSA—Con.
Racine, WI PMSA
Racine County, WI
Minneapolis–St. Paul, MN–WI MSA
Anoka County, MN
Carver County, MN
Chisago County, MN
Dakota County, MN
Hennepin County, MN
Isanti County, MN
Ramsey County, MN
Scott County, MN
Sherburne County, MN
Washington County, MN
Wright County, MN
Pierce County, WI
St. Croix County, WI
Mobile, AL MSA
Baldwin County, AL
Mobile County, AL
Modesto, CA MSA
Stanislaus County, CA
Monmouth–Ocean, NJ PMSA
Monmouth County, NJ
Ocean County, NJ
Monroe, LA MSA
Ouachita Parish, LA
Montgomery, AL MSA
Autauga County, AL
Elmore County, AL
Montgomery County, AL
Muncie, IN MSA
Delaware County, IN
Myrtle Beach, SC MSA
Horry County, SC
Naples, FL MSA
Collier County, FL
APPENDIX B B–171997 ECONOMIC CENSUS
U.S. Census Bureau, 1997 Economic Census
Nashua, NH PMSA
Hillsborough County, NH (Part)
Hudson town, NH
Merrimack town, NH
Milford town, NH
Nashua city, NH
Nashville, TN MSA
Cheatham County, TN
Davidson County, TN
Dickson County, TN
Robertson County, TN
Rutherford County, TN
Sumner County, TN
Williamson County, TN
Wilson County, TN
Nassau–Suffolk, NY PMSA
Nassau County, NY
Suffolk County, NY
New Bedford, MA PMSA
Bristol County, MA (Part)
Dartmouth town, MA
Fairhaven town, MA
New Bedford city, MA
Plymouth County, MA (Part)
New Haven–Meriden, CT PMSA
Middlesex County, CT (Part)
Clinton town, CT
New Haven County, CT (Part)
Branford town, CT
Cheshire town, CT
East Haven town, CT
Guilford town, CT
Hamden town, CT
Madison town, CT
Meriden city, CT
New Haven city, CT
North Branford town, CT
North Haven town, CT
New Haven–Meriden, CT PMSA—Con.
New Haven County, CT (Part)—Con.
Orange town, CT
Wallingford town, CT
West Haven city, CT
New London–Norwich, CT–RI MSA
Middlesex County, CT (Part)
New London County, CT (Part)
East Lyme town, CT
Groton city, CT
Groton town balance, CT
Jewett City borough, CT
Ledyard town, CT
Montville town, CT
New London city, CT
Norwich city, CT
Stonington town, CT
Waterford town, CT
Windham County, CT (Part)
Plainfield town, CT
Washington County, RI (Part)
Westerly town, RI
New Orleans, LA MSA
Jefferson Parish, LA
Orleans Parish, LA
Plaquemines Parish, LA
St. Bernard Parish, LA
St. Charles Parish, LA
St. James Parish, LA
St. John the Baptist Parish, LA
St. Tammany Parish, LA
New York, NY PMSA
Bronx County, NY
Kings County, NY
New York County, NY
Putnam County, NY
Queens County, NY
Richmond County, NY
B–18 APPENDIX B 1997 ECONOMIC CENSUS
U.S. Census Bureau, 1997 Economic Census
New York, NY PMSA—Con.
Rockland County, NY
Westchester County, NY
New York–Northern New Jersey–Long Island, NY–NJ–CT–PA CMSA
Bergen–Passaic, NJ PMSA
Bergen County, NJ
Passaic County, NJ
Bridgeport, CT PMSA
Fairfield County, CT (Part)
Bridgeport city, CT
Fairfield town, CT
Monroe town, CT
Shelton city, CT
Stratford town, CT
Trumbull town, CT
New Haven County, CT (Part)
Ansonia city, CT
Derby city, CT
Milford city, CT
Seymour town, CT
Danbury, CT PMSA
Fairfield County, CT (Part)
Bethel town, CT
Brookfield town, CT
Danbury city, CT
New Fairfield town, CT
Newtown town, CT
Ridgefield town, CT
Litchfield County, CT (Part)
New Milford town, CT
Dutchess County, NY PMSA
Dutchess County, NY
Jersey City, NJ PMSA
Hudson County, NJ
Middlesex–Somerset–Hunterdon, NJ PMSA
Hunterdon County, NJ
Middlesex County, NJ
Somerset County, NJ
New York–Northern New Jersey–Long Island, NY–NJ–CT–PA CMSA—Con.
Monmouth–Ocean, NJ PMSA
Monmouth County, NJ
Ocean County, NJ
Nassau–Suffolk, NY PMSA
Nassau County, NY
Suffolk County, NY
New Haven–Meriden, CT PMSA
Middlesex County, CT (Part)
Clinton town, CT
New Haven County, CT (Part)
Branford town, CT
Cheshire town, CT
East Haven town, CT
Guilford town, CT
Hamden town, CT
Madison town, CT
Meriden city, CT
New Haven city, CT
North Branford town, CT
North Haven town, CT
Orange town, CT
Wallingford town, CT
West Haven city, CT
New York, NY PMSA
Bronx County, NY
Kings County, NY
New York County, NY
Putnam County, NY
Queens County, NY
Richmond County, NY
Rockland County, NY
Westchester County, NY
Newark, NJ PMSA
Essex County, NJ
Morris County, NJ
Sussex County, NJ
APPENDIX B B–191997 ECONOMIC CENSUS
U.S. Census Bureau, 1997 Economic Census
New York–Northern New Jersey–Long Island, NY–NJ–CT–PA CMSA—Con.
Newark, NJ PMSA—Con.
Union County, NJ
Warren County, NJ
Newburgh, NY–PA PMSA
Orange County, NY
Pike County, PA
Stamford–Norwalk, CT PMSA
Fairfield County, CT (Part)
Darien town, CT
Greenwich town, CT
New Canaan town, CT
Norwalk city, CT
Stamford city, CT
Westport town, CT
Wilton town, CT
Trenton, NJ PMSA
Mercer County, NJ
Waterbury, CT PMSA
Litchfield County, CT (Part)
Watertown town, CT
New Haven County, CT (Part)
Naugatuck, CT
Southbury town, CT
Waterbury city, CT
Wolcott town, CT
Newark, NJ PMSA
Essex County, NJ
Morris County, NJ
Sussex County, NJ
Union County, NJ
Warren County, NJ
Newburgh, NY–PA PMSA
Orange County, NY
Pike County, PA
Norfolk–Virginia Beach–Newport News, VA–NC MSA
Currituck County, NC
Gloucester County, VA
Isle of Wight County, VA
James City County, VA
Mathews County, VA
York County, VA
Chesapeake, VA (IC)
Hampton, VA (IC)
Newport News, VA (IC)
Norfolk, VA (IC)
Poquoson, VA (IC)
Portsmouth, VA (IC)
Suffolk, VA (IC)
Virginia Beach, VA (IC)
Williamsburg, VA (IC)
Oakland, CA PMSA
Alameda County, CA
Contra Costa County, CA
Ocala, FL MSA
Marion County, FL
Odessa–Midland, TX MSA
Ector County, TX
Midland County, TX
Oklahoma City, OK MSA
Canadian County, OK
Cleveland County, OK
Logan County, OK
McClain County, OK
Oklahoma County, OK
Pottawatomie County, OK
Olympia, WA PMSA
Thurston County, WA
Omaha, NE–IA MSA
Pottawattamie County, IA
Cass County, NE
Douglas County, NE
B–20 APPENDIX B 1997 ECONOMIC CENSUS
U.S. Census Bureau, 1997 Economic Census
Omaha, NE–IA MSA—Con.
Sarpy County, NE
Washington County, NE
Orange County, CA PMSA
Orange County, CA
Orlando, FL MSA
Lake County, FL
Orange County, FL
Osceola County, FL
Seminole County, FL
Owensboro, KY MSA
Daviess County, KY
Panama City, FL MSA
Bay County, FL
Parkersburg–Marietta, WV–OH MSA
Washington County, OH
Wood County, WV
Pensacola, FL MSA
Escambia County, FL
Santa Rosa County, FL
Peoria–Pekin, IL MSA
Peoria County, IL
Tazewell County, IL
Woodford County, IL
Philadelphia, PA–NJ PMSA
Burlington County, NJ
Camden County, NJ
Gloucester County, NJ
Salem County, NJ
Bucks County, PA
Chester County, PA
Delaware County, PA
Montgomery County, PA
Philadelphia County, PA
Philadelphia–Wilmington–Atlantic City, PA–NJ–DE–MDCMSA
Atlantic–Cape May, NJ PMSA
Atlantic County, NJ
Cape May County, NJ
Philadelphia–Wilmington–Atlantic City, PA–NJ–DE–MDCMSA—Con.
Philadelphia, PA–NJ PMSA
Burlington County, NJ
Camden County, NJ
Gloucester County, NJ
Salem County, NJ
Bucks County, PA
Chester County, PA
Delaware County, PA
Montgomery County, PA
Philadelphia County, PA
Vineland–Millville–Bridgeton, NJ PMSA
Cumberland County, NJ
Wilmington–Newark, DE–MD PMSA
New Castle County, DE
Cecil County, MD
Phoenix–Mesa, AZ MSA
Maricopa County, AZ
Pinal County, AZ
Pine Bluff, AR MSA
Jefferson County, AR
Pittsburgh, PA MSA
Allegheny County, PA
Beaver County, PA
Butler County, PA
Fayette County, PA
Washington County, PA
Westmoreland County, PA
Pittsfield, MA MSA
Berkshire County, MA (Part)
Pittsfield city, MA
Pocatello, ID MSA
Bannock County, ID
Portland, ME MSA
Cumberland County, ME (Part)
Gorham town, ME
Portland city, ME
APPENDIX B B–211997 ECONOMIC CENSUS
U.S. Census Bureau, 1997 Economic Census
Portland, ME MSA—Con.
Cumberland County, ME (Part)—Con.
Scarborough town, ME
South Portland city, ME
Westbrook city, ME
Windham town, ME
York County, ME (Part)
Portland–Vancouver, OR–WA PMSA
Clackamas County, OR
Columbia County, OR
Multnomah County, OR
Washington County, OR
Yamhill County, OR
Clark County, WA
Portland–Salem, OR–WA CMSA
Portland–Vancouver, OR–WA PMSA
Clackamas County, OR
Columbia County, OR
Multnomah County, OR
Washington County, OR
Yamhill County, OR
Clark County, WA
Salem, OR PMSA
Marion County, OR
Polk County, OR
Portsmouth–Rochester, NH–ME PMSA
York County, ME (Part)
York town, ME
Rockingham County, NH (Part)
Exeter town, NH
Hampton town, NH
Portsmouth city, NH
Strafford County, NH (Part)
Dover city, NH
Durham town, NH
Rochester city, NH
Somersworth city, NH
Providence–Fall River–Warwick, RI–MA MSA
Bristol County, MA (Part)
Attleboro city, MA
Fall River city, MA
North Attleborough town, MA
Seekonk town, MA
Somerset town, MA
Swansea town, MA
Westport town, MA
Bristol County, RI
Barrington town, RI
Bristol town, RI
Warren town, RI
Kent County, RI
Coventry town, RI
East Greenwich town, RI
Warwick city, RI
West Warwick town, RI
Newport County, RI (Part)
Tiverton town, RI
Providence County, RI
Burrillville town, RI
Central Falls city, RI
Cranston city, RI
Cumberland town, RI
East Providence city, RI
Johnston town, RI
Lincoln town, RI
North Providence town, RI
North Smithfield town, RI
Pawtucket city, RI
Providence city, RI
Scituate town, RI
Smithfield town, RI
Woonsocket city, RI
Washington County, RI (Part)
Narragansett town, RI
North Kingstown town, RI
South Kingstown town, RI
B–22 APPENDIX B 1997 ECONOMIC CENSUS
U.S. Census Bureau, 1997 Economic Census
Provo–Orem, UT MSA
Utah County, UT
Pueblo, CO MSA
Pueblo County, CO
Punta Gorda, FL MSA
Charlotte County, FL
Racine, WI PMSA
Racine County, WI
Raleigh–Durham–Chapel Hill, NC MSA
Chatham County, NC
Durham County, NC
Franklin County, NC
Johnston County, NC
Orange County, NC
Wake County, NC
Rapid City, SD MSA
Pennington County, SD
Reading, PA MSA
Berks County, PA
Redding, CA MSA
Shasta County, CA
Reno, NV MSA
Washoe County, NV
Richland–Kennewick–Pasco, WA MSA
Benton County, WA
Franklin County, WA
Richmond–Petersburg, VA MSA
Charles City County, VA
Chesterfield County, VA
Dinwiddie County, VA
Goochland County, VA
Hanover County, VA
Henrico County, VA
New Kent County, VA
Powhatan County, VA
Prince George County, VA
Colonial Heights, VA (IC)
Hopewell, VA (IC)
Richmond–Petersburg, VA MSA—Con.
Petersburg, VA (IC)
Richmond, VA (IC)
Riverside–San Bernardino, CA PMSA
Riverside County, CA
San Bernardino County, CA
Roanoke, VA MSA
Botetourt County, VA
Roanoke County, VA
Roanoke, VA (IC)
Salem, VA (IC)
Rochester, MN MSA
Olmsted County, MN
Rochester, NY MSA
Genesee County, NY
Livingston County, NY
Monroe County, NY
Ontario County, NY
Orleans County, NY
Wayne County, NY
Rockford, IL MSA
Boone County, IL
Ogle County, IL
Winnebago County, IL
Rocky Mount, NC MSA
Edgecombe County, NC
Nash County, NC
Sacramento, CA PMSA
El Dorado County, CA
Placer County, CA
Sacramento County, CA
Sacramento–Yolo, CA CMSA
Sacramento, CA PMSA
El Dorado County, CA
Placer County, CA
Sacramento County, CA
Yolo, CA PMSA
Yolo County, CA
APPENDIX B B–231997 ECONOMIC CENSUS
U.S. Census Bureau, 1997 Economic Census
Saginaw–Bay City–Midland, MI MSA
Bay County, MI
Midland County, MI
Saginaw County, MI
St. Cloud, MN MSA
Benton County, MN
Stearns County, MN
St. Joseph, MO MSA
Andrew County, MO
Buchanan County, MO
St. Louis, MO–IL MSA
Clinton County, IL
Jersey County, IL
Madison County, IL
Monroe County, IL
St. Clair County, IL
Franklin County, MO
Jefferson County, MO
Lincoln County, MO
St. Charles County, MO
St. Louis County, MO
Warren County, MO
St. Louis, MO (IC)
Salem, OR PMSA
Marion County, OR
Polk County, OR
Salinas, CA MSA
Monterey County, CA
Salt Lake City–Ogden, UT MSA
Davis County, UT
Salt Lake County, UT
Weber County, UT
San Angelo, TX MSA
Tom Green County, TX
San Antonio, TX MSA
Bexar County, TX
Comal County, TX
Guadalupe County, TX
Wilson County, TX
San Diego, CA MSA
San Diego County, CA
San Francisco, CA PMSA
Marin County, CA
San Francisco County, CA
San Mateo County, CA
San Francisco–Oakland–San Jose, CA CMSA
Oakland, CA PMSA
Alameda County, CA
Contra Costa County, CA
San Francisco, CA PMSA
Marin County, CA
San Francisco County, CA
San Mateo County, CA
San Jose, CA PMSA
Santa Clara County, CA
Santa Cruz–Watsonville, CA PMSA
Santa Cruz County, CA
Santa Rosa, CA PMSA
Sonoma County, CA
Vallejo–Fairfield–Napa, CA PMSA
Napa County, CA
Solano County, CA
San Jose, CA PMSA
Santa Clara County, CA
San Luis Obispo–Atascadero–Paso Robles, CA MSA
San Luis Obispo County, CA
Santa Barbara–Santa Maria–Lompoc, CA MSA
Santa Barbara County, CA
Santa Cruz–Watsonville, CA PMSA
Santa Cruz County, CA
Santa Fe, NM MSA
Los Alamos County, NM
Santa Fe County, NM
Santa Rosa, CA PMSA
Sonoma County, CA
B–24 APPENDIX B 1997 ECONOMIC CENSUS
U.S. Census Bureau, 1997 Economic Census
Sarasota–Bradenton, FL MSA
Manatee County, FL
Sarasota County, FL
Savannah, GA MSA
Bryan County, GA
Chatham County, GA
Effingham County, GA
Scranton–Wilkes-Barre–Hazleton, PA MSA
Columbia County, PA
Lackawanna County, PA
Luzerne County, PA
Wyoming County, PA
Seattle–Bellevue–Everett, WA PMSA
Island County, WA
King County, WA
Snohomish County, WA
Seattle–Tacoma–Bremerton, WA CMSA
Bremerton, WA PMSA
Kitsap County, WA
Olympia, WA PMSA
Thurston County, WA
Seattle–Bellevue–Everett, WA PMSA
Island County, WA
King County, WA
Snohomish County, WA
Tacoma, WA PMSA
Pierce County, WA
Sharon, PA MSA
Mercer County, PA
Sheboygan, WI MSA
Sheboygan County, WI
Sherman–Denison, TX MSA
Grayson County, TX
Shreveport–Bossier City, LA MSA
Bossier Parish, LA
Caddo Parish, LA
Webster Parish, LA
Sioux City, IA–NE MSA
Woodbury County, IA
Dakota County, NE
Sioux Falls, SD MSA
Lincoln County, SD
Minnehaha County, SD
South Bend, IN MSA
St. Joseph County, IN
Spokane, WA MSA
Spokane County, WA
Springfield, IL MSA
Menard County, IL
Sangamon County, IL
Springfield, MO MSA
Christian County, MO
Greene County, MO
Webster County, MO
Springfield, MA MSA
Franklin County, MA (Part)
Hampden County, MA (Part)
Agawam city, MA
Chicopee city, MA
East Longmeadow town, MA
Holyoke city, MA
Longmeadow town, MA
Ludlow town, MA
Palmer town, MA
Springfield city, MA
Westfield city, MA
West Springfield town, MA
Wilbraham town, MA
Hampshire County, MA (Part)
Amherst town, MA
Belchertown town, MA
Easthampton town, MA
Northampton city, MA
South Hadley town, MA
APPENDIX B B–251997 ECONOMIC CENSUS
U.S. Census Bureau, 1997 Economic Census
Stamford–Norwalk, CT PMSA
Fairfield County, CT (Part)
Darien town, CT
Greenwich town, CT
New Canaan town, CT
Norwalk city, CT
Stamford city, CT
Westport town, CT
Wilton town, CT
State College, PA MSA
Centre County, PA
Steubenville–Weirton, OH–WV MSA
Jefferson County, OH
Brooke County, WV
Hancock County, WV
Stockton–Lodi, CA MSA
San Joaquin County, CA
Sumter, SC MSA
Sumter County, SC
Syracuse, NY MSA
Cayuga County, NY
Madison County, NY
Onondaga County, NY
Oswego County, NY
Tacoma, WA PMSA
Pierce County, WA
Tallahassee, FL MSA
Gadsden County, FL
Leon County, FL
Tampa–St. Petersburg–Clearwater, FL MSA
Hernando County, FL
Hillsborough County, FL
Pasco County, FL
Pinellas County, FL
Terre Haute, IN MSA
Clay County, IN
Vermillion County, IN
Vigo County, IN
Texarkana, TX–Texarkana, AR MSA
Miller County, AR
Bowie County, TX
Toledo, OH MSA
Fulton County, OH
Lucas County, OH
Wood County, OH
Topeka, KS MSA
Shawnee County, KS
Trenton, NJ PMSA
Mercer County, NJ
Tucson, AZ MSA
Pima County, AZ
Tulsa, OK MSA
Creek County, OK
Osage County, OK
Rogers County, OK
Tulsa County, OK
Wagoner County, OK
Tuscaloosa, AL MSA
Tuscaloosa County, AL
Tyler, TX MSA
Smith County, TX
Utica–Rome, NY MSA
Herkimer County, NY
Oneida County, NY
Vallejo–Fairfield–Napa, CA PMSA
Napa County, CA
Solano County, CA
Ventura, CA PMSA
Ventura County, CA
Victoria, TX MSA
Victoria County, TX
Vineland–Millville–Bridgeton, NJ PMSA
Cumberland County, NJ
Visalia–Tulare–Porterville, CA MSA
Tulare County, CA
B–26 APPENDIX B 1997 ECONOMIC CENSUS
U.S. Census Bureau, 1997 Economic Census
Waco, TX MSA
McLennan County, TX
Washington, DC–MD–VA–WV PMSA
District of Columbia, DC
Calvert County, MD
Charles County, MD
Frederick County, MD
Montgomery County, MD
Prince George’s County, MD
Arlington County, VA
Clarke County, VA
Culpeper County, VA
Fairfax County, VA
Fauquier County, VA
King George County, VA
Loudoun County, VA
Prince William County, VA
Spotsylvania County, VA
Stafford County, VA
Warren County, VA
Alexandria, VA (IC)
Fairfax, VA (IC)
Falls Church, VA (IC)
Fredericksburg, VA (IC)
Manassas, VA (IC)
Manassas Park, VA (IC)
Berkeley County, WV
Jefferson County, WV
Washington–Baltimore, DC–MD–VA–WV CMSA
Baltimore, MD PMSA
Anne Arundel County, MD
Baltimore County, MD
Carroll County, MD
Harford County, MD
Howard County, MD
Queen Anne’s County, MD
Baltimore, MD (IC)
Washington–Baltimore, DC–MD–VA–WV CMSA—Con.
Hagerstown, MD PMSA
Washington County, MD
Washington, DC–MD–VA–WV PMSA
District of Columbia, DC
Calvert County, MD
Charles County, MD
Frederick County, MD
Montgomery County, MD
Prince George’s County, MD
Arlington County, VA
Clarke County, VA
Culpeper County, VA
Fairfax County, VA
Fauquier County, VA
King George County, VA
Loudoun County, VA
Prince William County, VA
Spotsylvania County, VA
Stafford County, VA
Warren County, VA
Alexandria, VA (IC)
Fairfax, VA (IC)
Falls Church, VA (IC)
Fredericksburg, VA (IC)
Manassas, VA (IC)
Manassas Park, VA (IC)
Berkeley County, WV
Jefferson County, WV
Waterbury, CT PMSA
Litchfield County, CT (Part)
Watertown town, CT
New Haven County, CT (Part)
Naugatuck, CT
Southbury town, CT
Waterbury city, CT
Wolcott town, CT
APPENDIX B B–271997 ECONOMIC CENSUS
U.S. Census Bureau, 1997 Economic Census
Waterloo–Cedar Falls, IA MSA
Black Hawk County, IA
Wausau, WI MSA
Marathon County, WI
West Palm Beach–Boca Raton, FL MSA
Palm Beach County, FL
Wheeling, WV–OH MSA
Belmont County, OH
Marshall County, WV
Ohio County, WV
Wichita, KS MSA
Butler County, KS
Harvey County, KS
Sedgwick County, KS
Wichita Falls, TX MSA
Archer County, TX
Wichita County, TX
Williamsport, PA MSA
Lycoming County, PA
Wilmington–Newark, DE–MD PMSA
New Castle County, DE
Cecil County, MD
Wilmington, NC MSA
Brunswick County, NC
New Hanover County, NC
Worcester, MA–CT PMSA
Windham County, CT (Part)
Hampden County, MA (Part)
Worcester, MA–CT PMSA—Con.
Worcester County, MA (Part)
Auburn town, MA
Charlton town, MA
Clinton town, MA
Grafton town, MA
Holden town, MA
Leicester town, MA
Millbury town, MA
Northborough town, MA
Northbridge town, MA
Oxford town, MA
Shrewsbury town, MA
Southbridge town, MA
Spencer town, MA
Uxbridge town, MA
Webster town, MA
Westborough town, MA
Worcester city, MA
Yakima, WA MSA
Yakima County, WA
Yolo, CA PMSA
Yolo County, CA
York, PA MSA
York County, PA
Youngstown–Warren, OH MSA
Columbiana County, OH
Mahoning County, OH
Trumbull County, OH
Yuba City, CA MSA
Sutter County, CA
Yuba County, CA
Yuma, AZ MSA
Yuma County, AZ
B–28 APPENDIX B 1997 ECONOMIC CENSUS
U.S. Census Bureau, 1997 Economic Census
Appendix C.Geographic Notes
ALABAMA
Arab is in Cullman and Marshall Counties.
Birmingham is in Jefferson and Shelby Counties.
Boaz is in Etowah and Marshall Counties.
Childersburg is in Shelby and Talladega Counties.
Decatur is in Limestone and Morgan Counties.
Dothan is in Dale, Henry, and Houston Counties.
Enterprise is in Coffee and Dale Counties.
Glencoe is in Calhoun and Etowah Counties.
Haleyville is in Marion and Winston Counties.
Hoover is in Jefferson and Shelby Counties.
Huntsville is in Limestone and Madison Counties.
Leeds is in Jefferson, St. Clair, and Shelby Counties.
Madison is in Limestone and Madison Counties.
Oxford is in Calhoun and Talladega Counties.
Phenix City is in Lee and Russell Counties.
Piedmont is in Calhoun and Cherokee Counties.
Prattville is in Autauga and Elmore Counties.
Southside is in Calhoun and Etowah Counties.
Spanish Fort was incorporated in July 1993.
Sumiton is in Jefferson and Walker Counties.
Tallassee is in Elmore and Tallapoosa Counties.
Trussville is in Jefferson and St. Clair Counties; itannexed into St. Clair County in May 1992.
Vestavia Hills is in Jefferson and Shelby Counties.
Winfield is in Fayette and Marion Counties.
ALASKA
Skagway-Hoonah-Angoon Census Area was renamedfrom Skagway-Yakutat-Angoon Census Area in September1992 when Yakutat Borough organized from part of itsarea.
Yakutat Borough was organized from part of theSkagway-Yakutat-Angoon Census Area (renamed Skagway-Hoonah-Angoon Census Area) in September 1992.
ARIZONA
Apache Junction is in Maricopa and Pinal Counties.
Queen Creek is in Maricopa and Pinal Counties; itannexed into Pinal County in December 1993.
Sedona is in Coconino and Yavapai Counties.
ARKANSAS
Fairfield Bay is in Cleburne and Van Buren Counties; itwas incorporated in July 1993.
Springdale is in Benton and Washington Counties.
CALIFORNIA
Buellton was incorporated in February 1992.
Calabasas was incorporated in April 1991, but thischange was not submitted to the Census Bureau untilNovember 1992.
Grover Beach name was changed from Grover City inDecember 1992.
Industry does not qualify as a ‘‘place’’ for the economiccensus based on its 1990 population but is includedbecause of its dense concentration of economic activity.
Malibu was incorporated in March 1991, but this changewas not submitted to the Census Bureau until January1993.
Shasta Lake was incorporated in July 1993.
Truckee was incorporated in March 1993.
Vernon does not qualify as a ‘‘place’’ for the economiccensus based on its 1990 population but is includedbecause of its dense concentration of economic activity.
Windsor was incorporated in July 1992.
APPENDIX C C–11997 ECONOMIC CENSUS
U.S. Census Bureau, 1997 Economic Census
COLORADO
Arvada is in Adams and Jefferson Counties.
Aurora is in Adams, Arapahoe, and Douglas Counties.
Berthoud is in Larimer and Weld Counties; it annexed intoWeld County in December 1996.
Brighton is in Adams and Weld Counties.
Broomfield is in Adams, Boulder, Jefferson, and WeldCounties.
Littleton is in Arapahoe, Douglas, and Jefferson Counties.
Longmont is in Boulder and Weld Counties.
Northglenn is in Adams and Weld Counties.
Superior is in Boulder and Jefferson Counties.
Thornton is in Adams and Weld Counties.
Westminster is in Adams and Jefferson Counties.
Windsor is in Larimer and Weld Counties; it annexed intoLarimer County in November 1994.
CONNECTICUT
Danielson. See ‘‘Killingly town balance.’’
Groton. See ‘‘Groton town balance.’’
Groton town balance. The term ‘‘balance’’ after the townrefers to the portion of a town excluding an incorporatedplace recognized for the 1997 Economic Census. Grotontown balance contains all of Groton town except the incor-porated place of Groton.
Killingly town balance. The term ‘‘balance’’ after thetown refers to the portion of a town excluding an incorpo-rated place recognized for the 1997 Economic Census.Killingly town balance contains all of Killingly town exceptthe incorporated place of Danielson.
Milford. See ‘‘Milford (consolidated city).’’
Milford (consolidated city) is coextensive with Milfordtown. It includes Woodmont, which is not populousenough for separate tabulation. Therefore, ‘‘Milford’’ refersto the whole consolidated city.
DELAWARE
Milford is in Kent and Sussex Counties.
Smyrna is in Kent and New Castle Counties.
DISTRICT OF COLUMBIA
There are no geographic notes for the District of Colum-bia.
FLORIDA
Atlantic Beach. See ‘‘Jacksonville (consolidated city).’’
Aventura was incorporated in November 1995.
De Bary was incorporated in December 1993.
Deltona was incorporated in December 1995.
Jacksonville Beach. See ‘‘Jacksonville (consolidatedcity).’’
Jacksonville (balance). See ‘‘Jacksonville (consolidatedcity).’’
Jacksonville (consolidated city) is coextensive withDuval County. It includes Atlantic Beach, JacksonvilleBeach, and Neptune Beach, which are tabulated separately.‘‘Jacksonville (balance),’’ which is a place equivalent,includes Baldwin, which is not populous enough for sepa-rate tabulation.
Longboat Key is in Manatee and Sarasota Counties.
Neptune Beach. See ‘‘Jacksonville (consolidated city).’’
Pinecrest was incorporated in March 1996.
St. Pete Beach name was changed from St. PetersburgBeach in April 1994.
Wellington was incorporated in December 1995.
Weston was incorporated in September 1996.
GEORGIA
Athens-Clarke County. See ‘‘Athens-Clarke County (con-solidated city).’’
Athens-Clarke County (consolidated city) is coexten-sive with Clarke County. It includes Winterville and Bogart(part in Clarke County), which are not populous enoughfor separate tabulation. Therefore, ‘‘Athens-Clarke County’’refers to the whole consolidated city.
Atlanta is in DeKalb and Fulton Counties.
Auburn is in Barrow and Gwinnett Counties.
Augusta-Richmond County (balance). See ‘‘Augusta-Richmond County (consolidated city).’’
Augusta-Richmond County (consolidated city) iscoextensive with Richmond County. It includes Hephzibah,which is tabulated separately. ‘‘Augusta-Richmond County(balance),’’ which is a place equivalent, includes Blythe(part in Richmond County), which is not populous enoughfor separate tabulation. The governments of Augusta andRichmond County dissolved and consolidated in January1996.
Austell is in Cobb and Douglas Counties.
Bremen is in Carroll and Haralson Counties.
C–2 APPENDIX C 1997 ECONOMIC CENSUS
U.S. Census Bureau, 1997 Economic Census
GEORGIA—Con.
Buford is in Gwinnett and Hall Counties.
College Park is in Clayton and Fulton Counties.
Columbus. See ‘‘Columbus (consolidated city).’’
Columbus (consolidated city) is coextensive with Mus-cogee County. It includes Bibb City, which is not populousenough for separate tabulation. Therefore, ‘‘Columbus’’refers to the whole consolidated city.
Fitzgerald is in Ben Hill and Irwin Counties.
Fort Oglethorpe is in Catoosa and Walker Counties.
Hephzibah. See ‘‘Augusta-Richmond County (consoli-dated city).’’
LaGrange is a spelling correction from La Grange.
Lithia Springs was incorporated in February 1993.
Loganville is in Gwinnett and Walton Counties.
Macon is in Bibb and Jones Counties.
Manchester is in Meriwether and Talbot Counties.
Palmetto is in Coweta and Fulton Counties.
Perry is in Houston and Peach Counties.
Royston is in Franklin, Hart, and Madison Counties.
Social Circle is in Newton and Walton Counties.
Vidalia is in Montgomery and Toombs Counties.
Villa Rica is in Carroll and Douglas Counties.
Waycross is in Pierce and Ware Counties.
West Point is in Harris and Troup Counties.
HAWAII
Hawaii has no incorporated places in the sense of func-tioning governmental units; however, in agreement withHawaiian law, the Census Bureau reports data for ‘‘censusdesignated places’’ (CDPs) which have been designated asplace equivalents. Those CDPs, only for the state ofHawaii, with 2,500 or more population are recognized.
Honolulu CDP. Aliamanu and Fort Shafter were errone-ously reported separately as CDPs for the 1992 EconomicCensus. Aliamanu and Fort Shafter were corrected andmade part of the Honolulu CDP.
Honolulu County is coextensive with Honolulu citywhich is not recognized for the economic census; how-ever, Honolulu CDP is recognized for the economic census.
Island of Lanai. See ‘‘Maui County.’’
Island of Molokai. See ‘‘Maui County.’’
HAWAII—Con.
Maui County consists of four islands. The staterequested that two of the islands, Lanai and Molokai, berecognized as ‘‘places’’ for the economic census. Includedon the island of Molokai is the nonfunctioning county ofKalawao.
Waihee-Waiehu is a spelling correction from Waihee-Waiehue.
IDAHO
Burley is in Cassia and Minidoka Counties.
Pocatello is in Bannock and Power Counties.
ILLINOIS
Algonquin is in Kane and McHenry Counties.
Arlington Heights is in Cook and Lake Counties; itannexed into Lake County prior to 1990, but this changewas not submitted to the Census Bureau until April 1995.
Aurora is in DuPage, Kane, Kendall, and Will Counties; itannexed into Kendall and Will Counties in December 1995.
Barrington is in Cook and Lake Counties.
Barrington Hills is in Cook, Kane, Lake, and McHenryCounties.
Bartlett is in Cook, DuPage, and Kane Counties.
Batavia is in DuPage and Kane Counties.
Bedford Park does not qualify as a ‘‘place’’ for the eco-nomic census based on its 1990 population but isincluded because of its dense concentration of economicactivity.
Bensenville is in Cook and DuPage Counties.
Bolingbrook is in DuPage and Will Counties.
Buffalo Grove is in Cook and Lake Counties.
Burr Ridge is in Cook and DuPage Counties.
Casey is in Clark and Cumberland Counties.
Centralia is in Clinton, Marion, and Washington Counties.
Channahon is in Grundy and Will Counties.
Chicago is in Cook and DuPage Counties.
Coal City is in Grundy and Will Counties.
Coal Valley is in Henry and Rock Island Counties.
Collinsville is in Madison and St. Clair Counties.
Colona resulted from the merger of Green Rock (reportedin the 1992 Economic Census) and Colona (not populousenough for separate tabulation in the 1992 Economic Cen-sus) in May 1995.
APPENDIX C C–31997 ECONOMIC CENSUS
U.S. Census Bureau, 1997 Economic Census
ILLINOIS—Con.
Columbia is in Monroe and St. Clair Counties; it annexedinto St. Clair County in January 1993.
Deerfield is in Cook and Lake Counties.
Dwight is in Grundy and Livingston Counties.
East Dundee is in Cook and Kane Counties.
Elgin is in Cook and Kane Counties.
Elk Grove Village is in Cook and DuPage Counties.
Elmhurst is in Cook and DuPage Counties; it annexedinto Cook County in July 1992.
Fox Lake is in Lake and McHenry Counties.
Fox River Grove is in Lake and McHenry Counties.
Hanover Park is in Cook and DuPage Counties.
Hinsdale is in Cook and DuPage Counties.
Hoffman Estates is in Cook and Kane Counties.
Huntley is in Kane and McHenry Counties.
Island Lake is in Lake and McHenry Counties.
Joliet is in Kendall and Will Counties; it annexed into Ken-dall County in June 1996.
Lemont is in Cook, DuPage, and Will Counties.
Madison is in Madison and St. Clair Counties.
Marion is in Johnson and Williamson Counties; it annexedinto Johnson County in September 1993.
Matteson is in Cook and Will Counties; it annexed intoWill County in February 1990, but this change was notsubmitted to the Census Bureau until May 1995.
Minooka is in Grundy and Will Counties.
Montgomery is in Kane and Kendall Counties.
Naperville is in DuPage and Will Counties.
New Baden is in Clinton and St. Clair Counties.
Oak Brook is in Cook and DuPage Counties.
Orland Park is in Cook and Will Counties; it annexed intoWill County in January 1996.
Park Forest is in Cook and Will Counties.
Pekin is in Peoria and Tazewell Counties.
Peoria Heights is in Peoria, Tazewell, and WoodfordCounties.
Roselle is in Cook and DuPage Counties.
St. Charles is in DuPage and Kane Counties.
Sandwich is in DeKalb and Kendall Counties.
ILLINOIS—Con.
Sauk Village is in Cook and Will Counties.
Schaumburg is in Cook and DuPage Counties.
Steger is in Cook and Will Counties.
Streator is in La Salle and Livingston Counties.
Tinley Park is in Cook and Will Counties.
University Park is in Cook and Will Counties.
Virden is in Macoupin and Sangamon Counties.
West Peoria was incorporated in November 1993.
Wheeling is in Cook and Lake Counties.
Woodridge is in Cook, DuPage, and Will Counties; itannexed into Cook County in June 1993.
INDIANA
Batesville is in Franklin and Ripley Counties.
Beach Grove. See ‘‘Indianapolis (consolidated city).’’
Chesterfield is in Delaware and Madison Counties.
Cumberland is in Hancock and Marion Counties; see‘‘Indianapolis (consolidated city).’’
Dunkirk is in Blackford and Jay Counties.
Edinburgh is in Bartholomew and Johnson Counties.
Elwood is in Madison and Tipton Counties.
Indianapolis (balance). See ‘‘Indianapolis (consolidatedcity).’’
Indianapolis (consolidated city) includes all of MarionCounty except Beech Grove, Lawrence, Southport, andSpeedway, which are tabulated separately. The consoli-dated city includes Cumberland (part in Marion County),which also is tabulated separately. ‘‘Indianapolis (bal-ance),’’ which is a place equivalent, includes Clermont,Crows Nest, Homecroft, Meridian Hills, North Crows Nest,Rocky Ripple, Spring Hill, Warren Park, Williams Creek, andWynnedale, which are not populous enough for separatetabulation.
Lawrence. See ‘‘Indianapolis (consolidated city).’’
Nappanee is in Elkhart and Kosciusko Counties.
Southport. See ‘‘Indianapolis (consolidated city).’’
Speedway. See ‘‘Indianapolis (consolidated city).’’
IOWA
Carlisle is in Polk and Warren Counties.
Clive is in Dallas and Polk Counties.
Dyersville is in Delaware and Dubuque Counties.
C–4 APPENDIX C 1997 ECONOMIC CENSUS
U.S. Census Bureau, 1997 Economic Census
IOWA—Con.
Forest City is in Hancock and Winnebago Counties.
Grimes is in Dallas and Polk Counties.
Sheldon is in O’Brien and Sioux Counties.
Shenandoah is in Fremont and Page Counties.
Urbandale is in Dallas and Polk Counties.
West Des Moines is in Dallas and Polk Counties.
Wilton is in Cedar and Muscatine Counties.
KANSAS
Bonner Springs is in Johnson and Wyandotte Counties.
Herington is in Dickinson and Morris Counties.
Manhattan is in Pottawatomie and Riley Counties.
Mulvane is in Sedgwick and Sumner Counties.
KENTUCKY
Corbin is in Knox and Whitley Counties.
Williamstown is in Grant and Pendleton Counties; itannexed into Pendleton County in May 1993.
LOUISIANA
De Ridder is in Beauregard and Vernon Parishes.
Eunice is in Acadia and St. Landry Parishes.
New Llano is a spelling correction from Newllano.
Shreveport is in Bossier and Caddo Parishes.
St. Gabriel was incorporated in August 1994.
MAINE
There are no geographic notes for the state of Maine.
MARYLAND
Hampstead is in Baltimore and Carroll Counties.
Mount Airy is in Carroll and Frederick Counties.
Takoma Park is in Montgomery and Prince George’sCounties.
MASSACHUSETTS
There are no geographic notes for the state of Massachu-setts.
MICHIGAN
Clare is in Clare and Isabella Counties.
Commerce township balance. The term ‘‘balance’’ afterthe township refers to the portion of a township excludingan incorporated place recognized for the 1997 EconomicCensus. Commerce township balance contains all of Com-merce township except the incorporated place of Wolver-ine Lake.
Eastpointe name was changed from East Detroit in July1992.
Grosse Pointe Shores is in Macomb and WayneCounties.
Holland is in Allegan and Ottawa Counties.
Lake Orion. See ‘‘Orion township balance.’’
Lansing is in Eaton and Ingham Counties.
Midland is in Bay and Midland Counties.
Milan is in Monroe and Washtenaw Counties.
Niles is in Berrien and Cass Counties.
Northville is in Oakland and Wayne Counties.
Orion township balance. The term ‘‘balance’’ after thetownship refers to the portion of a township excluding anincorporated place recognized for the 1997 Economic Cen-sus. Orion township balance contains all of Orion town-ship except the incorporated place of Lake Orion.
Oxford. See ‘‘Oxford township balance.’’
Oxford township balance. The term ‘‘balance’’ after thetownship refers to the portion of a township excluding anincorporated place recognized for the 1997 Economic Cen-sus. Oxford township balance contains all of Oxford town-ship except the incorporated place of Oxford.
Romeo. See ‘‘Washington township balance.’’
South Haven is in Allegan and Van Buren Counties.
Traverse City is in Grand Traverse and Leelanau Coun-ties.
Washington township balance. The term ‘‘balance’’after the township refers to the portion of a townshipexcluding an incorporated place recognized for the 1997Economic Census. Washington township balance containsall of Washington township except the incorporated placeof Romeo.
Wolverine Lake. See ‘‘Commerce township balance.’’
APPENDIX C C–51997 ECONOMIC CENSUS
U.S. Census Bureau, 1997 Economic Census
MINNESOTA
Blaine is in Anoka and Ramsey Counties.
Chanhassen is in Carver and Hennepin Counties.
Dayton is in Hennepin and Wright Counties.
Granite Falls is in Chippewa and Yellow Medicine Coun-ties.
Hastings is in Dakota and Washington Counties.
Lake City is in Goodhue and Wabasha Counties.
Le Sueur is in Le Sueur and Sibley Counties; it annexedinto Sibley County in October 1990, but this change wasnot submitted to the Census Bureau until June 1997.
Mankato is in Blue Earth, Le Sueur, and Nicollet Counties.
New Prague is in Le Sueur and Scott Counties.
Northfield is in Dakota and Rice Counties.
North Mankato is in Blue Earth and Nicollet Counties.
Oak Grove was incorporated in December 1993.
Princeton is in Mille Lacs and Sherburne Counties.
Rockford is in Hennepin and Wright Counties.
St. Anthony is in Hennepin and Ramsey Counties.
St. Cloud is in Benton, Sherburne, and Stearns Counties.
Sartell is in Benton and Stearns Counties.
Spring Lake Park is in Anoka and Ramsey Counties.
Staples is in Todd and Wadena Counties.
Wadena is in Otter Tail and Wadena Counties.
White Bear Lake is in Ramsey and Washington Counties.
MISSISSIPPI
Baldwyn is in Lee and Prentiss Counties.
Hattiesburg is in Forrest and Lamar Counties.
Jackson is in Hinds, Madison, and Rankin Counties.
Nettleton is in Lee and Monroe Counties.
MISSOURI
Cameron is in Clinton and DeKalb Counties.
Cape Girardeau is in Cape Girardeau and Scott Counties.
Centralia is in Audrain and Boone Counties.
MISSOURI—Con.
Crawford County is the only county outside NewEngland that is split by an MA boundary. Sullivan city, inCrawford and Franklin Counties, is completely within theSt. Louis, MO-IL MSA; the remainder of Crawford Countyoutside of Sullivan city is not in any MA. However, Craw-ford County is excluded from economic census data tabu-lations for the St. Louis, MO-IL MSA.
Excelsior Springs is in Clay and Ray Counties.
Hannibal is in Marion and Ralls Counties.
Independence is in Clay and Jackson Counties.
Jefferson City is in Callaway and Cole Counties.
Joplin is in Jasper and Newton Counties.
Kansas City is in Cass, Clay, Jackson, and Platte Coun-ties.
Lee’s Summit is in Cass and Jackson Counties.
Marceline is in Chariton and Linn Counties.
Monett is in Barry and Lawrence Counties.
Monroe City is in Marion, Monroe, and Ralls Counties.
Mountain Grove is in Texas and Wright Counties.
Oak Grove is in Jackson and Lafayette Counties.
Osage Beach is in Camden and Miller Counties.
Park Hills resulted from the merger of Flat River(reported in the 1992 Economic Census) and Elvins, Esther,and Rivermines (not populous enough for separate tabula-tion in the 1992 Economic Census) in January 1994.
Pacific is in Franklin and St. Louis Counties.
Portageville is in New Madrid and Pemiscot Counties.
Scott City is in Cape Girardeau and Scott Counties.
Sikeston is in New Madrid and Scott Counties.
Springfield is in Christian and Greene Counties.
Sugar Creek is in Clay and Jackson Counties.
Sullivan is in Crawford and Franklin Counties; see ‘‘Craw-ford County.’’
Vanadalia is in Audrain and Ralls Counties.
Wildwood was incorporated in September 1995.
Windsor is in Henry and Pettis Counties.
MONTANA
Butte-Silver Bow. See ‘‘Butte-Silver Bow (consolidatedcity).’’
C–6 APPENDIX C 1997 ECONOMIC CENSUS
U.S. Census Bureau, 1997 Economic Census
MONTANA—Con.
Butte-Silver Bow (consolidated city) is coextensivewith Silver Bow County. It includes Walkerville, which isnot populous enough for separate tabulation. Therefore,‘‘Butte-Silver Bow’’ refers to the whole consolidated city.
NEBRASKA
There are no geographic notes for the state of Nebraska.
NEVADA
West Wendover was incorporated in July 1991, but thischange was not submitted to the Census Bureau until May1992.
NEW HAMPSHIRE
There are no geographic notes for the state of New Hamp-shire.
NEW JERSEY
Glen Ridge was incorporated in May 1993.
North Caldwell was incorporated in January 1992.
NEW MEXICO
Corrales is in Bernalillo and Sandoval Counties.
Espanola is in Rio Arriba and Sante Fe Counties.
Rio Rancho is in Bernalillo and Sandoval Counties; itannexed into Bernalillo County in January 1994.
NEW YORK
Airmont. See ‘‘Ramapo town balance.’’
Amherst town balance. The term ‘‘balance’’ after thetown refers to the portion of a town excluding an incorpo-rated place recognized for the 1997 Economic Census.Amherst town balance contains all of Amherst townexcept the incorporated place of Williamsville.
Amityville. See ‘‘Babylon town balance.’’
Ardsley. See ‘‘Greenburgh town balance.’’
Attica is in Genesee and Wyoming Counties.
Babylon. See ‘‘Babylon town balance.’’
Babylon town balance. The term ‘‘balance’’ after thetown refers to the portion of a town excluding an incorpo-rated place recognized for the 1997 Economic Census.Babylon town balance contains all of Babylon town exceptthe incorporated places of Amityville, Babylon, and Lin-denhurst.
Balance of Essex County includes the former Ticond-eroga village, which disincorporated in January 1994.
NEW YORK—Con.
Baldwinsville. See ‘‘Lysander town balance’’ and ‘‘VanBuren town balance.’’
Ballston Spa. See ‘‘Milton town balance.’’
Bayville. See ‘‘Oyster Bay town balance.’’
Bellport. See ‘‘Brookhaven town balance.’’
Blasdell. See ‘‘Hamburg town balance.’’
Blooming Grove town balance. The term ‘‘balance’’after the town refers to the portion of a town excluding anincorporated place recognized for the 1997 Economic Cen-sus. Blooming Grove town balance contains all of Bloom-ing Grove town except the incorporated place of Washing-tonville.
Briarcliff Manor. See ‘‘Mount Pleasant town balance.’’
Brightwaters. See ‘‘Islip town balance.’’
Bronxville. See ‘‘Eastchester town balance.’’
Brookhaven town balance. The term ‘‘balance’’ after thetown refers to the portion of a town excluding an incorpo-rated place recognized for the 1997 Economic Census.Brookhaven town balance contains all of Brookhaven townexcept the incorporated places of Bellport, Lake Grove,Patchogue, and Port Jefferson.
Brookville. See ‘‘Oyster Bay town balance.’’
Cayuga Heights. See ‘‘Ithaca town balance.’’
Cedarhurst. See ‘‘Hempstead town balance.’’
Cheektowaga town balance. The term ‘‘balance’’ afterthe town refers to the portion of a town excluding anincorporated place recognized for the 1997 Economic Cen-sus. Cheektowaga town balance contains all of Cheek-towaga town except the incorporated places of Depew,Sloan, and Williamsville.
Chestnut Ridge. See ‘‘Ramapo town balance.’’
Chittenango. See ‘‘Sullivan town balance.’’
Cicero town balance. The term ‘‘balance’’ after the townrefers to the portion of a town excluding an incorporatedplace recognized for the 1997 Economic Census. Cicerotown balance contains all of Cicero town except the incor-porated place of North Syracuse.
Clarkstown town balance. The term ‘‘balance’’ after thetown refers to the portion of a town excluding an incorpo-rated place recognized for the 1997 Economic Census.Clarkstown town balance contains all of Clarkstown townexcept the incorporated places of Nyack and Spring Valley.
APPENDIX C C–71997 ECONOMIC CENSUS
U.S. Census Bureau, 1997 Economic Census
NEW YORK—Con.
Clay town balance. The term ‘‘balance’’ after the townrefers to the portion of a town excluding an incorporatedplace recognized for the 1997 Economic Census. Claytown balance contains all of Clay town except the incorpo-rated place of North Syracuse.
Colonie. See ‘‘Colonie town balance.’’
Colonie town balance. The term ‘‘balance’’ after thetown refers to the portion of a town excluding an incorpo-rated place recognized for the 1997 Economic Census.Colonie town balance contains all of Colonie town exceptthe incorporated places of Colonie and Menands.
Cortlandt town balance. The term ‘‘balance’’ after thetown refers to the portion of a town excluding an incorpo-rated place recognized for the 1997 Economic Census.Cortlandt town balance contains all of Cortlandt townexcept the incorporated place of Croton-on-Hudson.
Croton-on-Hudson. See ‘‘Cortlandt town balance.’’
Depew. See ‘‘Cheektowaga town balance’’ and ‘‘Lancastertown balance.’’
De Witt town balance. The term ‘‘balance’’ after the townrefers to the portion of a town excluding an incorporatedplace recognized for the 1997 Economic Census. De Witttown balance contains all of De Witt town except theincorporated place of East Syracuse.
Dobbs Ferry. See ‘‘Greenburgh town balance.’’
Eastchester town balance. The term ‘‘balance’’ after thetown refers to the portion of a town excluding an incorpo-rated place recognized for the 1997 Economic Census.Eastchester town balance contains all of Eastchester townexcept the incorporated places of Bronxville and Tucka-hoe.
East Hills. See ‘‘North Hempstead town balance’’ and‘‘Oyster Bay town balance.’’
East Rockaway. See ‘‘Hempstead town balance.’’
East Syracuse. See ‘‘De Witt town balance.’’
East Williston. See ‘‘North Hempstead town balance.’’
Ellenville. See ‘‘Shawangunk town balance.’’
Elmsford. See ‘‘Greenburgh town balance.’’
Endicott. See ‘‘Union town balance.’’
Fairport. See ‘‘Perinton town balance.’’
Farmingdale. See ‘‘Oyster Bay town balance.’’
Fayetteville. See ‘‘Manlius town balance.’’
Floral Park. See ‘‘Hempstead town balance’’ and ‘‘NorthHempstead town balance.’’
Florida. See ‘‘Warwick town balance.’’
NEW YORK—Con.
Flower Hill. See ‘‘North Hempstead town balance.’’
Freeport. See ‘‘Hempstead town balance.’’
Garden City. See ‘‘Hempstead town balance’’ and ‘‘NorthHempstead town balance.’’
Geddes town balance. The term ‘‘balance’’ after thetown refers to the portion of a town excluding an incorpo-rated place recognized for the 1997 Economic Census.Geddes town balance contains all of Geddes town exceptthe incorporated place of Solvay.
Geneva is in Ontario and Seneca Counties.
Glenville town balance. The term ‘‘balance’’ after thetown refers to the portion of a town excluding an incorpo-rated place recognized for the 1997 Economic Census.Glenville town balance contains all of Glenville townexcept the incorporated place of Scotia.
Gowanda is in Cattaraugus and Erie Counties.
Great Neck. See ‘‘North Hempstead town balance.’’
Great Neck Estates. See ‘‘North Hempstead town bal-ance.’’
Great Neck Plaza. See ‘‘North Hempstead town balance.’’
Greenburgh town balance. The term ‘‘balance’’ after thetown refers to the portion of a town excluding an incorpo-rated place recognized for the 1997 Economic Census.Greenburgh town balance contains all of Greenburgh townexcept the incorporated places of Ardsley, Dobbs Ferry,Elmsford, Hastings-on-Hudson, Irvington, and Tarrytown.
Greenwood Lake. See ‘‘Warwick town balance.’’
Hamburg. See ‘‘Hamburg town balance.’’
Hamburg town balance. The term ‘‘balance’’ after thetown refers to the portion of a town excluding an incorpo-rated place recognized for the 1997 Economic Census.Hamburg town balance contains all of Hamburg townexcept the incorporated places of Blasdell and Hamburg.
Hastings-on-Hudson. See ‘‘Greenburgh town balance.’’
Haverstraw. See ‘‘Haverstraw town balance.’’
Haverstraw town balance. The term ‘‘balance’’ after thetown refers to the portion of a town excluding an incorpo-rated place recognized for the 1997 Economic Census.Haverstraw town balance contains all of Haverstraw townexcept the incorporated places of Haverstraw, Pomona,and West Haverstraw.
Hempstead. See ‘‘Hempstead town balance.’’
C–8 APPENDIX C 1997 ECONOMIC CENSUS
U.S. Census Bureau, 1997 Economic Census
NEW YORK—Con.
Hempstead town balance. The term ‘‘balance’’ after thetown refers to the portion of a town excluding an incorpo-rated place recognized for the 1997 Economic Census.Hempstead town balance contains all of Hempstead townexcept the incorporated places of Cedarhurst, East Rock-away, Floral Park, Freeport, Garden City, Hempstead,Island Park, Lawrence, Lynbrook, Malverne, Mineola, NewHyde Park, Rockville Centre, and Valley Stream.
Huntington town balance. The term ‘‘balance’’ after thetown refers to the portion of a town excluding an incorpo-rated place recognized for the 1997 Economic Census.Huntington town balance contains all of Huntington townexcept the incorporated places of Lloyd Harbor and North-port.
Irvington. See ‘‘Greenburgh town balance.’’
Islandia. See ‘‘Islip town balance.’’
Island Park. See ‘‘Hempstead town balance.’’
Islip town balance. The term ‘‘balance’’ after the townrefers to the portion of a town excluding an incorporatedplace recognized for the 1997 Economic Census. Isliptown balance contains all of Islip town except the incorpo-rated places of Brightwaters and Islandia.
Ithaca town balance. The term ‘‘balance’’ after the townrefers to the portion of a town excluding an incorporatedplace recognized for the 1997 Economic Census. Ithacatown balance contains all of Ithaca town except the incor-porated place of Cayuga Heights.
Johnson City. See ‘‘Union town balance.’’
Kenmore. See ‘‘Tonawanda town balance.’’
Kings Point. See ‘‘North Hempstead town balance.’’
Lake Grove. See ‘‘Brookhaven town balance.’’
Lancaster. See ‘‘Lancaster town balance.’’
Lancaster town balance. The term ‘‘balance’’ after thetown refers to the portion of a town excluding an incorpo-rated place recognized for the 1997 Economic Census.Lancaster town balance contains all of Lancaster townexcept the incorporated places of Depew and Lancaster.
Larchmont. See ‘‘Mamaroneck town balance.’’
Lawrence. See ‘‘Hempstead town balance.’’
Lewiston. See ‘‘Lewiston town balance.’’
Lewiston town balance. The term ‘‘balance’’ after thetown refers to the portion of a town excluding an incorpo-rated place recognized for the 1997 Economic Census.Lewiston town balance contains all of Lewiston townexcept the incorporated place of Lewiston.
Lindenhurst. See ‘‘Babylon town balance.’’
NEW YORK—Con.
Liverpool. See ‘‘Salina town balance.’’
Lloyd Harbor. See ‘‘Huntington town balance.’’
Lynbrook. See ‘‘Hempstead town balance.’’
Lysander town balance. The term ‘‘balance’’ after thetown refers to the portion of a town excluding an incorpo-rated place recognized for the 1997 Economic Census.Lysander town balance contains all of Lysander townexcept the incorporated place of Baldwinsville.
Malverne. See ‘‘Hempstead town balance.’’
Mamaroneck. See ‘‘Mamaroneck town balance.’’
Mamaroneck town balance. The term ‘‘balance’’ afterthe town refers to the portion of a town excluding anincorporated place recognized for the 1997 Economic Cen-sus. Mamaroneck town balance contains all of Mamaron-eck town except the incorporated places of Larchmont andMamaroneck.
Manlius. See ‘‘Manlius town balance.’’
Manlius town balance. The term ‘‘balance’’ after thetown refers to the portion of a town excluding an incorpo-rated place recognized for the 1997 Economic Census.Manlius town balance contains all of Manlius town exceptthe incorporated places of Fayetteville, Manlius, andMinoa.
Manorhaven. See ‘‘North Hempstead town balance.’’
Massapequa Park. See ‘‘Oyster Bay town balance.’’
Menands. See ‘‘Colonie town balance.’’
Milton town balance. The term ‘‘balance’’ after the townrefers to the portion of a town excluding an incorporatedplace recognized for the 1997 Economic Census. Miltontown balance contains all of Milton town except the incor-porated place of Ballston Spa.
Mineola. See ‘‘Hempstead town balance’’ and ‘‘NorthHempstead town balance.’’
Minoa. See ‘‘Manlius town balance.’’
Montebello. See ‘‘Ramapo town balance.’’
Moreau town balance. The term ‘‘balance’’ after thetown refers to the portion of a town excluding an incorpo-rated place recognized for the 1997 Economic Census.Moreau town balance contains all of Moreau town exceptthe incorporated place of South Glens Falls.
Mount Pleasant town balance. The term ‘‘balance’’ afterthe town refers to the portion of a town excluding anincorporated place recognized for the 1997 Economic Cen-sus. Mount Pleasant town balance contains all of MountPleasant town except the incorporated places of BriarcliffManor, Pleasantville, and Sleepy Hollow.
APPENDIX C C–91997 ECONOMIC CENSUS
U.S. Census Bureau, 1997 Economic Census
NEW YORK—Con.
Munsey Park. See ‘‘North Hempstead town balance.’’
Muttontown. See ‘‘Oyster Bay town balance.’’
New Hartford town balance. The term ‘‘balance’’ afterthe town refers to the portion of a town excluding anincorporated place recognized for the 1997 Economic Cen-sus. New Hartford town balance contains all of New Hart-ford town except the incorporated place of New York Mills.
New Hempstead. See ‘‘Ramapo town balance.’’
New Hyde Park. See ‘‘Hempstead town balance’’ and‘‘North Hempstead town balance.’’
New Square. See ‘‘Ramapo town balance.’’
New Windsor town balance. The term ‘‘balance’’ afterthe town refers to the portion of a town excluding anincorporated place recognized for the 1997 Economic Cen-sus. New Windsor town balance contains all of New Wind-sor town except the incorporated place of Washington-ville.
New York is in Bronx, Kings, New York, Queens, and Rich-mond Counties.
New York Mills. See ‘‘New Hartford town balance’’ and‘‘Whitestown town balance.’’
North Hempstead town balance. The term ‘‘balance’’after the town refers to the portion of a town excluding anincorporated place recognized for the 1997 Economic Cen-sus. North Hempstead town balance contains all of NorthHempstead town except the incorporated places of EastHills, East Williston, Floral Park, Flower Hill, Garden City,Great Neck, Great Neck Estates, Great Neck Plaza, KingsPoint, Manorhaven, Mineola, Munsey Park, New Hyde Park,North Hills, Old Westbury, Port Washington North, SandsPoint, Thomaston, Westbury, and Williston Park.
North Hills. See ‘‘North Hempstead town balance.’’
Northport. See ‘‘Huntington town balance.’’
North Syracuse. See ‘‘Cicero town balance’’ and ‘‘Claytown balance.’’
Nyack. See ‘‘Clarkstown town balance’’ and ‘‘Orangetowntown balance.’’
Ogden town balance. The term ‘‘balance’’ after the townrefers to the portion of a town excluding an incorporatedplace recognized for the 1997 Economic Census. Ogdentown balance contains all of Ogden town except the incor-porated place of Spencerport.
Old Westbury. See ‘‘North Hempstead town balance’’ and‘‘Oyster Bay town balance.’’
NEW YORK—Con.
Orangetown town balance. The term ‘‘balance’’ after thetown refers to the portion of a town excluding an incorpo-rated place recognized for the 1997 Economic Census.Orangetown town balance contains all of Orangetowntown except the incorporated places of Nyack and SouthNyack.
Orchard Park. See ‘‘Orchard Park town balance.’’
Orchard Park town balance. The term ‘‘balance’’ afterthe town refers to the portion of a town excluding anincorporated place recognized for the 1997 Economic Cen-sus. Orchard Park town balance contains all of OrchardPark town except the incorporated place of Orchard Park.
Owego. See ‘‘Owego town balance.’’
Owego town balance. The term ‘‘balance’’ after the townrefers to the portion of a town excluding an incorporatedplace recognized for the 1997 Economic Census. Owegotown balance contains all of Owego town except the incor-porated place of Owego.
Oyster Bay town balance. The term ‘‘balance’’ after thetown refers to the portion of a town excluding an incorpo-rated place recognized for the 1997 Economic Census.Oyster Bay town balance contains all of Oyster Bay townexcept the incorporated places of Bayville, Brookville, EastHills, Farmingdale, Massapequa Park, Muttontown, OldWestbury, and Sea Cliff.
Patchogue. See ‘‘Brookhaven town balance.’’
Perinton town balance. The term ‘‘balance’’ after thetown refers to the portion of a town excluding an incorpo-rated place recognized for the 1997 Economic Census.Perinton town balance contains all of Perinton town exceptthe incorporated place of Fairport.
Pleasantville. See ‘‘Mount Pleasant town balance.’’
Pomona. See ‘‘Haverstraw town balance’’ and ‘‘Ramapotown balance.’’
Port Jefferson. See ‘‘Brookhaven town balance.’’
Port Washington North. See ‘‘North Hempstead townbalance.’’
Poughkeepsie town balance. The term ‘‘balance’’ afterthe town refers to the portion of a town excluding anincorporated place recognized for the 1997 Economic Cen-sus. Poughkeepsie town balance contains all of Pough-keepsie town except the incorporated place of WappingersFalls.
C–10 APPENDIX C 1997 ECONOMIC CENSUS
U.S. Census Bureau, 1997 Economic Census
NEW YORK—Con.
Ramapo town balance. The term ‘‘balance’’ after thetown refers to the portion of a town excluding an incorpo-rated place recognized for the 1997 Economic Census.Ramapo town balance contains all of Ramapo town exceptthe incorporated places of Airmont, Chestnut Ridge, Mon-tebello, New Hempstead, New Square, Pomona, Sloats-burg, Spring Valley, Suffern, and Wesley Hills.
Rockville Centre. See ‘‘Hempstead town balance.’’
Salina town balance. The term ‘‘balance’’ after the townrefers to the portion of a town excluding an incorporatedplace recognized for the 1997 Economic Census. Salinatown balance contains all of Salina town except the incor-porated place of Liverpool.
Sands Point. See ‘‘North Hempstead town balance.’’
Saranac Lake is in Essex and Franklin Counties.
Saugerties. See ‘‘Saugerties town balance.’’
Saugerties town balance. The term ‘‘balance’’ after thetown refers to the portion of a town excluding an incorpo-rated place recognized for the 1997 Economic Census.Saugerties town balance contains all of Saugerties townexcept the incorporated place of Saugerties.
Scotia. See ‘‘Glenville town balance.’’
Sea Cliff. See ‘‘Oyster Bay town balance.’’
Shawangunk town balance. The term ‘‘balance’’ afterthe town refers to the portion of a town excluding anincorporated place recognized for the 1997 Economic Cen-sus. Shawangunk town balance contains all of Shawan-gunk town except the incorporated place of Ellenville.
Sleepy Hollow name was changed from North Tarrytownin December 1996; see ‘‘Mount Pleasant town balance.’’
Sloan. See ‘‘Cheektowaga town balance.’’
Sloatsburg. See ‘‘Ramapo town balance.’’
Solvay. See ‘‘Geddes town balance.’’
Southampton. See ‘‘Southampton town balance.’’
Southampton town balance. The term ‘‘balance’’ afterthe town refers to the portion of a town excluding anincorporated place recognized for the 1997 Economic Cen-sus. Southampton town balance contains all of Southamp-ton town except the incorporated place of Southampton.
South Glens Falls. See ‘‘Moreau town balance.’’
South Nyack. See ‘‘Orangetown town balance.’’
Spencerport. See ‘‘Ogden town balance.’’
Spring Valley. See ‘‘Clarkstown town balance’’ and‘‘Ramapo town balance.’’
Suffern. See ‘‘Ramapo town balance.’’
NEW YORK—Con.
Sullivan town balance. The term ‘‘balance’’ after thetown refers to the portion of a town excluding an incorpo-rated place recognized for the 1997 Economic Census.Sullivan town balance contains all of Sullivan town exceptthe incorporated place of Chittenango.
Tarrytown. See ‘‘Greenburgh town balance.’’
Thomaston. See ‘‘North Hempstead town balance.’’
Tonawanda town balance. The term ‘‘balance’’ after thetown refers to the portion of a town excluding an incorpo-rated place recognized for the 1997 Economic Census.Tonawanda town balance contains all of Tonawanda townexcept the incorporated place of Kenmore.
Tuckahoe. See ‘‘Eastchester town balance.’’
Union town balance. The term ‘‘balance’’ after the townrefers to the portion of a town excluding an incorporatedplace recognized for the 1997 Economic Census. Uniontown balance contains all of Union town except the incor-porated places of Endicott and Johnson City.
Valley Stream. See ‘‘Hempstead town balance.’’
Van Buren town balance. The term ‘‘balance’’ after thetown refers to the portion of a town excluding an incorpo-rated place recognized for the 1997 Economic Census. VanBuren town balance contains all of Van Buren town exceptthe incorporated place of Baldwinsville.
Wappingers Falls. See ‘‘Poughkeepsie town balance’’ and‘‘Wappinger town balance.’’
Wappinger town balance. The term ‘‘balance’’ after thetown refers to the portion of a town excluding an incorpo-rated place recognized for the 1997 Economic Census.Wappinger town balance contains all of Wappinger townexcept the incorporated place of Wappingers Falls.
Warwick. See ‘‘Warwick town balance.’’
Warwick town balance. The term ‘‘balance’’ after thetown refers to the portion of a town excluding an incorpo-rated place recognized for the 1997 Economic Censuses.Warwick town balance contains all of Warwick town exceptthe incorporated places of Florida, Greenwood Lake, andWarwick.
Washingtonville. See ‘‘Blooming Grove town balance’’and ‘‘New Windsor town balance.’’
Webster. See ‘‘Webster town balance.’’
Webster town balance. The term ‘‘balance’’ after thetown refers to the portion of a town excluding an incorpo-rated place recognized for the 1997 Economic Census.Webster town balance contains all of Webster town exceptthe incorporated place of Webster.
APPENDIX C C–111997 ECONOMIC CENSUS
U.S. Census Bureau, 1997 Economic Census
NEW YORK—Con.
Wesley Hills. See ‘‘Ramapo town balance.’’
Westbury. See ‘‘North Hempstead town balance.’’
West Haverstraw. See ‘‘Haverstraw town balance.’’
Whitesboro. See ‘‘Whitestown town balance.’’
Whitestown town balance. The term ‘‘balance’’ after thetown refers to the portion of a town excluding an incorpo-rated place recognized for the 1997 Economic Census.Whitestown town balance contains all of Whitestown townexcept the incorporated places of New York Mills, Whites-boro, and Yorkville.
Williamsville. See ‘‘Amherst town balance’’ and ‘‘Cheek-towaga town balance.’’
Williston Park. See ‘‘North Hempstead town balance.’’
Yorkville. See ‘‘Whitestown town balance.’’
NORTH CAROLINA
Archdale is in Guilford and Randolph Counties.
Cary is in Chatham and Wake Counties; it annexed intoChatham County in April 1995.
Chapel Hill is in Durham and Orange Counties.
Davidson is in Iredell and Mecklenburg Counties.
Durham is in Durham and Orange Counties.
Elizabeth City is in Camden and Pasquotank Counties.
Elkin is in Surry and Wilkes Counties.
Gibsonville is in Alamance and Guilford Counties.
Hickory is in Burke and Catawba Counties.
High Point is in Davidson, Forsyth, Guilford, and Ran-dolph Counties.
Kannapolis is in Cabarrus and Rowan Counties.
Kernersville is in Forsyth and Guilford Counties.
King is in Forsyth and Stokes Counties.
Kings Mountain is in Cleveland and Gaston Counties.
Long View is in Burke and Catawba Counties.
Maxton is in Robeson and Scotland Counties.
Mebane is in Alamance and Orange Counties.
Mount Olive is in Duplin and Wayne Counties.
Rocky Mount is in Edgecombe and Nash Counties.
Thomasville is in Davidson and Randolph Counties; itannexed into Randolph County in October 1996.
NORTH CAROLINA—Con.
Wallace is in Duplin and Pender Counties.
Weddington is in Mecklenburg and Union Counties.
NORTH DAKOTA
There are no geographic notes for the state of NorthDakota.
OHIO
Alliance is in Mahoning and Stark Counties.
Bellevue is in Huron and Sandusky Counties.
Blanchester is in Clinton and Warren Counties.
Bluffton is in Allen and Hancock Counties.
Buckeye Lake is in Fairfield and Licking Counties; itannexed into Fairfield County in October 1995.
Canal Winchester is in Fairfield and Franklin Counties.
Carlisle is in Montgomery and Warren Counties.
Columbiana is in Columbiana and Mahoning Counties.
Columbus is in Delaware, Fairfield, and Franklin Coun-ties.
Crestline is in Crawford and Richland Counties.
Delphos is in Allen and Van Wert Counties.
Dublin is in Delaware, Franklin, and Union Counties.
Fairfield is in Butler and Hamilton Counties.
Fostoria is in Hancock, Seneca, and Wood Counties.
Huber Heights is in Miami and Montgomery Counties.
Kettering is in Greene and Montgomery Counties.
Loudonville is in Ashland and Holmes Counties.
Loveland is in Clermont, Hamilton, and Warren Counties.
Middletown is in Butler and Warren Counties.
Milford is in Clermont and Hamilton Counties.
Minerva is in Carroll, Columbiana, and Stark Counties.
Mogadore is in Portage and Summit Counties.
Monroe is in Butler and Warren Counties.
Norton is in Summit and Wayne Counties.
Pickerington is in Fairfield and Franklin Counties.
Plain City is in Madison and Union Counties.
Reynoldsburg is in Fairfield, Franklin, and Licking Coun-ties.
Rittman is in Medina and Wayne Counties.
C–12 APPENDIX C 1997 ECONOMIC CENSUS
U.S. Census Bureau, 1997 Economic Census
OHIO—Con.
Sharonville is in Butler and Hamilton Counties.
Springboro is in Montgomery and Warren Counties.
Swanton is in Fulton and Lucas Counties.
Tallmadge is in Portage and Summit Counties.
Union is in Miami and Montgomery Counties; it annexedinto Miami County in March 1996.
Vermilion is in Erie and Lorain Counties.
Westerville is in Delaware and Franklin Counties.
Youngstown is in Mahoning and Trumbull Counties.
OKLAHOMA
Bartlesville is in Osage and Washington Counties.
Bixby is in Tulsa and Wagoner Counties.
Broken Arrow is in Tulsa and Wagoner Counties.
Catoosa is in Rogers and Wagoner Counties.
Clinton is in Custer and Washita Counties.
Collinsville is in Rogers and Tulsa Counties.
Davis is in Garvin and Murray Counties.
Drumright is in Creek and Payne Counties.
Oklahoma City is in Canadian, Cleveland, Oklahoma, andPottawatomie Counties; it was erroneously reported inMcClain County for the 1992 Economic Census.
Owasso is in Rogers and Tulsa Counties.
Piedmont is in Canadian and Kingfisher Counties.
Ponca City is in Kay and Osage Counties.
Purcell is in Cleveland and McClain Counties.
Sand Springs is in Osage and Tulsa Counties.
Skiatook is in Osage and Tulsa Counties.
Stroud is in Creek and Lincoln Counties.
Tulsa is in Osage, Rogers, and Tulsa Counties.
OREGON
Albany is in Benton and Linn Counties.
Lake Oswego is in Clackamas, Multnomah, and Washing-ton Counties.
Milwaukie is in Clackamas and Multnomah Counties.
Portland is in Clackamas, Multnomah, and WashingtonCounties.
Salem is in Marion and Polk Counties.
OREGON—Con.
Tualatin is in Clackamas and Washington Counties.
Wilsonville is in Clackamas and Washington Counties.
PENNSYLVANIA
Ashland is in Columbia and Schuylkill Counties; it waserroneously reported as never being in Columbia Countyfor the 1992 Economic Census.
Bethlehem is in Lehigh and Northampton Counties.
Ellwood City is in Beaver and Lawrence Counties.
Shippensburg is in Cumberland and Franklin Counties.
Telford is in Bucks and Montgomery Counties.
Trafford is in Allegheny and Westmoreland Counties.
RHODE ISLAND
There are no geographic notes for the state of RhodeIsland.
SOUTH CAROLINA
Andrews is in Georgetown and Williamsburg Counties.
Batesburg-Leesville is in Lexington and Saluda Coun-ties; resulted from the merger of Batesburg (reported inthe 1992 Economic Census) and Leesville (not populousenough for separate tabluation in the 1992 Economic Cen-sus) in January 1993.
Charleston is in Berkeley and Charleston Counties.
Clemson is in Anderson and Pickens Counties.
Columbia is in Lexington and Richland Counties.
Fountain Inn is in Greenville and Laurens Counties.
Goose Creek is in Berkeley and Charleston Counties.
Greer is in Greenville and Spartanburg Counties.
Honea Path is in Abbeville and Anderson Counties.
Irmo is in Lexington and Richland Counties.
North Augusta is in Aiken and Edgefield Counties.
North Charleston is in Berkeley, Charleston, andDorchester Counties.
Summerville is in Berkeley, Charleston, and DorchesterCounties.
APPENDIX C C–131997 ECONOMIC CENSUS
U.S. Census Bureau, 1997 Economic Census
SOUTH DAKOTA
Sioux Falls is in Lincoln and Minnehaha Counties.
TENNESSEE
Belle Meade. See ‘‘Nashville-Davidson (consolidatedcity).’’
Chattanooga is in Hamilton and Marion Counties; itannexed into Marion County in April 1994.
Farragut is in Knox and Loudon Counties.
Forest Hills. See ‘‘Nashville-Davidson (consolidated city).’’
Goodlettsville is in Davidson and Sumner Counties; see‘‘Nashville-Davidson (consolidated city).’’
Harriman is in Morgan and Roane Counties.
Humboldt is in Gibson and Madison Counties.
Johnson City is in Carter, Sullivan, and Washington Coun-ties.
Kingsport is in Hawkins and Sullivan Counties.
McKenzie is in Carroll, Henry, and Weakley Counties.
Millersville is in Robertson and Sumner Counties.
Morristown is in Hamblen and Jefferson Counties; itannexed into Jefferson County in July 1995.
Nashville-Davidson (balance). See ‘‘Nashville-Davidson(consolidated city).’’
Nashville-Davidson (consolidated city). The ‘‘Metro-politan Government of Nashville and Davidson County’’ iscoextensive with Davidson County. It includes BelleMeade, Forest Hills, Goodlettsville (part in DavidsonCounty), and Oak Hill, which are tabulated separately.‘‘Nashville-Davidson (balance),’’ which is a place equiva-lent, includes Berry Hill, Lakewood, and Ridgetop (part inDavidson County), which are not populous enough forseparate tabulation.
Oak Hill. See ‘‘Nashville-Davidson (consolidated city).’’
Oak Ridge is in Anderson and Roane Counties.
Oliver Springs is in Anderson, Morgan, and Roane Coun-ties.
Spring Hill is in Maury and Williamson Counties.
Sweetwater is in McMinn and Monroe Counties.
Tullahoma is in Coffee and Franklin Counties.
White House is in Robertson and Sumner Counties.
TEXAS
Abernathy is in Hale and Lubbock Counties.
Abilene is in Jones and Taylor Counties.
Amarillo is in Potter and Randall Counties.
Aransas Pass is in Aransas, Nueces, and San PatricioCounties.
Austin is in Travis and Williamson Counties.
Azle is in Parker and Tarrant Counties.
Baytown is in Chambers and Harris Counties.
Burleson is in Johnson and Tarrant Counties.
Carrollton is in Collin, Dallas, and Denton Counties.
Cedar Hill is in Dallas and Ellis Counties.
Cedar Park is in Travis and Williamson Counties.
Coppell is in Dallas and Denton Counties.
Copperas Cove is in Coryell and Lampasas Counties.
Corpus Christi is in Kleberg, Nueces, and San PatricioCounties.
Crowley is in Johnson and Tarrant Counties.
Dalhart is in Dallam and Hartley Counties.
Dallas is in Collin, Dallas, Denton, Kaufman, and RockwallCounties.
Denver City is in Gaines and Yoakum Counties; itannexed into Gaines County in December 1991, but thischange was not submitted to the Census Bureau untilOctober 1992.
Fair Oaks Ranch is in Bexar, Comal, and Kendall Coun-ties.
Flower Mound is in Dallas, Denton, and Tarrant Counties.
Fort Worth is in Denton and Tarrant Counties.
Friendswood is in Galveston and Harris Counties.
Frisco is in Collin and Denton Counties.
Garland is in Collin, Dallas, and Rockwall Counties.
Gladewater is in Gregg and Upshur Counties.
Glenn Heights is in Dallas and Ellis Counties.
Grand Prairie is in Dallas, Ellis, and Tarrant Counties.
Grapevine is in Dallas, Denton, and Tarrant Counties.
Hamlin is in Fisher and Jones Counties.
Houston is in Fort Bend, Harris, and Montgomery Coun-ties.
Katy is in Fort Bend, Harris, and Waller Counties.
C–14 APPENDIX C 1997 ECONOMIC CENSUS
U.S. Census Bureau, 1997 Economic Census
TEXAS—Con.
Kilgore is in Gregg and Rusk Counties.
League City is in Galveston and Harris Counties.
Leander is in Travis and Williamson Counties.
Lewisville is in Dallas and Denton Counties.
Longview is in Gregg and Harrison Counties.
Lytle is in Atascosa, Bexar, and Medina Counties.
McGregor is in Coryell and McLennan Counties; itannexed into Coryell County in November 1996.
Mansfield is in Ellis, Johnson, and Tarrant Counties.
Midland is in Martin and Midland Counties.
Mineral Wells is in Palo Pinto and Parker Counties.
Missouri City is in Fort Bend and Harris Counties.
Monahans is in Ward and Winkler Counties.
New Braunfels is in Comal and Guadalupe Counties.
Odessa is in Ector and Midland Counties.
Ovilla is in Dallas and Ellis Counties.
Pearland is in Brazoria and Harris Counties.
Plano is in Collin and Denton Counties.
Portland is in Nueces and San Patricio Counties.
Progreso was incorporated in November 1991, but thischange was not submitted to the Census Bureau until Sep-tember 1992.
Richardson is in Collin and Dallas Counties.
Rio Grande City was incorporated in May 1993.
Round Rock is in Travis and Williamson Counties.
Rowlett is in Dallas and Rockwall Counties.
Royse City is in Collin and Rockwall Counties.
Sachse is in Collin and Dallas Counties.
San Diego is in Duval and Jim Wells Counties.
San Marcos is in Caldwell and Hays Counties.
Schertz is in Bexar, Comal, and Guadalupe Counties.
Seabrook is in Chambers, Galveston, and Harris Counties.
Seagoville is in Dallas and Kaufman Counties.
Southlake is in Denton and Tarrant Counties.
Stafford is in Fort Bend and Harris Counties.
Stamford is in Haskell and Jones Counties.
Texas City is in Chambers and Galveston Counties; itannexed into Chambers County in October 1992.
TEXAS—Con.
Tomball is in Harris and Montgomery Counties.
Trophy Club is in Denton and Tarrant Counties.
Wichita Falls is in Wichita County; it detached fromArcher County in October 1996.
Winnsboro is in Franklin and Wood Counties.
Wylie is in Collin, Dallas, and Rockwall Counties.
Yoakum is in DeWitt and Lavaca Counties.
UTAH
Draper is in Salt Lake and Utah Counties.
Park City is in Summit and Wasatch Counties.
Taylorsville was incorporated in April 1996.
VERMONT
There are no geographic notes for the state of Vermont.
VIRGINIA
Castlewood was incorporated in April 1991, but thischange was not submitted to the Census Bureau until June1994.
Farmville is in Cumberland and Prince Edward Counties.
Halifax County includes South Boston, formerly an inde-pendent city, whose area reverted to Halifax County.
South Boston was formerly an independent city; its areareverted to Halifax County in June 1995.
WASHINGTON
Bothell is in King and Snohomish Counties.
Burien was incorporated in February 1993.
Edgewood was incorporated in February 1996.
Enumclaw is in King and Pierce Counties.
Lakewood was incorporated in February 1996.
Milton is in King and Pierce Counties.
Newcastle was incorporated in September 1994.
Pacific is in King and Pierce Counties.
Shoreline was incorporated in August 1995.
University Place was incorporated in August 1995.
Woodinville was incorporated in March 1993.
Woodland is in Clark and Cowlitz Counties.
APPENDIX C C–151997 ECONOMIC CENSUS
U.S. Census Bureau, 1997 Economic Census
WEST VIRGINIA
Huntington is in Cabell and Wayne Counties.
Nitro is in Kanawha and Putnam Counties.
Paden City is in Tyler and Wetzel Counties.
Weirton is in Brooke and Hancock Counties.
Wheeling is in Marshall and Ohio Counties.
WISCONSIN
Appleton is in Calumet, Outagamie, and WinnebagoCounties.
Bayside is in Milwaukee and Ozaukee Counties.
Berlin is in Green Lake and Waushara Counties.
Burlington is in Racine and Walworth Counties.
Columbus is in Columbia and Dodge Counties.
Eau Claire is in Chippewa and Eau Claire Counties.
Hartford is in Dodge and Washington Counties.
WISCONSIN—Con.
Kewaskum is in Fond du Lac and Washington Counties.
Kiel is in Calumet and Manitowoc Counties.
Marshfield is in Marathon and Wood Counties.
Menasha is in Calumet and Winnebago Counties.
Milwaukee is in Milwaukee, Washington, and WaukeshaCounties.
Mukwonago is in Walworth and Waukesha Counties.
New London is in Outagamie and Waupaca Counties.
River Falls is in Pierce and St. Croix Counties.
Watertown is in Dodge and Jefferson Counties.
Waupun is in Dodge and Fond du Lac Counties.
Whitewater is in Jefferson and Walworth Counties.
WYOMING
There are no geographic notes for the state of Wyoming.
C–16 APPENDIX C 1997 ECONOMIC CENSUS
U.S. Census Bureau, 1997 Economic Census
Appendix D.Questionnaires
The sample report forms are shown on the following pages.
APPENDIX D D−11997 ECONOMIC CENSUS
U.S. Census Bureau, 1997 Economic Census
1997 ECONOMIC CENSUSAPPENDIX DD–2
U.S. Census Bureau, 1997 Economic Census
OMB No. 0607-0854: Approval Expires 04/30/01
1997 SURVEY OF BUSINESS OWNERS AND SELF-EMPLOYED PERSONS
FORM MB-1(5-19-98)
U.S. DEPARTMENT OF COMMERCEBUREAU OF THE CENSUS
INSTRUCTIONS — PLEASE READ
The purpose of this questionnaire is to collect information about the gender,race, and ethnic background of business owners in the United States for theyear 1997. The business owner(s) should complete this questionnaire even ifthe business has since been sold, reorganized, or discontinued. Data providedby you will be used only for statistical purposes and will be kept strictly confidential.The race and ethnic categories have been established by the Office of Managementand Budget to assure uniform reporting to all Federal agencies.
These data are needed to evaluate the extent and growth of business ownership inorder to provide a framework for assessing and directing Federal, state, and localgovernment business assistance programs. The Small Business Administration andthe Minority Business Development Agency use these data when allocating resourcesfor their business assistance programs. The data are also widely used by private firmsand individuals to evaluate their own businesses and markets, by the media for newsstories, and by researchers and academia for determining firm characteristics.
We estimate that it will take 10 minutes or less to complete this questionnaire. If you have any commentsregarding these estimates or any other aspect of this survey, send them to the Associate Director forAdministration/Controller, Attn: Paperwork Reduction Project 0607-0854, Room 3104, Federal Building 3, Bureauof the Census, Washington, DC 20233. You are not required to respond to any information collection unless itdisplays a valid approval number from the Office of Management and Budget. This 8-digit number appears atthe top of this page.
PLEASE TURN THIS FORM OVER AND COMPLETE THE QUESTIONNAIRE
DUE DATE: 30 days after receipt of form
If you have questions aboutcompleting this report,please call or write theCensus Bureau. In anycommunication, be sure torefer to the 11-digit CensusFile Number (CFN) printedin the label to the right.
U.S. Department of CommerceBureau of the Census1201 East 10th Street
Jeffersonville, IN 47134-0001
In correspondence pertaining to this report, please refer to this Census File Number (CFN)
Please correct errors in name, address, and ZIP Code. ENTER street and number if not shown.
MB-1
§!r¨
0081
Please mail to:
For assistance, 8:30 a.m.to 7:00 p.m., eastern time.Monday through Friday:1–800–233–6132
1997 ECONOMIC CENSUS APPENDIX D D–3
U.S. Census Bureau, 1997 Economic Census
§!s¨
FORM
MB-
1 (5
-19-
98)
1.
%M
ale
Giv
e th
e pe
rcen
t of o
wne
rshi
p of
this
bus
ines
s by
gen
der
of
the
ow
ner
(s).
Perc
ent o
f ow
ners
hip
shou
ld b
e ba
sed
on th
erig
hts,
cla
ims,
inte
rest
s, o
r sto
ck in
the
busi
ness
.
%Fe
mal
e
%St
ock
publ
icly
held
or o
wne
d by
oth
er o
rgan
izatio
ns–
If gr
eate
r tha
n 50
%, S
kip to
item
5
%To
tal (
Sh
ou
ld a
dd
to
100
%)
2a.A
re a
ny o
f the
ow
ners
of t
his
busi
ness
Span
ish/
His
pani
c/La
tino
?
%Cu
ban
%M
exica
n, M
exica
n Am
., Ch
icano
%Pu
erto
Rica
n
%Sp
ania
rd
%Hi
span
ic La
tin A
mer
ican
– Sp
ecify
–(P
leas
epr
int)
%Ot
her S
pani
sh/H
ispan
ic/La
tino
– Spe
cify
–(Pl
ease
prin
t)
3.
%Af
rican
Am
./Bla
ck/N
egro
Giv
e th
e pe
rcen
t of o
wne
rshi
p of
this
bus
ines
s by
race
of
the
ow
ner
(s).
Each
ow
ner s
houl
d id
entif
y w
ith th
e on
e ra
cehe
/she
con
side
rs h
imse
lf/he
rsel
f to
be.
%Am
er. I
ndia
n or
Ala
ska
Nativ
e
%As
ian
Indi
an
%Ch
ines
e
%Fi
lipin
o
%Ja
pane
se
%Ko
rean
%Vi
etna
mes
e
%Ot
her A
sian
– Sp
ecify
–(P
leas
epr
int)
%Na
tive
Haw
aiia
n
%Ot
her P
acifi
c Isl
ande
r– S
pecif
y–
(Ple
ase
prin
t)
%W
hite
%So
me
othe
r rac
e–
Spec
ify–
(Ple
ase
prin
t)
4. M
ark
(X) t
he O
NE
box
that
refle
cts
the
nu
mb
er o
f o
wn
ers
ofth
is b
usin
ess.
6. C
ON
TAC
T PE
RSO
N–
Plea
se p
rint n
ame
of p
erso
n re
spon
sibl
e fo
r com
plet
ing
this
repo
rt.
FIRS
T NA
ME
MI
LAST
NAM
E
Sign
atur
eM
ONTH
TELE
PHON
E (In
cludi
ng a
rea
code
)
U.S
. Dep
artm
ent o
f Com
mer
ce
Bure
au o
f the
Cen
sus
1201
Eas
t 10t
h St
reet
Jeffe
rson
ville
, IN
471
34-0
001
PLEA
SE
PRIN
T A
LL E
NTR
IES
IN B
LAC
K O
R B
LUE
INK
0082
Plea
se ro
und
perc
enta
ges
to th
e ne
ares
t who
le n
umbe
r(E
xam
ple:
33-
1/3%
sho
uld
be re
porte
d as
33%
).
Giv
e th
e pe
rcen
t of o
wne
rshi
p of
this
bus
ines
s by
Sp
anis
h/H
isp
anic
/Lat
ino
ori
gin
of
the
ow
ner
(s).
2b.
No,
not
Spa
nish
/Hisp
anic/
Latin
o–
Skip
to it
em 3
Yes
– Pl
ease
con
tinue
w
ith it
em 2
b
Cont
inue
w
ith it
em 3
––
DAY
YEAR
Cont
inue
w
ith it
em 4
1 276
5. D
id a
ny o
f thi
s bu
sine
ss’s
rece
ipts
in 1
997
resu
lt fro
mbu
sine
ss c
ondu
cted
with
the
Fede
ral g
over
nmen
t?
Yes
No
38
Ple
ase
retu
rn t
his
re
po
rt i
n t
he
encl
ose
d
enve
lop
e to
:
Than
k yo
u fo
rco
mpl
etin
g th
is fo
rm.
Cont
inue
w
ith it
em 6
9 105
Mor
e th
an 1
0–
Spec
ify
4
1997 ECONOMIC CENSUSAPPENDIX DD–4
U.S. Census Bureau, 1997 Economic Census
OMB No. 0607-0854: Approval Expires 04/30/01
1997 SURVEY OF BUSINESS OWNERS AND SELF-EMPLOYED PERSONS
FORM MB-2(5-19-98)
U.S. DEPARTMENT OF COMMERCEBUREAU OF THE CENSUS
INSTRUCTIONS — PLEASE READ
The purpose of this questionnaire is to collect information about the gender,race, and ethnic background of business owners in the United States for theyear 1997. The business owner(s) should complete this questionnaire even ifthe business has since been sold, reorganized, or discontinued. Please reportthis information for the person(s) owning the majority of the rights, claims, interests,or stock in this business. Data provided by you will be used only for statisticalpurposes and will be kept strictly confidential. The race and ethnic categories havebeen established by the Office of Management and Budget to assure uniform reportingto all Federal agencies.
These data are needed to evaluate the extent and growth of business ownership inorder to provide a framework for assessing and directing Federal, state, and localgovernment business assistance programs. The Small Business Administration andthe Minority Business Development Agency use these data when allocating resourcesfor their business assistance programs. The data are also widely used by private firmsand individuals to evaluate their own businesses and markets, by the media for newsstories, and by researchers and academia for determining firm characteristics.
We estimate that it will take 10 minutes or less to complete this questionnaire. If you have any commentsregarding these estimates or any other aspect of this survey, send them to the Associate Director forAdministration/Controller, Attn: Paperwork Reduction Project 0607-0854, Room 3104, Federal Building 3, Bureauof the Census, Washington, DC 20233. You are not required to respond to any information collection unless itdisplays a valid approval number from the Office of Management and Budget. This 8-digit number appears atthe top of this page.
In correspondence pertaining to this report, please refer to this Census File Number (CFN)
Please correct errors in name, address, and ZIP Code. ENTER street and number if not shown.
MB-2DUE DATE: 30 days after receipt of form
If you have questions aboutcompleting this report,please call or write theCensus Bureau. In anycommunication, be sure torefer to the 11-digit CensusFile Number (CFN) printedin the label to the right.
U.S. Department of CommerceBureau of the Census1201 East 10th Street
Jeffersonville, IN 47134-0001
Please mail to:
For assistance, 8:30 a.m.to 7:00 p.m., eastern time.Monday through Friday:1–800–233–6132.
PLEASE TURN THIS FORM OVER AND COMPLETE THE QUESTIONNAIRE
§!t¨
0083
1997 ECONOMIC CENSUS APPENDIX D D–5
U.S. Census Bureau, 1997 Economic Census
FORM
MB-
2 (5
-19-
98)
3.
Afric
an A
m./B
lack
/Neg
ro
Mar
k (X
) the
ON
E b
ox th
at d
escr
ibes
the
race
of
the
pri
mar
y o
wn
er(s
) of
this
bus
ines
s. P
rimar
y ow
ners
not
of a
sin
gle
race
sh
ould
sel
ect t
he o
ne ra
ce h
e/sh
e co
nsid
ers
him
self/
hers
elf t
o be
.
Amer
. Ind
ian
or A
lask
a Na
tive
Asia
n In
dian
Chin
ese
Filip
ino
Japa
nese
Kore
an
Viet
nam
ese
Othe
r Asia
n–
Spec
ify–
(Ple
ase
prin
t)
Othe
r Pac
ific
Islan
der–
Spe
cify
–(P
leas
epr
int)
Som
e ot
her r
ace
– Sp
ecify
–(P
leas
epr
int)
4. M
ark
(X) t
he O
NE
box
that
refle
cts
the
nu
mb
ero
f o
wn
ers
of th
isbu
sine
ss.
1 27
Nativ
e Ha
wai
ian
Whi
te
PLEA
SE
PRIN
T A
LL E
NTR
IES
IN B
LAC
K O
R B
LUE
INK
6
5. D
id a
ny o
f thi
s bu
sine
ss’s
rece
ipts
in 1
997
resu
lt fro
mbu
sine
ss c
ondu
cted
with
the
Fede
ral g
over
nmen
t?
Yes
No
38
Ple
ase
retu
rn t
his
re
po
rt i
n t
he
encl
ose
d
enve
lop
e to
:
Than
k yo
u fo
rco
mpl
etin
g th
is fo
rm.
U.S.
Dep
artm
ent o
f Com
mer
ce
Bure
au o
f the
Cen
sus
1201
Eas
t 10t
h St
reet
Jeffe
rson
ville
, IN
4713
4-00
01
Cont
inue
w
ith it
em 6
1.
50/5
0 M
ale/
Fem
ale
– Eq
ual p
erce
nt o
f ow
ners
hip
Mar
k (X
) the
ON
E b
ox th
at b
est d
escr
ibes
the
gen
der
of
the
pri
mar
y o
wn
er(s
) of
this
bus
ines
s. P
rimar
y ow
ners
are
thos
epe
rson
s ow
ning
51
perc
ent o
r mor
e of
the
right
s, c
laim
s,in
tere
sts,
or s
tock
in th
e bu
sine
ss.
Mal
e
Fem
ale
Stoc
k pu
blicl
y he
ld o
r ow
ned
by o
ther
org
aniza
tions
. If o
wne
rshi
p by
race
and
gen
der i
s no
t ava
ilabl
e–
SKIP
to it
em 5
. Oth
erw
ise
ple
ase
answ
er it
ems
2, 3
, 4, a
nd
5. I
t is
imp
ort
ant
to c
om
ple
te a
ll it
ems.
2.
No,
not
Spa
nish
/Hisp
anic/
Latin
o
Is th
e pr
imar
y ow
ner(
s) o
f thi
s bu
sine
ss o
f Spa
nish
/ His
pani
c/La
tino
ori
gin?
Mar
k (X
) "N
o" b
ox if
not
Spa
nish
/His
pani
c/ L
atin
o.
Yes,
Cuba
n
Yes,
Mex
ican,
Mex
ican
Am.,
Chica
no
Yes,
Hisp
anic
Latin
Am
erica
n–
Spec
ify–
(Ple
ase
prin
t)
Yes,
Puer
to R
ican
Yes,
Span
iard
Yes,
Othe
r Spa
nish
/Hisp
anic/
Latin
o–
Spec
ify–
(Ple
ase
prin
t)
Ple
ase
answ
er it
ems
2, 3
, 4, a
nd
5. I
t is
imp
ort
ant
to c
om
ple
te a
ll it
ems.
6. C
ON
TAC
T PE
RSO
N–
Plea
se p
rint n
ame
of p
erso
n re
spon
sibl
e fo
r com
plet
ing
this
repo
rt.
FIRS
T NA
ME
MI
LAST
NAM
E
Sign
atur
eM
ONTH
TELE
PHON
E (In
cludi
ng a
rea
code
)
Cont
inue
w
ith it
em 3
––
9 105
Mor
e th
an 1
0–
Spec
ify
4
DAY
YEAR
§!u¨
0084
Cont
inue
w
ith it
em 4
Publication Program
1997 COMPANY STATISTICS (CS) SERIES
EC97CS-1−Company Summary
Data include all businesses (minority-, nonminority-,women-, and male-owned) and are presented by industryclassifications and/or geographic area (states, MAs, coun-ties, and places), size of firm (employment and receipts),and legal form of organization (individual proprietorships,partnerships, and corporations).
EC97CS-2−Women-Owned Business Enterprises
Data are presented by industry classifications and/orgeographic area (states, MAs, counties, and places), sizeof firm (employment and receipts), and legal form of orga-nization (individual proprietorships, partnerships, andcorporations).
Minority-Owned Business Enterprises
EC97CS-3 − BlackEC97CS-4 − HispanicEC97CS-5 − Asians and Pacific IslandersEC97CS-6 − American Indians and Alaska NativesEC97CS-7 − Summary
Data are presented by industry classifications and/orgeographic area (states, MAs, counties, and places), sizeof firm (employment and receipts), and legal form oforganization (individual proprietorships, partnerships,and corporations).
EC97CS-8−Business Expenses
This report presents operating expenses data at theNational level. Industries for which data are presented onan SIC basis are Merchant Wholesale Trade, Retail Trade,Service Industries, Communications, Transportation andWarehousing, and Travel Agencies. Industries for whichdata are presented on a NAICS (North American IndustryClassification System) basis include Manufactures, MineralIndustries, and Construction. Unpublished SIC-basedexpenses data on Auxiliary Establishments to Manufac-tures, Mineral Industries, and Construction are availableon request. Operating expenses include annual payroll,supplemental labor costs, rent, advertising, utilities, etc.Sales and receipts data also are provided, as well as inven-tories, purchases, and measures of value produced formerchant wholesale and retail trades.
ELECTRONIC MEDIA FOR THE CS SERIES
All data from the Surveys of Minority- and Women-Owned Business Enterprises reports (EC97CS-1−CS-7) andthe Business Expenses report (EC97CS-8) are available onthe Census Bureau Internet site (www.census.gov). Com-plete data from the Surveys of Minority- and Women-Owned Business Enterprises reports and most of the datafrom the Business Expenses report are available on com-pact discs (CD-ROM) for sale by the Census Bureau. Formore information, including a description of electronicand printed reports, see the Internet site, or write toU.S. Census Bureau, Washington, DC 20233-0800, or callCustomer Services at 301-457-4100.