Master Thesis by Johan Herman Storm Survey on Financial Risk Management Evidence on Derivatives Usage by Norwegian Non-Financial Firms Hand-in date: 01.12.2011 Campus: BI Oslo Examination code and name: GRA 1900 - MSc Thesis Supervisor: Paul Ehling Programme: Master of Science in Business and Economics - Major in Finance This thesis is a part of the MSc programme at BI Norwegian Business School. The school takes no responsibility for the methods used, results found and conclusions drawn.
Transcript
Master Thesis by Johan Herman Storm
Survey on Financial Risk Management
Evidence on Derivatives Usage by Norwegian Non-Financial Firms
Hand-in date: 01.12.2011
Campus: BI Oslo
Examination code and name:
GRA 1900 - MSc Thesis
Supervisor: Paul Ehling
Programme: Master of Science in Business and Economics - Major in Finance
This thesis is a part of the MSc programme at BI Norwegian Business School. The school
takes no responsibility for the methods used, results found and conclusions drawn.
Master Thesis 01.12.2011
Page i
Table of contents
SUMMARY ...................................................................................................................................... II
ACKNOWLEDGEMENTS .......................................................................................................... III
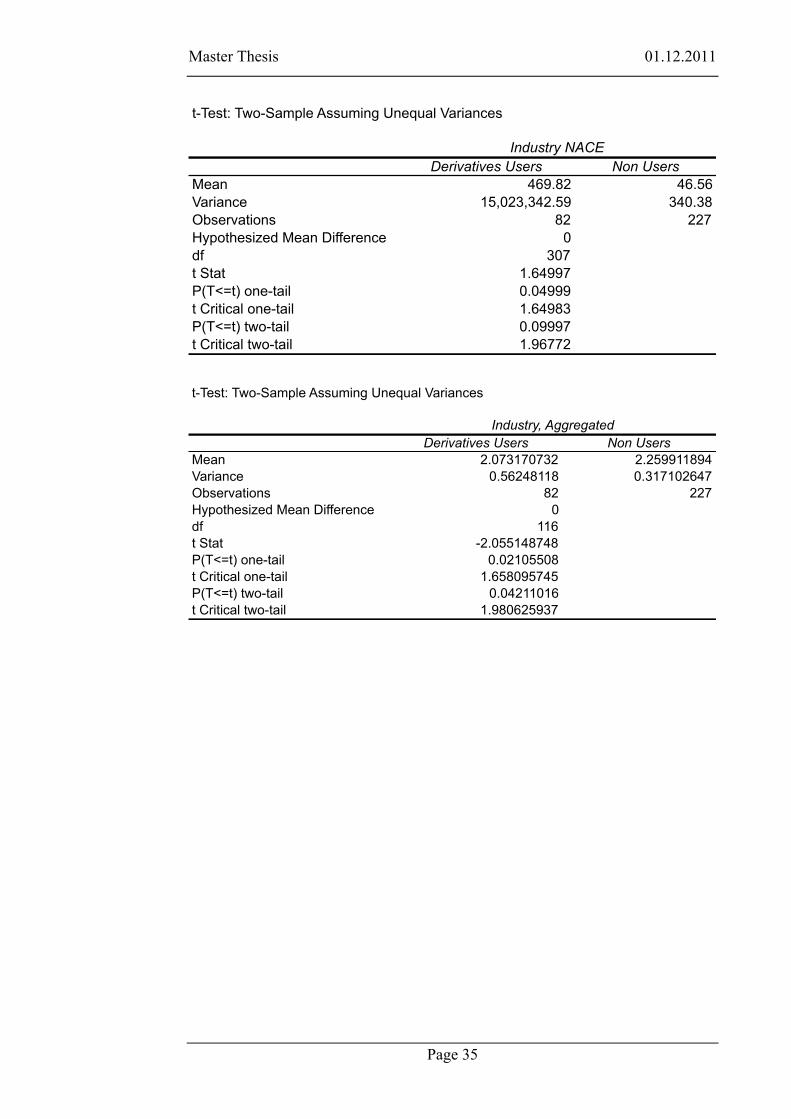
LOGIT/PROBIT MODEL, TEST OUTPUT ......................................................................................... 32 DIFFERENCE OF MEANS, TEST OUTPUT ........................................................................................ 34 QUESTIONNAIRE WITH RESPONSES .............................................................................................. 36
Master Thesis 01.12.2011
Page ii
Summary
This paper investigates risk management practices by Norwegian non-financial
firms. Using data collected from a questionnaire sent to 1205 firms with a
turnover above of 100M NOK, I document a positive relation between firm size
(economies of scale), foreign exposure, knowledge and derivatives use. I also
show that industry is a determinant of hedging. The survey indicates that
derivatives are most commonly used to reduce the volatility of the firms’ cash
flow, and that derivatives are not commonly used to speculate. I also propose that
natural hedging is a complement to derivatives use.
Master Thesis 01.12.2011
Page iii
Acknowledgements
I would like to express my gratitude and thank my supervisor Paul Ehling for the
critical feedback, kind support and guidance; and for presenting me to the
interesting field of derivatives and the idea of doing a survey on practice in
Norway. I would also like to thank my friend Erling Christiansen at UiO for help
and guidance.
Master Thesis 01.12.2011
Page 1
1 Introduction
With globalization, the importance of financial risk management has increased. In
2009 The International Swaps and Derivatives Association reported that 94% of
the world’s largest (Fortune 500) companies use derivatives to manage their risks
(FSA, Financial Services Authority 2010). Research on derivatives practice is
mostly on public firms, perceived as sophisticated enough for corporate risk
management (Bodnar et al. 1998). However, as Stulz (1996, p. 8) argues, smaller
firms have more volatile cash flows, more restricted access to capital, and thus, in
theory, more reason to buy protection (hedge) against financial risk. Thus, I
investigate derivatives practice in private firms that are smaller on average than
public firms. Financial firms are excluded as they are usually both seller and
buyer and the survey is aiming at end users (Bodnar, Hayt and Marston 1996). As
Stulz points out, practice does not seem to correspond closely to theory; large
firms make far greater use of derivatives than small firms (Stulz 1996, p. 8).
Investigating private firms with a turnover above of 100M NOK, that is medium-
sized to large firms, will provide a large enough sample. This paper will present
an analysis of the data from the questionnaire sent to the firms.
My analysis shows that large firms benefit from economies of scale associated
with the entrance costs of managing a derivatives program. In this respect, private
firms are just as public firms. Evidence shows that firms’ main motivation for
derivatives usage is to reduce volatility in cash flow, and few firms speculate with
derivatives. The evidence concerning commodity and industry effects suggests
that firms in the primary sector are more likely to use derivatives. Foreign
exposure and knowledge on derivatives are also shown to be likely determinants.
Unlike Børsum and Ødegaard (2005), I find that natural hedging seems to be a
complement to derivatives use instead of being a substitute.
The thesis relates to several recent papers that study derivatives usage among non-
financial firms. Bodnar, Hayt, et al. 1995, Bodnar, Hayt and Marston 1996 and
Bodnar, Hayt and Marston 1998 study consecutive questionnaires sent to a large
sample of listed non-financial US firms. Alkebäck and Hagelin 1999 study the
Swedish market and compare it to the US. In Norway there is little research on
Master Thesis 01.12.2011
Page 2
corporate derivatives use. Børsum and Ødegaard from the Norwegian Central
Bank performed a questionnaire-survey in 2004 (Børsum and Ødegaard 2005).
The paper is structured as follows: Chapter 2 discusses the literature review and
theoretical background. Chapter 3 describes methodology and data selection.
Chapter 4 presents the analyses and hypotheses testing. Chapter 5 concludes,
discusses limitations, implications and suggestions for further research.
Master Thesis 01.12.2011
Page 3
2 Literature Review and Theory
This chapter will present theory on risk management, literature review and
hypotheses.
2.1 Theory on Risk Management
Figure 2.1 Source: Stulz (1996)
Financial theory suggests that risk management can smooth variability in firm
value (Bartram, Brown and Fehle 2009). Theory says that risks should be
redistributed to those better equipped to handle them. Industrial companies are
unlikely to have a comparative advantage in bearing foreign-exchange risk,
interest-rate risk or commodity risk. We redistribute the risk by hedging: buying
and selling derivatives. We decrease the variance of the expected value of the
firm. This removes the tails of the distribution as Stulz (1996) describes as shown
in figure 2.1. Stulz (1996) identifies three major costs associated with higher
variability in cash flow: Higher expected bankruptcy costs, higher expected
payments to stakeholders and higher expected tax payments. If risk management
can smooth variability on terms with stakeholders it will increase firm value. As
for tax payments, risk management works in the simple way as to manage taxable
income so to ensure that the largest possible proportion of corporate income falls
within the optimal period in the business cycle.
Master Thesis 01.12.2011
Page 4
2.2 Literature Review
In 1994 the Weiss Center for International Financial Research of the Wharton
School undertook its first survey of derivatives and risk management practice by
non-financial corporations in the United States (Bodnar, Hayt and Marston 1996).
This is one of three consecutive questionnaire-surveys done by the Wharton
School. They conclude in 1995 (on the ’94 survey) that in contrast to press
reports, derivatives use is not widespread, particularly by smaller firms, and
derivatives is not commonly used to speculate, but mainly for reducing volatility
of firms’ cash flow.
In 1996, in their second survey, Bodnar et al. conclude that the percentage of
firms using derivatives is still low, but that usage is heaviest among larger firms in
the commodity and manufacturing sectors. They conclude that they believe use
will increase when knowledge increase and public perception of derivatives
improves.
An important questionnaire-survey done in Scandinavia is analysed in the paper
by Alkebäck and Hagelin from 1999. Alkebäck and Hagelin (1999, p. 105) writes:
”…knowledge about firms’ derivative practices has increased in importance to
shareholders, creditors, regulators, and other interested parties. This study on the
use of derivatives in Sweden was undertaken in response to this problem.” Firms
in Sweden operate in a small open economy with high rates of exports and
imports. Alkebäck and Hagelin (1999) conclude that derivatives use is primarily
driven by economic factors and not cultural influences. They also conclude that
use of derivatives is more common among large firms than medium or small
firms, and that this might be because of higher fixed costs of starting a derivatives
program. They also find that the greatest concern of financial directors is a lack of
knowledge about derivatives within the firm (Alkebäck and Hagelin 1999, p.
118).
The contribution to Norwegian research was done in 2004 by Børsum and
Ødegaard (2005) in a questionnaire-survey on foreign exchange risk management.
They conclude that derivatives are the most common way to hedge, with many
firms also using natural hedges. They conclude that larger firms tend to use more
derivatives and that their results are in line with international research.
Master Thesis 01.12.2011
Page 5
2.3 Hypotheses
Five specific hypotheses will be tested combining qualitative analysis with
regression modelling (logit/probit) and difference of mean testing.
Hypothesis 1: The main motivation for using derivatives is to reduce volatility in
income, costs or cash flow.
As the main motivation for using derivatives is to reduce risk, we can a priori
expect that reducing earnings/cost volatility is the main concern for firms. This
was one of the main findings in the Wharton studies (1995, 1996 and 1998) and
also supported by theoretical literature (Stulz 2003).
Hypothesis 2: There is a significant relation between firm size and derivatives
usage.
Larger firms are more likely to export/import more and will hence be more likely
to actively use derivatives. Previous studies also find this relation (Børsum and
Ødegaard 2005; Bodnar, Hayt and Marston 1998). Larger firms are more likely to
handle the entrance cost of setting up a derivatives management system
(economies of scale). This was particularly emphasized by Alkebäck and Hagelin
(1999) in their survey on derivatives use in Sweden, as they stated that less
knowledge on derivatives and a less mature derivatives market could result in
higher fixed costs when starting a derivatives program.
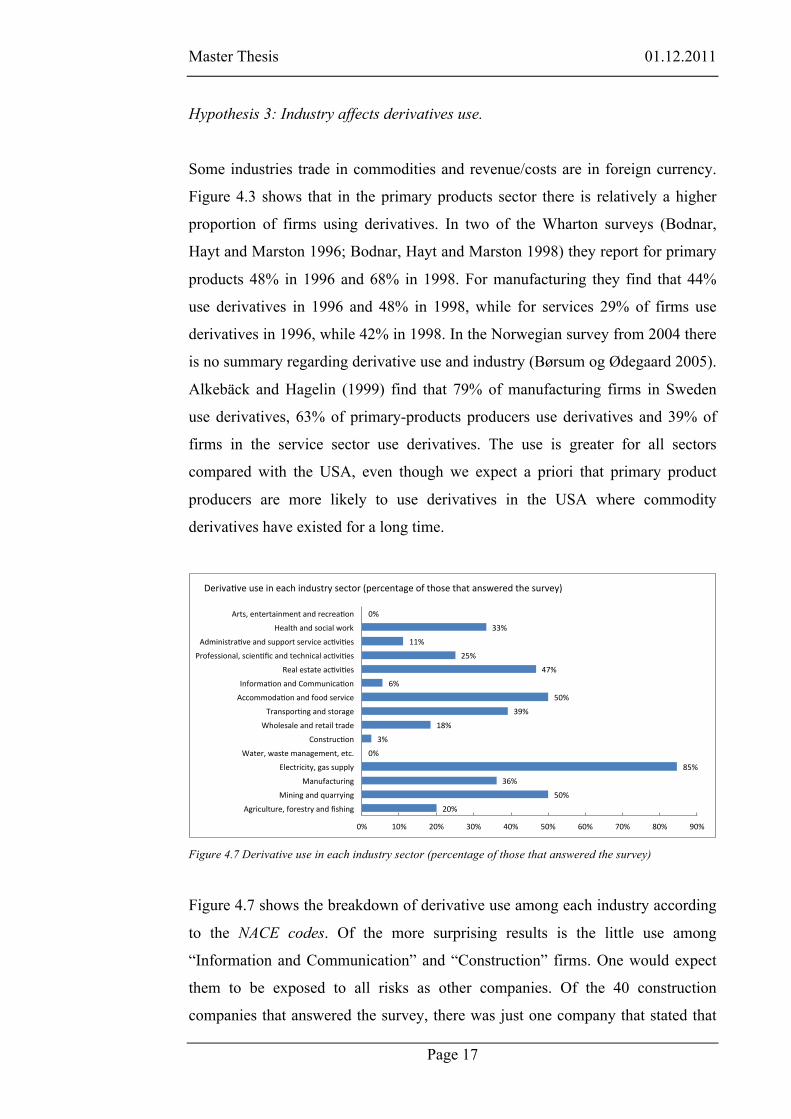
Hypothesis 3: Industry affects derivatives use.
We expect certain industries to be more exposed to risk, like electricity companies
facing volatile electricity prices or industry companies using primary products in
production. Industry will then have a significant impact on derivatives use. This is
also supported in literature (Børsum and Ødegaard 2005; Bodnar et al. 1995, 1996
Foreign exposure is a direct determinant of whether a firm faces financial risk.
Therefore we expect a priori that firms with a high proportion of foreign exposure
are more likely to use derivatives to hedge that risk.
Master Thesis 01.12.2011
Page 6
Hypothesis 5: Knowledge and focus on derivatives affects its use.
Literature suggests that limited knowledge affects firms’ use of derivatives
(Bodnar et al. 1998; Børsum and Ødegaard 2005). We propose that firms’ focus
on derivatives and their knowledge on derivatives affect how and to what extent
they use them.
Master Thesis 01.12.2011
Page 7
3 Methodology and Data
This chapter presents data selection, bias and details on the questionnaire.
3.1 Data Selection
All of the surveys reviewed in the literature review chapter focus their surveys on
large firms. In 2009 there were 362 stock exchange listed (ASA) firms in Norway
(The Brønnøysund Register Centre 2009). The idea is to investigate not only
listed firms that are perceived as the majority of derivatives users; as specifically
stated in the introduction. The decision is to define the population to non-listed
firms with a turnover of more than 100 million NOK in 2009.
Using the European Commission’s NACE codes, an international classification of
economic activities, financial firms is taken out of the population (European
Commission 2010). When using the online Norwegian database Proff Forvalt
(2010), which supplies data on all Norwegian firms, the population comes to
approximately 5000 firms. We select a probability sample by random selection of
2000 firms out of the population of approximately 5000 (Saunders, Lewis and
Thornhill 2009).
3.1.1 Survey Response
When comparing the survey response to the research presented in the literature
review chapter, we see (table 3.1 next page) that the response rate in our survey
(25.7%) is 12.3% below the mean and 6.1% below the median. A response rate of
25.7% is still satisfactory, as firms are known to avoid questionnaires1.
1 Policy stated by some respondents.
Master Thesis 01.12.2011
Page 8
Table 3.1 Response Rates, Comparison Table
3.2 Bias and Descriptive Statistics
The data will be biased if some individuals or firms are more likely to take part in
the research than others (Saunders, Lewis and Thornhill 2009). The final sample
receiving the questionnaire is affected by the fact that Proff Forvalt (2010) has
missing data for some firms. If the coverage error is to be kept at minimum, those
firms should be contacted by other means. When generalising, the sampling bias
could undermine the external validity of the analyses. If we look at descriptive
statistics for firms in table 3.2, we see that the firms with missing e-mail address
are the largest firms by average in terms of turnover.
Table 3.2 Descriptive statistics for firms in the sample, million NOK 2009.
3.3 Questionnaire
Dillman et al. (2009) writes: “The design of a questionnaire must consider how to
motivate someone who reveices it to become a respondent and complete the
survey.” An interesting substitute to interactive web surveys are fillable PDF files
which facilitates the possibility for sending both by e-mail and post. The decision
Response rateBodnar, Hayt, et al. (1995) 26.5%Bodnar, Hayt and Marston (1996) 17.5%Berkman, Bradbury and Magan (1997) 63.7%Bodnar, Hayt and Marston (1998) 20.7%Alkebäck and Hagelin (1999) 76.6%De Ceuster et al. (2000) 21.9%Børsum and Ødegaard (2005) 37.0%Eriksen and Wedøe (2010) 40.2%
Mean 38.0%Median 31.8%
Minimum Mean Median Maximum ObservationsFull Initial Sample 100.06 637.07 208.27 53,399.13 2000Final Sample 100.06 501.89 207.64 39,272.00 1204Sample Left Out (No E-Mail) 100.12 841.53 210.87 53,399.13 796
4 Analysis and Results This chapter will present the analysis of the survey results. A short description of
general results will be followed by hypotheses testing.
4.1 General Results
Figure 4.1 Derivatives usage by respondents and size
Of the 1162 firms that received the survey, 309 firms responded and 82 firms
(26.5%) state that they use derivatives. Of all respondents in terms of size2, 108
firms are from the large category, 95 are from the medium-sized category and 106
are from the small category. We see in figure 4.1 that there are a high proportion
of derivative users being large firms, while for non-users firms are more equally
distributed across size.
2 These size groups were defined based upon cutoff points that divided the entire sample of 1204 firms into three equal-sized groups. We then get large firms: turnover>300 mill. NOK, medium firms: 300 mill NOK>turnover>155 mill NOK and small firms: turnover<155 mill NOK.