19
Surveying off the galac2c plane for TeV sources within the MILAGRO data. Ahron Barber Michigan State University September 4, 2009 1
Surveyingoffthegalac2cplaneforTeVsourceswithinthe
MILAGROdata.
AhronBarberMichiganStateUniversity
September4,2009
1

UsedFermiLATBSLtofocussearch.205possiblesources
78passedselec2oncriteriabelow.
Selec2onCriteria1. MILAGRO’sviewingarea
• R.A.0°<α<360°• DEC‐9°<δ<81°(MILAGRO’sLa2tude:36°±45°)
2. Eliminatesourceswithin±10°ofgalac2cplane.
2

Milagrofor78FermiLATpointsoff‐planeatFermiLATpointandLocalMax
2*: BZQ J2232+1143 (or CTA102) & CGRaBS J0654+5042
3**:BZQ J2232+1143 (or CTA102) &BZB J0507+6737 (or 1ES 0502+675) & PKS 1508-05 (or BZQ J1510-0543)
Assumed Spectrum: 2.6 3.0 2.0 with 5 TeV cutoff
Fermi Point (FP) average significance: -0.1826±.12 -0.045±.14 0.2307±.17
Fermi Point calculated FDR sources (P cut =.05): 0 2† 1†
FDR point Name: NA Mrk421 & Mrk501 Mrk421
Milagro Local Max (MLM) average significance: 0.8655±.11 0.8492±.13 0.8364±.16
Milagro Local Max calculated FDR sources (P cut =.05):
1 (only P=.05) 4† 5†
FDR point Name: Mrk421 Mrk421, Mrk501 & 2* Mrk421, Mrk501 & 3**
†Only Mrk421 survives a FDR P cut of: .01, .005 & .001 for the 3.0 & 2.0 with 5 TeV cutoff spectra.
Stacked: not significantly different from zero
Large shift due to Local Max
3

FP
MLM
Arrows indicate FDR cutoff with a P value of .05
FermiLAT Point and Local Max Significance Plots
Significance Significance Significance
Significance Significance Significance
4

3.0spectrum
2.6spectrum
Mrk 421
Mrk 421
CGRaBS J0654+5042
Mrk 501
BZQ J2232+1143 (or CTA102)
Neighborhood of FermiLAT Points
5

BZQ J2232+1143 (or CTA102)
PKS 1508-05 (or BZQ J1510-0543)
BZB J0507+6737 (or 1ES 0502+675)
Mrk421 Mrk501
2.0spectrumwith5TeVcutoffNeighborhood of FermiLAT Points
6

Milagrofor78randompointsoff‐planeAssumed Spectrum: 2.6 3.0 2.0 with 5 TeV cutoff
Random Point (RP) average significance: 0.11±.12 0.14±.12 0.08±.10
Random Point calculated FDR sources (P cut =.05): 1 0 0
Random Point Local Max (RLM) average significance: 1.09±.10 0.99±.10 0.72±.10 Random Point Local Max calculated FDR sources (P cut =.05): 2 0 2
Assumed Spectrum: 2.6 3.0 2.0 with 5 TeV cutoff
Fermi Point (FP) average significance: -0.1826±.12 -0.045±.14 0.2307±.17
Fermi Point calculated FDR sources (P cut =.05): 0 2 1
Milagro Local Max (MLM) average significance: 0.8655±.11 0.8492±.13 0.8364±.16
Milagro Local Max calculated FDR sources (P cut =.05): 1 4 5
Ran
dom
Lis
t Fe
rmi/M
ILA
GR
O
(Res
ults
for c
ompa
rison
)
Colored rows indicate analogous data
No random points pass a Pcut of .01
Stacked: not significantly different from zero
Large shift due to Local Max
7
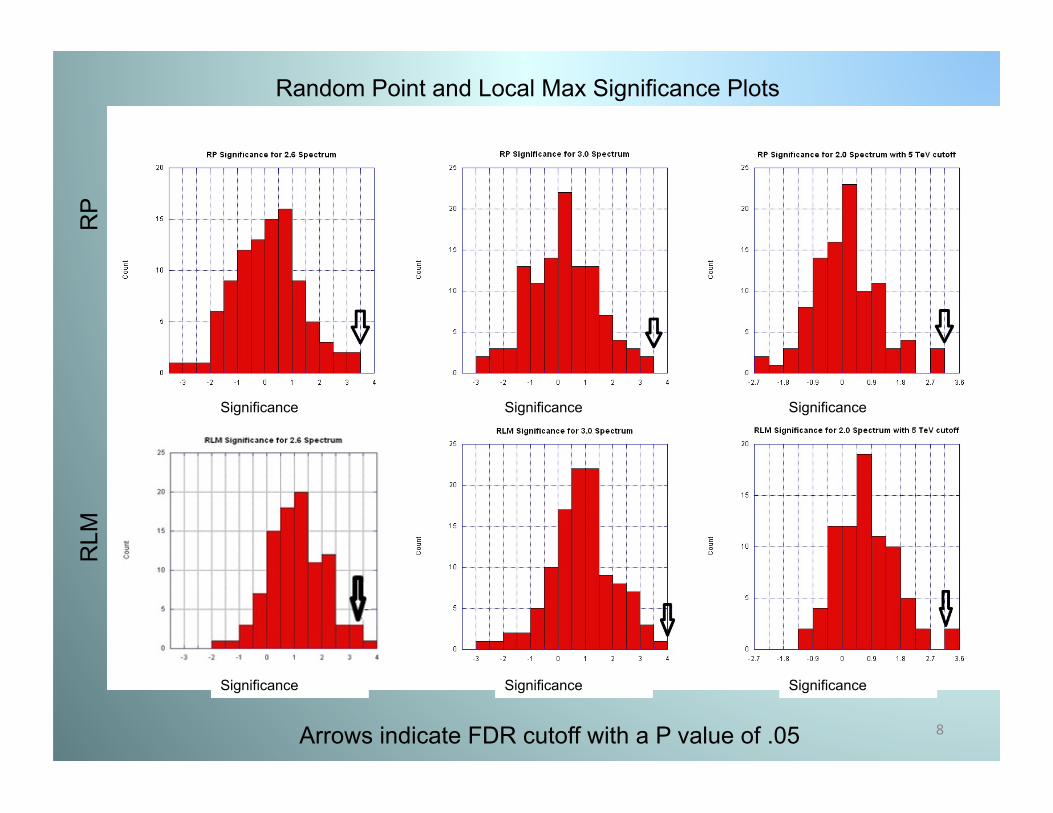
RP
RLM
Arrows indicate FDR cutoff with a P value of .05
Random Point and Local Max Significance Plots
Significance Significance Significance
Significance Significance Significance
8
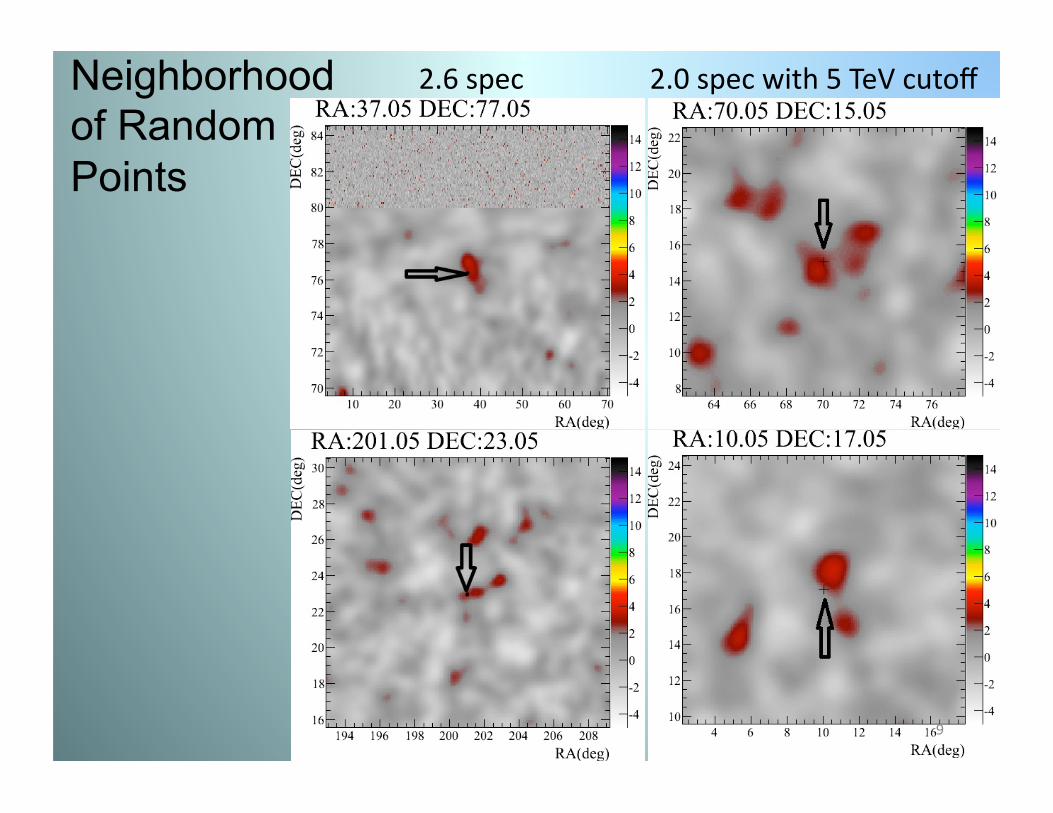
2.0specwith5TeVcutoff2.6specNeighborhood of Random Points
9

Comparingsignificancedistribu2onsforFP/RPbyKolmogorov‐Smirnovtest
Assumed Spectra 2.6 3.0 2.0 with 5 TeV
cutoff
D value P
value D value P
value D
value P value FermiLAT Point with Random Point: .1538 .2899 .1667 .2078 .3333 2.3x10⁻⁴
Milagro Local Max with Random Local Max: .1667 .2078 .1410 .3926 .0769 0.9694
These two comparisons are plotted on the following 2 slides. The spectrum of 2.0 with 5 TeV cutoff is the primary spectrum for the sources within this list. It nearly matches the local max distribution.
MatLab was used to calculate these KS values. 10

FPvs.RPsignificancedistribu2oncomparisonFP
R
P
Significance Significance Significance
Significance Significance Significance
11
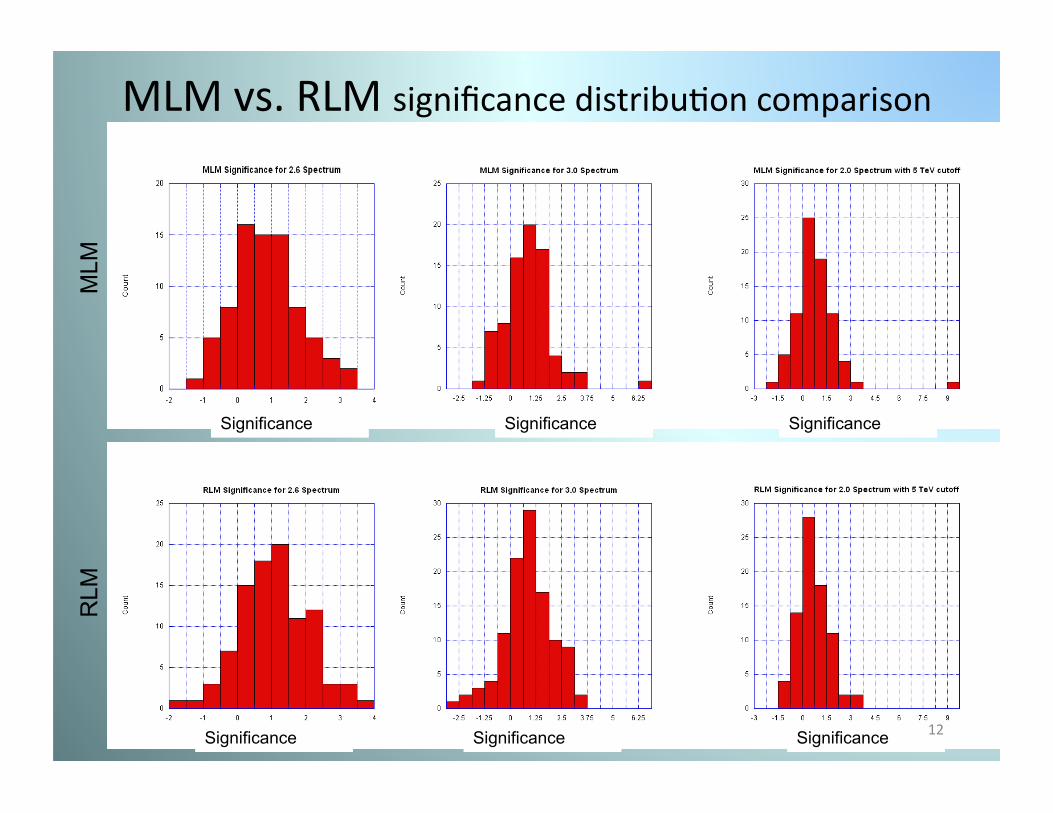
MLMvs.RLMsignificancedistribu2oncomparisonM
LM
RLM
Significance Significance Significance
Significance Significance Significance 12

SimpleMonteCarloforsignificancedistribu2on
• UsedBox‐MullermethodtocreateaGaussianrandomnumbergenerator
• 2550trialsof78Randomnumbers.
• 2sefngs
1. Backgroundsignificancemodel:
• Average:0&StandardDevia2on:1
2. Assumedsignificanceshiiforlocalmaximum:
• Average:1&StandardDevia2on:1
Results:
• Sefng1:NominalPoint• AverageMaximum~2.5witha
standarddevia2onof.43• Sefng2:LocalMax
• AverageMaximum~3.5withastandarddevia2onof.42
Bothareinroughagreementwiththemaximumsignificancefoundinthe2skysurveysdiscussedpreviously(excludingthesignificanceofMrk421)
13
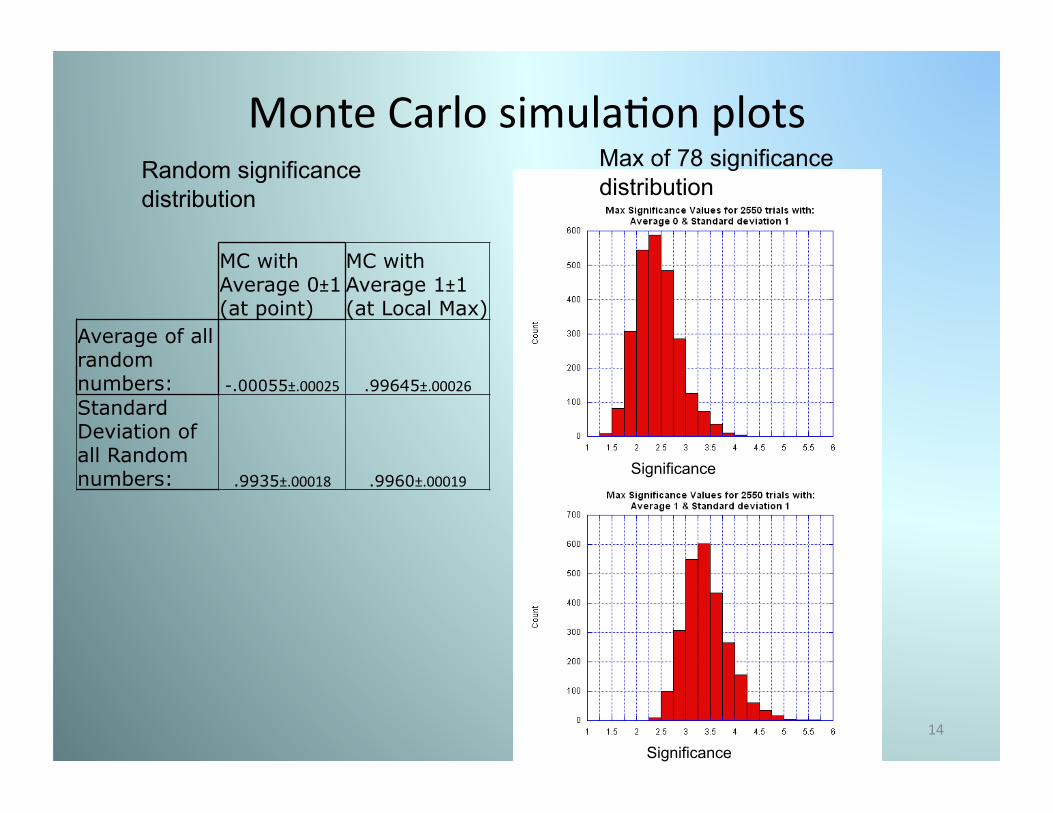
MonteCarlosimula2onplotsRandom significance distribution
Max of 78 significance distribution
MC with Average 0±1 (at point)
MC with Average 1±1 (at Local Max)
Average of all random numbers: -.00055±.00025 .99645±.00026 Standard Deviation of all Random numbers: .9935±.00018 .9960±.00019
Significance
Significance 14
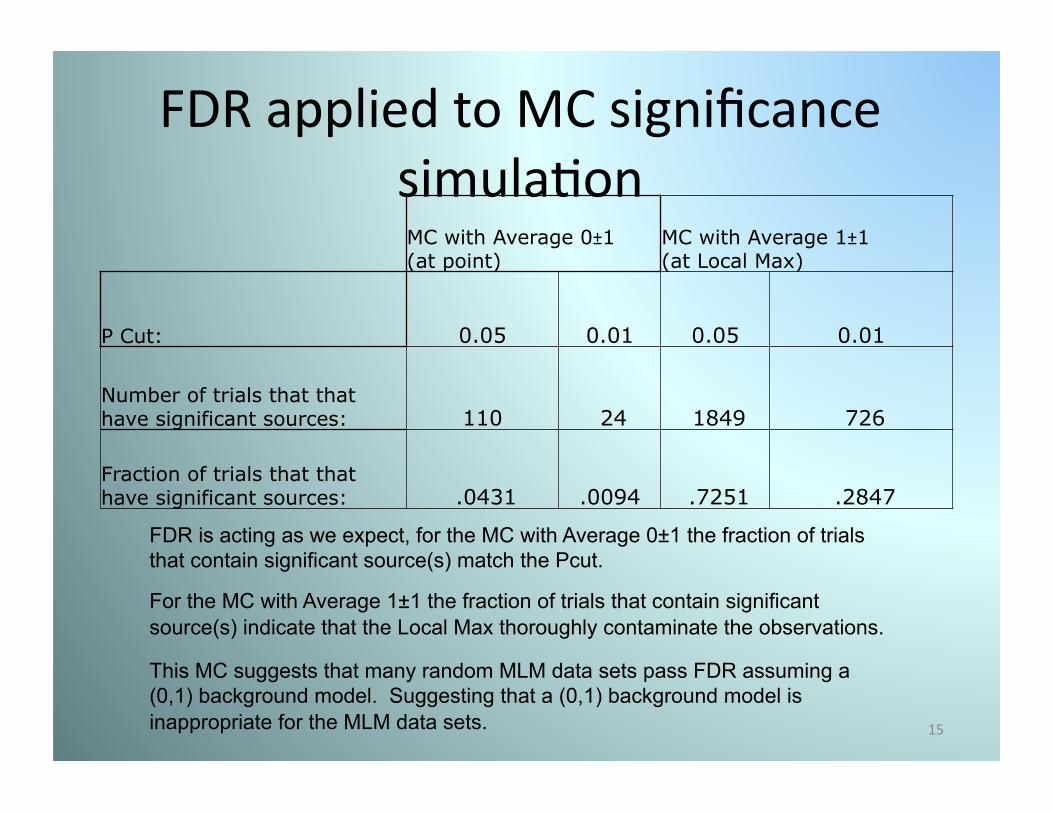
FDRappliedtoMCsignificancesimula2onMC with Average 0±1 (at point)
MC with Average 1±1 (at Local Max)
P Cut: 0.05 0.01 0.05 0.01
Number of trials that that have significant sources: 110 24 1849 726
Fraction of trials that that have significant sources: .0431 .0094 .7251 .2847
FDR is acting as we expect, for the MC with Average 0±1 the fraction of trials that contain significant source(s) match the Pcut.
For the MC with Average 1±1 the fraction of trials that contain significant source(s) indicate that the Local Max thoroughly contaminate the observations.
This MC suggests that many random MLM data sets pass FDR assuming a (0,1) background model. Suggesting that a (0,1) background model is inappropriate for the MLM data sets. 15

LocalMaxShiifromtheFP
These distributions are not statistically compatible, calculated via Kolmogorov-Smirnov (D=.2564 corresponding P of .0094) only test to reject the null hypothesis at .05 KS significance level.
The current project (just began) is to create a Monte Carlo simulation to predict the local max shift of the angular displacement.
Real Random
Degrees Degrees
16

MLMPixelshiifromtheFP
Binned displacement is defined as:
These distributions are not compelling statistically compatible, calculated via Kolmogorov-Smirnov (D= .1795 corresponding P of .1449)
Real Random
Binned displacement Binned displacement
17

Conclusions
Many thanks to Professor Linnemann for his help in editing and cultivating my education concerning this project
With certainty Milagro is able to observe Mrk421 Possibly Mrk501 If we consider the Local Max observations then possibly several more.
Motivation to use the local max observation: Peak angular displacement is within the angular resolution of the FermiLAT and Milagro. Disappointment with the results from the search using just the FermiLAT points.
Work to be done yet: Monte Carlo simulations for the Local Max shift and distribution of number passing FDR Calculating flux limits & integrating them into the website. Understanding the limitations of the local max data points. Paper?
18

ControllingtheFalse‐DiscoveryRateinAstrophysicalDataAnalysisC.Miller,etal.
TheAstrophysicalJournal122:3492‐3505,2001December
Procedure: Order the probabilities (corresponding to a significance value) from Min to Max and number them j = 1, 2, …, N
My significance probabilities (Pj) were calculated assuming a cumulative distribution function, assuming average of Zero and standard deviation of One. Also the sign of the significance value was inverted to ensure the higher the significance of the source the lower the probability.
Pcut (α) sets the proportion of false discoveries, Pcut=.05 (2σ) means we expect that less than 5% of the sources that pass the FDR method to be false.
FDR is a statistical procedure for managing the number of false discoveries within a data set when equated to a hypothesis. This method adapts to different significance cuts (Pcut) but also the size of the data set; the more entries within the set being tested imposes more stringent probability cuts per corresponding data entry. However increasing the entries within the data also increases the number of false discoveries.
FDR test: All favorable sources are those when the following statement holds: Pj < Pj
* where
€
Pj* =
j ⋅αN
so :Pj <j ⋅αN
19


