16
Survival Analysis with Time- Dependent Covariates: A Practical Example October 28, 2016 SAS Health Users Group Maria Eberg
Survival Analysis with Time-Dependent Covariates: A Practical
Example
October 28, 2016
SAS Health Users Group
Maria Eberg
Outline
• Why use time-dependent covariates?
• Things to consider in definition of time-dependent covariates
• Counting process type of data input
• Example of definition and analysis of data with multiple time-dependent covariates
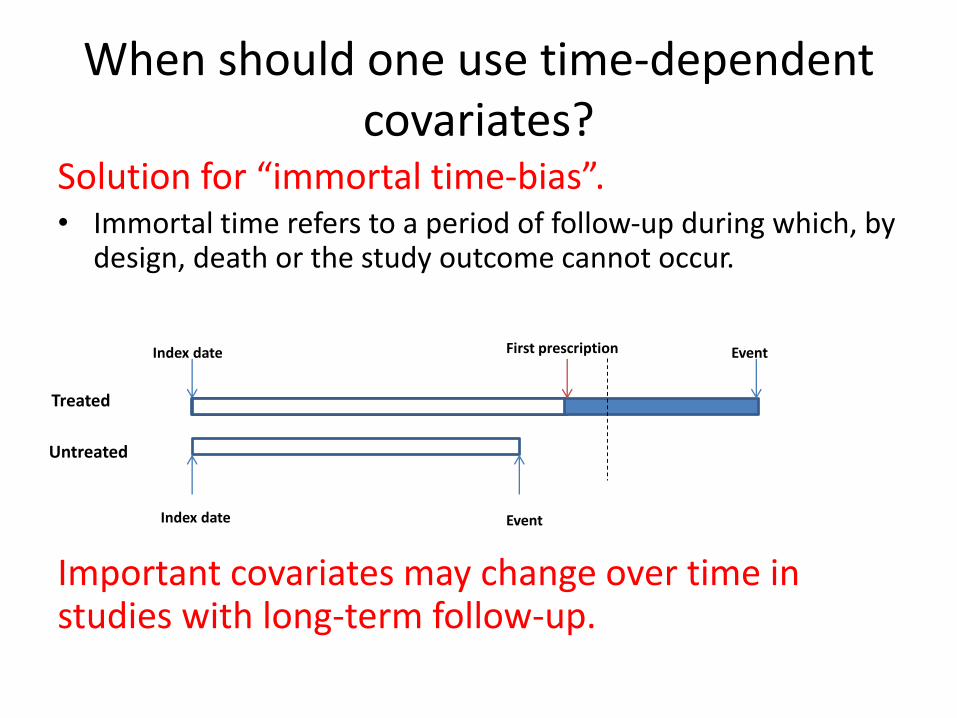
When should one use time-dependent covariates?
Solution for “immortal time-bias”. • Immortal time refers to a period of follow-up during which, by
design, death or the study outcome cannot occur.
Important covariates may change over time in studies with long-term follow-up.
First prescriptionIndex date Event
Index date Event
Treated
Untreated

Before you start coding…1. What functional form of the time-dependent covariate
makes sense:
• Cumulative, current, ever-use
• Time-lag (depends on the biological effect)
2. Exogeneity
Covariates are external or exogenous if they are determined by factors outside the system or the individual under study.
Air pollution – exogenous (external) covariate
Blood pressure, disease complications – endogenous (internal) covariates
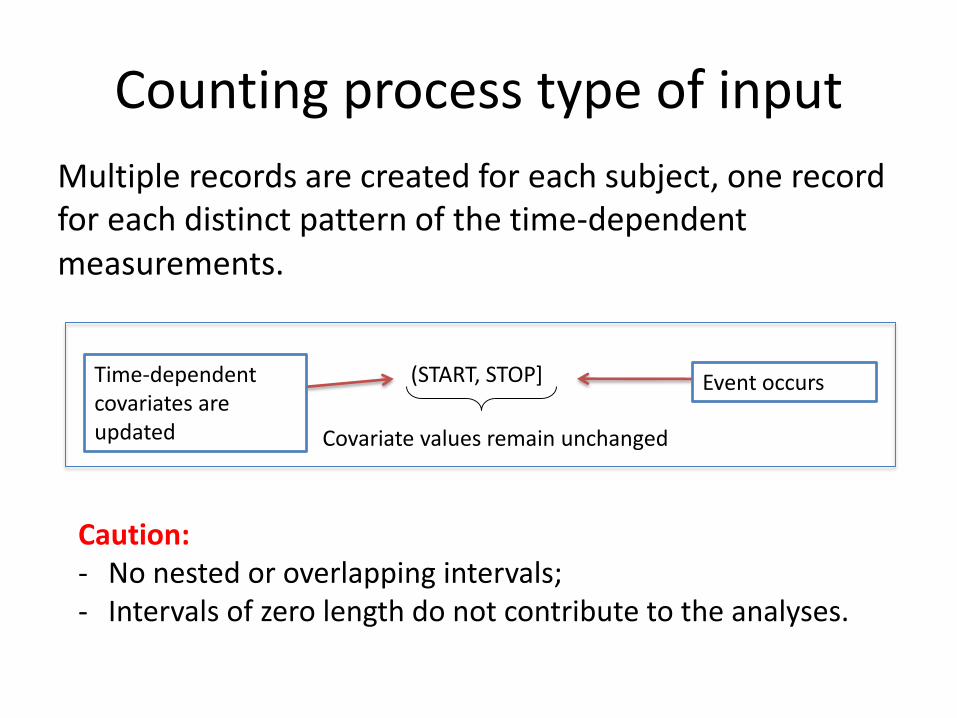
Counting process type of input
Multiple records are created for each subject, one record for each distinct pattern of the time-dependent measurements.
Event occurs(START, STOP]Time-dependent covariates are updated Covariate values remain unchanged
Caution:- No nested or overlapping intervals;- Intervals of zero length do not contribute to the analyses.
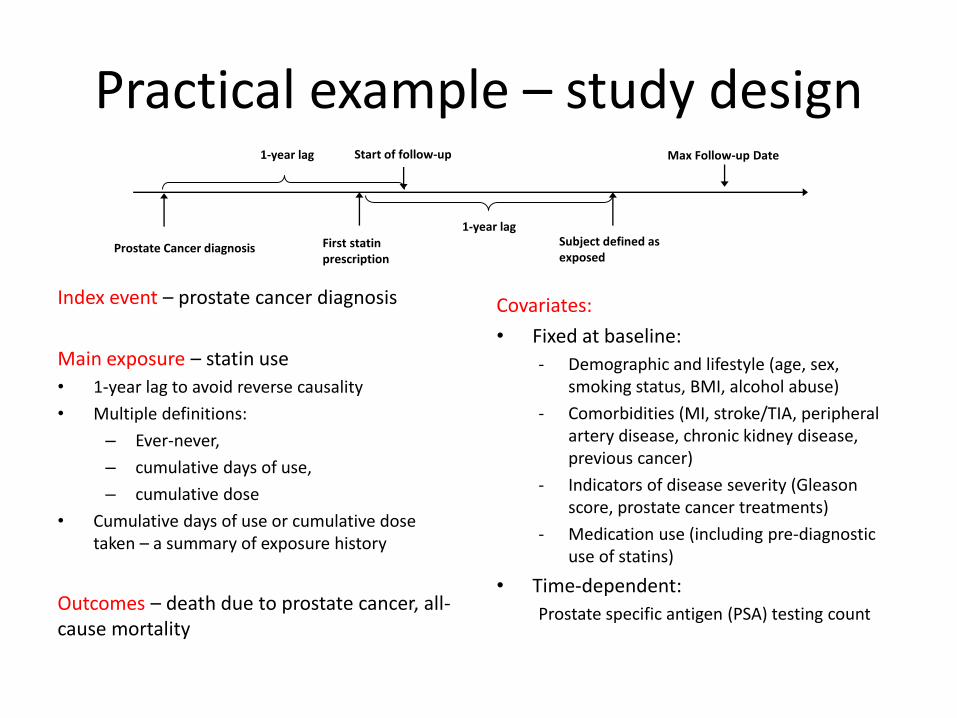
Practical example – study design
Index event – prostate cancer diagnosis
Main exposure – statin use
• 1-year lag to avoid reverse causality
• Multiple definitions:
– Ever-never,
– cumulative days of use,
– cumulative dose
• Cumulative days of use or cumulative dose taken – a summary of exposure history
Outcomes – death due to prostate cancer, all-cause mortality
Covariates:
• Fixed at baseline:
- Demographic and lifestyle (age, sex, smoking status, BMI, alcohol abuse)
- Comorbidities (MI, stroke/TIA, peripheral artery disease, chronic kidney disease, previous cancer)
- Indicators of disease severity (Gleason score, prostate cancer treatments)
- Medication use (including pre-diagnostic use of statins)
• Time-dependent:
Prostate specific antigen (PSA) testing count
Start of follow-up
Prostate Cancer diagnosis
Max Follow-up Date
Subject defined as exposed
1-year lag
1-year lagFirst statin prescription

Creating long data
ID DIAG_DATE T0 END_FU EVENT
1 01JAN2001 01JAN2002 31MAR2010 0
2 15APR2004 15APR2005 09OCT2007 1
3 27SEP2003 27SEP2004 10JUL2009 2
data byday;
set original;
do istart = t0 to (end_fu – 1);
iend = istart + 1;
output;
end;
run;
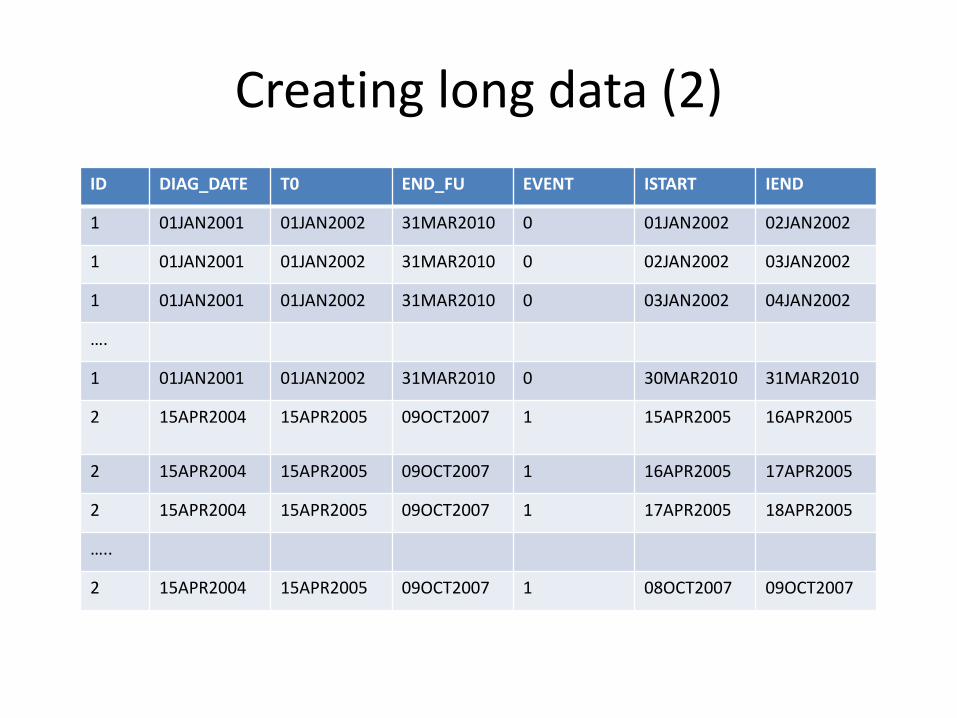
Creating long data (2)
ID DIAG_DATE T0 END_FU EVENT ISTART IEND
1 01JAN2001 01JAN2002 31MAR2010 0 01JAN2002 02JAN2002
1 01JAN2001 01JAN2002 31MAR2010 0 02JAN2002 03JAN2002
1 01JAN2001 01JAN2002 31MAR2010 0 03JAN2002 04JAN2002
….
1 01JAN2001 01JAN2002 31MAR2010 0 30MAR2010 31MAR2010
2 15APR2004 15APR2005 09OCT2007 1 15APR2005 16APR2005
2 15APR2004 15APR2005 09OCT2007 1 16APR2005 17APR2005
2 15APR2004 15APR2005 09OCT2007 1 17APR2005 18APR2005
…..
2 15APR2004 15APR2005 09OCT2007 1 08OCT2007 09OCT2007
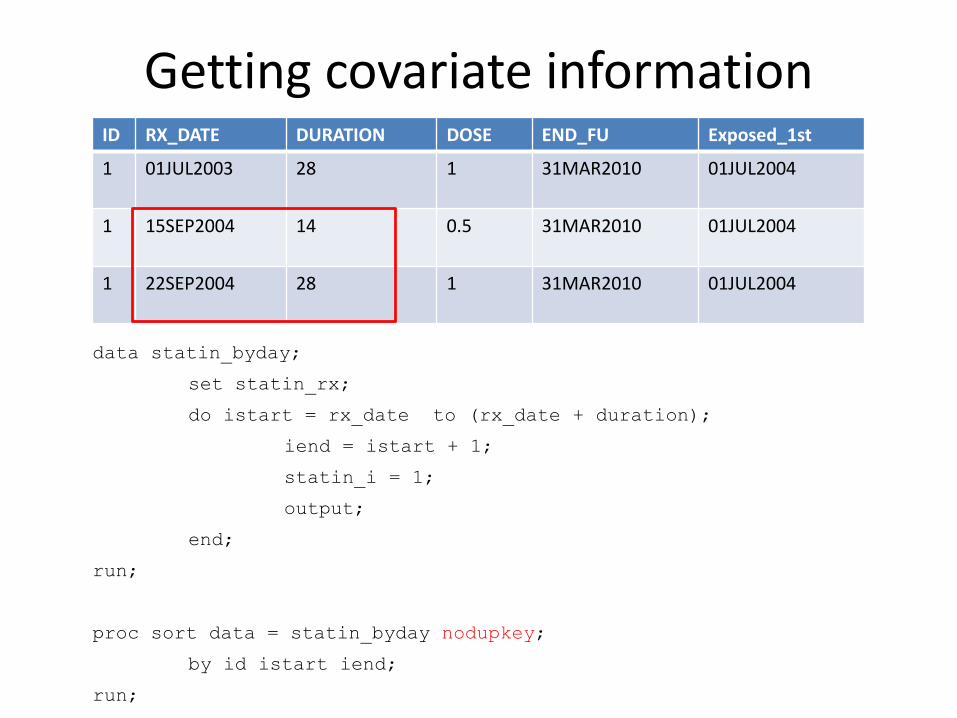
Getting covariate informationID RX_DATE DURATION DOSE END_FU Exposed_1st
1 01JUL2003 28 1 31MAR2010 01JUL2004
1 15SEP2004 14 0.5 31MAR2010 01JUL2004
1 22SEP2004 28 1 31MAR2010 01JUL2004
data statin_byday;
set statin_rx;
do istart = rx_date to (rx_date + duration);
iend = istart + 1;
statin_i = 1;
output;
end;
run;
proc sort data = statin_byday nodupkey;
by id istart iend;
run;
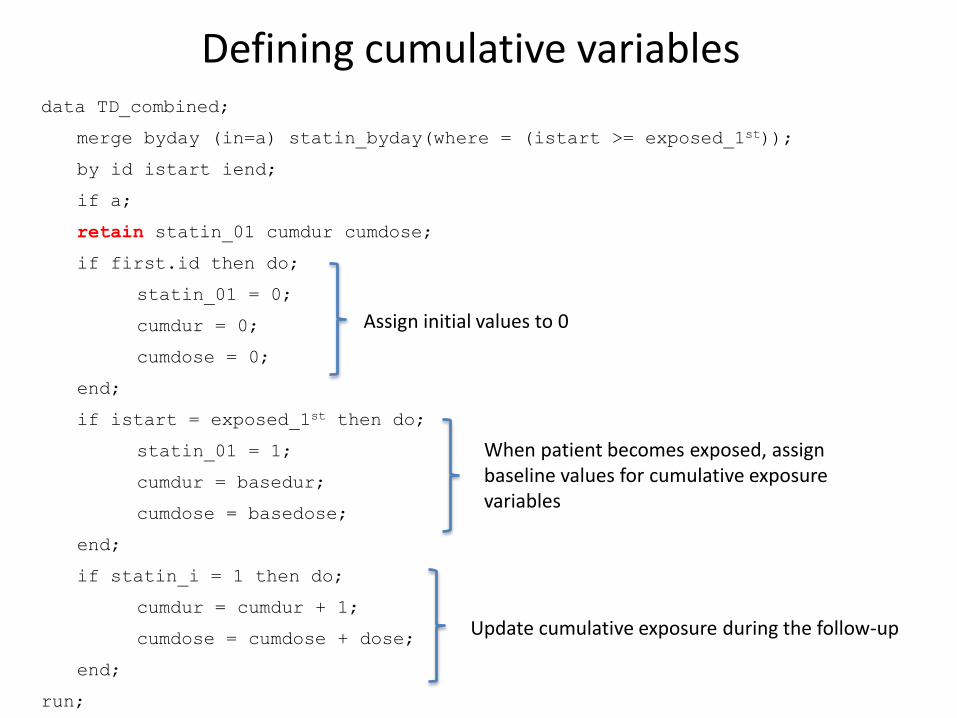
Defining cumulative variablesdata TD_combined;
merge byday (in=a) statin_byday(where = (istart >= exposed_1st));
by id istart iend;
if a;
retain statin_01 cumdur cumdose;
if first.id then do;
statin_01 = 0;
cumdur = 0;
cumdose = 0;
end;
if istart = exposed_1st then do;
statin_01 = 1;
cumdur = basedur;
cumdose = basedose;
end;
if statin_i = 1 then do;
cumdur = cumdur + 1;
cumdose = cumdose + dose;
end;
run;
Assign initial values to 0
When patient becomes exposed, assign baseline values for cumulative exposure variables
Update cumulative exposure during the follow-up

Dataset with cumulative variablesID T0 END_FU EVENT ISTART IEND STATIN_I STATIN_01 CUMDUR CUMDOSE
1001 01JAN2002 31MAR2010 0 01JAN2002 02JAN2002 0 0 No Use No Use
1001 01JAN2002 31MAR2010 0 02JAN2002 03JAN2002 0 0 No Use No Use
1001 ….
1001 01JAN2002 31MAR2010 0 01JUL2004 02JUL2004 0 1 < 1 year < 365 DDD
1001 01JAN2002 31MAR2010 0 02JUL2004 03JUL2004 0 1 < 1 year < 365 DDD
1001 ….
1001 01JAN2002 31MAR2010 0 15SEP2004 16SEP2004 1 1 < 1 year < 365 DDD
1001 01JAN2002 31MAR2010 0 16SEP2004 17SEP2004 1 1 < 1 year < 365 DDD
1001 ….
1001 01JAN2002 31MAR2010 0 30MAR2010 31MAR2010 0 1 < 1 year < 365 DDD
Cumulative duration and dose variables were formatted as:No use - patient is unexposed during the follow-up< 1 year – cumulative exposure is less than 365 days or defined daily doses (DDD)1 – 2 years – cumulative exposure is 365 – 730 days or DDDs2 – 3 years – cumulative exposure is 731 – 1095 days or DDDs3+ years – cumulative exposure is over 1095 days or DDDs
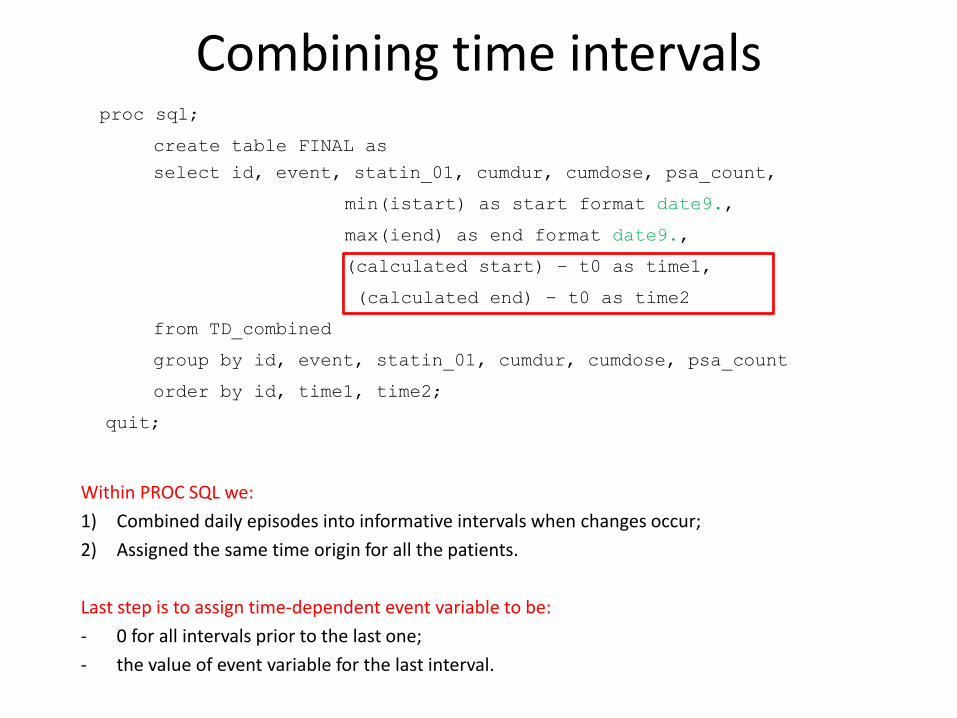
Combining time intervalsproc sql;
create table FINAL as
select id, event, statin_01, cumdur, cumdose, psa_count,
min(istart) as start format date9.,
max(iend) as end format date9.,
(calculated start) – t0 as time1,
(calculated end) – t0 as time2
from TD_combined
group by id, event, statin_01, cumdur, cumdose, psa_count
order by id, time1, time2;
quit;
Within PROC SQL we:
1) Combined daily episodes into informative intervals when changes occur;
2) Assigned the same time origin for all the patients.
Last step is to assign time-dependent event variable to be:
- 0 for all intervals prior to the last one;
- the value of event variable for the last interval.
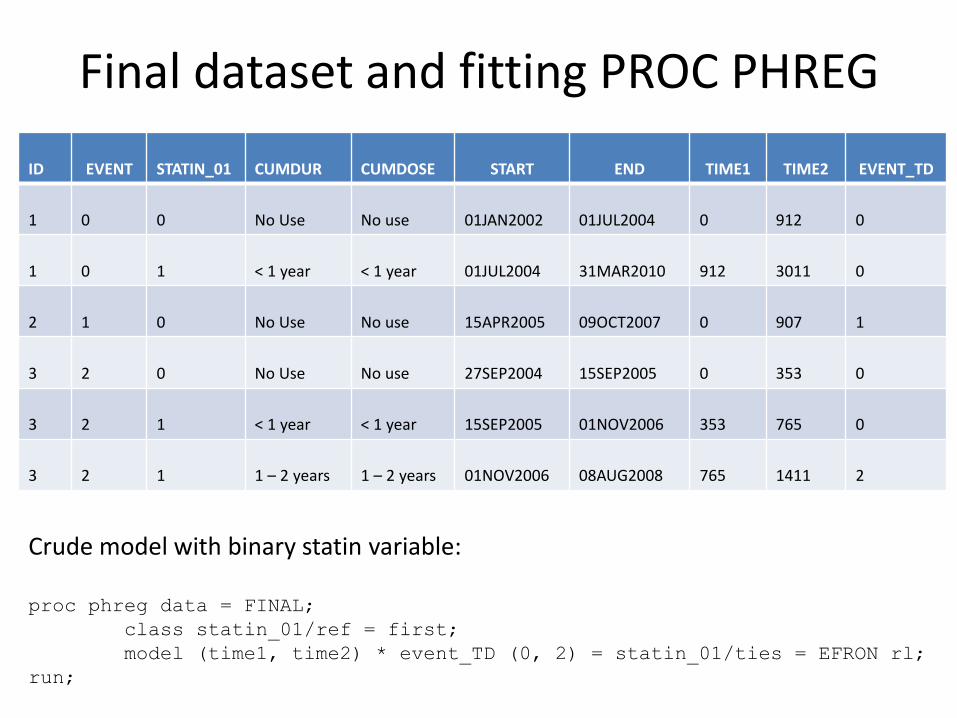
Final dataset and fitting PROC PHREG
ID EVENT STATIN_01 CUMDUR CUMDOSE START END TIME1 TIME2 EVENT_TD
1 0 0 No Use No use 01JAN2002 01JUL2004 0 912 0
1 0 1 < 1 year < 1 year 01JUL2004 31MAR2010 912 3011 0
2 1 0 No Use No use 15APR2005 09OCT2007 0 907 1
3 2 0 No Use No use 27SEP2004 15SEP2005 0 353 0
3 2 1 < 1 year < 1 year 15SEP2005 01NOV2006 353 765 0
3 2 1 1 – 2 years 1 – 2 years 01NOV2006 08AUG2008 765 1411 2
Crude model with binary statin variable:
proc phreg data = FINAL;
class statin_01/ref = first;
model (time1, time2) * event_TD (0, 2) = statin_01/ties = EFRON rl;
run;
Take Home Messages
• Use of time-dependent vs time-fixed covariates offers a solution to
“immortal time” bias and allows one to update information on
covariates that vary over time.
• However, covariates must be carefully constructed to ensure
interpretability.
• Counting process type of input may be more preferable in case of
multiple time-dependent covariates BUT need to ensure:
- time intervals do not overlap;
- there are no intervals of zero length.

Questions?
THANK YOU!
Key References
• Levesque L, Hanley JA, Kezouh A, Suissa S. Problem of immortal time bias
in cohort studies: example using statins for preventing progression of
diabetes. BMJ 2010;340:b5087
• Allison PD (2010). Survival Analysis Using SAS: A Practical Guide. 2nd
edition. SAS Publishing, Cary
• Powell TM, Bagnell ME. SAS Global Forum 2012, Your “survival” guide to
using time-dependent Covariates. SAS Institute Inc. 2012; Paper 168
• Yu O, Eberg M, Benayoun S, Aprikian A, Batist G, Suissa S, Azoulay L Use of
Statins and the Risk of Death in Patients With Prostate Cancer. JCO January
1, 2014 vol. 32 no. 1 5-11


