52
Survival Analysis of a Domestic Violence Court Dr. Isaac Van Patten Mr. Jon Hilton Mr. Brady Torrence Mr. Kris Weart

Survival Analysis of a Domestic Violence Court
Dr. Isaac Van PattenMr. Jon HiltonMr. Brady TorrenceMr. Kris Weart

Review of the Literature
History:
• Violence Against Women Act of 1994– 4 year implementation
– O.J. Simpson
• Specialized Courts first started popping up in early 80’s

Review of the Literature
Implementation:
• Hold perpetrator accountable
• Help victims and families
• Concentration on children

Best Practices
• Judicial Behavior– Therapeutic jurisprudence
– Leadership
– Celerity

Best Practices
• Collaborative effort by involved agencies– Courts
– Prosecutor
– Community Corrections
– Social services/SA & mental health services
– Law enforcement
– Victim services

Literature Review
Future:
• Everyone has to be on board– “Programs come down to the people behind
them”
– Changing Attitudes
• Family Values
• Spread of specialized Courts

History Roanoke Valley DV Court
• Program started in 1998 by JDRC Judge– Convened the involved parties
• Police
• Prosecution
• Child Protective Services
– Concern for well-being of children• Especially from non-married couples

History Roanoke Valley DV Court
• A comprehensive “systemic” approach –every one has an active role – Judicial leadership– Police– Prosecution– Community Corrections– Child Protective Services
• Proactive – setting a community norm• Reduction of repeat offenses

Sample
• Total N=308 batterers referred to the DV Court Program
• 210 closed case from the County Juvenile & Domestic Relations Court – All closed cases referred since July 1998
• An additional 98 closed cases randomly selected from the City JDRC for a comparison group
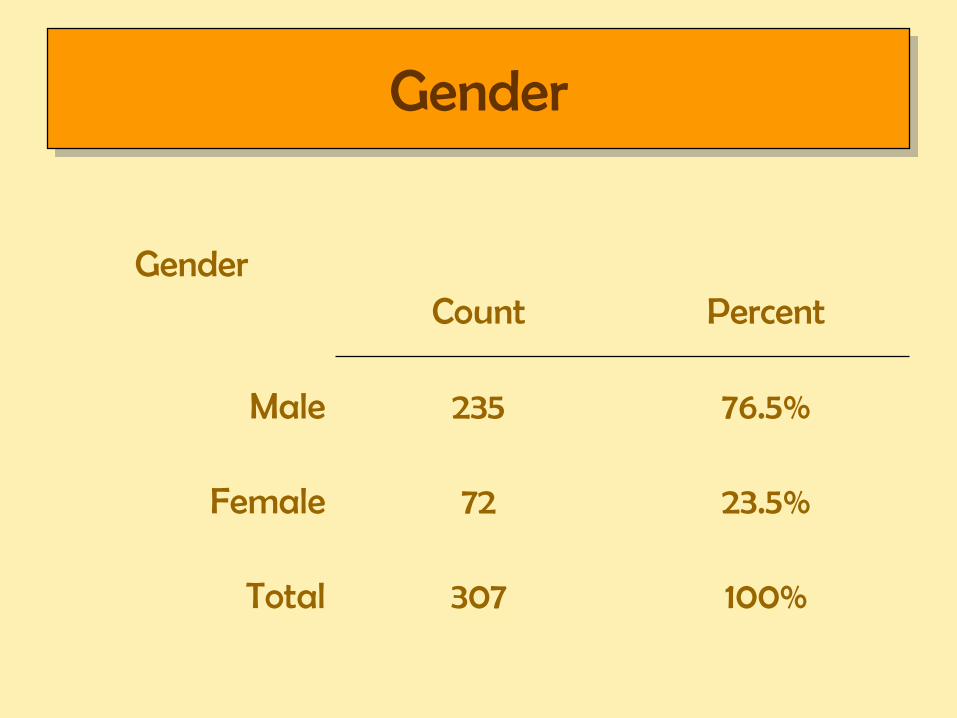
Gender
GenderCount Percent
Male 235 76.5%
Female 72 23.5%
Total 307 100%

Race/Ethnicity
RaceCount Percent
Caucasian 230 76.7%
African American 61 20.3%
Hispanic 7 2.3%
Asian 2 0.7%
Total 300 100%

Relationship Status
RelationshipCount Percent
Single, not living together 115 38.5%Married 111 37.1%
Separated 35 11.7%Single, living together 16 5.4%
Divorced 22 7.3%Total 299 100%
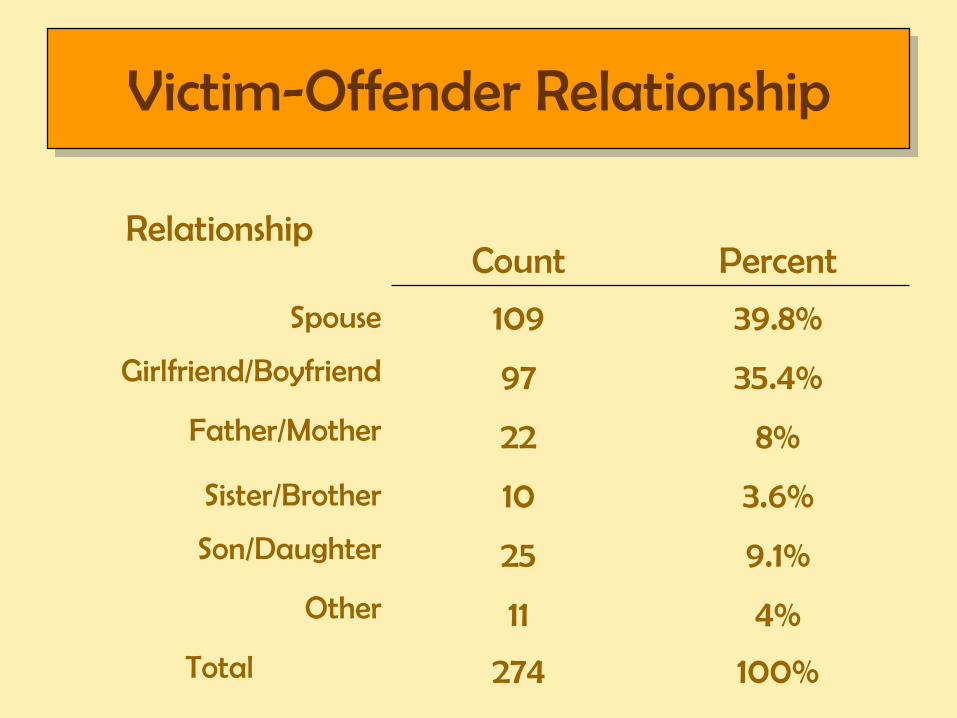
Victim-Offender Relationship
RelationshipCount Percent
Spouse 109 39.8%
Girlfriend/Boyfriend 97 35.4%
Father/Mother 22 8%
Sister/Brother 10 3.6%
Son/Daughter 25 9.1%
Other 11 4%
Total 274 100%

Male Victims by Relationship
Relationship
CountPercent of
Total
Husband 21 7.7%
Boyfriend 11 4%
Father 2 0.7%
Brother 2 0.7%
Son 11 4%
Total Male/Total 47/274 20.8%

Children Present
Children?
Count Percent
Yes 201 75.8%
No 64 24.2%
Total 265 100%

Shared Children
Shared Children?
Count Percent
Yes 23 67.6%
No 11 32.4%
Total 34 100%
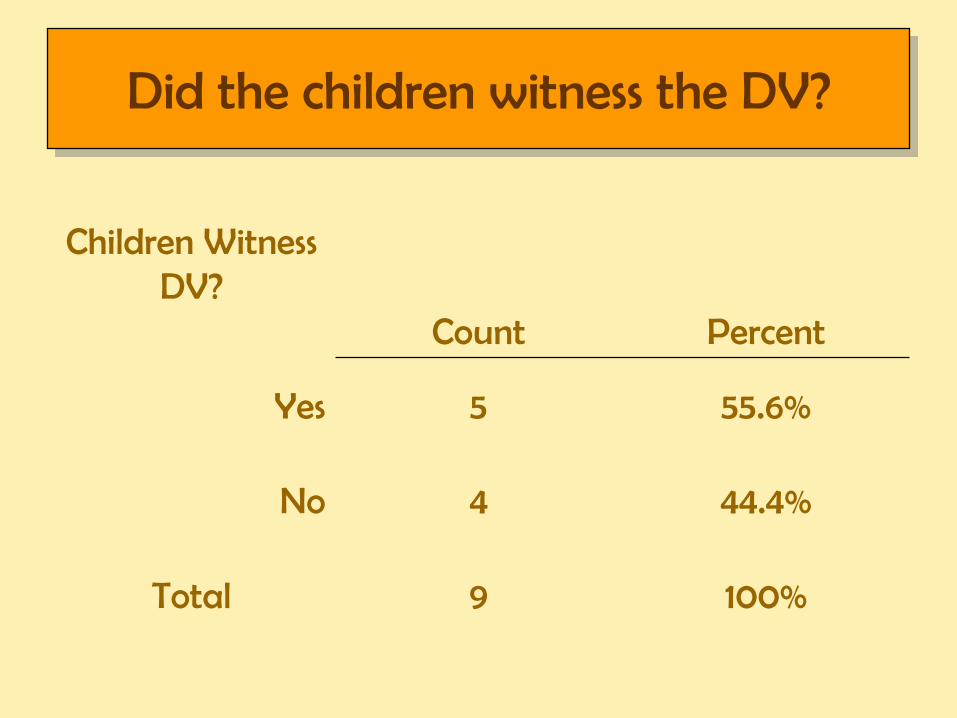
Did the children witness the DV?
Children Witness DV?
Count Percent
Yes 5 55.6%
No 4 44.4%
Total 9 100%

Employment Status
Batterer Employed?
Count Percent
Yes 215 70%
No 92 30%
Total 307 100%

Level of Education
EducationCount Percent
Less than HS 93 30.7%High School (GED) 150 49.5%
Some College 40 13.2%Associates 4 1.3%
BS/BA 10 3.3%Advanced Degree 6 2.0%Total 303 100%

Prior Substance Abuse Tx
Treated for AOD?
Count Percent
Yes 78 73.6%
No 28 26.4%
Total 106 100%

Prior Felony Arrest
Felony Arrest Record?
Count Percent
Yes 116 37.9%
No 190 62.1%
Total 306 100%

Prior Misdemeanor Arrest
Misdemeanor Arrest Record?
Count Percent
Yes 186 60.8%
No 120 39.2%
Total 306 100%

Crimes Against Persons
Prior Arrest for CAP?
Count Percent
Yes 129 74%
No 45 26%
Total 174 100%
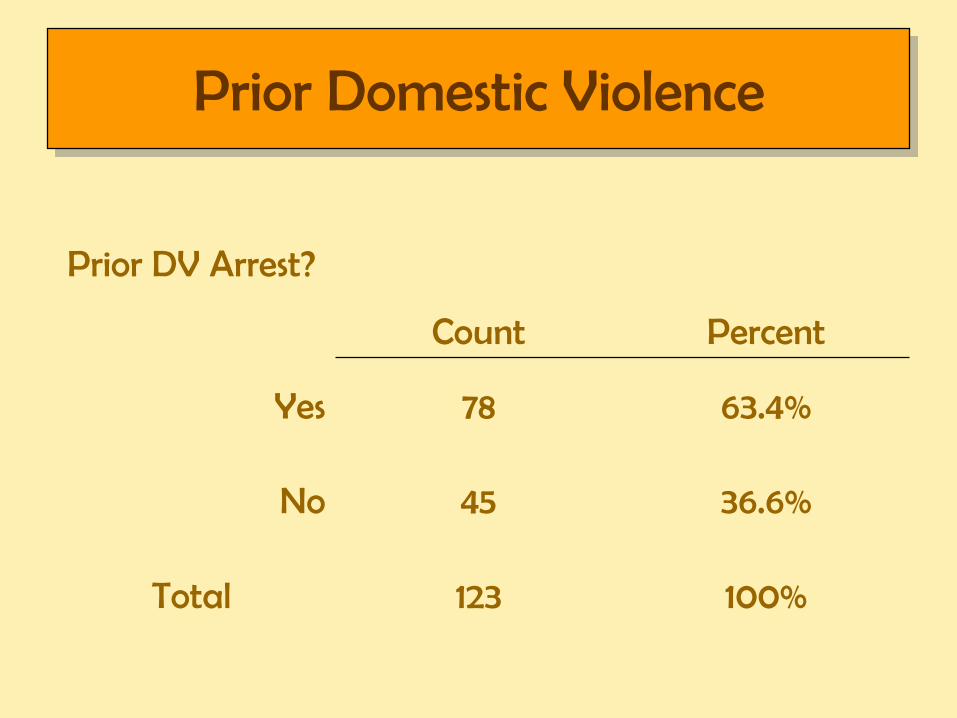
Prior Domestic Violence
Prior DV Arrest?
Count Percent
Yes 78 63.4%
No 45 36.6%
Total 123 100%

Any Other Assault
Prior Arrest for Other Assault?
Count Percent
Yes 59 66.3%
No 30 33.7%
Total 89 100%

Convictions
Any Prior Convictions?
Count Percent
Yes 143 81.7%
No 32 18.3%
Total 175 100%

Mandatory Arrest
Reason for Arrest
Count Percent
Witness to Assault 1 0.3%
Admission 1 0.3%
Evidence of Battery 306 99.4%
Total 308 100%
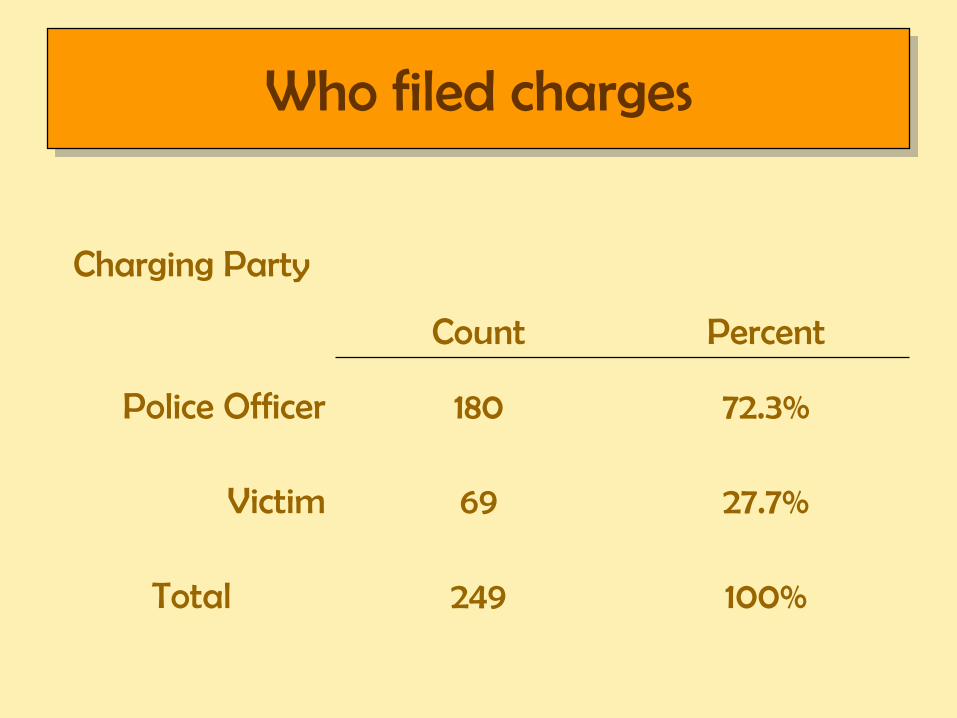
Who filed charges
Charging Party
Count Percent
Police Officer 180 72.3%
Victim 69 27.7%
Total 249 100%
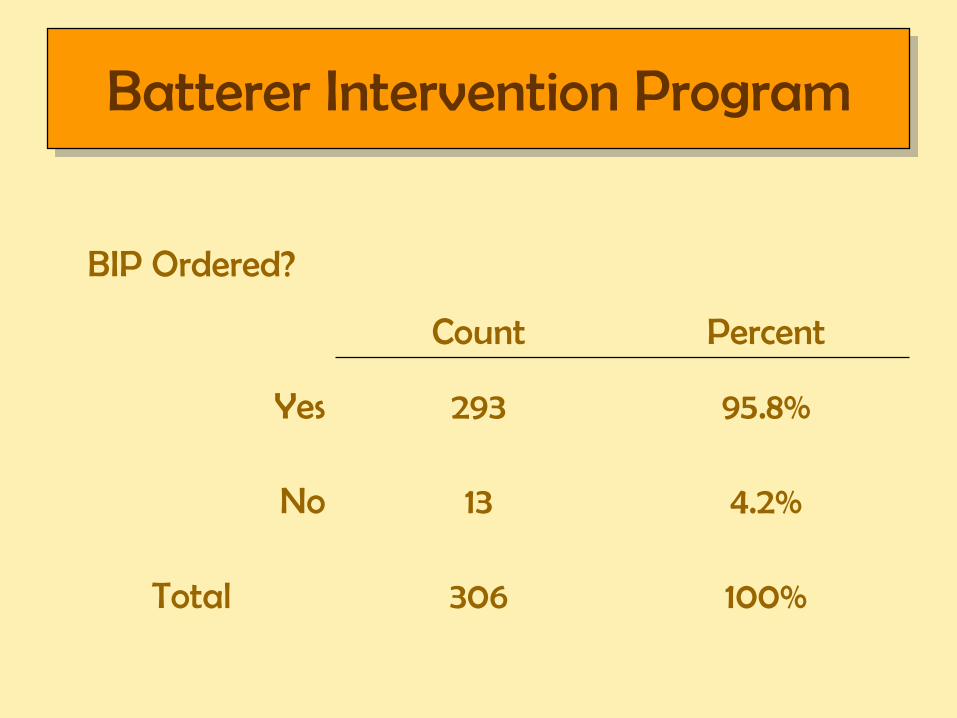
Batterer Intervention Program
BIP Ordered?
Count Percent
Yes 293 95.8%
No 13 4.2%
Total 306 100%

BIP Completion
Offender Complete BIP
Count Percent
Yes 232 78.9%
No 62 21.1%
Total 294 100%
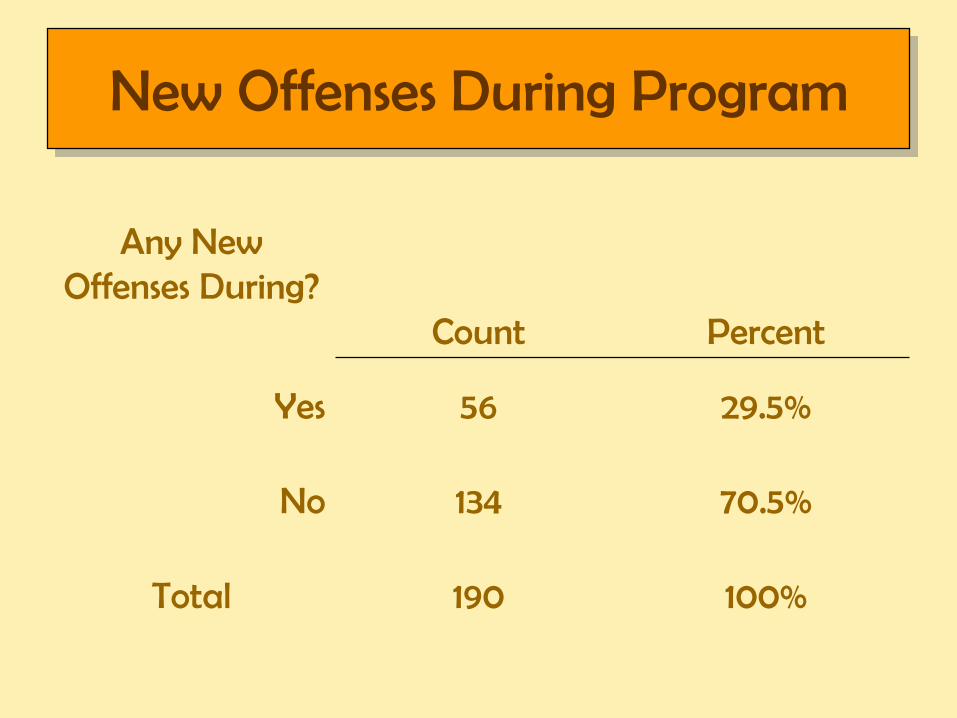
New Offenses During Program
Any New Offenses During?
Count Percent
Yes 56 29.5%
No 134 70.5%
Total 190 100%

New Offenses After Completion
Any New Offenses After?
Count Percent
Yes 14 10.1%
No 124 89.9%
Total 138 100%
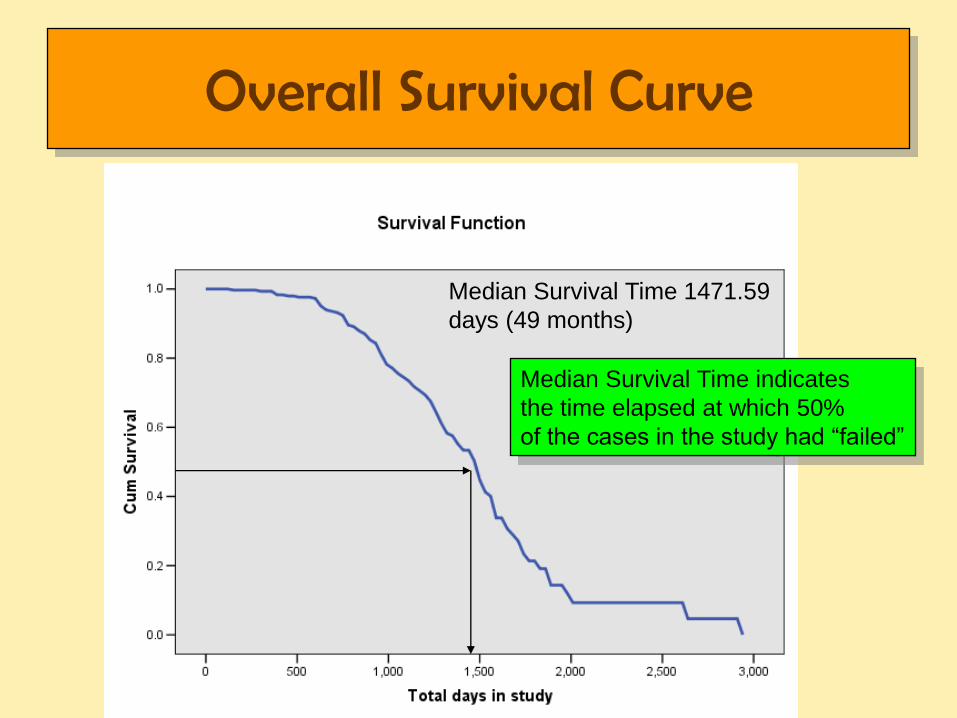
Overall Survival Curve
Median Survival Time 1471.59
days (49 months)
Median Survival Time indicates
the time elapsed at which 50%
of the cases in the study had “failed”
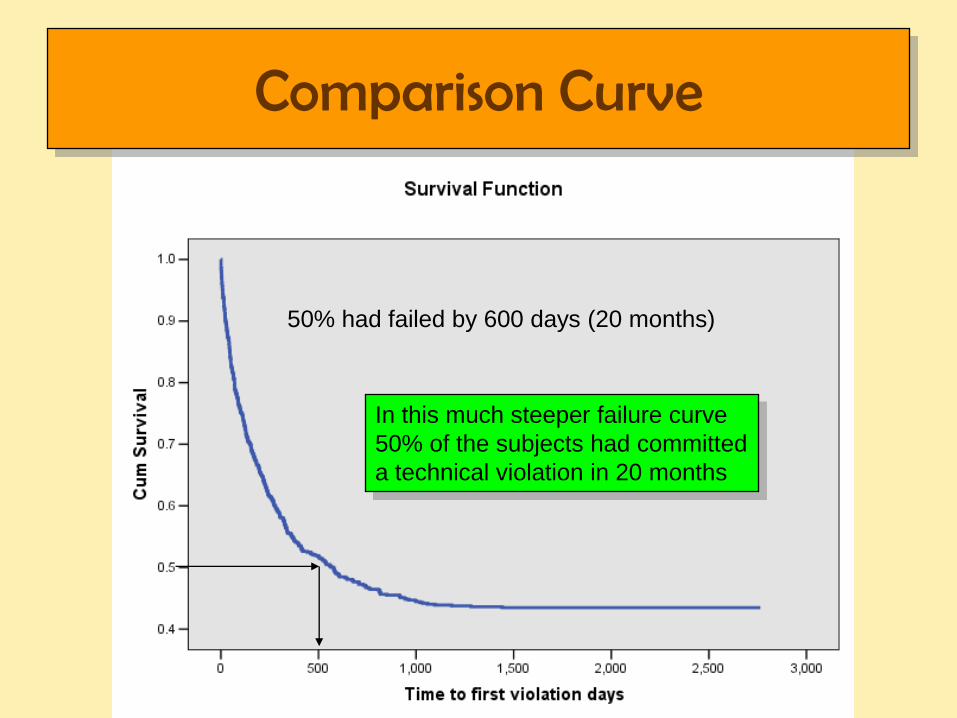
Comparison Curve
50% had failed by 600 days (20 months)
In this much steeper failure curve
50% of the subjects had committed
a technical violation in 20 months

“Failure” by Categories
CategoryCount Percent
Success 185 60.1%Violation of Protective
Order 3 1.0%
New Domestic Violence Incident 19 6.2%
Other Law Violation 101 32.8%
Total 308 100%

Success by Jurisdiction
JurisdictionCounty City
Success 59% 62.2%Violation of Protective
Order 0 3.1%
New Domestic Violence Incident 6.7% 5.1%
Other Law Violation 34.3% 29.6%
Total N 210 98
Chi Square = 7.256, NS

Survival by Jurisdiction
Median Survival Time
City County
1098.524 1497.413

Success by Gender
GenderMale Female
Success 56.2% 73.6%Violation of Protective
Order 1.3% 0%
New Domestic Violence Incident 6.8% 4.2%
Other Law Violation 35.7% 22.2%
Total N 235 72
Chi Square = 7.417, p=.060

Survival by Gender
Median Survival Time
Male Female
1424.859 1630.123

Success by Race
RaceCaucasian African Am Hispanic Asian
Success 63.5% 45.9% 57.1% 50%
Violation of Prot. Order 0.9% 1.6% 0 0
New DV Incident 4.8% 9.8% 0 50%
Other Law Violation 30.9% 42.6% 42.9% 0
Total N 230 61 7 2
Chi Square = 14.707, p=0.099

Survival by Race
Median Survival Time
CaucasianAfrican
American
1534.838 1144.211

Success by Marital Status
Marital Status
Married Single - NLT Other
Success 65.8% 53% 61.6%Violation of Prot Order 0.9% 0.9% 1.4%
New DV Incident 5.4% 7.0% 5.5%
Other Law Violation 27.9% 39.1% 31.5%
Total N 111 115 73
Chi Square = 4.196, NS

Survival by Marital Status
Median Values
Married Single –NLT
Other
1544.305 1373.464 1455.077
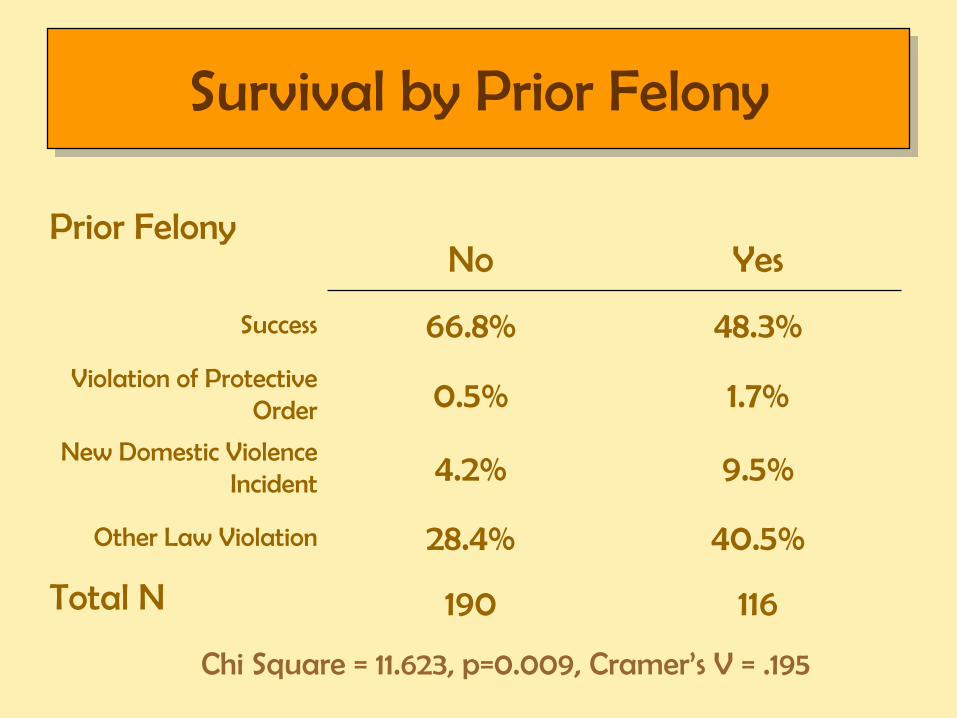
Survival by Prior Felony
Prior FelonyNo Yes
Success 66.8% 48.3%Violation of Protective
Order 0.5% 1.7%
New Domestic Violence Incident 4.2% 9.5%
Other Law Violation 28.4% 40.5%
Total N 190 116
Chi Square = 11.623, p=0.009, Cramer’s V = .195
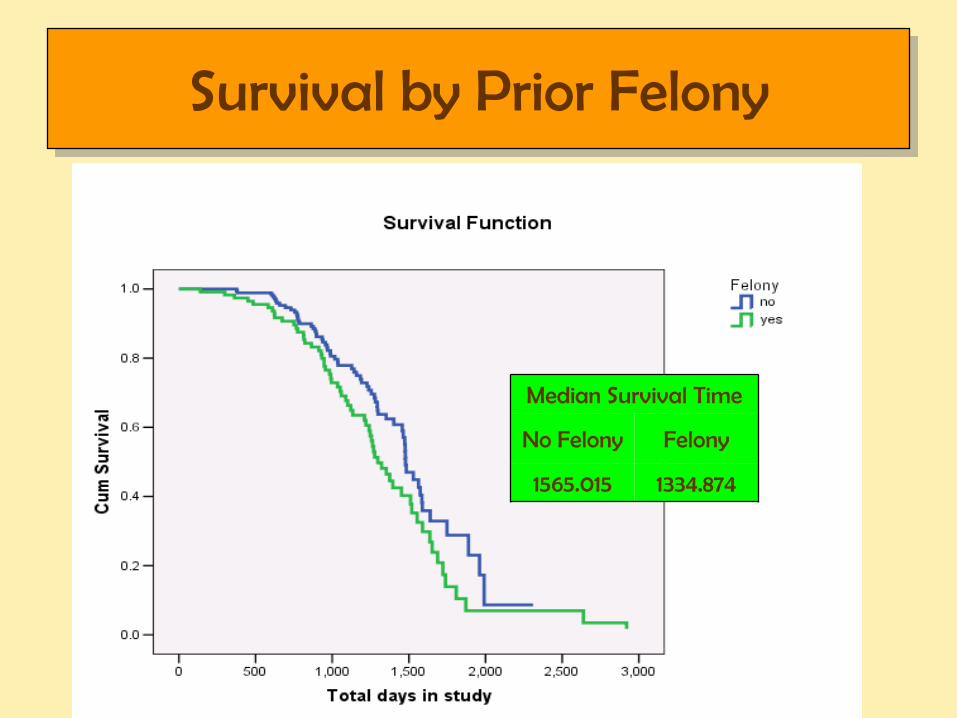
Survival by Prior Felony
Median Survival Time
No Felony Felony
1565.015 1334.874
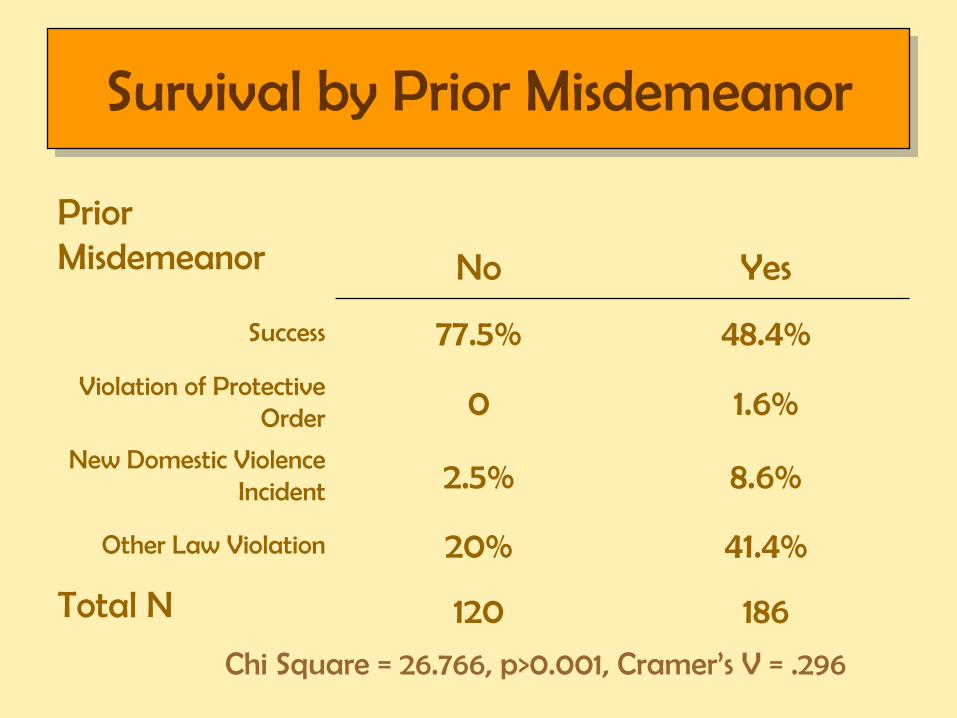
Survival by Prior Misdemeanor
Prior Misdemeanor No Yes
Success 77.5% 48.4%Violation of Protective
Order 0 1.6%
New Domestic Violence Incident 2.5% 8.6%
Other Law Violation 20% 41.4%
Total N 120 186
Chi Square = 26.766, p>0.001, Cramer’s V = .296

Survival by Prior Misdemeanor
Median Survival Time
No Misdemeanor
Misdemeanor
1692.656 1309.62

Survival by Prior DV Charge
Prior DVNo Yes
Success 57.8% 43.6%Violation of Protective
Order 0 1.3%
New Domestic Violence Incident 4.4% 12.8%
Other Law Violation 37.8% 42.3%
Total N 45 78Chi Square NS

Survival by Prior DV Charge
Median Survival Time
No Prior DV Prior DV
1471.065 1264.436
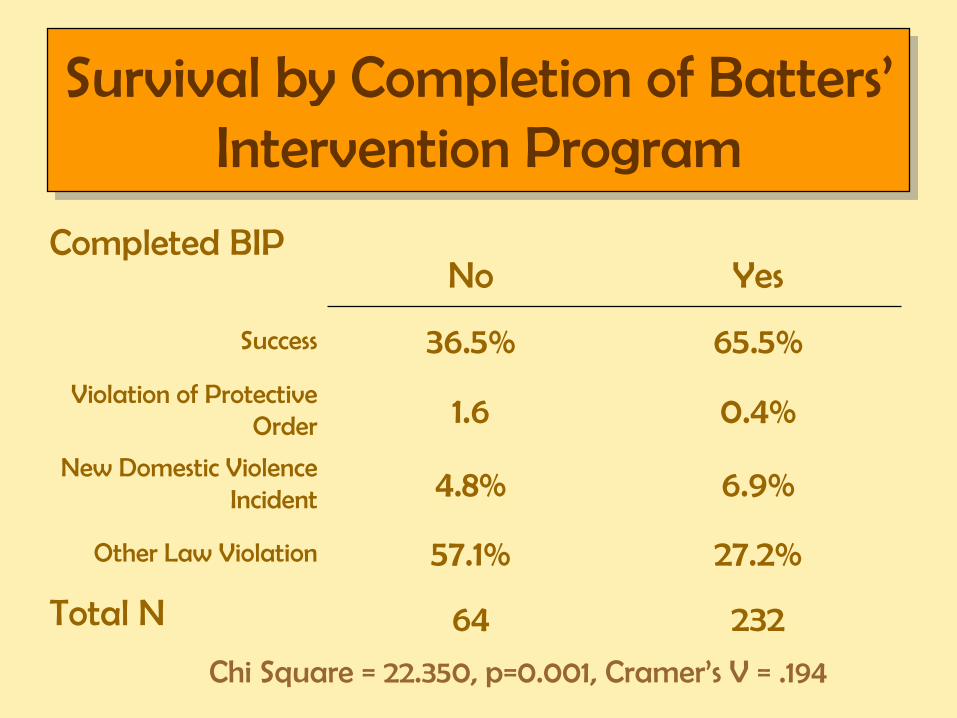
Survival by Completion of Batters’ Intervention Program
Completed BIPNo Yes
Success 36.5% 65.5%Violation of Protective
Order 1.6 0.4%
New Domestic Violence Incident 4.8% 6.9%
Other Law Violation 57.1% 27.2%
Total N 64 232
Chi Square = 22.350, p=0.001, Cramer’s V = .194
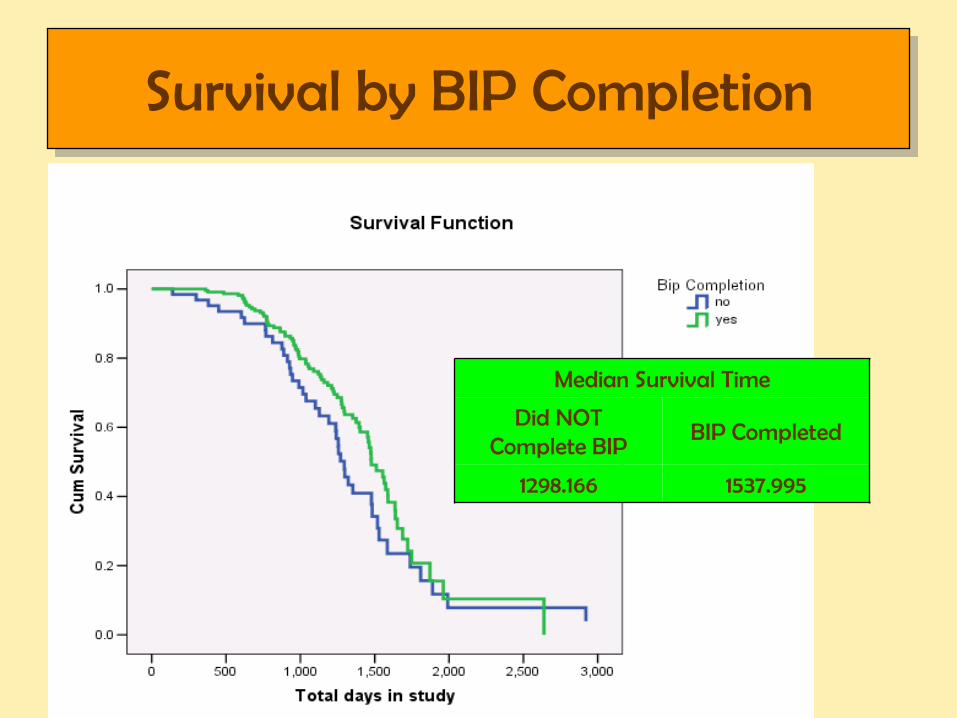
Survival by BIP Completion
Median Survival Time
Did NOT Complete BIP
BIP Completed
1298.166 1537.995

Questions & Discussion


