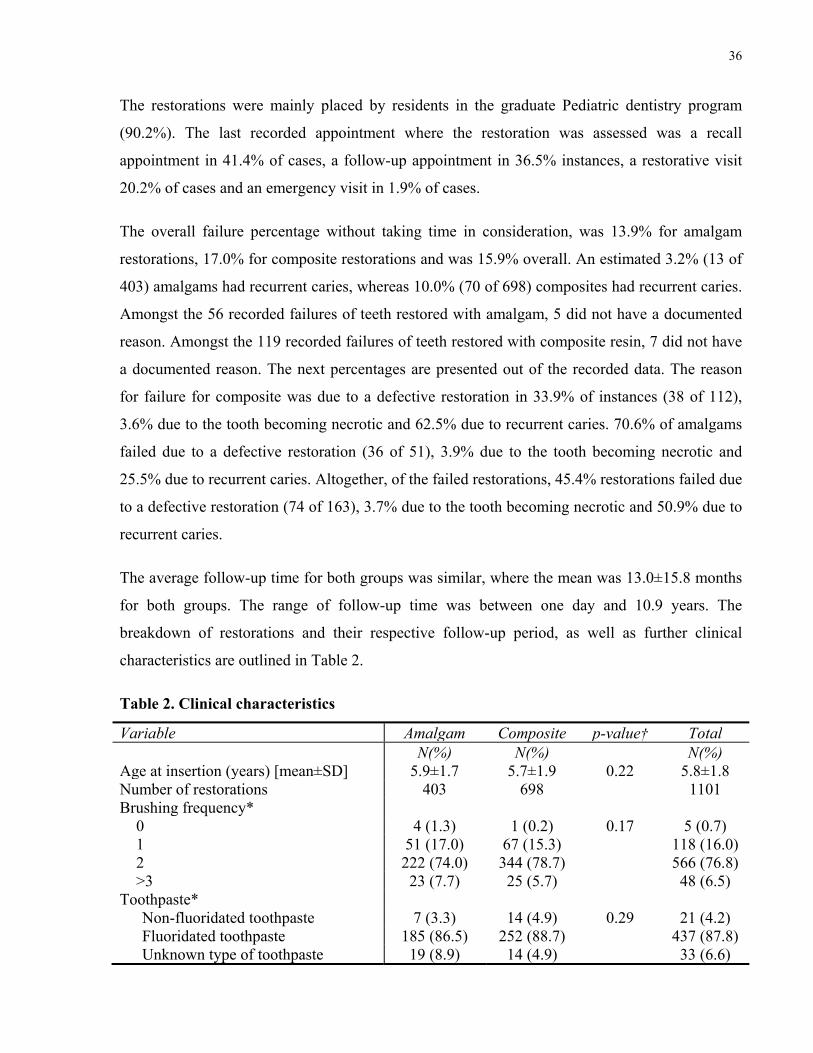
Follow-up period (mean±SD) [months] 13.5±16.0 12.7±15.6 0.38 13.0±15.8Number of restorations with follow-up
<30 days 92 (22.8) 214 (30.7) 0.19 306 (27.8)30-60 days 31(7.7) 47 (6.7) 78 (7.1)61-180 days 52(12.9) 70 (10.0) 122 (11.1)181-365 days 65 (16.1) 106 (15.2) 171 (15.5)366-730 days 81 (19.9) 124 (17.8) 205 (18.5)731-1095 days 44 (10.9) 72 (10.3) 116 (10.5)1096-1460 days 23 (6.0) 36 (5.2) 59 (5.5)1461-1825 days 13 (3.2) 19 (2.7) 32 (2.9)>1825 days 2 (0.5) 10 (1.4) 12 (1.1)
Range of follow-up period (days) 1 - 3989 2 - 3671 1 - 3989† Pearson’s chi-squared test or Fisher’s exact test for categorical variables, and Student’s t-test for continuous variables. *Data collected is based on available information from charts (some patients were missing data).
39
5.2 Survival Curves
5.2.1 Amalgam Survival Curve
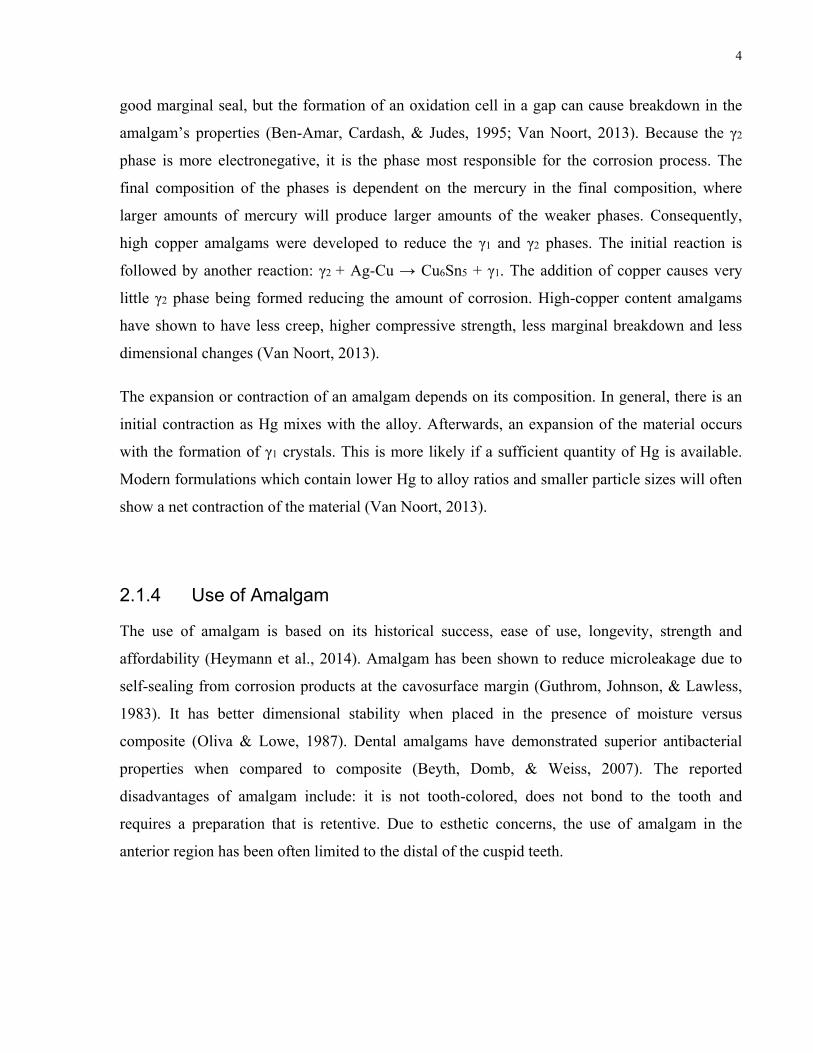
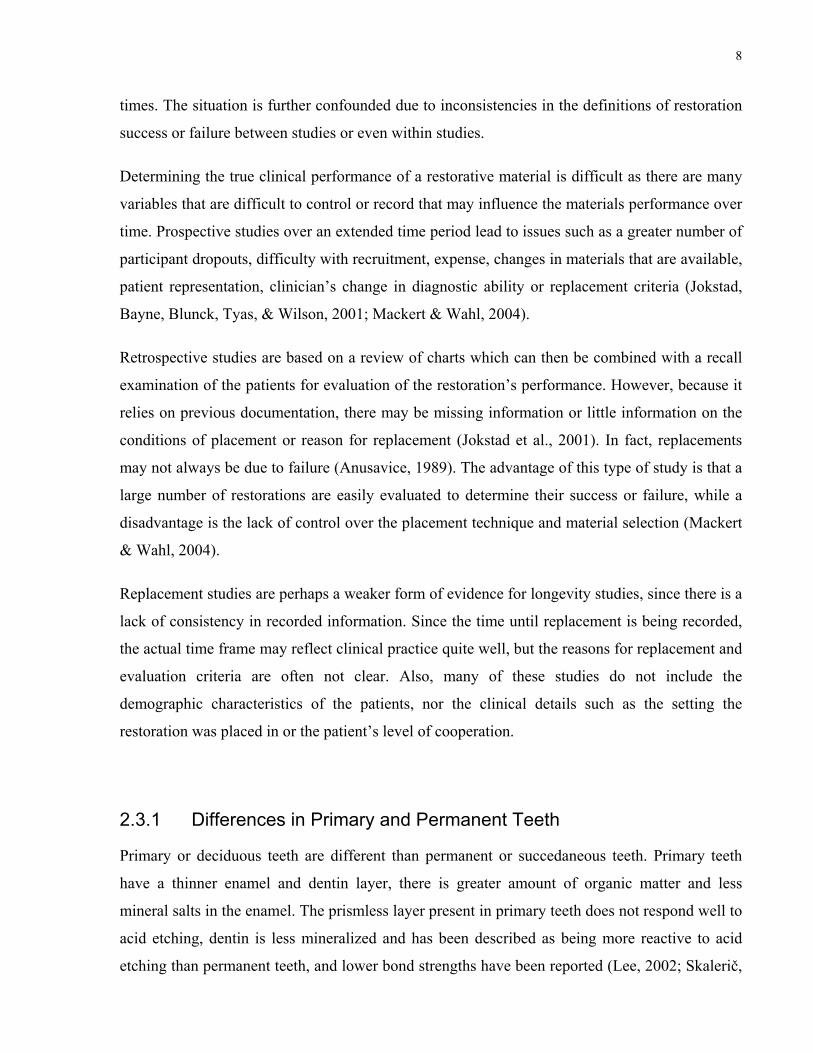
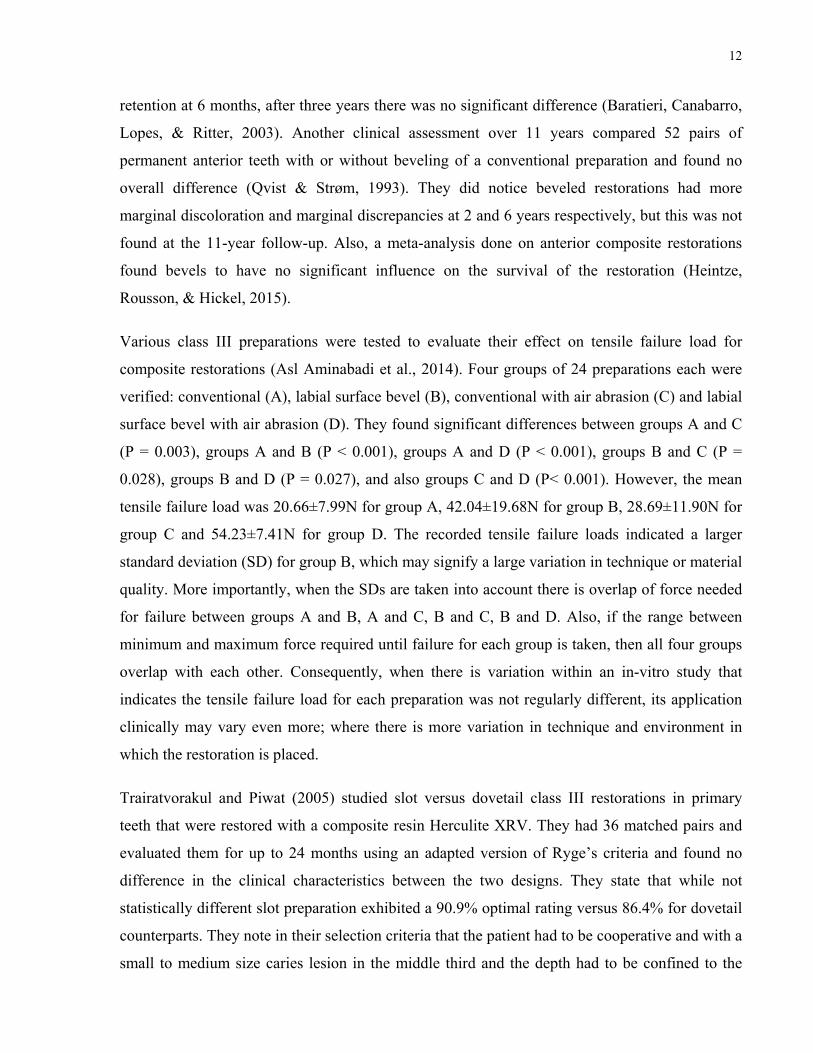
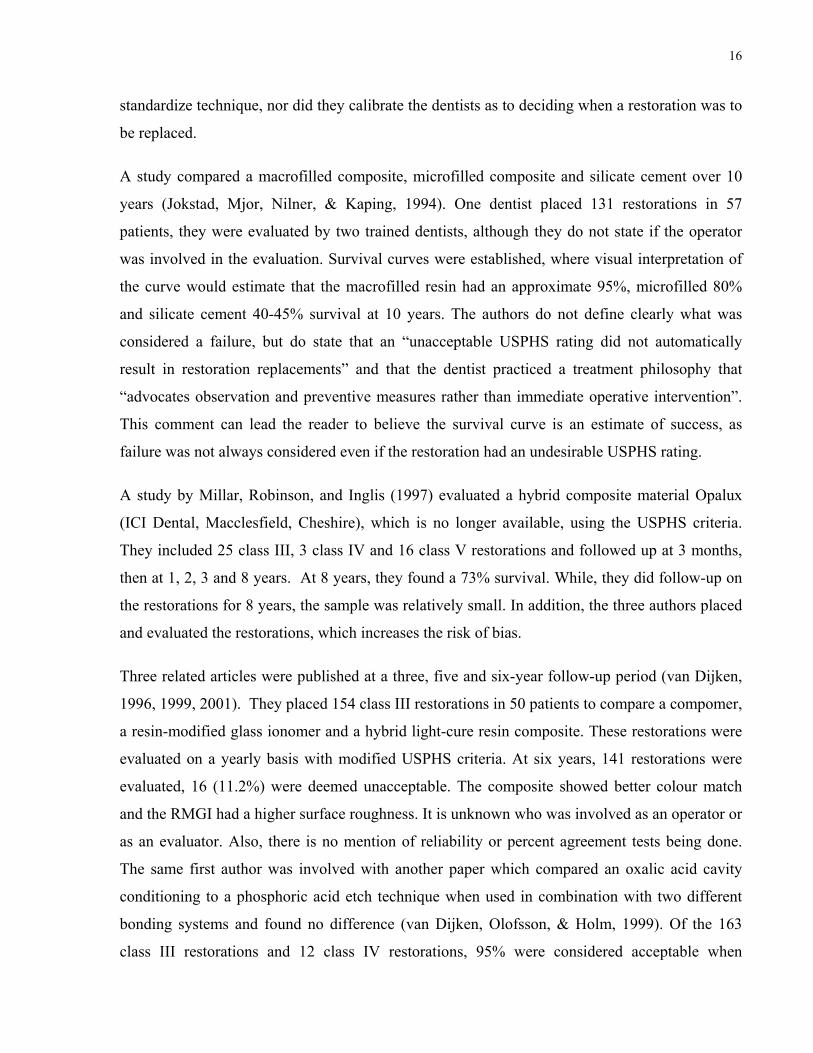
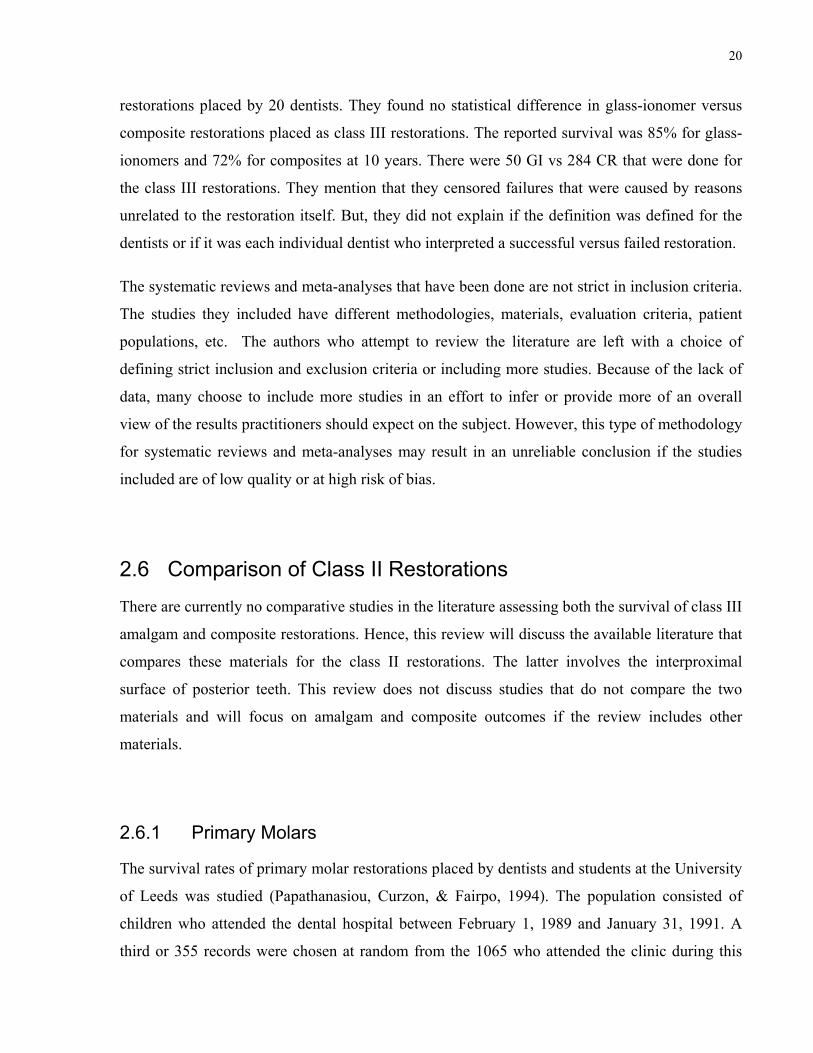
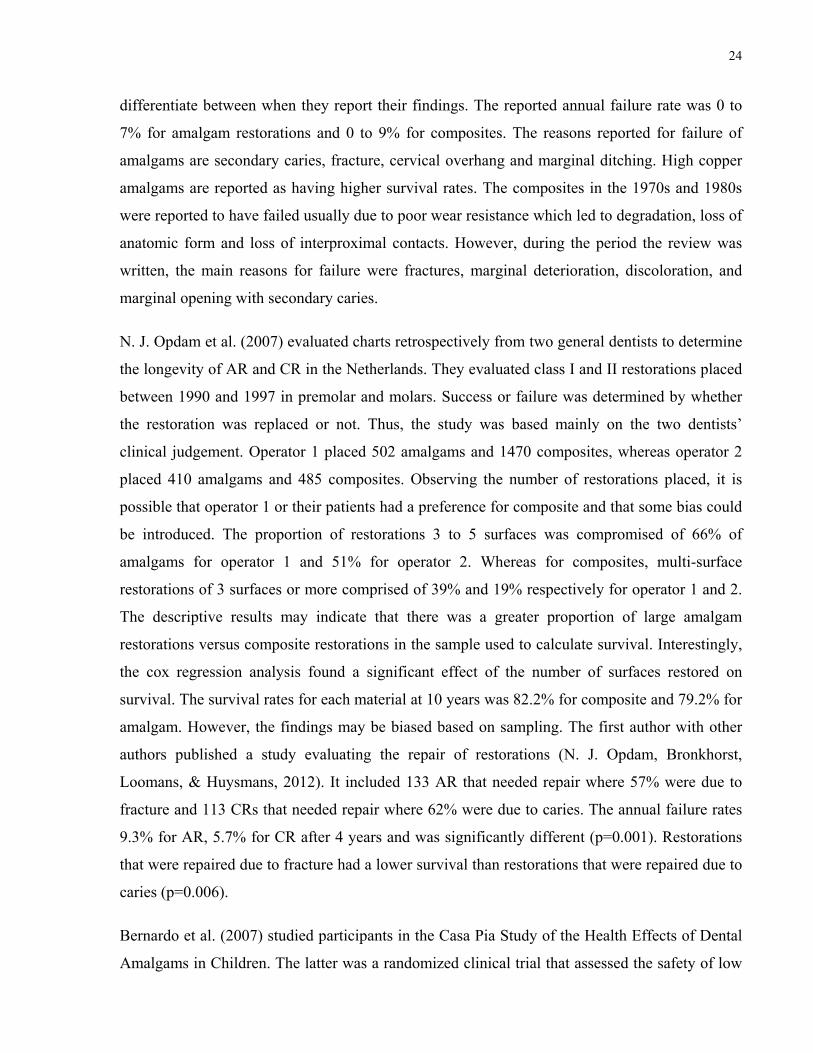
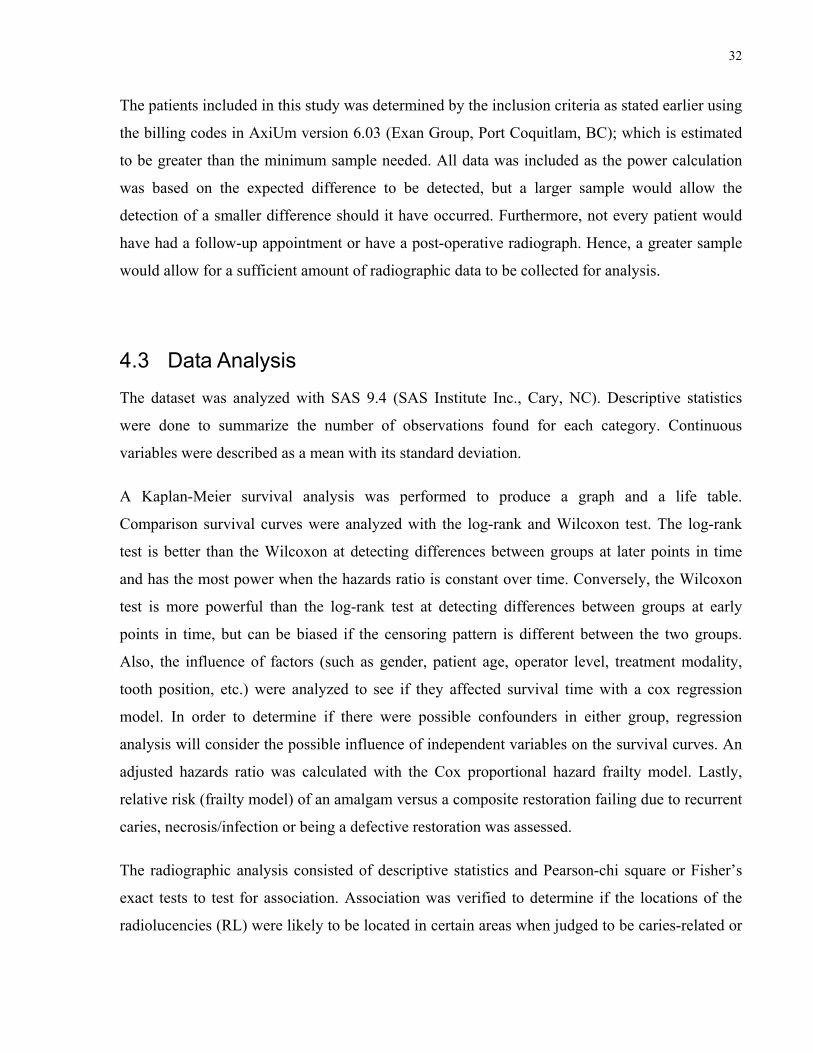
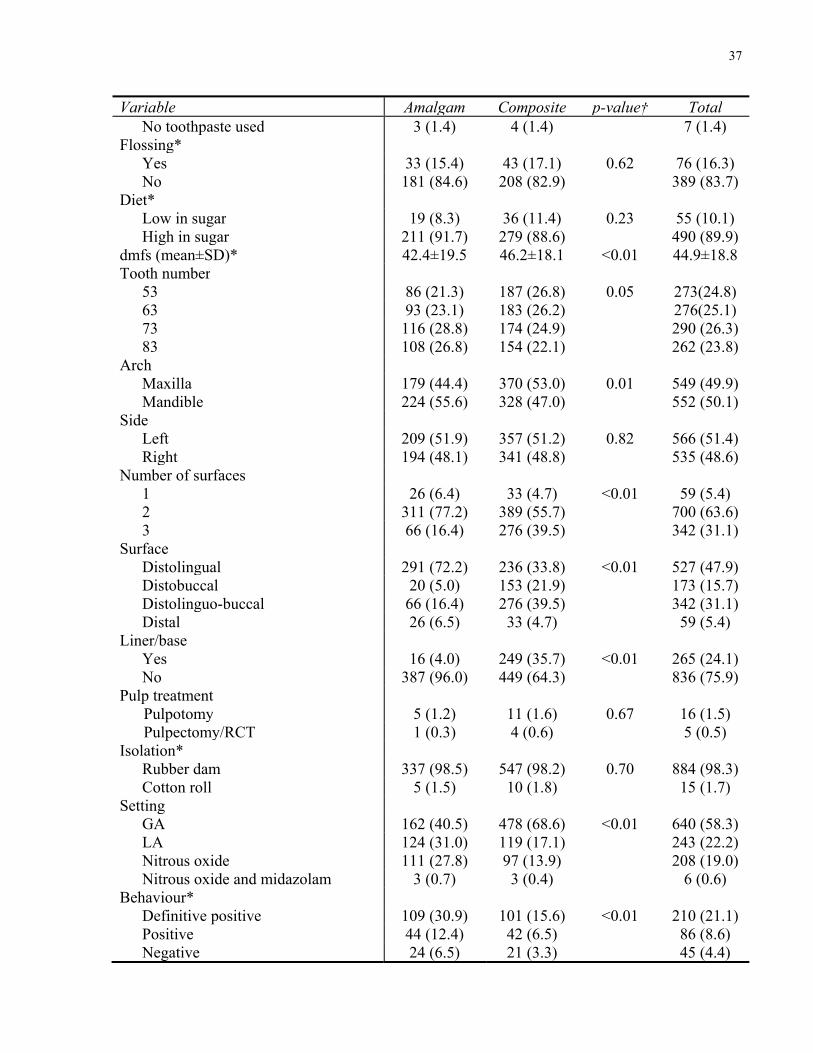
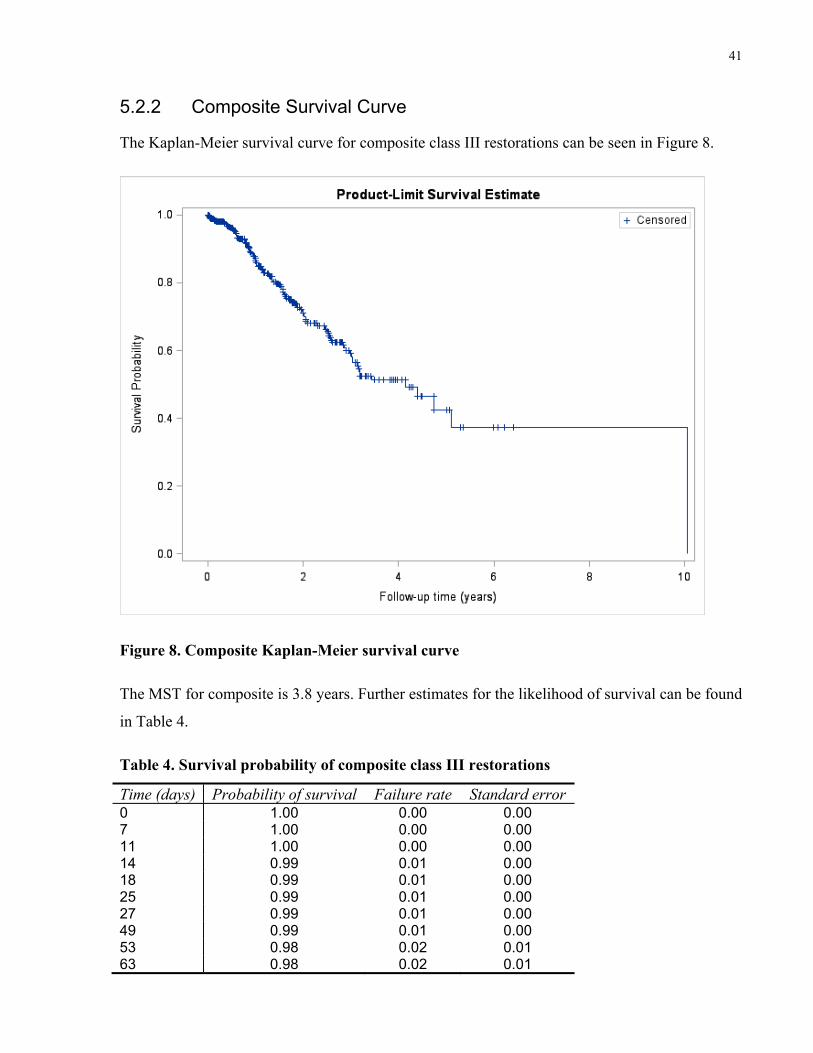
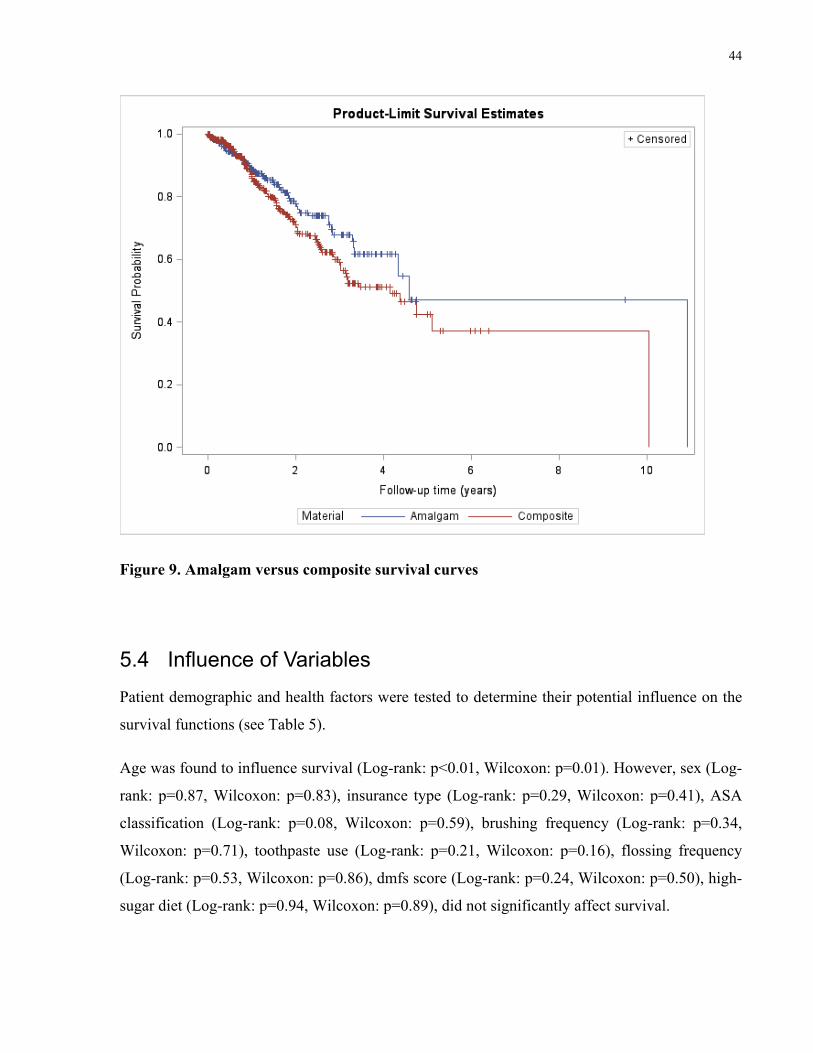
The Kaplan-Meier survival curve for amalgam class III restorations can be seen in Figure 7.
Figure 7. Amalgam Kaplan-Meier survival curve
The median survival time (MST) is described as the time at which an individual restoration has a
50% chance of exceeding. The MST for amalgam is 4.5 years. Further estimates for the
likelihood of survival can be found in Table 3.
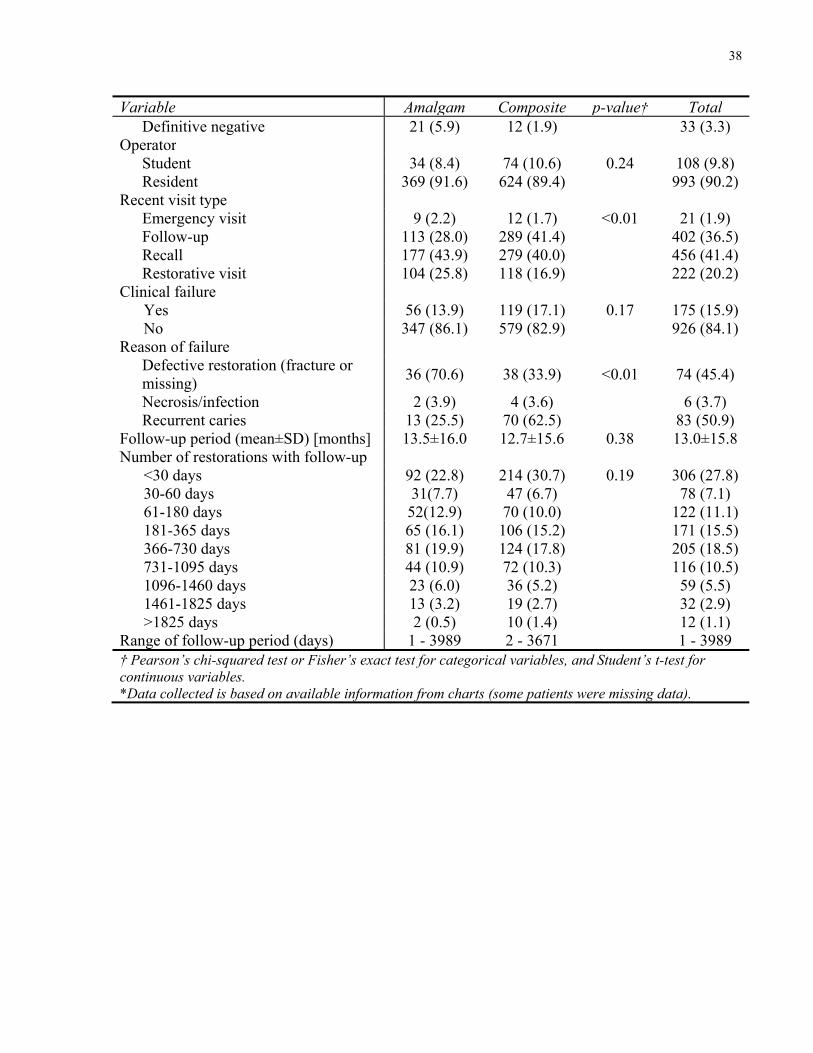
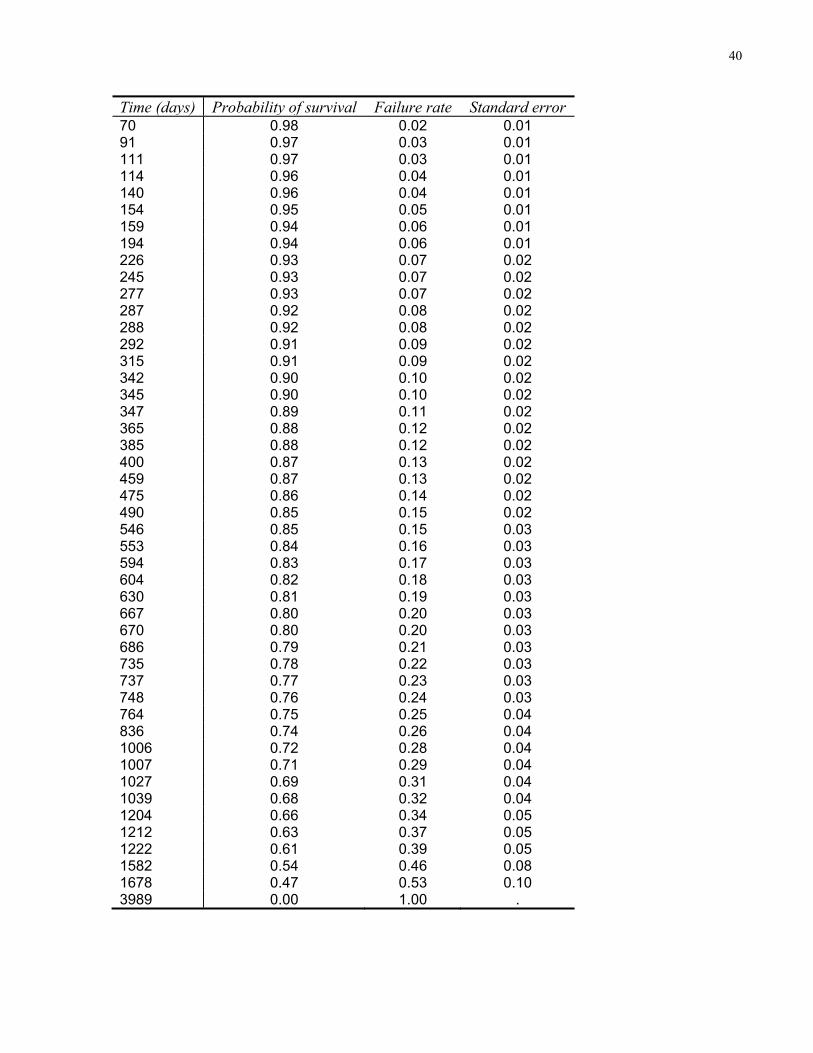
Table 3. Survival probability of amalgam class III restorations
Time (days) Probability of survival Failure rate Standard error0 1.00 0.00 0.0014 0.99 0.01 0.0021 0.99 0.01 0.0028 0.99 0.01 0.0141 0.99 0.01 0.0143 0.98 0.02 0.01
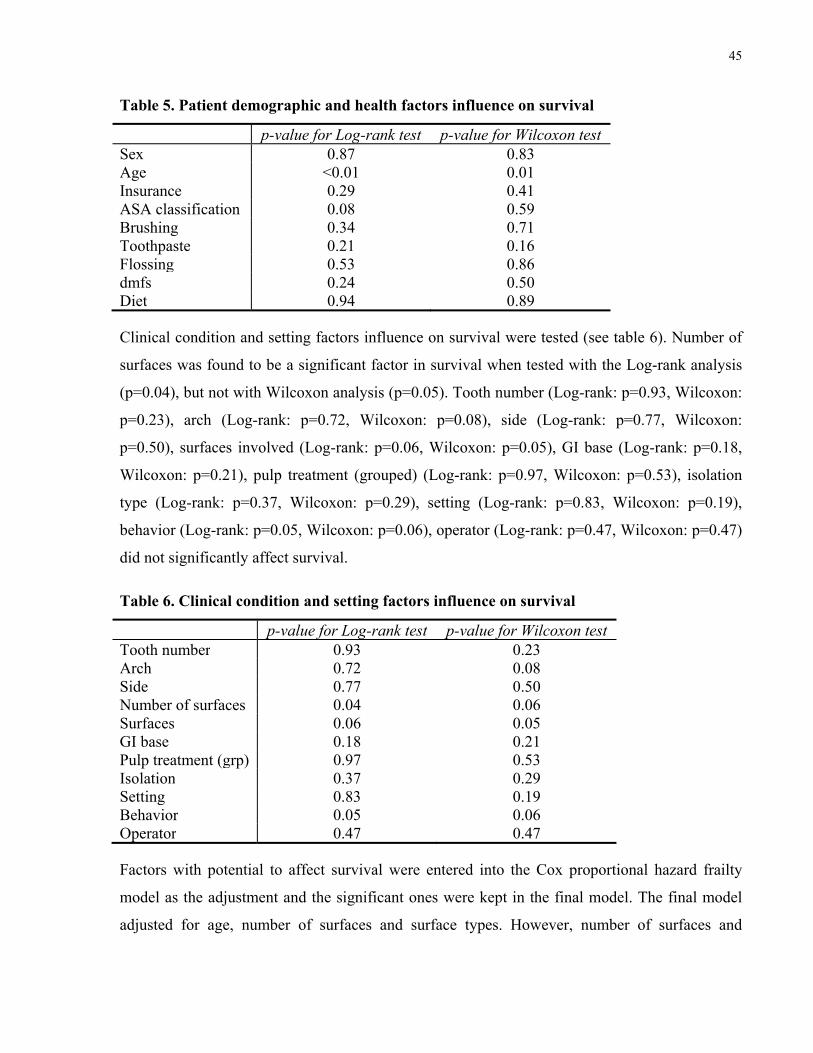
Table 6. Clinical condition and setting factors influence on survival
p-value for Log-rank test p-value for Wilcoxon test Tooth number 0.93 0.23Arch 0.72 0.08Side 0.77 0.50Number of surfaces 0.04 0.06Surfaces 0.06 0.05GI base 0.18 0.21Pulp treatment (grp) 0.97 0.53Isolation 0.37 0.29Setting 0.83 0.19Behavior 0.05 0.06Operator 0.47 0.47
Factors with potential to affect survival were entered into the Cox proportional hazard frailty
model as the adjustment and the significant ones were kept in the final model. The final model
adjusted for age, number of surfaces and surface types. However, number of surfaces and
46
surfaces demonstrated collinearity, thus only surface types was kept. The HR adjusted for age
and surface types was 0.77 (95% CI: 0.54, 1.09; p=0.14).
The effects of these factors are that a child aged less than five years old is 2.09 times more
frequently per unit time to fail versus a child who is older than seven years old (95% CI: 1.25,
3.90; p<0.01). Similarly, a child between five to seven years old is 2.06 times more frequently
per unit time to fail versus a child who is older than seven years old (95% CI: 1.24, 3.43;
p=0.01). The HR for a child less than five years old was not found to be significantly different
than a child between five to seven years old (HR: 1.01 [95% CI: 0.73, 1.39], p=0.95).
The effect of surface type showed an increased likelihood of failure for a disto-lingual (DL)
restorations versus a distal (D) restorations which was not statistically significant (HR: 2.15
[95% CI: 0.87, 5.36], p=0.10). The HR showed a 2.47 greater likelihood of a distolinguo-buccal
(DLB) versus distal restoration failing, which was not statistically significant (95% CI: 0.99,
6.16; p=0.05),
The HR for a disto-buccal (DB) versus distal restorations (p=0.30), disto-lingual versus
distolinguo-buccal restorations (p=0.44), disto-buccal versus distolinguo-buccal restorations
(p=0.10), disto-lingual versus disto-buccal restorations (p=0.30), were all not statistically
significant.
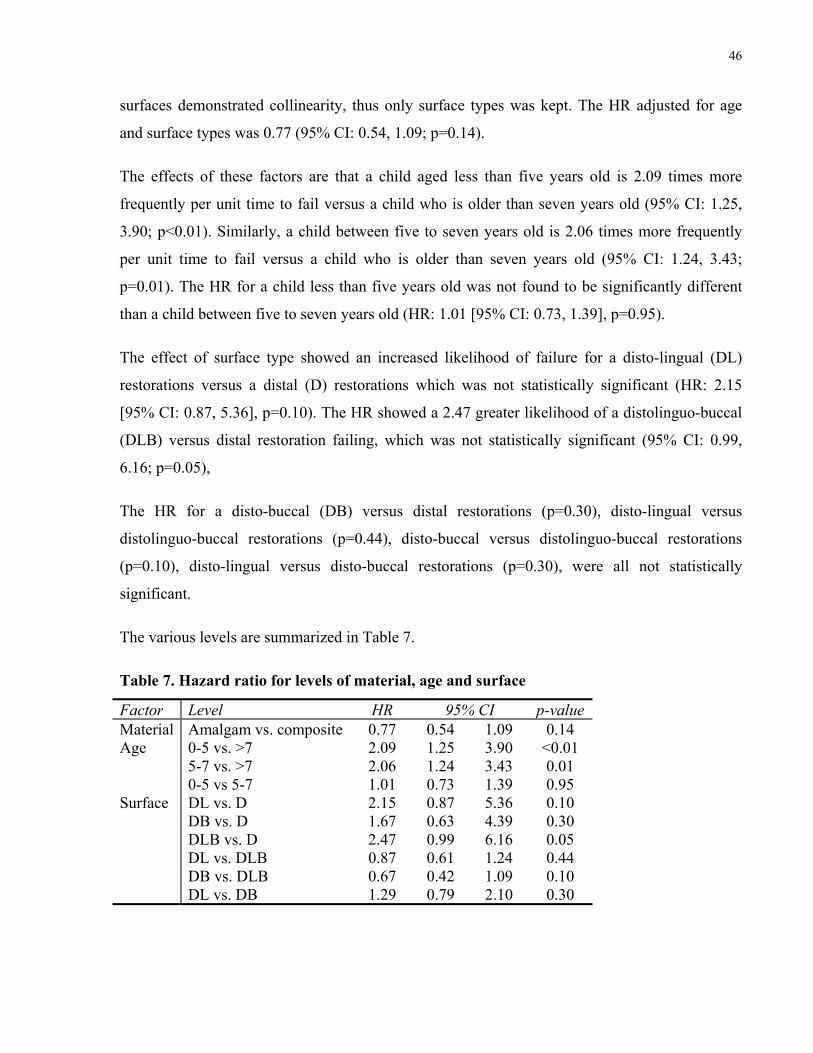
The various levels are summarized in Table 7.
Table 7. Hazard ratio for levels of material, age and surface
Factor Level HR 95% CI p-value Material Amalgam vs. composite 0.77 0.54 1.09 0.14 Age 0-5 vs. >7 2.09 1.25 3.90 <0.01
5-7 vs. >7 2.06 1.24 3.43 0.01 0-5 vs 5-7 1.01 0.73 1.39 0.95
Surface DL vs. D 2.15 0.87 5.36 0.10 DB vs. D 1.67 0.63 4.39 0.30 DLB vs. D 2.47 0.99 6.16 0.05 DL vs. DLB 0.87 0.61 1.24 0.44 DB vs. DLB 0.67 0.42 1.09 0.10 DL vs. DB 1.29 0.79 2.10 0.30
47
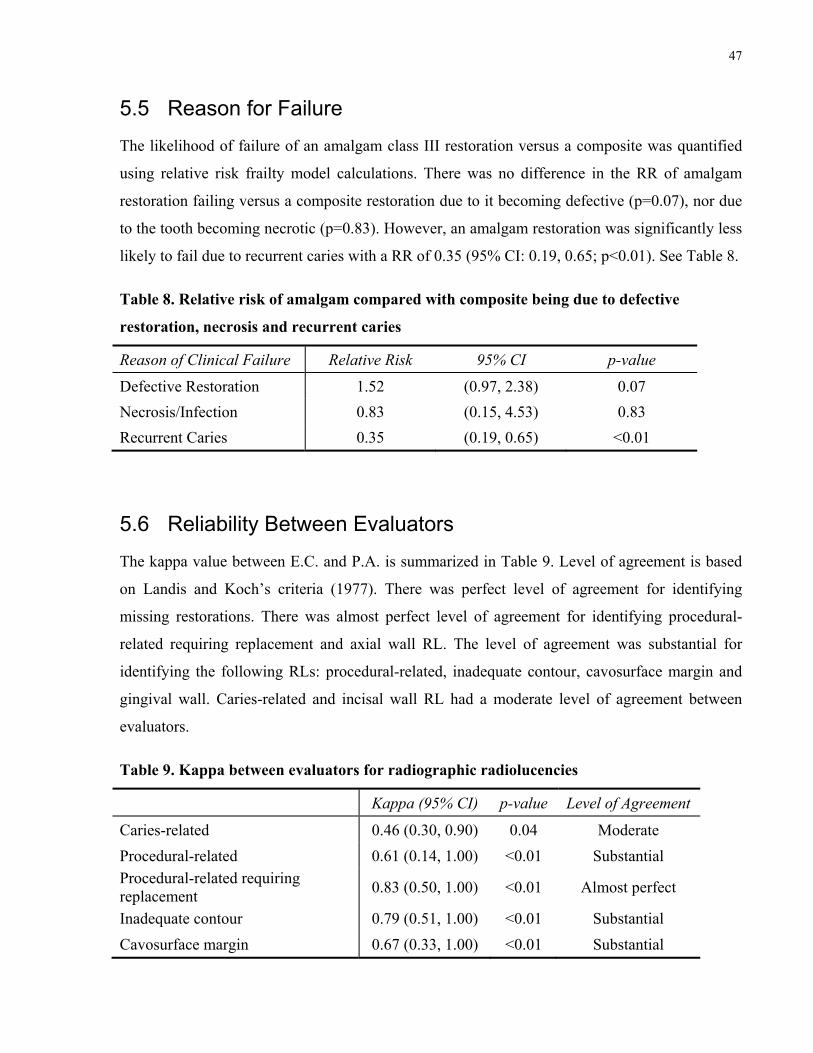
5.5 Reason for Failure
The likelihood of failure of an amalgam class III restoration versus a composite was quantified
using relative risk frailty model calculations. There was no difference in the RR of amalgam
restoration failing versus a composite restoration due to it becoming defective (p=0.07), nor due
to the tooth becoming necrotic (p=0.83). However, an amalgam restoration was significantly less
likely to fail due to recurrent caries with a RR of 0.35 (95% CI: 0.19, 0.65; p<0.01). See Table 8.
Table 8. Relative risk of amalgam compared with composite being due to defective
restoration, necrosis and recurrent caries
Reason of Clinical Failure Relative Risk 95% CI p-value
Defective Restoration 1.52 (0.97, 2.38) 0.07
Necrosis/Infection 0.83 (0.15, 4.53) 0.83
Recurrent Caries 0.35 (0.19, 0.65) <0.01
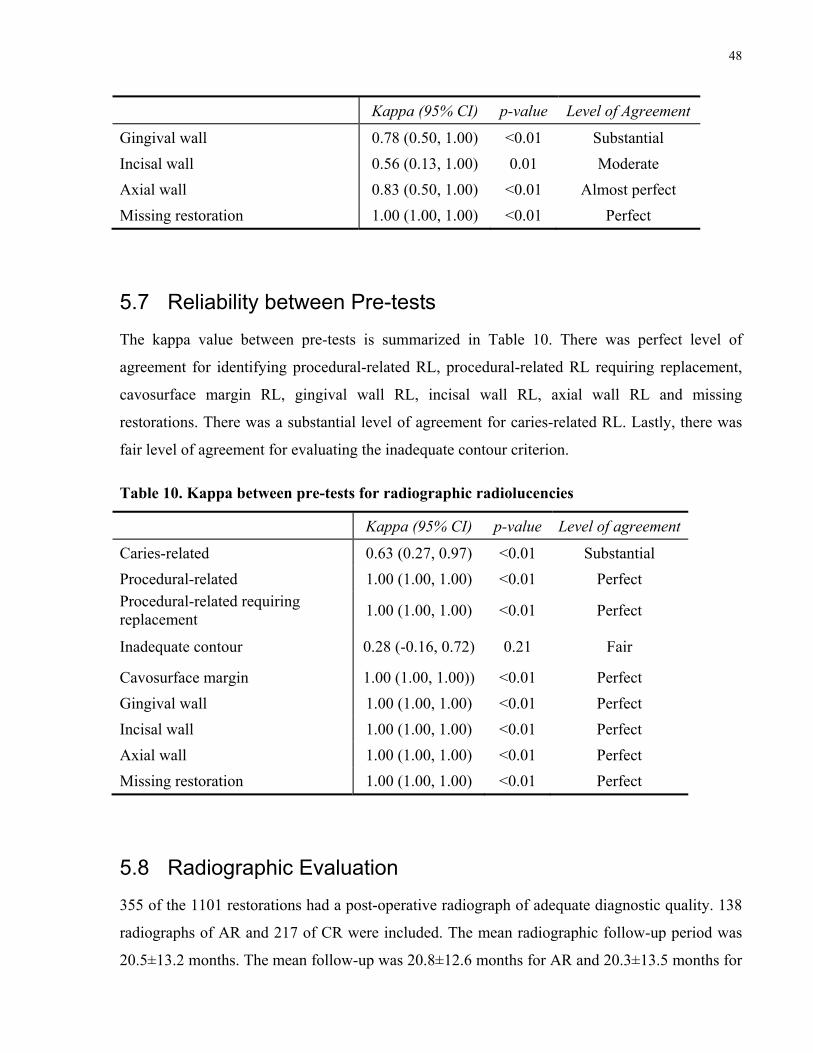
5.6 Reliability Between Evaluators
The kappa value between E.C. and P.A. is summarized in Table 9. Level of agreement is based
on Landis and Koch’s criteria (1977). There was perfect level of agreement for identifying
missing restorations. There was almost perfect level of agreement for identifying procedural-
related requiring replacement and axial wall RL. The level of agreement was substantial for
identifying the following RLs: procedural-related, inadequate contour, cavosurface margin and
gingival wall. Caries-related and incisal wall RL had a moderate level of agreement between
evaluators.
Table 9. Kappa between evaluators for radiographic radiolucencies
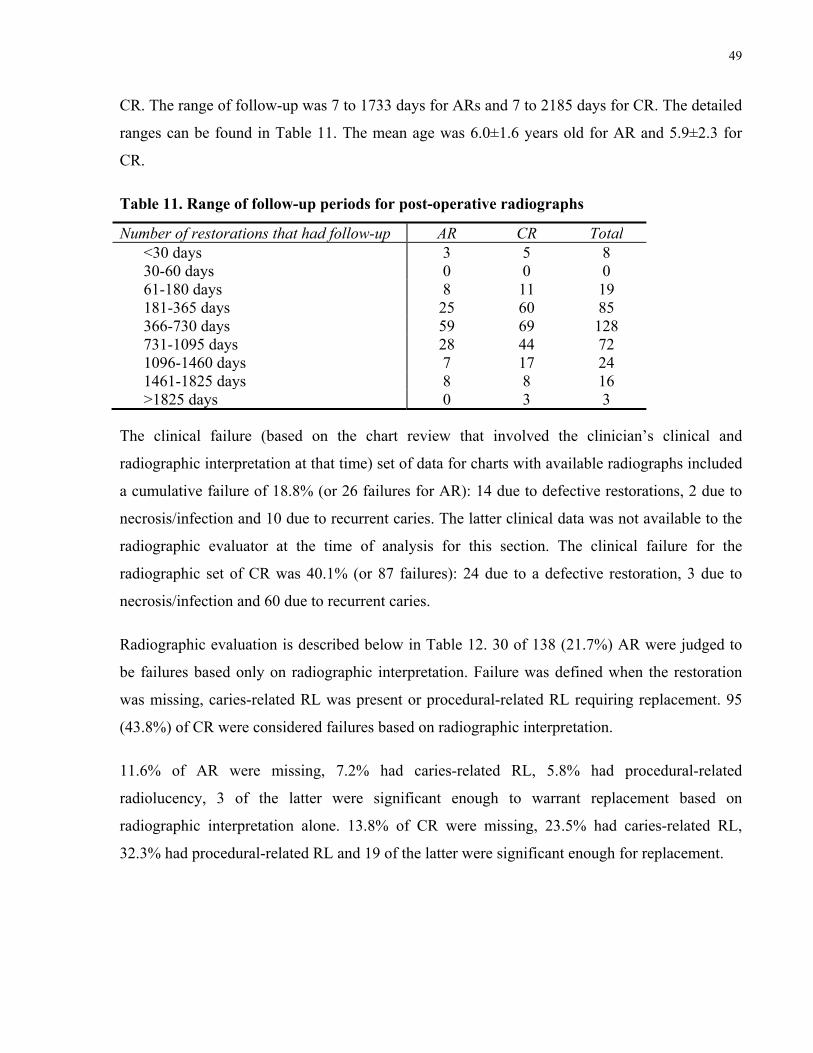
355 of the 1101 restorations had a post-operative radiograph of adequate diagnostic quality. 138
radiographs of AR and 217 of CR were included. The mean radiographic follow-up period was
20.5±13.2 months. The mean follow-up was 20.8±12.6 months for AR and 20.3±13.5 months for
49
CR. The range of follow-up was 7 to 1733 days for ARs and 7 to 2185 days for CR. The detailed
ranges can be found in Table 11. The mean age was 6.0±1.6 years old for AR and 5.9±2.3 for
CR.
Table 11. Range of follow-up periods for post-operative radiographs
Number of restorations that had follow-up AR CR Total <30 days 3 5 8 30-60 days 0 0 0 61-180 days 8 11 19 181-365 days 25 60 85 366-730 days 59 69 128 731-1095 days 28 44 72 1096-1460 days 7 17 24 1461-1825 days 8 8 16 >1825 days 0 3 3
The clinical failure (based on the chart review that involved the clinician’s clinical and
radiographic interpretation at that time) set of data for charts with available radiographs included
a cumulative failure of 18.8% (or 26 failures for AR): 14 due to defective restorations, 2 due to
necrosis/infection and 10 due to recurrent caries. The latter clinical data was not available to the
radiographic evaluator at the time of analysis for this section. The clinical failure for the
radiographic set of CR was 40.1% (or 87 failures): 24 due to a defective restoration, 3 due to
necrosis/infection and 60 due to recurrent caries.
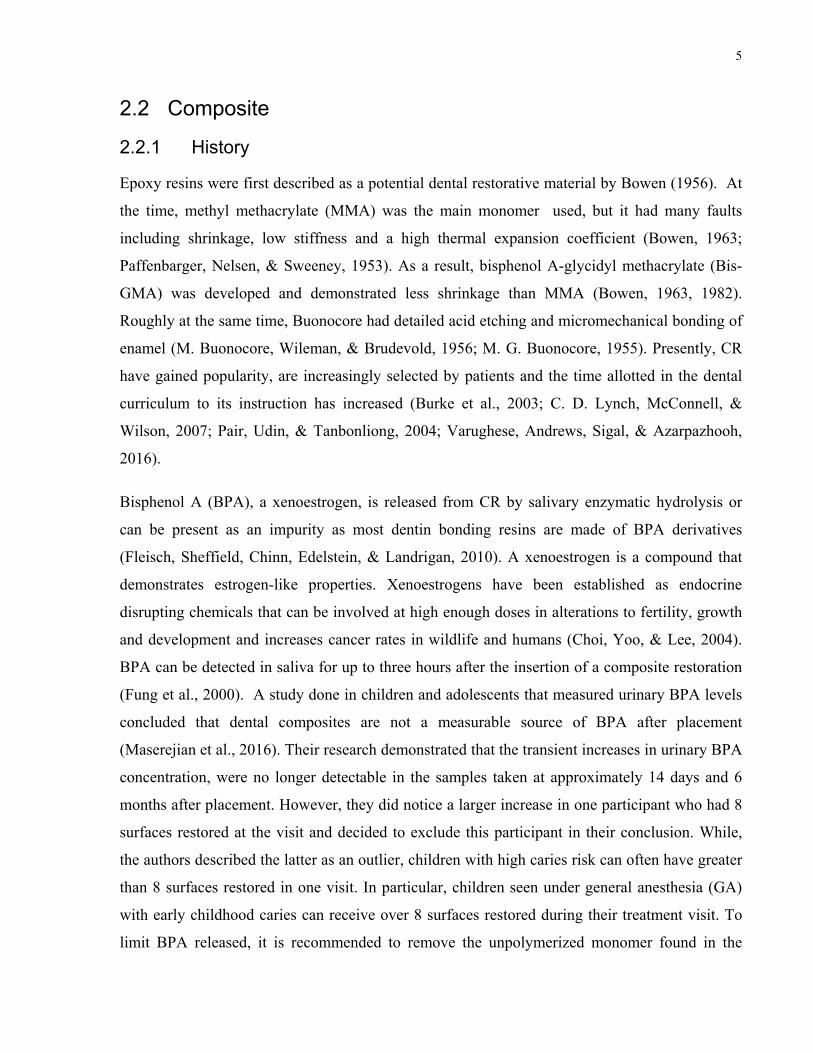
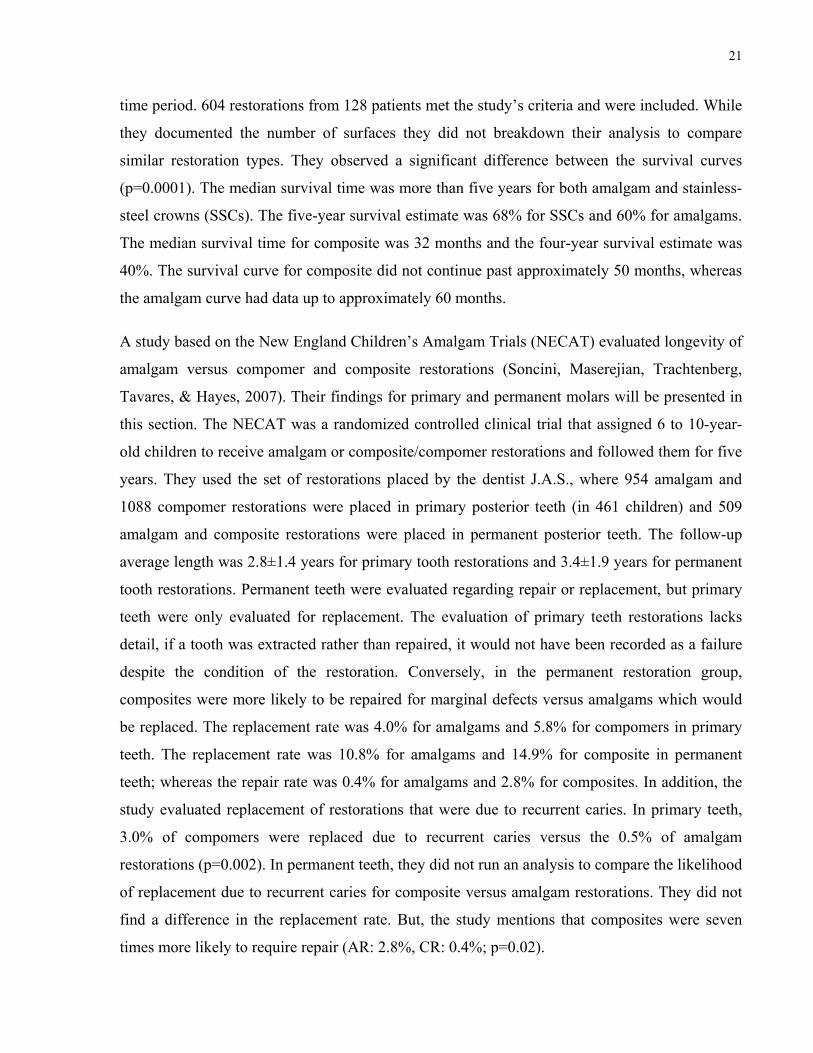
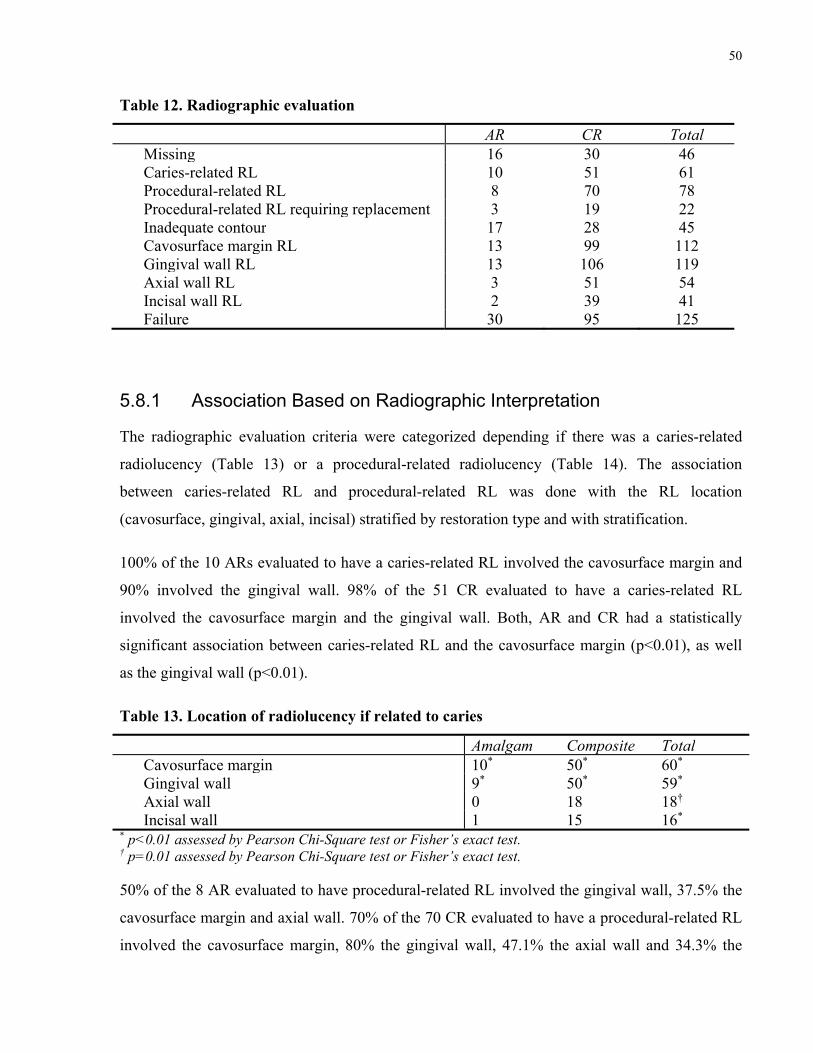
Radiographic evaluation is described below in Table 12. 30 of 138 (21.7%) AR were judged to
be failures based only on radiographic interpretation. Failure was defined when the restoration
was missing, caries-related RL was present or procedural-related RL requiring replacement. 95
(43.8%) of CR were considered failures based on radiographic interpretation.
11.6% of AR were missing, 7.2% had caries-related RL, 5.8% had procedural-related
radiolucency, 3 of the latter were significant enough to warrant replacement based on
radiographic interpretation alone. 13.8% of CR were missing, 23.5% had caries-related RL,
32.3% had procedural-related RL and 19 of the latter were significant enough for replacement.
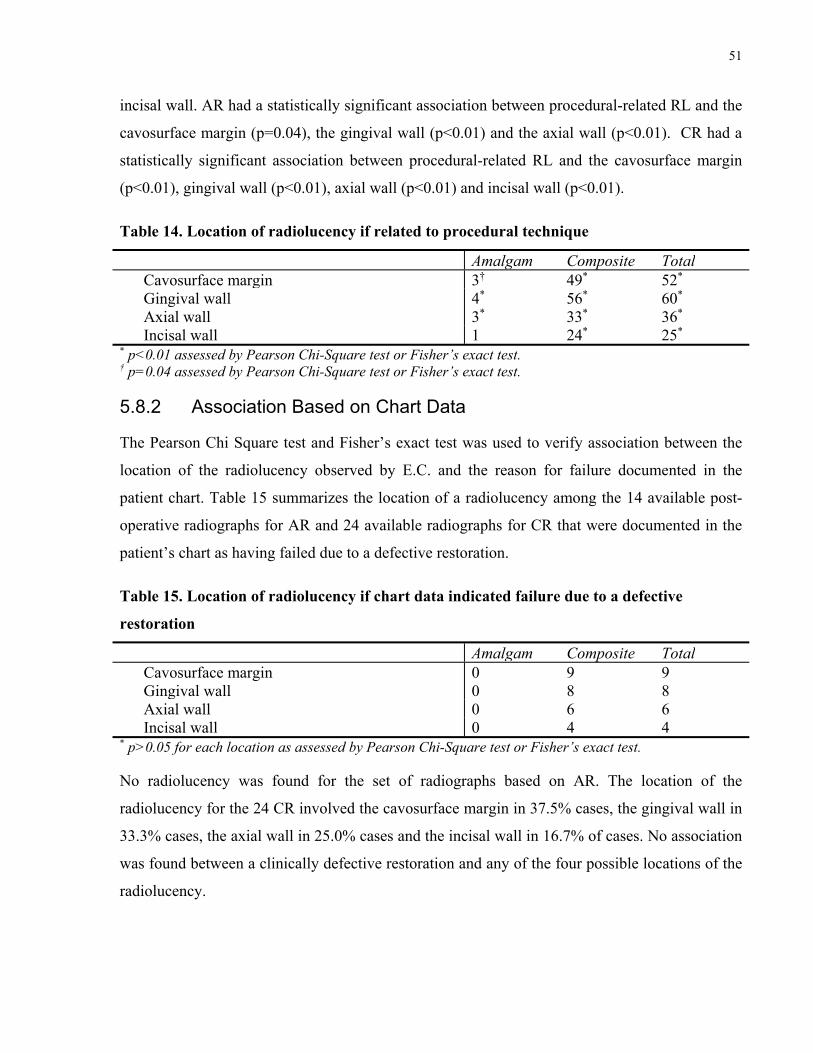
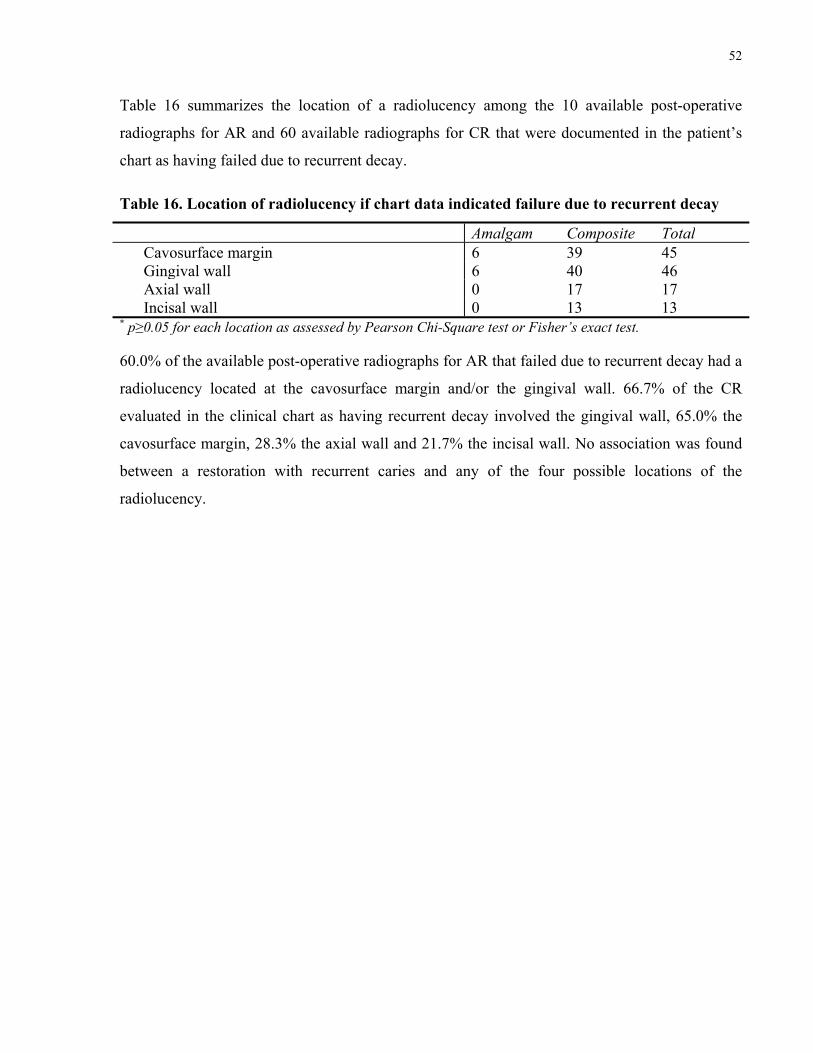
* p≥0.05 for each location as assessed by Pearson Chi-Square test or Fisher’s exact test.
60.0% of the available post-operative radiographs for AR that failed due to recurrent decay had a
radiolucency located at the cavosurface margin and/or the gingival wall. 66.7% of the CR
evaluated in the clinical chart as having recurrent decay involved the gingival wall, 65.0% the
cavosurface margin, 28.3% the axial wall and 21.7% the incisal wall. No association was found
between a restoration with recurrent caries and any of the four possible locations of the
radiolucency.
53
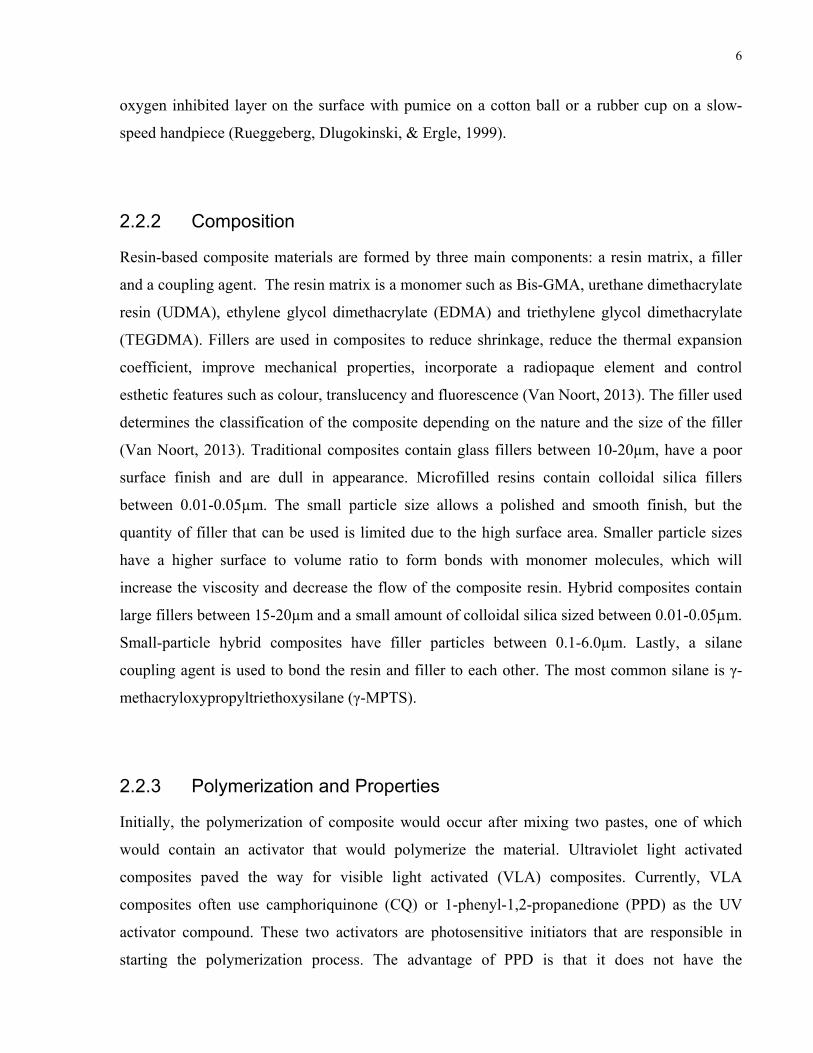
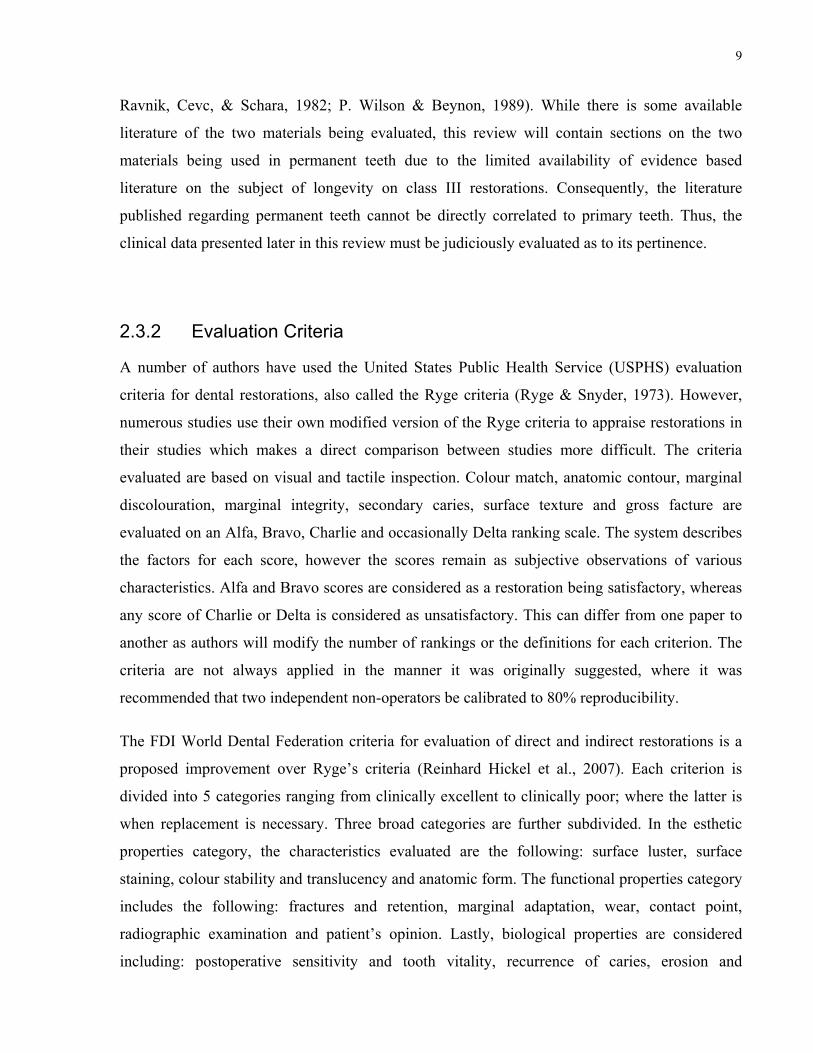
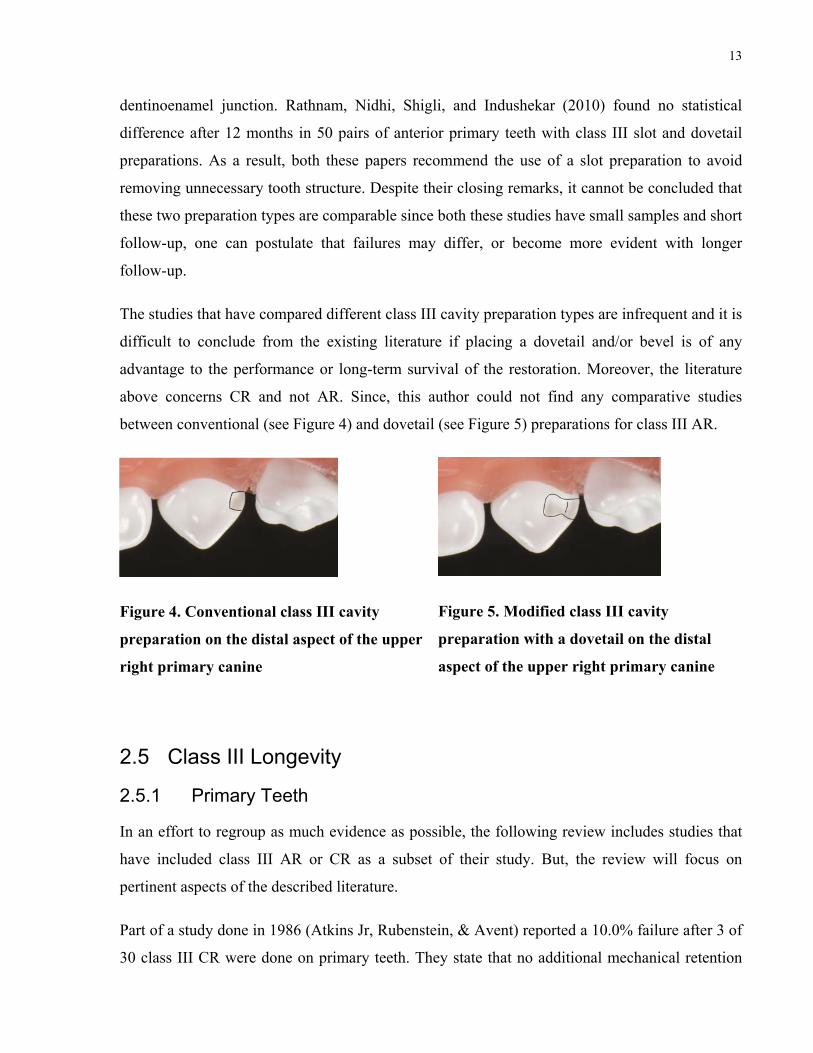
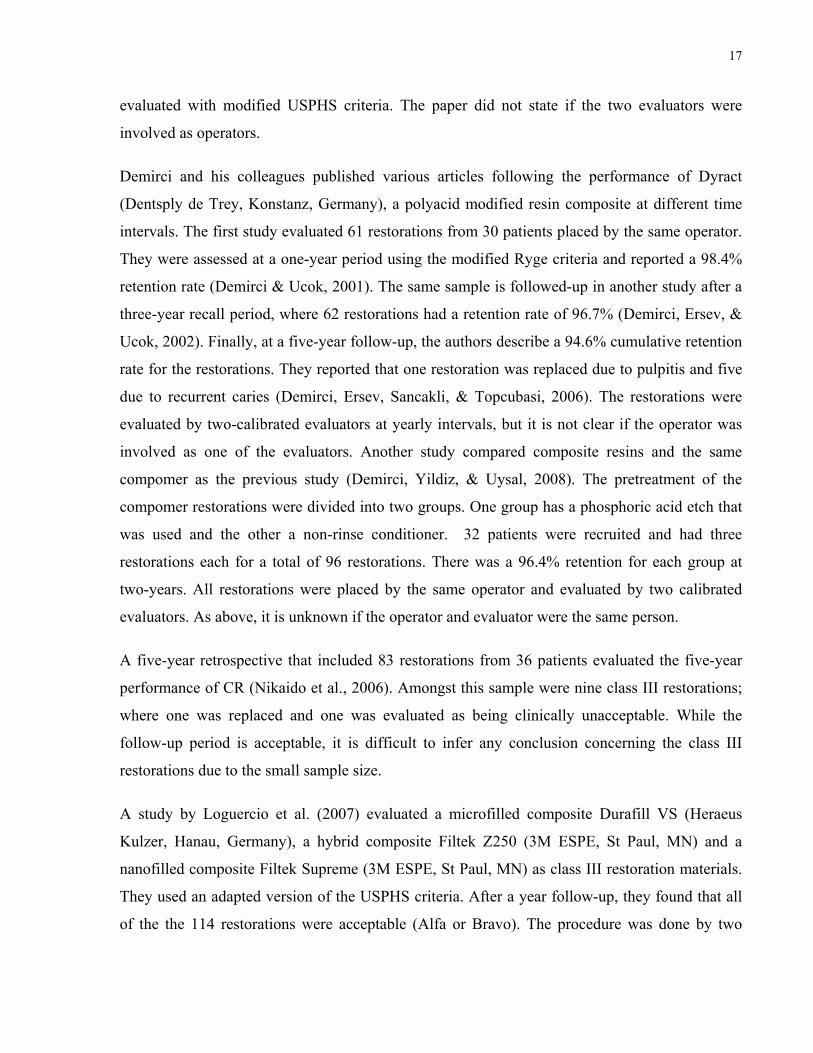
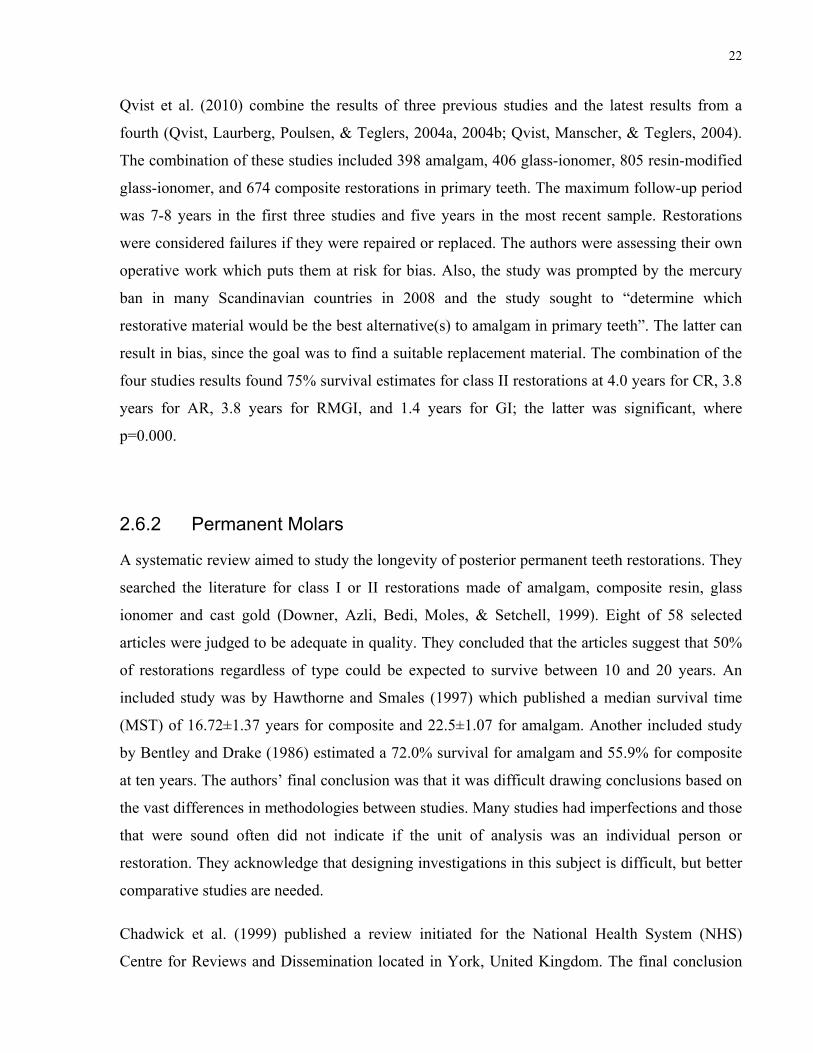
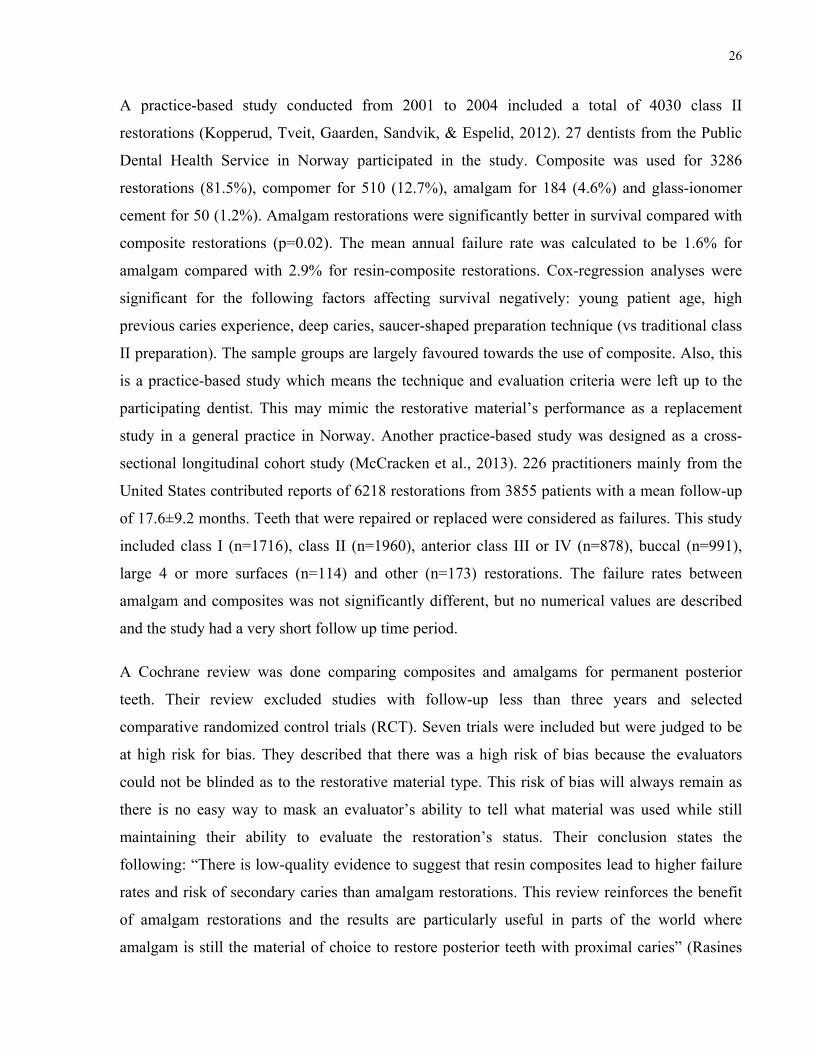
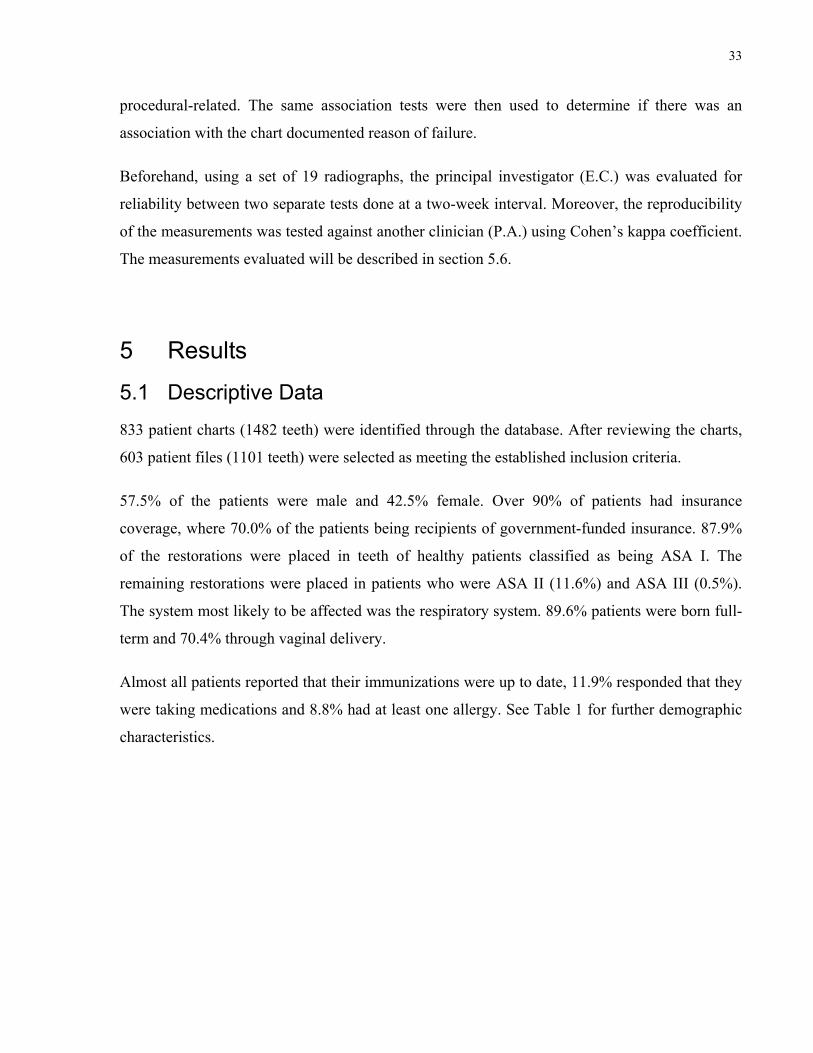
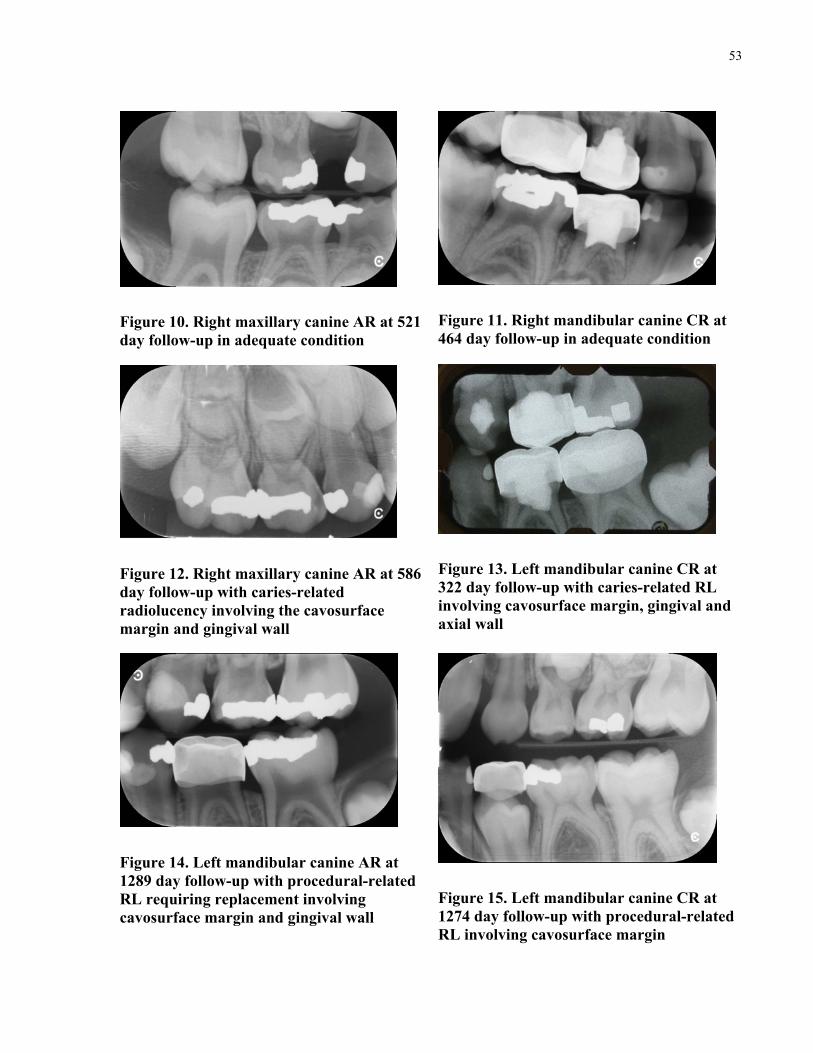
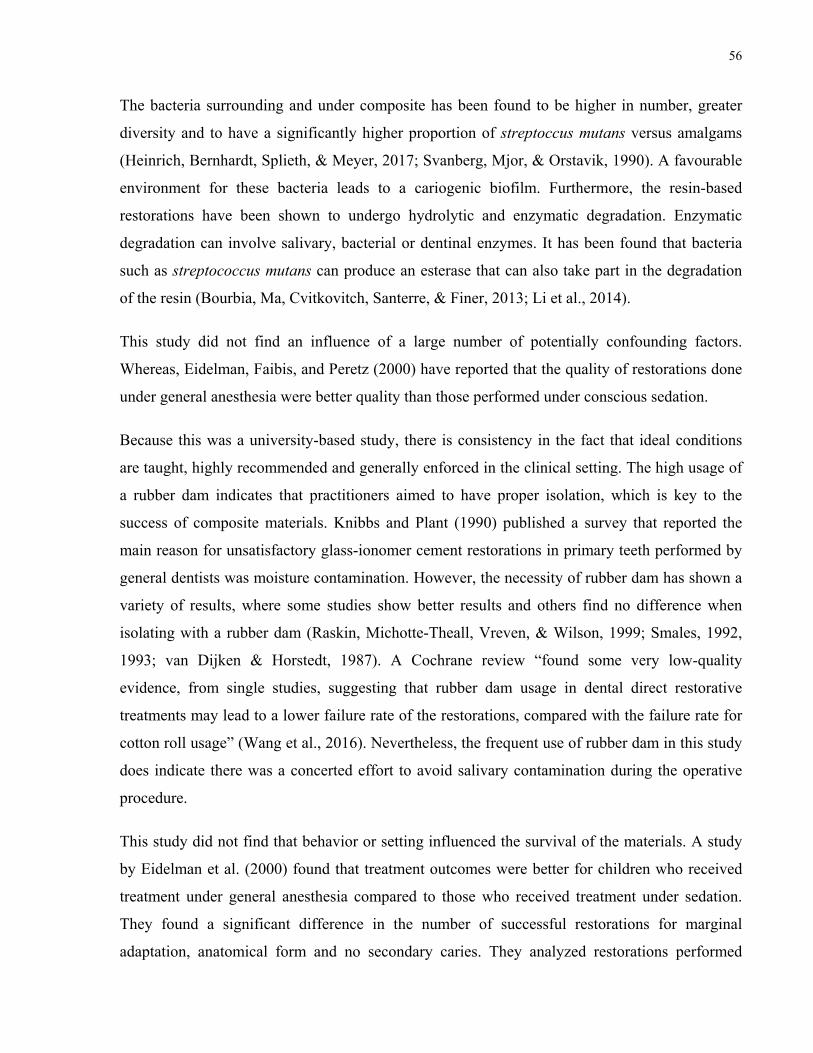
Figure 10. Right maxillary canine AR at 521 day follow-up in adequate condition
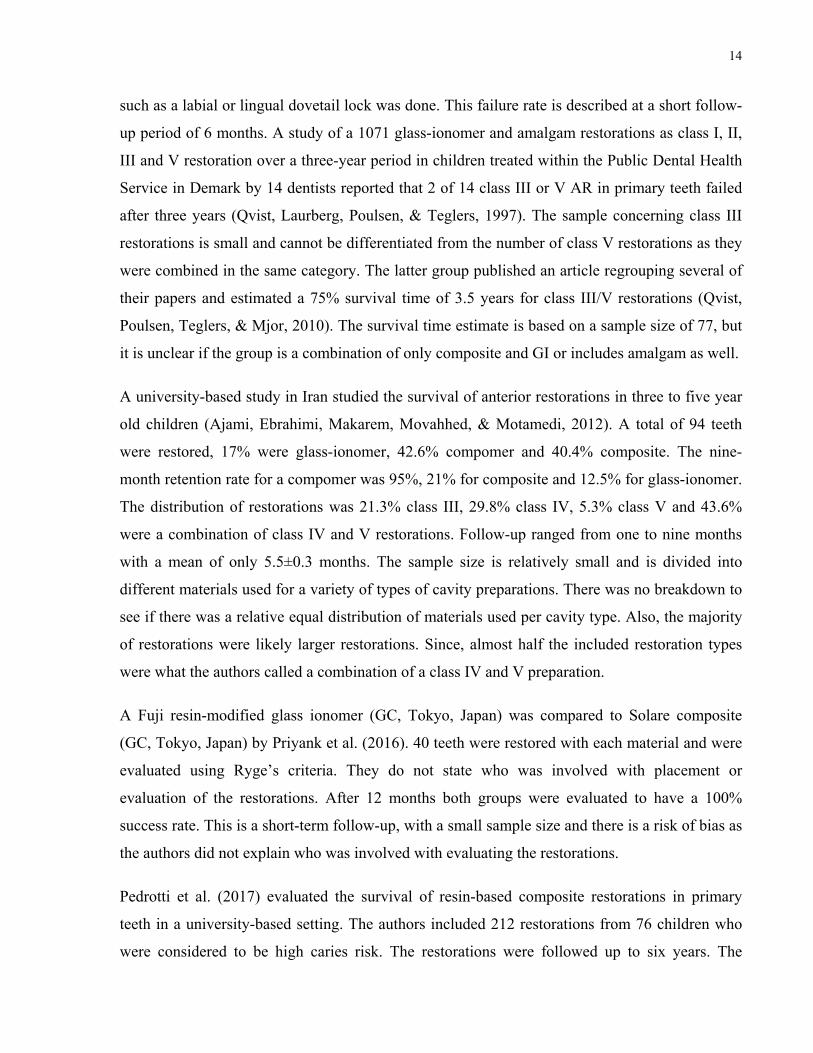
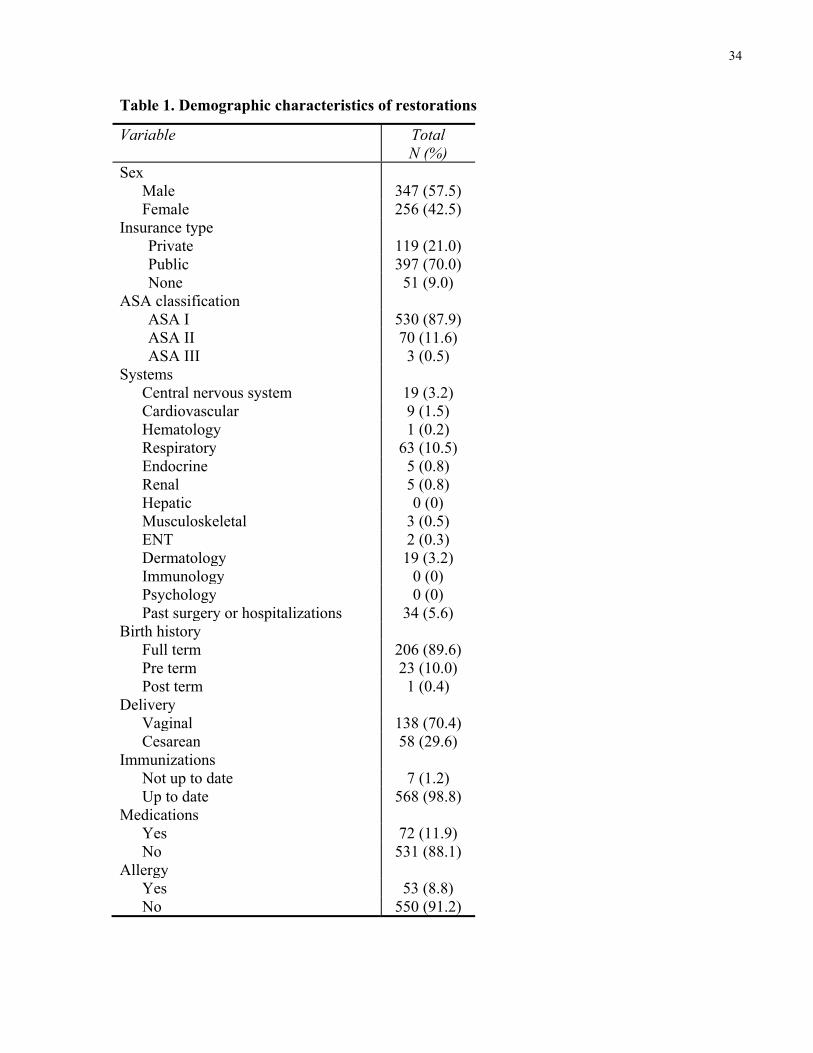
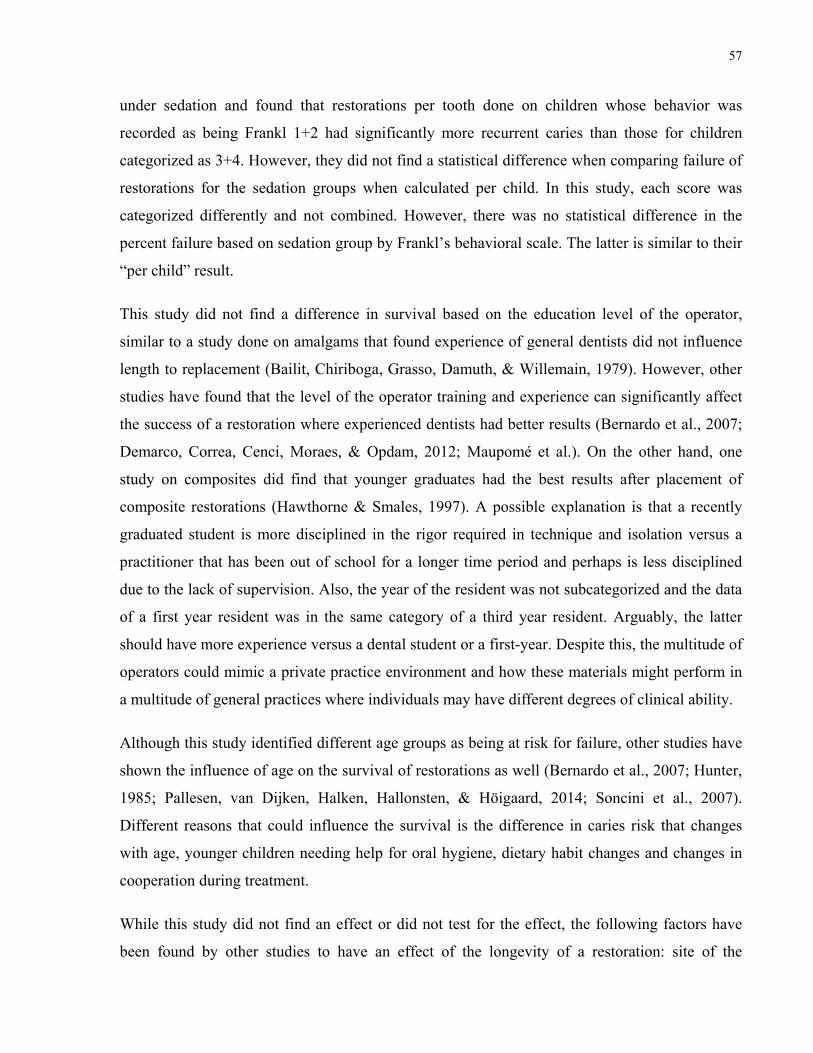
Figure 11. Right mandibular canine CR at 464 day follow-up in adequate condition
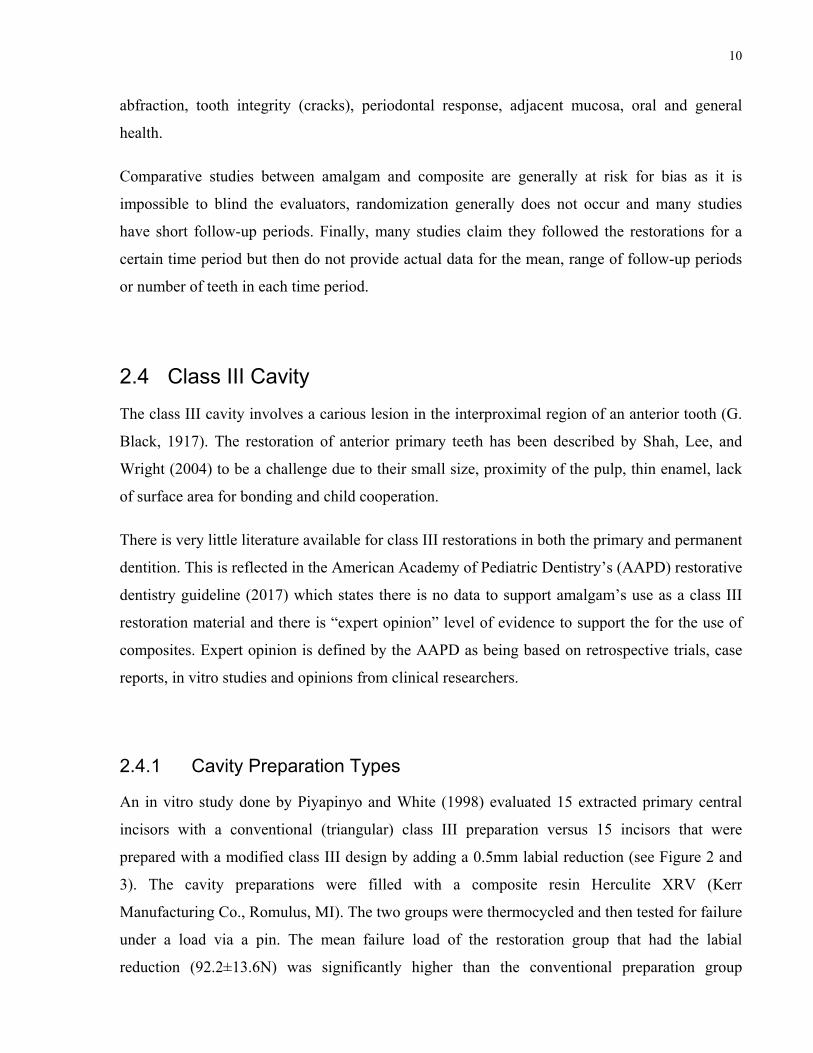
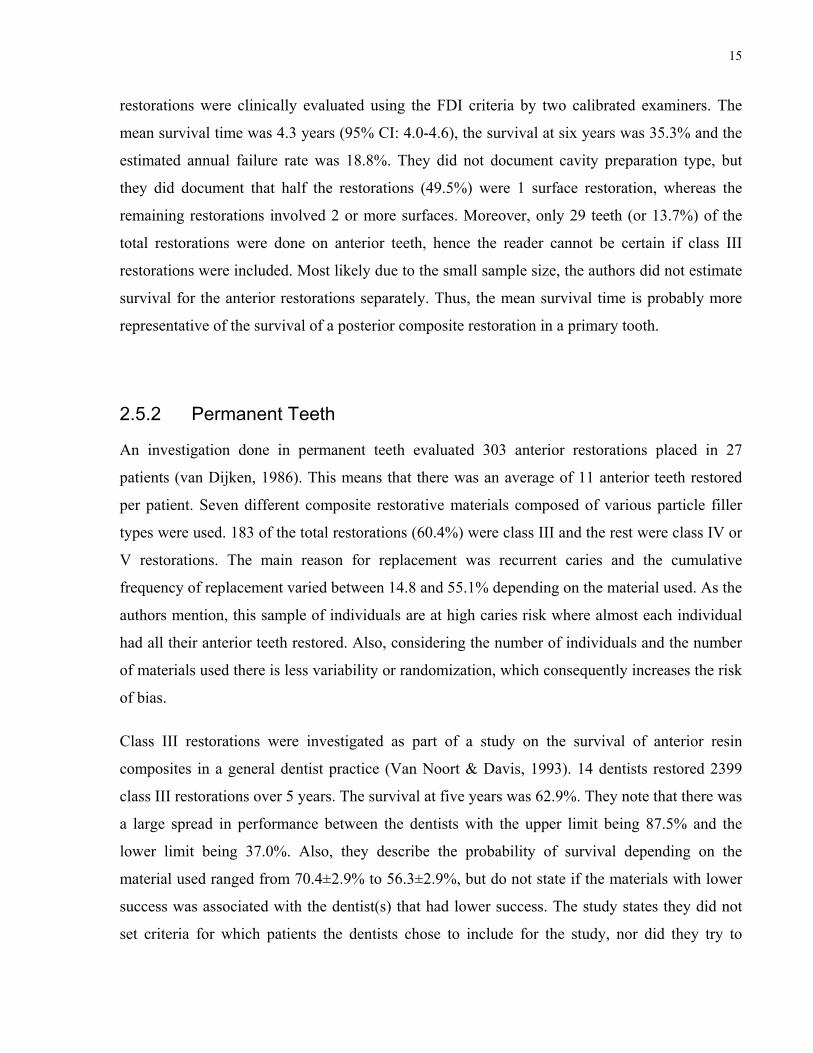
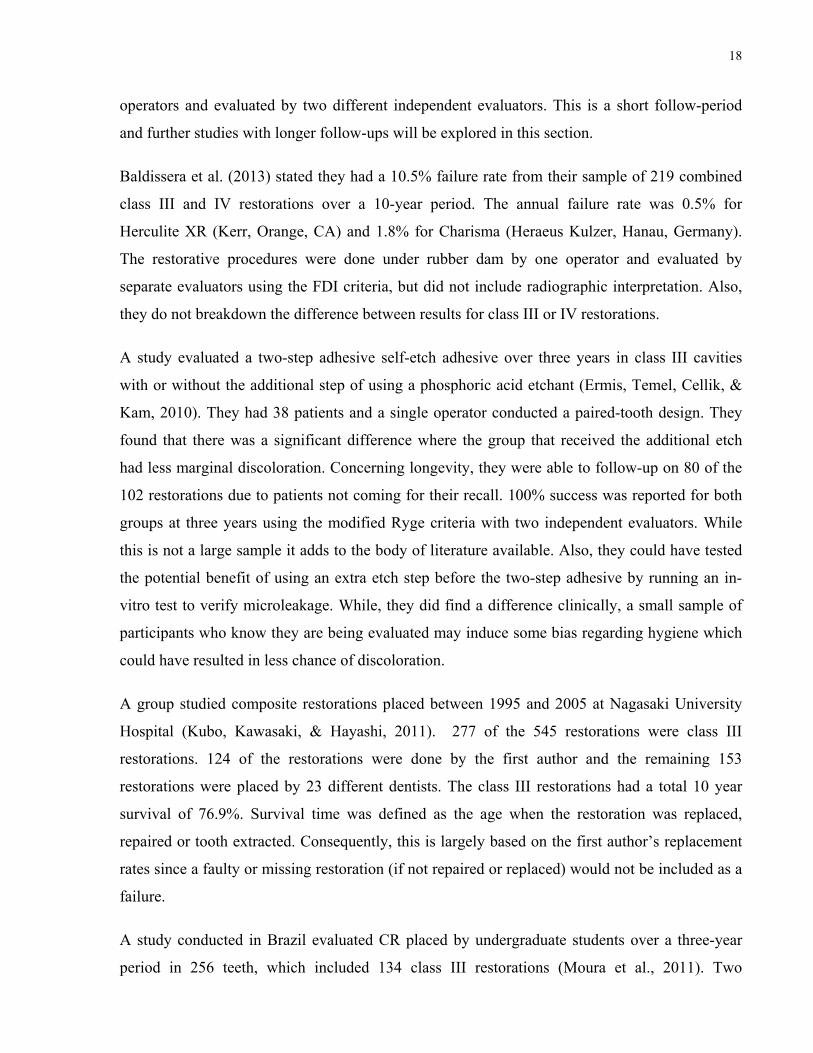
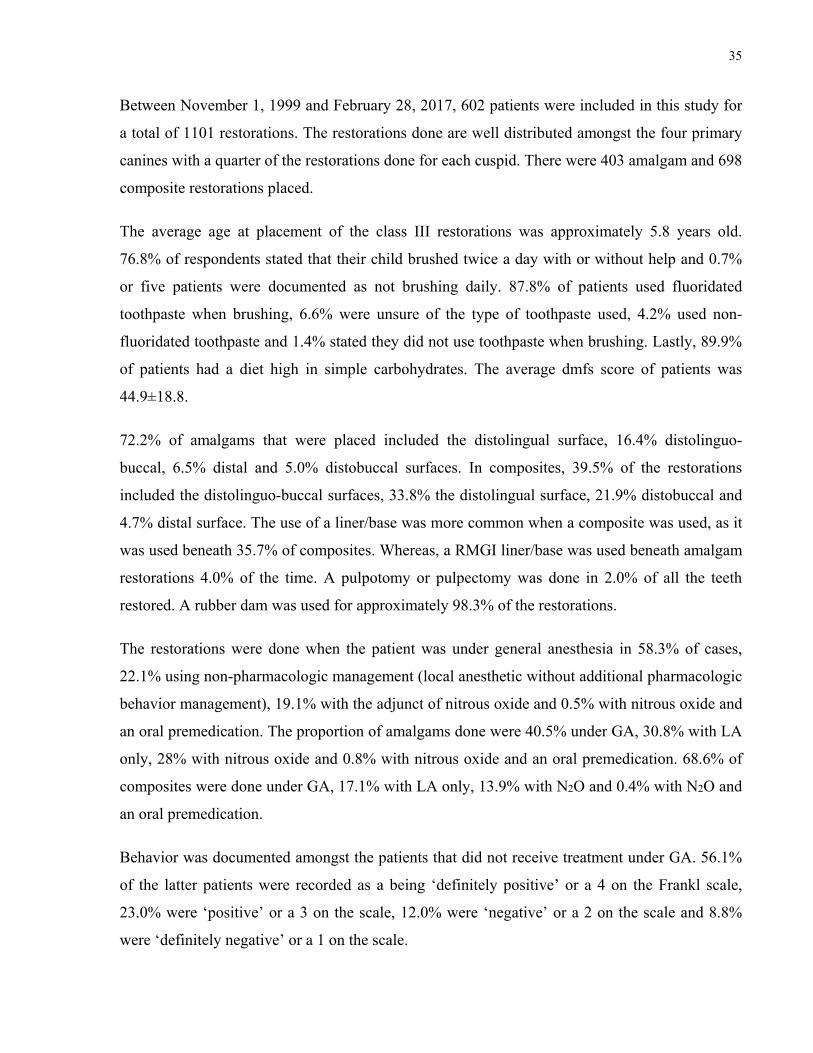
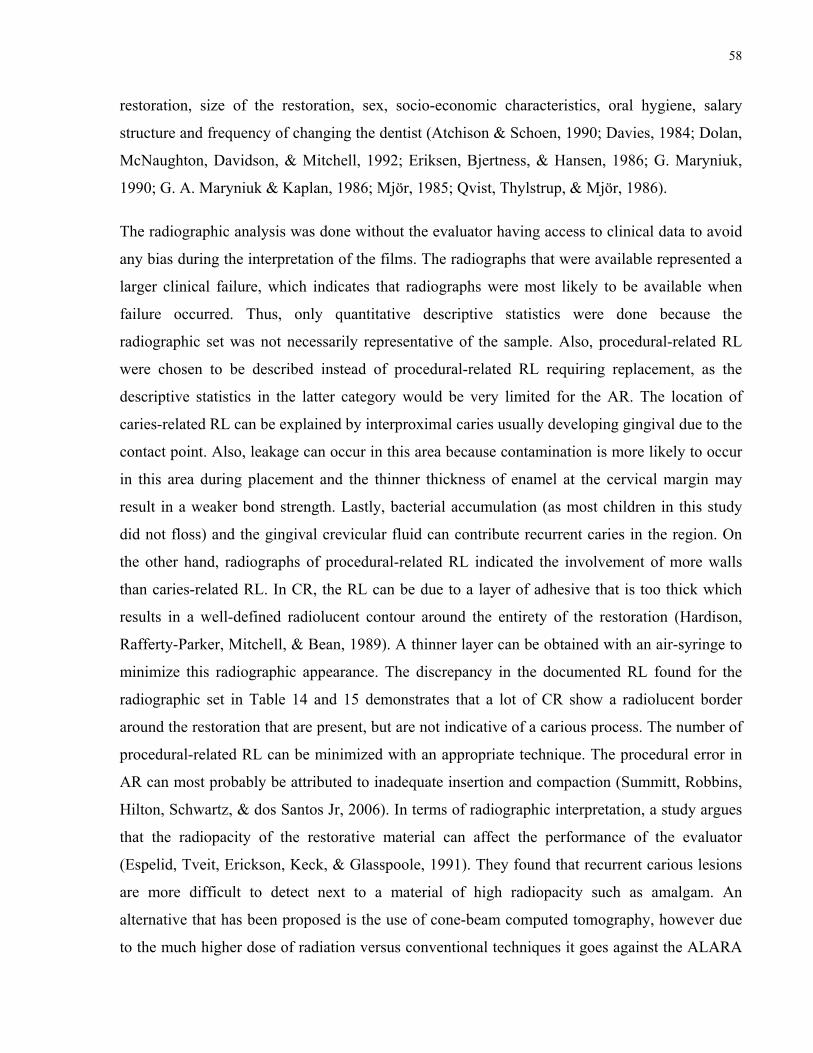
Figure 12. Right maxillary canine AR at 586 day follow-up with caries-related radiolucency involving the cavosurface margin and gingival wall
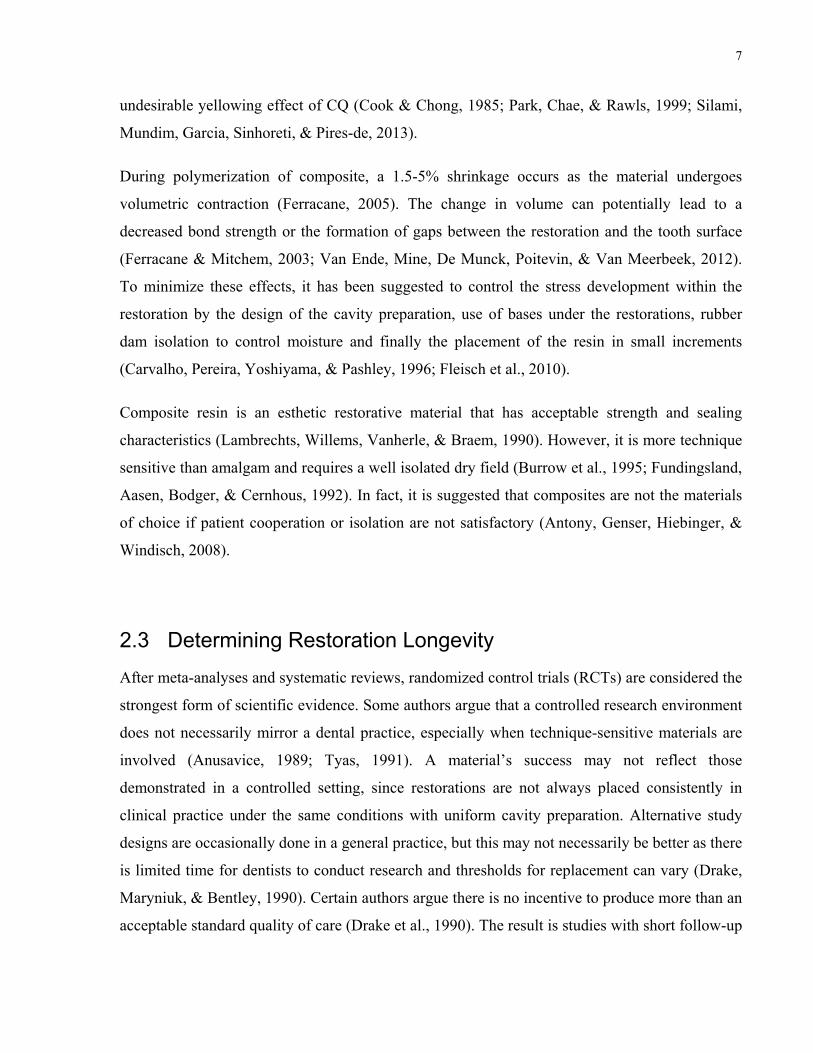
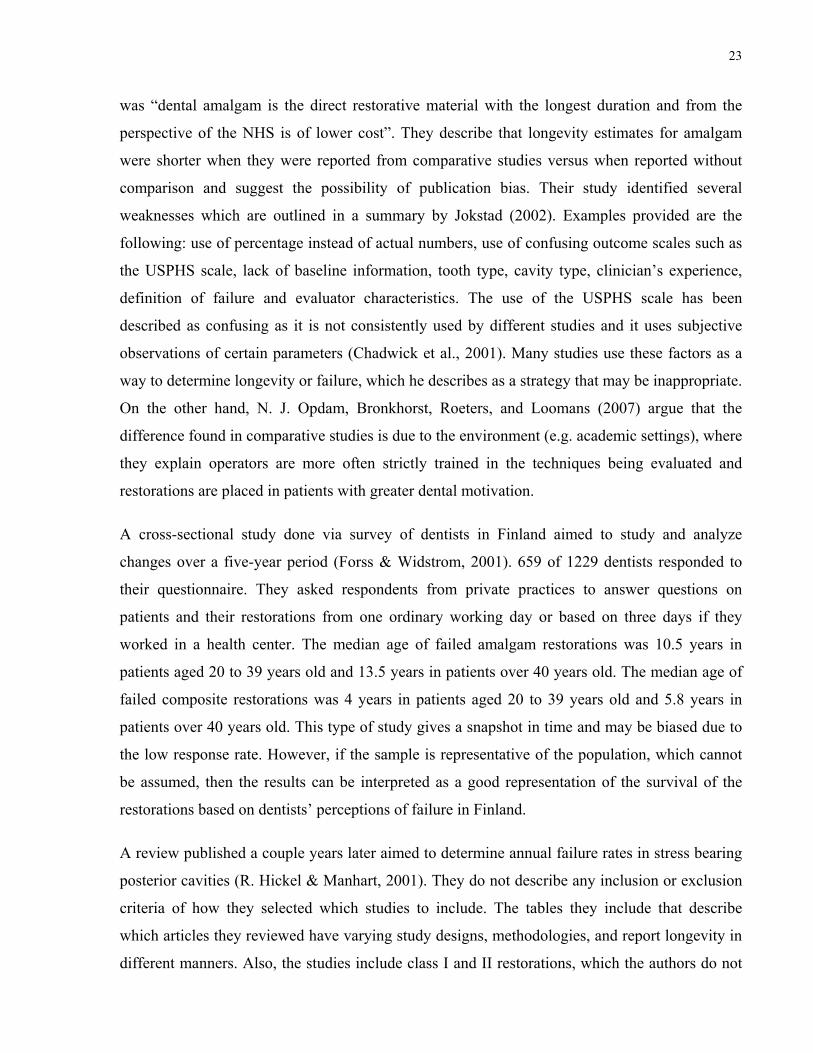
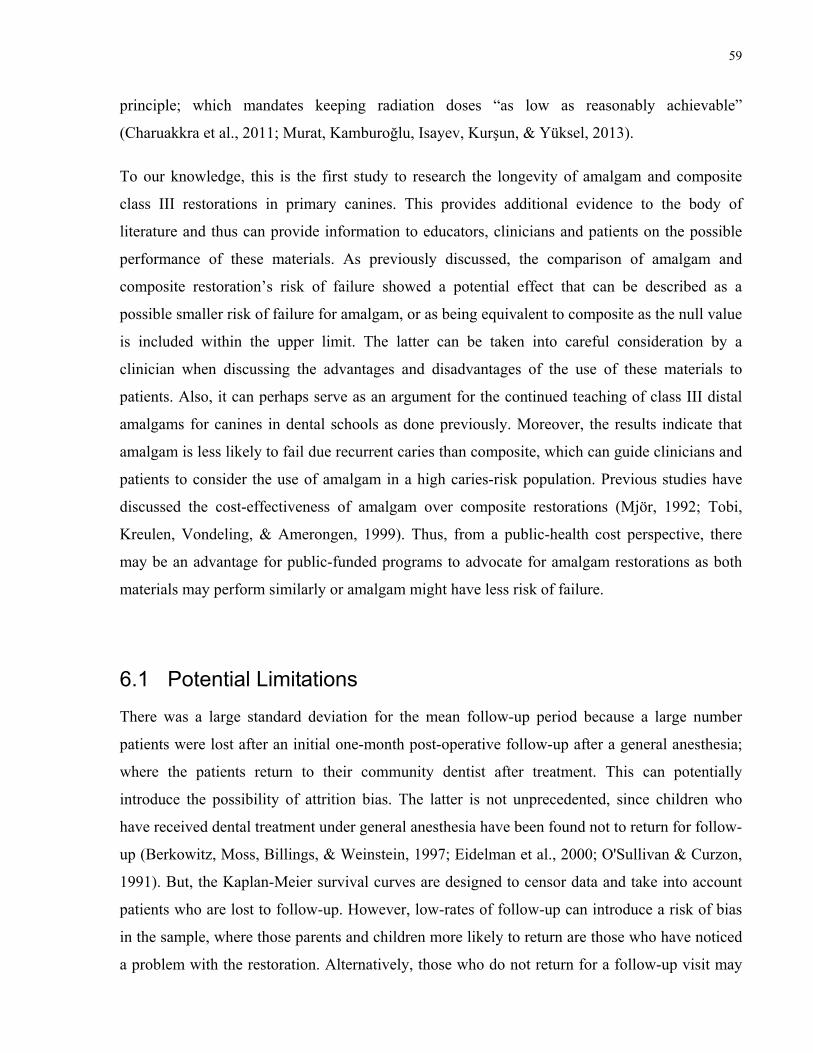
Figure 13. Left mandibular canine CR at 322 day follow-up with caries-related RL involving cavosurface margin, gingival and axial wall
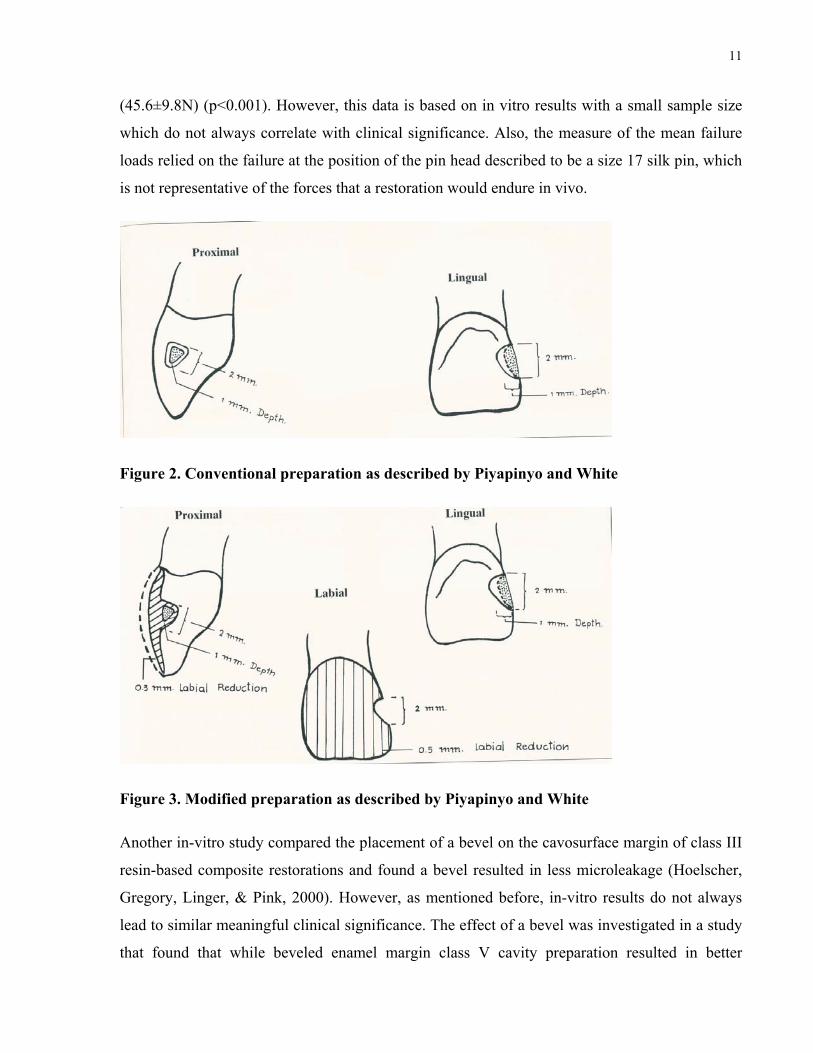
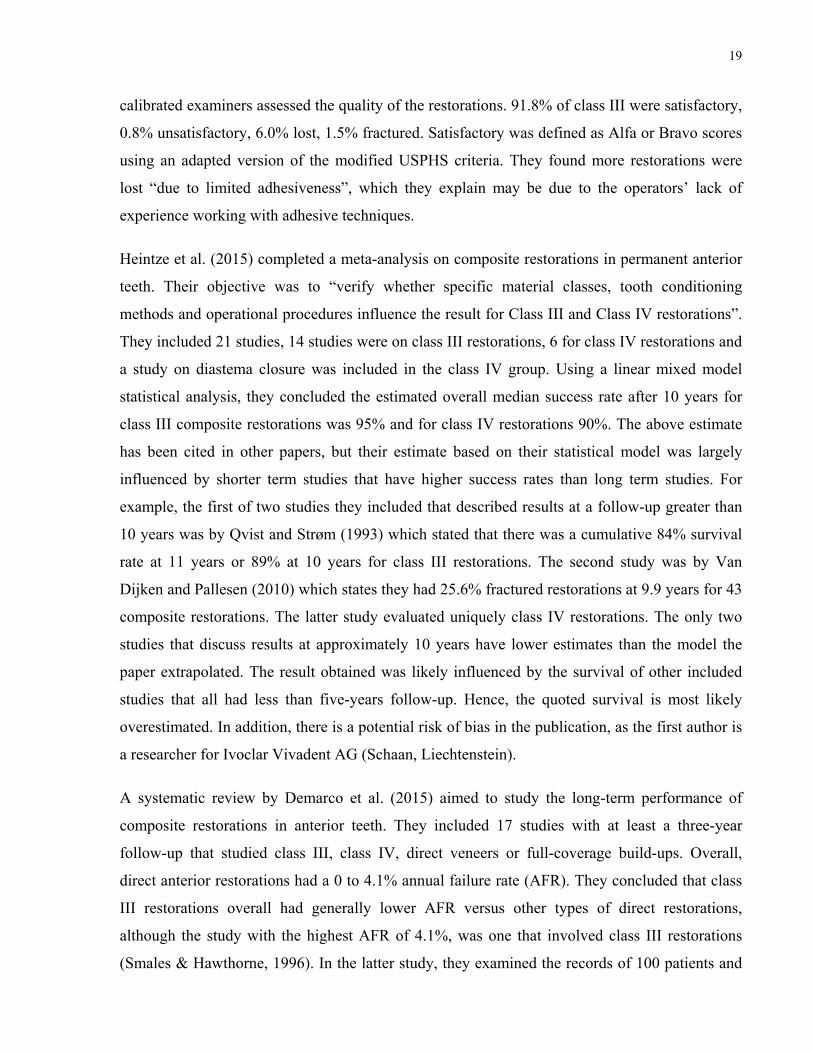
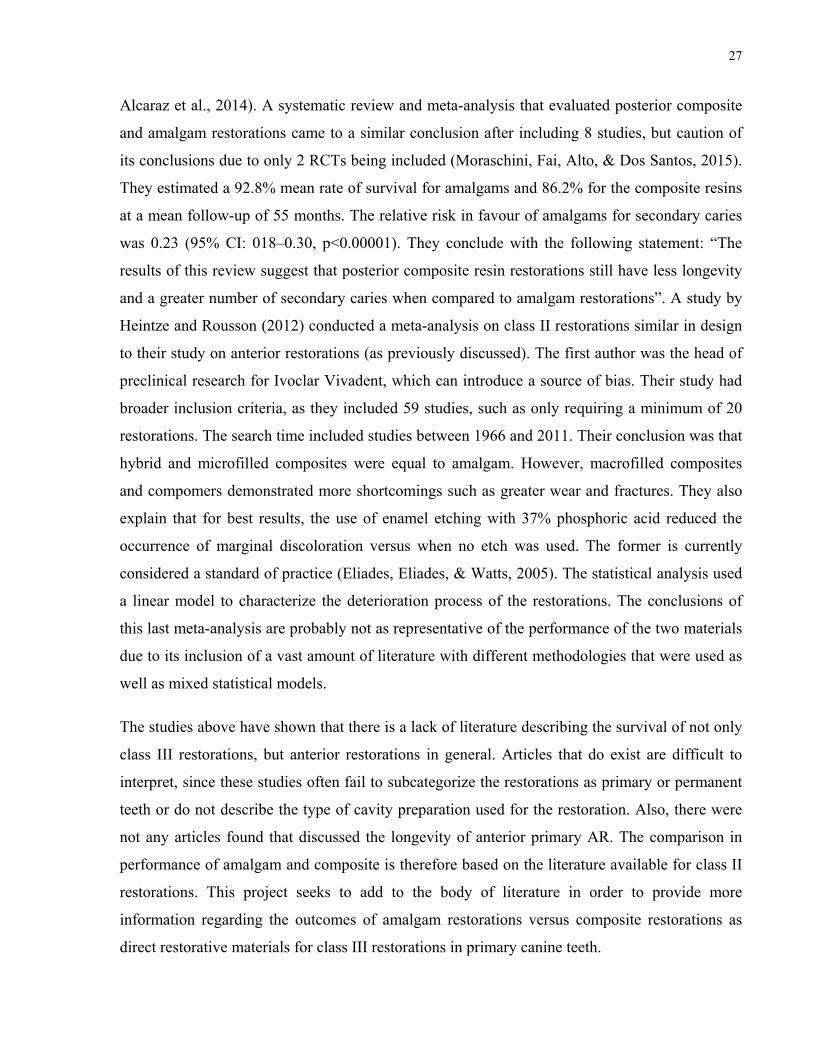
Figure 14. Left mandibular canine AR at 1289 day follow-up with procedural-related RL requiring replacement involving cavosurface margin and gingival wall
Figure 15. Left mandibular canine CR at 1274 day follow-up with procedural-related RL involving cavosurface margin
54
6 Discussion
Comparison to other results is difficult as there is very little literature on the subject. Study
designs are different, materials continuously change and evaluation criteria of the materials is not
constant from one study to another. Also, amongst the studies available in the literature, failure
rates are reported either as mean annual failure rate, annual failure rate, median survival time, or
other metrics which makes direct comparisons difficult. Median survival time may be preferable
as it is not influenced by short follow-up or changes in survival rate.
This current study found a median survival time of amalgam and composite was approximately
4.5 years and 3.8 years respectively. While, they do not categorize by cavity preparation type,
Pedrotti et al. (2017) found the mean survival time of the anterior composites in primary teeth to
be 4.3 years (95% CI: 4.0-4.6). This is similar to our median survival time for composite. Qvist
et al. (2010) published a 75% survival estimate of 3.5 years for class III/V restorations combined
in primary teeth, but the material type in unclear.
In the context of this study design, the HR using the Cox proportional frailty model was 0.77.
The direction of the effect can further be evaluated through the 95% CI limits of 0.54 and 1.09.
The CI suggests a potentially important clinical implication as the direction of the effect may
point to less risk for failure when using amalgam, as a non-statistically significant result does not
automatically mean that there was no effect (McCormack, Vandermeer, & Allan, 2013; Singh,
Kelley, & Agarwal, 2008). A narrower CI, possibly achieved through greater power may have
shown a different statistical result. Future randomized controlled trials may elucidate a more
clear effect when comparing the two materials. Due to the inclusion of the null-value, no
statistical significant difference was found between the survival of AR and CR, which may
contradict the comparative meta-analyses or Cochrane review done in posterior restorations
(Moraschini et al., 2015; Rasines Alcaraz et al., 2014). However, past studies have compared
these two materials describing similar survival (Mair, 1998; N. J. Opdam et al., 2007), or better
The types of materials used was determined from the purchase order history applicable to the
study time period. However, because a certain proportion of the clinical notes did not include the
material used, in the context of this study, these authors could not ascertain as to when each
material was used and could not unquestionably verify the effect a different material might have
had on the survival curves. In addition, establishing survival for a specific material is practical
from a controlled protocol point of view, but not always practical afterwards as materials
constantly change, and by the time studies are published, they may no longer be available.
The definition of failure was defined earlier, but the documentation relied on the provider’s
clinical notes. The challenge is that in a retrospective study, the clinicians are not calibrated, nor
given guidelines. However, given that this is a university-based study, students or residents are
taught techniques that should remain consistent. Also, clinical demonstrators will verify
preparations and insertions. While the university sets standards for its students, the
documentation of a failure either must be mentioned or is only assumed once the restoration is
reported as replaced. This author hopes that there was consistency, but studies have shown that
61
there is variation amongst dentists and even disagreement within the same dentist evaluating the
same entity at different occasions (Elderton & Nuttall, 1983; Kay & Knill-Jones, 1992). Despite
the fact the survival curves do not represent a standardized protocol done in a controlled
environment, they may mimic the expected survivability on average in a multitude of dental
offices considering the number of practitioners involved with the placement and evaluation of
the placed restorations (Allander, Birkhed, & Bratthall, 1990; Mjör, 1997). Furthermore, it has
been argued that clinical studies with a rigorous study protocol is not representative of dentistry
outside of a research setting and does not allow the findings to be generalized to a general
practice (Jokstad et al., 2001).
6.2 Future Directions
This study adds to the paucity of literature on this subject. However, prospective studies with
randomized allocation and standardized treatment and evaluation protocols are recommended.
This would provide more objective and reproducible results. Moreover, standardized evaluation
criteria could be developed as different authors tend to modify the USPHS criteria for their own
use and few use the FDI criteria; which can make comparison difficult. Multicenter studies
would test the performance of materials in different study populations and permit the evaluation
of potential factors affecting survival.
7 Conclusions
In this retrospective chart review, the median survival time of amalgam and composite was
approximately 4.5 years and 3.8 years respectively in this high caries risk population of children.
Radiographic analysis showed caries-related RL were significantly associated for involving the
gingival wall and cavosurface margin for both AR and CR. Post-operative radiographs showed
RL related to procedural technique for AR involved the gingival wall, axial wall and cavosurface
margin. Whereas, for CR, the gingival wall, axial wall, incisal wall and cavosurface margin were
involved.
62
There was no statistically significant difference between the clinical survival of amalgam and
composite. Restorations placed in children between 0-5 years old were significantly more likely
to fail than when placed in a child over 7 years old. Additionally, when placed in a child between
5-7 years old, the restoration was more likely to fail than when placed in a child over 7 years old.
Composite restorations were statistically more likely to fail from recurrent decay than amalgam
restorations.
63
References
Acs, G., Lodolini, G., Kaminsky, S., & Cisneros, G. J. (1992). Effect of nursing caries on body weight in a pediatric population. Pediatric Dentistry, 14(5), 303.
ADA Council on Scientific Affairs. (1998). Dental amalgam: Update on safety concerns. The Journal of the American Dental Association, 129(4), 494-503.
Ajami, B.-A.-M., Ebrahimi, M., Makarem, A., Movahhed, T., & Motamedi, A. R. (2012). Evaluation of Survival Time of Tooth Color Dental Materials in Primary Anterior Teeth. Journal of Dental Materials and Techniques, 1(1), 11-18.
Allander, L., Birkhed, D., & Bratthall, D. (1990). Reasons for replacement of Class II amalgam restorations in private practice. Swedish Dental Journal, 14(4), 179-184.
American Academy of Pediatric Dentistry. (2017). Clinical guideline on pediatric restorative dentistry. Pediatric Dentistry, 39(6 Suppl), 312-324.
Antony, K., Genser, D., Hiebinger, C., & Windisch, F. (2008). Longevity of dental amalgam in comparison to composite materials. GMS Health Technol Assess, 4, Doc12.
Anusavice, K. (1989). Criteria for selection of restorative materials: properties vs technique sensitivity. Quality evaluations of dental restorations, 15-56.
Asl Aminabadi, N., Najafpour, E., Erfanparast, L., Samiei, M., Haghifar, M., Sighari Deljavan, A., . . . Shokravi, M. (2014). Class III Restoration of Anterior Primary Teeth: In Vitro Retention Comparison of Conventional, Modified and Air-abrasion Treated Preparations. Journal of dental research, dental clinics, dental prospects, 8(2), 89-94. doi:10.5681/joddd.2014.016
Atchison, K. A., & Schoen, M. H. (1990). A Comparison of Quality in a Dual-choice Dental Plan: Capitation versus Fee-for-service. Journal of Public Health Dentistry, 50(3), 186-193.
Atkins Jr, C., Rubenstein, L., & Avent, M. (1986). Preliminary clinical evaluation of dentinal and enamel bonding in primary anterior teeth. The Journal of pedodontics, 10(3), 239-246.
Bailit, H. L., Chiriboga, D., Grasso, J., Damuth, L., & Willemain, T. R. (1979). A new intermediate dental outcome measure: amalgam replacement rate. Medical Care, 780-786.
Baldissera, R. A., Correa, M. B., Schuch, H. S., Collares, K., Nascimento, G. G., Jardim, P. S., . . . Demarco, F. F. (2013). Are there universal restorative composites for anterior and posterior teeth? Journal of Dentistry, 41(11), 1027-1035. doi:10.1016/j.jdent.2013.08.016
Baratieri, L. N., Canabarro, S., Lopes, G. C., & Ritter, A. V. (2003). Effect of resin viscosity and enamel beveling on the clinical performance of Class V composite restorations: three-
64
year results. OPERATIVE DENTISTRY-UNIVERSITY OF WASHINGTON-, 28(5), 482-487.
Beazoglou, T., Eklund, S., Heffley, D., Meiers, J., Brown, L. J., & Bailit, H. (2007). Economic impact of regulating the use of amalgam restorations. Public Health Reports, 122(5), 657-663.
Bellinger, D. C., Trachtenberg, F., Barregard, L., Tavares, M., Cernichiari, E., Daniel, D., & McKinlay, S. (2006). Neuropsychological and renal effects of dental amalgam in children: a randomized clinical trial. JAMA, 295(15), 1775-1783. doi:10.1001/jama.295.15.1775
Bellinger, D. C., Trachtenberg, F., Zhang, A., Tavares, M., Daniel, D., & McKinlay, S. (2008). Dental amalgam and psychosocial status: the New England Children's Amalgam Trial. J Dent Res, 87(5), 470-474. doi:10.1177/154405910808700504
Ben-Amar, A., Cardash, H. S., & Judes, H. (1995). The sealing of the tooth/amalgam interface by corrosion products. Journal of Oral Rehabilitation, 22(2), 101-104.
Bentley, C., & Drake, C. W. (1986). Longevity of restorations in a dental school clinic. Journal of Dental Education, 50(10), 594-600.
Berkowitz, R. J., Moss, M., Billings, R. J., & Weinstein, P. (1997). Clinical outcomes for nursing caries treated using general anesthesia. ASDC Journal of Dentistry for Children, 64(3), 210-211, 228.
Bernardo, M., Luis, H., Martin, M. D., Leroux, B. G., Rue, T., Leitão, J., & DeRouen, T. A. (2007). Survival and reasons for failure of amalgam versus composite posterior restorations placed in a randomized clinical trial. The Journal of the American Dental Association, 138(6), 775-783.
Berthold, M. (2002). Restoratives: trend data shows shift in use of materials. ADA News, 33(1), 10-11.
Beyth, N., Domb, A. J., & Weiss, E. I. (2007). An in vitro quantitative antibacterial analysis of amalgam and composite resins. Journal of Dentistry, 35(3), 201-206.
Bjørklund, G. (1989). The history of dental amalgam. Tidsskrift for den Norske laegeforening: tidsskrift for praktisk medicin, ny raekke, 109(34-36), 3582-3585.
Black, G. (1917). A work on operative dentistry: the technical procedures in filling teeth. Medico-Dental Publishing Company, Chicago.
Black, G. V. (1895). An Investigation of the Physical Characters of the Human Teeth in Relation to their Diseases, and to Practical Dental Operations, together with the Physical Characters of Filling-materials. Dent. Cosmos, 37, 469-484.
Black, G. V. (1896). The physical properties of the silver-tin amalgams. Dent Cosmos, 38, 965-992.
65
Blumenshine, S. L., Vann, W. F., Gizlice, Z., & Lee, J. Y. (2008). Children's school performance: impact of general and oral health. Journal of Public Health Dentistry, 68(2), 82-87.
Bourbia, M., Ma, D., Cvitkovitch, D. G., Santerre, J. P., & Finer, Y. (2013). Cariogenic bacteria degrade dental resin composites and adhesives. J Dent Res, 92(11), 989-994. doi:10.1177/0022034513504436
Bowen, R. (1956). Use of epoxy resins in restorative materials. Journal of Dental Research, 35(3), 360-369.
Bowen, R. (1963). Properties of a silica-reinforced polymer for dental restorations. The Journal of the American Dental Association, 66(1), 57-64.
Bowen, R. (1982). Composite and sealant resins-past, present, and future. Pediatr Dent, 4(1), 10-15.
Brownawell, A. M., Berent, S., Brent, R. L., Bruckner, J. V., Doull, J., Gershwin, E. M., . . . Karol, M. H. (2005). The potential adverse health effects of dental amalgam. Toxicological Reviews, 24(1), 1-10.
Buonocore, M., Wileman, W., & Brudevold, F. (1956). A report on a resin composition capable of bonding to human dentin surfaces. Journal of Dental Research, 35(6), 846-851.
Buonocore, M. G. (1955). A simple method of increasing the adhesion of acrylic filling materials to enamel surfaces. Journal of Dental Research, 34(6), 849-853.
Burke, F., McHugh, S., Hall, A., Randall, R., Widstrom, E., & Forss, H. (2003). Amalgam and composite use in UK general dental practice in 2001. British Dental Journal, 194(11), 613-618.
Burrow, M., Taniguchi, Y., Nikaido, T., Satoh, M., Inai, N., Tagami, J., & Takatsu, T. (1995). Influence of temperature and relative humidity on early bond strengths to dentine. Journal of Dentistry, 23(1), 41-45.
Carvalho, R. M., Pereira, J. C., Yoshiyama, M., & Pashley, D. H. (1996). A review of polymerization contraction: the influence of stress development versus stress relief. Operative Dentistry, 21(1), 17-24.
Chadwick, B., Dummer, P., Dunstan, F., Gilmour, A., Phillips, C., Stevens, J., . . . Treasure, E. (1999). A systematic review of the longevity of dental restorations. York: NHS Centre for Reviews and Dissemination, University of York.
Chadwick, B., Treasure, E., Dummer, P., Dunstan, F., Gilmour, A., Jones, R., . . . Richmond, S. (2001). Challenges with studies investigating longevity of dental restorations—a critique of a systematic review. Journal of Dentistry, 29(3), 155-161.
Charuakkra, A., Prapayasatok, S., Janhom, A., Pongsiriwet, S., Verochana, K., & Mahasantipiya, P. (2011). Diagnostic performance of cone-beam computed tomography on detection of
66
mechanically-created artificial secondary caries. Imaging science in dentistry, 41(4), 143-150.
Choi, S. M., Yoo, S. D., & Lee, B. M. (2004). Toxicological Characteristics of Endocrine-Disrupting Chemicals: Developmental Toxicity, Carcinogenicity, and Mutagenicity. Journal of Toxicology and Environmental Health, Part B, 7(1), 1-23. doi:10.1080/10937400490253229
Chrysanthakopoulos, N. A. (2011). Reasons for placement and replacement of resin-based composite restorations in Greece. Journal of dental research, dental clinics, dental prospects, 5(3), 87.
Clarke, M., Locker, D., Berall, G., Pencharz, P., Kenny, D. J., & Judd, P. (2006). Malnourishment in a population of young children with severe early childhood caries. Pediatric Dentistry, 28(3), 254-259.
Collins, C., Bryant, R., & Hodge, K.-L. (1998). A clinical evaluation of posterior composite resin restorations: 8-year findings. Journal of Dentistry, 26(4), 311-317.
Cook, W. D., & Chong, M. P. (1985). Colour stability and visual perception of dimethacrylate based dental composite resins. Biomaterials, 6(4), 257-264.
Correa, M. B., Peres, M. A., Peres, K. G., Horta, B. L., Barros, A. J., & Demarco, F. F. (2013). Do socioeconomic determinants affect the quality of posterior dental restorations? A multilevel approach. Journal of Dentistry, 41(11), 960-967.
Council on Clinical Affairs AAPD. (2017). Pediatric Restorative Dentistry. [2016]. Pediatric Dentistry, 39(6), 312-324.
Czarnetzki, A., & Ehrhardt, S. (1990). Re-dating the Chinese amalgam-filling of teeth in Europe. International Journal of Anthropology, 325-332.
Davies, J. (1984). The relationship between change of dentist and treatment received in the General Dental Service. British Dental Journal, 157(9), 322-324.
Demarco, F. F., Collares, K., Coelho-de-Souza, F. H., Correa, M. B., Cenci, M. S., Moraes, R. R., & Opdam, N. J. (2015). Anterior composite restorations: A systematic review on long-term survival and reasons for failure. Dental Materials, 31(10), 1214-1224. doi:10.1016/j.dental.2015.07.005
Demarco, F. F., Correa, M. B., Cenci, M. S., Moraes, R. R., & Opdam, N. J. (2012). Longevity of posterior composite restorations: not only a matter of materials. Dental Materials, 28(1), 87-101. doi:10.1016/j.dental.2011.09.003
Demirci, M., Ersev, H., Sancakli, H. S., & Topcubasi, M. (2006). Clinical evaluation of a polyacid-modified resin composite (Dyract) in Class III cavities: 5-year results. American Journal of Dentistry, 19(5), 293-296.
67
Demirci, M., Ersev, H., & Ucok, M. (2002). Clinical evaluation of a polyacid-modified resin composite (Dyract) in class III cavities: three-year results. Operative Dentistry, 27(3), 223-230.
Demirci, M., & Ucok, M. (2001). Clinical evaluation of a polyacid-modified resin composite in Class III cavities: one year results. Operative Dentistry, 26(2), 115-120.
Demirci, M., Yildiz, E., & Uysal, Ö. (2008). Comparative clinical evaluation of different treatment approaches using a microfilled resin composite and a compomer in Class III cavities: two-year results. Operative Dentistry, 33(1), 7-14.
Dennison, J., & Sarrett, D. (2012). Prediction and diagnosis of clinical outcomes affecting restoration margins. Journal of Oral Rehabilitation, 39(4), 301-318.
DeRouen, T. A., Martin, M. D., Leroux, B. G., & et al. (2006). Neurobehavioral effects of dental amalgam in children: A randomized clinical trial. JAMA, 295(15), 1784-1792. doi:10.1001/jama.295.15.1784
Dolan, T. A., McNaughton, C. A., Davidson, S. N., & Mitchell, G. S. (1992). Patient age and general dentists' treatment decisions. Special Care in Dentistry, 12(1), 15-20.
Downer, M. C., Azli, N. A., Bedi, R., Moles, D. R., & Setchell, D. J. (1999). How long do routine dental restorations last? A systematic review. British Dental Journal, 187(8), 432-439.
Drake, C. W., Maryniuk, G. A., & Bentley, C. (1990). Reasons for restoration replacement: differences in practice patterns. Quintessence international, 21(2).
Edelstein, B., Vargas, C. M., Candelaria, D., & Vemuri, M. (2006). Experience and policy implications of children presenting with dental emergencies to US pediatric dentistry training programs. Pediatric Dentistry, 28(5), 431-437.
Eidelman, E., Faibis, S., & Peretz, B. (2000). A comparison of restorations for children with early childhood caries treated under general anesthesia or conscious sedation. Pediatric Dentistry, 22(1), 33-37.
Elderton, R., & Nuttall, N. (1983). Variation among dentists in planning treatment. British Dental Journal, 154(7), 201-206.
Eliades, G., Eliades, T., & Watts, D. C. (2005). Dental hard tissues and bonding: Springer.
Eriksen, H. M., Bjertness, E., & Hansen, B. F. (1986). Cross-sectional clinical study of quality of amalgam restorations, oral health and prevalence of recurrent caries. Community Dentistry and Oral Epidemiology, 14(1), 15-18.
Ermis, R. B., Temel, U. B., Cellik, E. U., & Kam, O. (2010). Clinical performance of a two-step self-etch adhesive with additional enamel etching in Class III cavities. Operative Dentistry, 35(2), 147-155. doi:10.2341/09-089-c
68
Espelid, I., Tveit, A., Erickson, R., Keck, S., & Glasspoole, E. (1991). Radiopacity of restorations and detection of secondary caries. Dental materials, 7(2), 114-117.
Evens, C. C., Martin, M. D., Woods, J. S., Soares, H. L., Bernardo, M., Leitäo, J., . . . Derouen, T. (2001). Examination of dietary methylmercury exposure in the Casa Pia Study of the health effects of dental amalgams in children. Journal of Toxicology and Environmental Health Part A, 64(7), 521-530.
Ferracane, J. L. (2005). Developing a more complete understanding of stresses produced in dental composites during polymerization. Dental Materials, 21(1), 36-42. doi:10.1016/j.dental.2004.10.004
Ferracane, J. L., & Mitchem, J. C. (2003). Relationship between composite contraction stress and leakage in Class V cavities. American Journal of Dentistry, 16(4), 239-243.
Fleisch, A. F., Sheffield, P. E., Chinn, C., Edelstein, B. L., & Landrigan, P. J. (2010). Bisphenol A and Related Compounds in Dental Materials. Pediatrics, 126(4), 760-768. doi:10.1542/peds.2009-2693
Forss, H., & Widstrom, E. (2001). From amalgam to composite: selection of restorative materials and restoration longevity in Finland. Acta Odontologica Scandinavica, 59(2), 57-62.
Fundingsland, J., Aasen, S., Bodger, P., & Cernhous, J. (1992). The effect of high humidity on adhesion to dentine. J Dent Res, 72, 665.
Fung, E. Y., Ewoldsen, N. O., St Germain, H. A., Jr., Marx, D. B., Miaw, C. L., Siew, C., . . . Meyer, D. M. (2000). Pharmacokinetics of bisphenol A released from a dental sealant. J Am Dent Assoc, 131(1), 51-58.
Gabrio, T., Benedikt, G., Broser, S., Felder-Kennel, A., Fichtner, G., Horras-Hun, G., . . . Link, B. (2003). 10 years of observation by public health offices in Baden-Württemberg--assessment of human biomonitoring for mercury due to dental amalgam fillings and other sources. Gesundheitswesen (Bundesverband der Arzte des Offentlichen Gesundheitsdienstes (Germany)), 65(5), 327-335.
Gordan, V. V., Riley, J. L., Geraldeli, S., Rindal, D. B., Qvist, V., Fellows, J. L., . . . Group, D. P.-B. R. N. C. (2012). Repair or replacement of defective restorations by dentists in The Dental Practice-Based Research Network. The Journal of the American Dental Association, 143(6), 593-601.
Guthrom, C., Johnson, L., & Lawless, K. (1983). Corrosion of dental amalgam and its phases. J Dent Res, 62, 1372-1381.
Hanson, M., & Pleva, J. (1991). The dental amalgam issue. A review. Experientia, 47(1), 9-22.
Hardison, J. D., Rafferty-Parker, D., Mitchell, R. J., & Bean, L. R. (1989). Radiolucent halos associated with radiopaque composite resin restorations. The Journal of the American Dental Association, 118(5), 595-597.
69
Hawthorne, W., & Smales, R. (1997). Factors influencing long-term restoration survival in three private dental practices in Adelaide. Australian Dental Journal, 42(1), 59-63.
Heinrich, A., Bernhardt, O., Splieth, C., & Meyer, G. (2017). Anaerobic microflora under class I and class II composite and amalgam fillings. Issues, 2016, 2015.
Heintze, S. D., & Rousson, V. (2012). Clinical effectiveness of direct class II restorations - a meta-analysis. Journal of Adhesive Dentistry, 14(5), 407-431. doi:10.3290/j.jad.a28390
Heintze, S. D., Rousson, V., & Hickel, R. (2015). Clinical effectiveness of direct anterior restorations--a meta-analysis. Dental Materials, 31(5), 481-495. doi:10.1016/j.dental.2015.01.015
Heymann, H. O., Swift Jr, E. J., & Ritter, A. V. (2014). Sturdevant's art & science of operative dentistry (Sixth ed.): Elsevier Health Sciences.
Hickel, R., & Manhart, J. (2001). Longevity of restorations in posterior teeth and reasons for failure. Journal of Adhesive Dentistry, 3(1), 45-64.
Hickel, R., Roulet, J.-F., Bayne, S., Heintze, S. D., Mjör, I. A., Peters, M., . . . Tyas, M. (2007). Recommendations for conducting controlled clinical studies of dental restorative materials. Clinical Oral Investigations, 11(1), 5-33.
Hoelscher, D., Gregory, W., Linger, J., & Pink, F. (2000). Effect of light source position and bevel placement on facial margin adaptation of resin-based composite restorations. American Journal of Dentistry, 13(4), 171-175.
Hunter, B. (1985). Survival of dental restorations in young patients. Community Dentistry and Oral Epidemiology, 13(5), 285-287.
Jokstad, A. (2002). How long do fillings last? Evidence Based Dentistry, 3, 96. doi:10.1038/sj.ebd.6400146
Jokstad, A., Bayne, S., Blunck, U., Tyas, M., & Wilson, N. (2001). Quality of dental restorations. FDI Commission Project 2-95. International Dental Journal, 51(3), 117-158.
Jokstad, A., Mjor, I. A., Nilner, K., & Kaping, S. (1994). Clinical performance of three anterior restorative materials over 10 years. Quintessence International, 25(2), 101-108.
Kay, E. J., & Knill-Jones, R. (1992). Variation in restorative treatment decisions: application of Receiver Operating Characteristic curve (ROC) analysis. Community Dentistry and Oral Epidemiology, 20(3), 113-117. doi:10.1111/j.1600-0528.1992.tb01542.x
Knibbs, P. J., & Plant, C. G. (1990). An evaluation of a rapid setting glass ionomer cement used by general dental practitioners to restore deciduous teeth. Journal of Oral Rehabilitation, 17(1), 1-7.
70
Kopperud, S. E., Tveit, A. B., Gaarden, T., Sandvik, L., & Espelid, I. (2012). Longevity of posterior dental restorations and reasons for failure. European Journal of Oral Sciences, 120(6), 539-548.
Kubo, S., Kawasaki, A., & Hayashi, Y. (2011). Factors associated with the longevity of resin composite restorations. Dental Materials Journal, 30(3), 374-383.
Lambrechts, P., Willems, G., Vanherle, G., & Braem, M. (1990). Aesthetic limits of light-cured composite resins in anterior teeth. International dental journal, 40(3), 149-158.
Landis, J. R., & Koch, G. G. (1977). The measurement of observer agreement for categorical data. Biometrics, 159-174.
Lee, J. K. (2002). Restoration of primary anterior teeth: review of the literature. Pediatric Dentistry, 24(5), 506-510.
Li, Y., Carrera, C., Chen, R., Li, J., Lenton, P., Rudney, J. D., . . . Fok, A. (2014). Degradation in the dentin-composite interface subjected to multi-species biofilm challenges. Acta Biomater, 10(1), 375-383. doi:10.1016/j.actbio.2013.08.034
Loguercio, A. D., Lorini, E., Weiss, R. V., Tori, A. P., Picinatto, C. C., Ribeiro, N. R., & Reis, A. (2007). A 12-month clinical evaluation of composite resins in class III restorations. Journal of Adhesive Dentistry, 9(1), 57-64.
Lynch, C. D., Frazier, K. B., McConnell, R. J., Blum, I. R., & Wilson, N. H. (2011). Minimally invasive management of dental caries: contemporary teaching of posterior resin-based composite placement in US and Canadian dental schools. The Journal of the American Dental Association, 142(6), 612-620.
Lynch, C. D., McConnell, R. J., & Wilson, N. H. (2007). Trends in the placement of posterior composites in dental schools. Journal of Dental Education, 71(3), 430-434.
Mackert, J., & Wahl, M. J. (2004). Are there acceptable alternatives to amalgam. Journal of the California Dental.
Mair, L. H. (1998). Ten-year clinical assessment of three posterior resin composites and two amalgams. Quintessence international, 29(8).
Mannocci, F., Qualtrough, A., Worthington, H., Watson, T., & Pitt Ford, T. (2005). Randomized clinical comparison of endodontically treated teeth restored with amalgam or with fiber posts and resin composite: five-year results. Operative Dentistry, 30(1), 9-15.
Maryniuk, G. (1990). Practice variation: learned and socio-economic factors. Advances in Dental Research, 4(1), 19-24.
Maryniuk, G. A., & Kaplan, S. H. (1986). Longevity of restorations: survey results of dentists’ estimates and attitudes. The Journal of the American Dental Association, 112(1), 39-45.
71
Maserejian, N. N., Trachtenberg, F. L., Wheaton, O. B., Calafat, A. M., Ranganathan, G., Kim, H. Y., & Hauser, R. (2016). Changes in urinary bisphenol A concentrations associated with placement of dental composite restorations in children and adolescents. J Am Dent Assoc, 147(8), 620-630. doi:10.1016/j.adaj.2016.02.020
Maupomé, G., Yepes, J. F., Galloway, M., Tang, Q., Eckert, G. J., Downey, T., & Vinson, L. Survival analysis of metal crowns versus restorations in primary mandibular molars. The Journal of the American Dental Association, 148(10), 760-766. doi:10.1016/j.adaj.2017.06.009
McCormack, J., Vandermeer, B., & Allan, G. M. (2013). How confidence intervals become confusion intervals. BMC Medical Research Methodology, 13(1), 134.
McCracken, M. S., Gordan, V. V., Litaker, M. S., Funkhouser, E., Fellows, J. L., Shamp, D. G., . . . Gilbert, G. H. (2013). A 24-month evaluation of amalgam and resin-based composite restorations: Findings from The National Dental Practice-Based Research Network. J Am Dent Assoc, 144(6), 583-593.
Millar, B., Robinson, P., & Inglis, A. (1997). Clinical evaluation of an anterior hybrid composite resin over 8 years. British Dental Journal, 182(1), 26-30.
Mjör, I. A. (1985). Frequency of secondary caries at various anatomical locations. Operative Dentistry, 10, 88-92.
Mjör, I. A. (1989). Amalgam and composite resin restorations: longevity and reasons for replacement. Quality evaluation of dental restorations—criteria for placement and replacement. Chicago: Quintessence Publishing Co, 61-68.
Mjör, I. A. (1992). Problems and benefits associated with restorative materials: side-effects and long-term cost. Advances in Dental Research, 6(1), 7-16.
Mjör, I. A. (1997). The reasons for replacement and the age of failed restorations in general dental practice. Acta Odontologica Scandinavica, 55(1), 58-63.
Mjör, I. A., & Toffentti, F. (2000). Secondary caries: A literature review with case reports. Quintessence international, 31(3).
Moraschini, V., Fai, C. K., Alto, R. M., & Dos Santos, G. O. (2015). Amalgam and resin composite longevity of posterior restorations: A systematic review and meta-analysis. Journal of Dentistry, 43(9), 1043-1050. doi:10.1016/j.jdent.2015.06.005
Moura, F. R., Romano, A. R., Lund, R. G., Piva, E., Rodrigues Junior, S. A., & Demarco, F. F. (2011). Three-year clinical performance of composite restorations placed by undergraduate dental students. Brazilian Dental Journal, 22(2), 111-116.
Murat, S., Kamburoğlu, K., Isayev, A., Kurşun, S., & Yüksel, S. (2013). Visibility of artificial buccal recurrent caries under restorations using different radiographic techniques. Operative Dentistry, 38(2), 197-207.
72
Nedeljkovic, I., Teughels, W., De Munck, J., Van Meerbeek, B., & Van Landuyt, K. L. (2015). Is secondary caries with composites a material-based problem? Dental Materials, 31(11), e247-277. doi:10.1016/j.dental.2015.09.001
Nikaido, T., Takada, T., Kitasako, Y., Ogata, M., Shimada, Y., Yoshikawa, T., . . . Burrow, M. F. (2006). Retrospective study of five-year clinical performance of direct composite restorations using a self-etching primer adhesive system. Dental Materials Journal, 25(3), 611-615.
O'Sullivan, E., & Curzon, M. (1991). The efficacy of comprehensive dental care for children under general anesthesia. British Dental Journal, 171(2), 56-58.
Oliva, R., & Lowe, J. (1987). Dimensional stability of silver amalgam and composite used as core materials. The Journal of prosthetic dentistry, 57(5), 554-559.
Opdam, N., Bronkhorst, E., Loomans, B., & Huysmans, M.-C. (2010). 12-year survival of composite vs. amalgam restorations. Journal of Dental Research, 89(10), 1063-1067.
Opdam, N. J., Bronkhorst, E. M., Loomans, B. A., & Huysmans, M. C. (2012). Longevity of repaired restorations: a practice based study. Journal of Dentistry, 40(10), 829-835. doi:10.1016/j.jdent.2012.06.007
Opdam, N. J., Bronkhorst, E. M., Roeters, J. M., & Loomans, B. A. (2007). A retrospective clinical study on longevity of posterior composite and amalgam restorations. Dental materials, 23(1), 2-8.
Paffenbarger, G. C., Nelsen, R. J., & Sweeney, W. (1953). Direct and indirect filling resins: a review of some physical and chemical properties. The Journal of the American Dental Association, 47(5), 516-524.
Pair, R. L., Udin, R. D., & Tanbonliong, T. (2004). Materials used to restore class II lesions in primary molars: a survey of California pediatric dentists. Pediatr Dent, 26(6), 501-507.
Pallesen, U., van Dijken, J. W. V., Halken, J., Hallonsten, A.-L., & Höigaard, R. (2014). A prospective 8-year follow-up of posterior resin composite restorations in permanent teeth of children and adolescents in Public Dental Health Service: reasons for replacement. Clinical Oral Investigations, 18(3), 819-827. doi:10.1007/s00784-013-1052-x
Palotie, U., & Vehkalahti, M. M. (2012). Reasons for replacement of restorations: dentists' perceptions. Acta Odontologica Scandinavica, 70(6), 485-490.
Papathanasiou, A. G., Curzon, M. E., & Fairpo, C. G. (1994). The influence of restorative material on the survival rate of restorations in primary molars. Pediatr Dent, 16(4), 282-288.
Park, Y.-J., Chae, K.-H., & Rawls, H. (1999). Development of a new photoinitiation system for dental light-cure composite resins. Dental materials, 15(2), 120-127.
73
Pedrotti, D., Ribeiro, J. F., Weber Pires, C., de Oliveira Rocha, R., Ardenghi, T. M., Soares, F. Z. M., & Lenzi, T. L. (2017). Survival and Associated Risk Factors of Resin-based Composite Restorations in Primary Teeth: A Clinical, Retrospective, University-based Study. Pediatric Dentistry, 39(4), 313-318.
Piyapinyo, S., & White, G. (1998). Class III cavity preparation in primary anterior teeth: in vitro retention comparison of conventional and modified forms. J Clin Pediatr Dent, 22(2), 107-112.
Priyank, H., Verma, A., Gupta, K., Chaudhary, E., Khandelwal, D., & Nihalani, S. (2016). In vitro Comparative Evaluation of Various Restorative Materials used for restoring Class III Cavities in Deciduous Anterior Teeth: A Clinical Study. Journal of Contemporary Dental Practice, 17(12), 1022-1026.
Qvist, V., Laurberg, L., Poulsen, A., & Teglers, P. T. (1997). Longevity and cariostatic effects of everyday conventional glass-ionomer and amalgam restorations in primary teeth: three-year results. Journal of Dental Research, 76(7), 1387-1396.
Qvist, V., Laurberg, L., Poulsen, A., & Teglers, P. T. (2004a). Class II restorations in primary teeth: 7-year study on three resin-modified glass ionomer cements and a compomer. European Journal of Oral Sciences, 112(2), 188-196. doi:10.1111/j.1600-0722.2004.00117.x
Qvist, V., Laurberg, L., Poulsen, A., & Teglers, P. T. (2004b). Eight-year study on conventional glass ionomer and amalgam restorations in primary teeth. Acta Odontologica Scandinavica, 62(1), 37-45.
Qvist, V., Manscher, E., & Teglers, P. T. (2004). Resin-modified and conventional glass ionomer restorations in primary teeth: 8-year results. Journal of Dentistry, 32(4), 285-294. doi:10.1016/j.jdent.2004.01.001
Qvist, V., Poulsen, A., Teglers, P. T., & Mjor, I. A. (2010). The longevity of different restorations in primary teeth. Int J Paediatr Dent, 20(1), 1-7. doi:10.1111/j.1365-263X.2009.01017.x
Qvist, V., & Strøm, C. (1993). 11-Year assessment of class-Ill resin restorations completed with two restorative procedures. Acta Odontologica Scandinavica, 51(4), 253-262. doi:10.3109/00016359309040575
Qvist, V., Thylstrup, A., & Mjör, I. A. (1986). Restorative treatment pattern and longevity of amalgam restorations in Denmark. Acta Odontologica Scandinavica, 44(6), 343-349.
Rasines Alcaraz, M. G., Veitz-Keenan, A., Sahrmann, P., Schmidlin, P. R., Davis, D., & Iheozor-Ejiofor, Z. (2014). Direct composite resin fillings versus amalgam fillings for permanent or adult posterior teeth. Cochrane Database of Systematic Reviews(3). doi:10.1002/14651858.CD005620.pub2
Raskin, A., Michotte-Theall, B., Vreven, J., & Wilson, N. H. (1999). Clinical evaluation of a posterior composite 10-year report. Journal of Dentistry, 27(1), 13-19.
74
Rathnam, A., Nidhi, M., Shigli, A. L., & Indushekar, K. (2010). Comparative evaluation of slot versus dovetail design in class III composite restorations in primary anterior teeth. Contemporary clinical dentistry, 1(1), 6.
Rueggeberg, F. A., Dlugokinski, M., & Ergle, J. W. (1999). Minimizing patients' exposure to uncured components in a dental sealant. J Am Dent Assoc, 130(12), 1751-1757.
Ryge, G., & Snyder, M. (1973). Evaluating the clinical quality of restorations. J Am Dent Assoc, 87(2), 369-377.
Sachdeo, A., Gray, G., Sulieman, M., & Jagger, D. (2004). Comparison of wear and clinical performance between amalgam, composite and open sandwich restorations: 2-year results. The European journal of prosthodontics and restorative dentistry, 12(1), 15-20.
Saxe, S. R., Wekstein, M. W., Kryscio, R. J., Henry, R. G., Cornett, C. R., Snowdon, D. A., . . . Markesbery, W. R. (1999). Alzheimer’s disease, dental amalgam and mercury. The Journal of the American Dental Association, 130(2), 191-199. doi:10.14219/jada.archive.1999.0168
Shah, P. V., Lee, J. Y., & Wright, J. T. (2004). Clinical success and parental satisfaction with anterior preveneered primary stainless steel crowns. Pediatr Dent, 26(5), 391-395.
Silami, F. D. J., Mundim, F. M., Garcia, L. d. F. R., Sinhoreti, M. A. C., & Pires-de, F. d. C. P. (2013). Color stability of experimental composites containing different photoinitiators. Journal of Dentistry, 41, e62-e66.
Singh, A. K., Kelley, K., & Agarwal, R. (2008). Interpreting results of clinical trials: A conceptual framework. Clinical Journal of the American Society of Nephrology, 3(5), 1246-1252.
Skalerič, U., Ravnik, Č., Cevc, P., & Schara, M. (1982). Mirocrystal Arrangement in Human Deciduous Dental Enamel Studied by Electron Paramagnetic Resonance. Caries Research, 16(1), 47-50.
Smales, R. J. (1992). Effect of rubber dam isolation on restoration deterioration. American Journal of Dentistry, 5(5), 277-279.
Smales, R. J. (1993). Rubber dam usage related to restoration quality and survival. British Dental Journal, 174(9), 330-333.
Smales, R. J., & Hawthorne, W. S. (1996). Long-term survival and cost-effectiveness of five dental restorative materials used in various classes of cavity preparations. International dental journal, 46(3), 126-130.
Soncini, J. A., Maserejian, N. N., Trachtenberg, F., Tavares, M., & Hayes, C. (2007). The longevity of amalgam versus compomer/composite restorations in posterior primary and permanent teeth: findings From the New England Children's Amalgam Trial. The Journal of the American Dental Association, 138(6), 763-772.
75
Summitt, J. B., Robbins, J. W., Hilton, T. J., Schwartz, R. S., & dos Santos Jr, J. (2006). Fundamentals of operative dentistry: a contemporary approach: Quintessence Pub.
Sunnegårdh-Grönberg, K., van Dijken, J. W., Funegård, U., Lindberg, A., & Nilsson, M. (2009). Selection of dental materials and longevity of replaced restorations in Public Dental Health clinics in northern Sweden. Journal of Dentistry, 37(9), 673-678.
Svanberg, M., Mjor, I. A., & Orstavik, D. (1990). Mutans streptococci in plaque from margins of amalgam, composite, and glass-ionomer restorations. J Dent Res, 69(3), 861-864. doi:10.1177/00220345900690030601
Tate, A. R., Ng, M. W., Needleman, H., & Acs, G. (2002). Failure rates of restorative procedures following dental rehabilitation under general anesthesia. Pediatric Dentistry, 24(1), 69-69.
Tobi, H., Kreulen, C. M., Vondeling, H., & Amerongen, W. E. (1999). Cost-effectiveness of composite resins and amalgam in the replacement of amalgam Class II restorations. Community Dentistry and Oral Epidemiology, 27(2), 137-143.
Trachtenberg, F., Maserejian, N. N., Tavares, M., Soncini, J. A., & Hayes, C. (2008). Extent of tooth decay in the mouth and increased need for replacement of dental restorations: the New England Children's Amalgam Trial. Pediatric Dentistry, 30(5), 388-392.
Trairatvorakul, C., & Piwat, S. (2005). Comparative clinical evaluation of slot versus dovetail Class III composite restorations in primary anterior teeth. Journal of Clinical Pediatric Dentistry, 28(2), 125-129.
Trepka, M. J., Heinrich, J., Krause, C., Schulz, C., Wjst, M., Popescu, M., & Wichmann, H.-E. (1997). Factors affecting internal mercury burdens among eastern German children. Archives of Environmental Health: An International Journal, 52(2), 134-138.
Tyas, M. (1991). Dental materials science—the maintenance of standards. Journal of Oral Rehabilitation, 18(2), 105-110.
U.S. Department of Health and Human Services. (2000). Oral Health in America: A Report of the Surgeon General. Rockville, MD: National Institute of Dental and Craniofacial Research.
Van de Sande, F., Opdam, N., Da Rosa Rodolpho, P., Correa, M., Demarco, F., & Cenci, M. (2013). Patient risk factors’ influence on survival of posterior composites. Journal of Dental Research, 92(7_suppl), S78-S83.
van Dijken, J. W. (1986). A clinical evaluation of anterior conventional, microfiller, and hybrid composite resin fillings. A 6-year follow-up study. Acta Odontologica Scandinavica, 44(6), 357-367.
van Dijken, J. W. (1996). 3-year clinical evaluation of a compomer, a resin-modified glass ionomer and a resin composite in Class III restorations. American Journal of Dentistry, 9(5), 195-198.
76
Van Dijken, J. W. (1999). Longevity of new hybrid restorative materials in class III cavities. European Journal of Oral Sciences, 107(3), 215-219. doi:10.1046/j.0909-8836.1999.eos1070309.x
van Dijken, J. W. (2001). Durability of new restorative materials in Class III cavities. Journal of Adhesive Dentistry, 3(1), 65-70.
van Dijken, J. W., & Horstedt, P. (1987). Effect of the use of rubber dam versus cotton rolls on marginal adaptation of composite resin fillings to acid-etched enamel. Acta Odontologica Scandinavica, 45(5), 303-308.
van Dijken, J. W., Olofsson, A. L., & Holm, C. (1999). Five year evaluation of class III composite resin restorations in cavities pre-treated with an oxalic- or a phosphoric acid conditioner. Journal of Oral Rehabilitation, 26(5), 364-371.
Van Dijken, J. W., & Pallesen, U. (2010). Fracture frequency and longevity of fractured resin composite, polyacid-modified resin composite, and resin-modified glass ionomer cement class IV restorations: an up to 14 years of follow-up. Clinical Oral Investigations, 14(2), 217-222.
Van Ende, A., Mine, A., De Munck, J., Poitevin, A., & Van Meerbeek, B. (2012). Bonding of low-shrinking composites in high C-factor cavities. Journal of Dentistry, 40(4), 295-303. doi:10.1016/j.jdent.2012.01.004
Van Nieuwenhuysen, J.-P., D'Hoore, W., Carvalho, J., & Qvist, V. (2003). Long-term evaluation of extensive restorations in permanent teeth. Journal of Dentistry, 31(6), 395-405.
Van Noort, R. (2013). Introduction to Dental Materials4: Introduction to Dental Materials: Elsevier Health Sciences.
Van Noort, R., & Davis, L. G. (1993). A prospective study of the survival of chemically activated anterior resin composite restorations in general dental practice: 5-year results. Journal of Dentistry, 21(4), 209-215.
Vargas, C. M., Macek, M. D., Goodman, H. S., & Wagner, M. L. (2005). Dental pain in Maryland school children. Journal of Public Health Dentistry, 65(1), 3-6.
Varughese, R. E., Andrews, P., Sigal, M. J., & Azarpazhooh, A. (2016). An Assessment of Direct Restorative Material Use in Posterior Teeth by American and Canadian Pediatric Dentists: I. Material Choice. Pediatric Dentistry, 38(7), 489-496.
Waggoner, W. F. (2015). Restoring primary anterior teeth: updated for 2014. Pediatric Dentistry, 37(2), 163-170.
Wang, Y., Li, C., Yuan, H., Wong, M. C., Zou, J., Shi, Z., & Zhou, X. (2016). Rubber dam isolation for restorative treatment in dental patients. Cochrane Database Syst Rev, 9, Cd009858. doi:10.1002/14651858.CD009858.pub2
77
Wilson, B. (1991). Dental fees: national and regional survey. Dental Management, 31(2), 20-24, 26.
Wilson, M., Cowan, A., Randall, R., Crisp, R., & Wilson, N. (2002). A practice-based, randomized, controlled clinical trial of a new resin composite restorative: one-year results. Operative Dentistry, 27(5), 423-429.
Wilson, P., & Beynon, A. (1989). Mineralization differences between human deciduous and permanent enamel measured by quantitative microradiography. Archives of Oral Biology, 34(2), 85-88.