Page 1
SURVIVAL OF PROBIOTICS IN PEANUT BUTTER, AND THEIR INFLUENCES
ON SELECTED FOODBORNE BACTERIAL PATHOGENS IN SIMULATED
GASTROINTESTINAL FLUIDS
by
YAA ASANTEWAA KAFUI KLU
(Under the Direction of JINRU CHEN)
ABSTRACT
Most children in developing countries die before their 5th birthday from
numerous causes including infectious diarrhea which presents the second highest number
of deaths. In recent years, the administration of probiotics is being used as an adjuvant
therapy with rehydration and nutritional intervention for the management of diarrhea.
Probiotic bacteria need a suitable food matrix as carrier to exert the proposed health
benefits when ingested. This study was undertaken to determine the survivability of four
selected commercial probiotic products in full-fat peanut butter and reduced-fat peanut
butter during a year-long storage study at 4, 25 or 37 °C. Additionally, the ability of the
probiotics in peanut butter to survive simulated gastrointestinal conditions and eventually
inhibit the growth of Salmonella enterica and Listeria monocytogenes was studied. It
was observed that a higher temperature of 37 °C was more detrimental to probiotic
viability and a single probiotic strain had a significantly lower survival rate compared to
multiple probiotic strain mixture. It was also observed that within a multi-strain probiotic
Page 2
product, probiotic survival during storage was strain specific. In general,
Bifidobacterium species used in the study had a better survival rate than Lactobacillus
and Streptococcus/Lactococcus. In a 6 h assay, peanut butter had a significant protective
effect on the viability of probiotic bacteria when they were exposed to simulated
gastrointestinal conditions. Additionally, probiotics in the peanut butter survived
simulated gastrointestinal study and they were able to inhibit the growth of S. enterica
and L. monocytogenes in a 24 h study under simulated gastrointestinal conditions.
Furthermore, the fat content of full-fat peanut butter did not exhibit a significant
protective effect for probiotics during storage or simulated gastrointestinal passage.
Results of the study suggest that peanut butter, either full-fat or reduced-fat is an
appropriate vehicle to carry probiotics to children prone to diarrhea.
INDEX WORDS: Peanut butter, Probiotics, Diarrhea, Malnutrition, RUTF, Pre-
school children, Gastrointestinal passage, L. rhamnosus GG,
Salmonella enterica, Listeria monocytogenes
Page 3
SURVIVAL OF PROBIOTICS IN PEANUT BUTTER, AND THEIR INFLUENCES
ON SELECTED FOODBORNE BACTERIAL PATHOGENS IN SIMULATED
GASTROINTESTINAL FLUIDS
by
YAA ASANTEWAA KAFUI KLU
B.S., Kwame Nkrumah University of Science and Technology, Ghana, 2006
A Dissertation Submitted to the Graduate Faculty of The University of Georgia in Partial
Fulfillment of the Requirements for the Degree
DOCTOR OF PHILOSOPHY
ATHENS, GEORGIA
2014
Page 4
© 2014
YAA ASANTEWAA KAFUI KLU
All Rights Reserved
Page 5
SURVIVAL OF PROBIOTICS IN PEANUT BUTTER, AND THEIR INFLUENCES
ON SELECTED FOODBORNE BACTERIAL PATHOGENS IN SIMULATED
GASTROINTESTINAL FLUIDS
by
YAA ASANTEWAA KAFUI KLU
Major Professor: Jinru Chen
Committee: Yao-Wen Huang
Ruthann B. Swanson
Robert D. Phillips
Electronic Version Approved:
Julie Coffield
Dean of the Graduate School
The University of Georgia
August 2014
Page 6
iv
DEDICATION
Forever, I honor my work to Jesus Christ for favoring me to pursue graduate
studies and for bringing it to a divine fulfillment. This is dedicated to my mother,
Patricia Akosua Klu, an educationist who taught me the importance of education at a
tender age, instilled essential godly principles into my life and constantly prays for me.
This is dedicated to my unborn children as well; my prime energy and drive for this
journey, was the incessant beautiful dream of having you invaluable gifts in the future. I
did not give up because I want you kids to be proud to have me as your mother just as I
am proud of my mother, a rare combination of brains, beauty and virtues.
Page 7
v
ACKNOWLEDGEMENTS
I acknowledge USAID for providing funds for the project. I have not enough
words to express my sincere gratitude to my Major Professor, Dr. Jinru Chen. Dr. Robert
Phillips, together with Dr. Chen were to me, not only professors but mentors as well and I
owe them immense thanks for guiding me in this journey and for doting on me all the
time; I couldn't have asked for better professors. I am also thankful to Dr. Yao-Wen
Huang and Dr. Ruthann B. Swanson for graciously serving on my committee. Sue Ellen
McCullough is such a sweet woman who unceasingly provided me candies whenever I
needed glucose and I acknowledge and appreciate every help offered by her. I am
indebted to Donna Brown for all the administrative assistance she gave me in such a
patient manner. Sincere appreciation also goes to Ed Parker of American Blanching,
Glenn Farrell, Jerry Davies, Sandra Walker, and Larry Hitchcock all of the UGA Griffin
campus for every help offered along the way. I could not have made it without the
prayers, financial support and encouragement from my parents and siblings. To
Emmanuel Klu especially, God bless you being such a giving and sweet brother and
sponsoring all my much needed vacations. To my church family, friends and loved ones
both in the United States and Ghana, your diverse support and prayers are deeply
appreciated. Most importantly, eternity is too short to express my love to God Almighty
for making His plans for my life materialize.
Page 8
vi
TABLE OF CONTENTS
Page
ACKNOWLEDGEMENTS.................................................................................................v
LIST OF TABLES..............................................................................................................xi
LIST OF FIGURES..........................................................................................................xiii
CHAPTER
1 INTRODUCTION.............................................................................................1
2 LITERATURE REVIEW..................................................................................4
3 SURVIVAL OF LACTOBACILLUS RHAMNOSUS GG AS INFLUENCED
BY STORAGE CONDITIONS AND PRODUCT MATRIXES....................47
4 SURVIVAL OF FOUR COMMERCIAL PROBIOTIC MIXTURES IN FULL
FAT AND REDUCED FAT PEANUT BUTTER...........................................69
5 EFFECT OF PEANUT BUTTER MATRICES ON THE FATE OF
PROBIOTICS DURING SIMULATED GASTROINTESTINAL
PASSAGE........................................................................................................99
6 INFLUENCE OF PROBIOTICS IN PEANUT BUTTER ON THE FATE OF
SELECTED SALMONELLA AND LISTERIA STRAINS UNDER
SIMULATEDGASTROINTESTINALCONDITIONS.................................128
7 CONCLUSIONS...........................................................................................161
Page 9
vii
LIST OF TABLES
Page
Table 3.1: Average Lactobacillus rhamnosus GG populations in full fat and reduced fat
peanut butter at each storage temperature..............................................................65
Table 3.2: Average Lactobacillus rhamnosus GG populations as affected by storage
temperature, storage time and product type (full fat or reduced fat peanut
butter).....................................................................................................................66
Table 4.1: Results of statistical analysis - Average probiotic bacteria populations and
hexanal contents in samples inoculated with B, U, N or S as affected by storage
temperature, peanut butter type, and storage time during a 12 month storage
period at 4, 25 and 37 oC........................................................................................93
Table 4.2: Results of statistical analysis - Average probiotic populations of B, U, N and S
as affected by peanut butter type during a 12 month storage period at all three
storage temperatures (4, 25 and 37 °C)..................................................................94
Table 4.3: Results of statistical analysis - Average cell populations of different probiotic
species in each probiotic mixture during a 12 month storage period at all three
storage temperatures (4, 25 and 37°C)...................................................................95
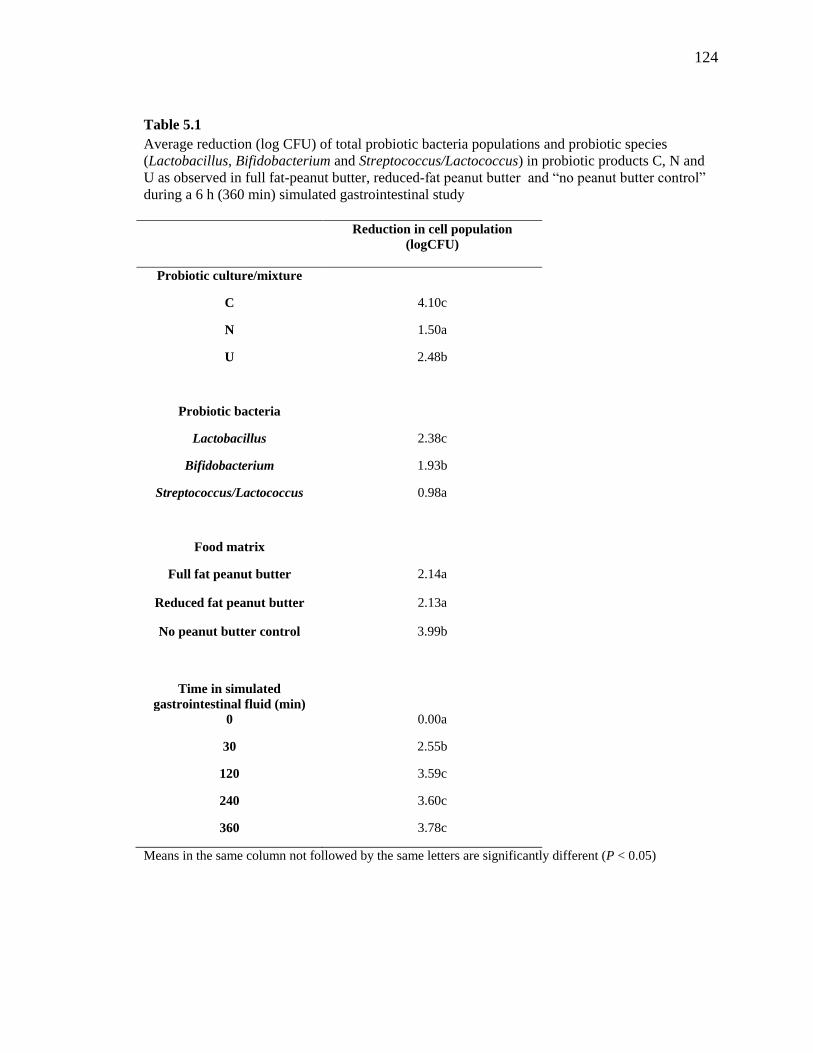
Table 5.1: Average reduction (log CFU) of total probiotic bacteria populations and
probiotics: pecies (Lactobacillus, Bifidobacterium and
Streptococcus/Lactococcus) in probiotic products C, N and U as observed in full-
fat peanut butter, reduced-fat peanut butter and “no peanut butter control” during
Page 10
viii
a 6 h (360 min) simulated gastrointestinal study.................................................124
Table 5.2: Average population reduction (log CFU) of Lactobacillus (Lacto),
Bifidobacterium (Bifi) and Streptococcus/Lactococcus (Strep) in probiotic
mixtures N and U in full-fat (FF) and reduced-fat (RF) peanut butter and “no
peanut butter control” (Control) during a 6 h (360 min) simulated gastrointestinal
study.....................................................................................................................125
Table 6.1: Average cell populations of Salmonella enterica and Listeria monocytogenes
during simulated gastrointestinal passage............................................................152
Table 6.2: Changes in populations of Salmonella during a 24 h simulated gastrointestinal
passage with probiotics........................................................................................153
Table 6.3: Changes in populations of Listeria monocytogenes during a 24 h simulated
gastrointestinal passage with probiotics...............................................................154
Table 6.4: Organic acid constituent of broths after incubation........................................155
Table 6.5: Inhibition of Salmonella by the supernatants of probiotic cell cultures with
natural or neutralized pH and fresh broths with their pH lowered by different
acids.....................................................................................................................156
Table 6.6: Inhibition of Listeria monocytogenes by the supernatants of probiotic cell
cultures with natural or neutralized pH and fresh broths with their pH lowered by
different acids.......................................................................................................157
Table 6.7: Inhibition of Listeria monocytogenes by crude bacteriocin extracts..............158
Page 11
ix
LIST OF FIGURES
Page
Fig. 2.1: Vicious cycle of malnutrition and chronic diarrhea (Adapted from Gorospe and
Oxentenko, 2012)...................................................................................................45
Fig. 2.2: Relationship between gastrointestinal infections and malnutrition (Adapted from
Gorospe and Oxentenko, 2012).............................................................................46
Fig. 3.1: Survival of Lactobacillus rhamnosus GG populations in full fat peanut butter
(FF) and reduced fat peanut butter (RF) stored at 4, 25 and 37 °C for 48 wk.......68
Fig. 4.1: Survival of probiotic bacteria in mixtures B, U, N and S in full fat peanut
butter (FF) or reduced fat peanut butter (RF) at 4 °C (A), 25 °C (B), and 37 °C
(C).............................. ...........................................................................................97
Fig. 4.2: Ratios of probiotic species, Lactobacillus (Lacto) or Bifidobacterium (Bifi) to
total probiotic population in mixture B in in full fat peanut butter (A) and reduced
fat peanut butter (B) and in mixture U in full fat peanut butter (C) and reduced fat
peanut butter (D) during a 12 month storage period at 4, 25 or 37 °C..................98
Fig. 5.1: Reduction of mixed cell populations (log CFU) of probiotic products C (A), N
(B) and U (C) in full-fat peanut butter (FF), reduced-fat peanut butter (RF) and
“no peanut butter control” (C) during a 6 h (360 min) simulated gastrointestinal
study.....................................................................................................................127
Fig. 6.1: Changes in pH and titratable acidity (TA) of samples inoculated with
Salmonella enterica (A) or Listeria monocytogenes (B) during a 24 h simulated
Page 12
x
gastrointestinal passage. Designation “pH con” and “TA con” refer to samples
inoculated with Salmonella or Listeria only. Designation “pH cul” and “TA cul”
are samples co-inoculated with Salmonella or Listeria and cultured probiotics;
and “pH lyo” and “TA lyo” are samples co-inoculated with Salmonella or Listeria
and lyophilized probiotics....................................................................................160
Page 13
1
CHAPTER 1
INTRODUCTION
The issue of childhood mortality is a global public health concern, especially in
the developing world (WHO 2011, 2013) and mortality due to infectious diarrhea is about
760,000 each year, resulting in the second highest number of deaths in pre-school
children (WHO, 2013). A major risk for diarrheal diseases is malnutrition, which
unfortunately is a consequence of diarrhea, and creates a vicious cycle between these two
conditions in children under 5 years of age (Caufield et al., 2004; Gorospe and
Oxentenko, 2012; Manary et al., 2012; WHO, 2013).
For many years, rehydration has been the major therapy for the management of
diarrhea as dehydration is highly linked to the deaths related to diarrhea (WHO, 2005).
In addition to rehydration, other therapies have been used including pharmacological,
micronutrient supplement, dietary, and probiotics (Podewils et al., 2004; WHO, 2005;
UNICEF/WHO, 2009). Improvement of the nutritional status of children affected with
diarrhea is one of the main objectives of the treatment package for diarrhea (WHO, 2005)
and thus, dietary therapy is essential for the appropriate recovery of children. In recent
years, the use of probiotics as an adjuvant therapy in diarrhea management is becoming
popular although there are no standards regarding its administration (Kelly, 2011, Whyte
and Jenkins, 2012). Probiotics are defined as live microorganisms which, when
administered in adequate amounts, confer a health benefit to the host (FAO/WHO, 2001).
There are numerous proposed health benefits of probiotics but of high interest to the
Page 14
2
public health sector with regards to the health of preschool children is their role in
diarrheal management (McFarland, 2009; Butel, 2013). Even though there are no
standards regarding the use of probiotics as a therapy for diarrheal diseases, there is
documentation on their effectiveness in shortening the duration of diarrhea, reducing the
severity of the symptoms and even reducing the incidence of diarrhea in clinical
observations (Isolauri, 2004; Nomoto, 2005; Binns and Lee, 2010).
For probiotics to survive harsh conditions in the gastrointestinal tract, attach to
intestinal walls and colonize them, and exert the proposed health benefits, food matrices
is reported to be one of the most important factors that regulate these functions (Mattila-
Sandholm et al., 2002; Ranadheera et al, 2010). For many years, cultured milk products
have been widely used as carriers for probiotics (Champagne et al., 2011) but in recent
years, other dairy food products and non-dairy products including cheese, chocolates,
vegetable products, soy products and ice-cream are being recommended as probiotic
carriers (Nebesny et al., 2005; Prado et al., 2008; Granato et al., 2010; Rivera-Espinoza
and Gallardo-Navarro, 2010; Karimi et al., 2011). Research has shown that food
matrices with high protein and fat contents, high buffering capacity and high pH are good
carriers of probiotic bacteria; they protect bacteria during storage as well as during transit
in the gut (Boylston et al., 2004; Karimi et al., 2011). Peanut butter is a dense food
matrix with high protein and fat content as well as close to neutral pH (Burnett et al.,
2000) which makes it a suitable vehicle for probiotic delivery. Peanut butter is also a
major ingredient in Ready to Use Therapeutic Foods which are used in the treatment of
severe cases of childhood malnutrition (Manary, 2006). The nutritional and physical
properties of peanut butter presents a likely suitable vehicle for probiotic bacteria and
Page 15
3
thus could be used to address malnutrition and diarrhea concurrently since both
conditions are usually presented together in pre-school children.
The objectives of this study were:
1. To observe the survival of selected single strain or multiple strains of probiotic bacteria
in full fat and reduced fat peanut butter during a 1 year storage study
2. To observe the fate of selected strains of probiotic bacteria in peanut butter during a
simulated gastrointestinal passage
3. To observe the survivability of selected foodborne pathogens in the presence of
probiotics in a simulated gastrointestinal study
Page 16
4
CHAPTER 2
LITERATURE REVIEW
1. Diarrheal diseases in pre-school children
1.1. Their causes and public health burden
Diarrhea is from the Greek word “flow through” and is defined from that word as
the rapid transit of gastric contents through the bowel (Whyte and Jenkins, 2012). The
World Health Organization (WHO), describes diarrhea as the passage of 3 or more loose
or watery stools, or passage more frequently than normal for a given individual within a
period of 24 hours (UNICEF/WHO, 2009). The issue of diarrhea is a worldwide problem
and even in industrialized nations, diarrhea is a considerable cause of morbidity in the
first year of life (Whyte and Jenkins, 2012). In most developing countries, children under
3 years of age experience an average of 3 episodes of diarrhea yearly with high mortality
rates (UNICEF/WHO, 2009). Diarrhea is prevalent in the developing world, largely due
to the lack of safe drinking water, poor hygiene and sanitation, poor health and poor
nutrition status (UNICEF/WHO, 2009). A UNICEF/WHO (2009) report stated that,
Africa and South Asia account for more than 50% of childhood diarrhea cases and more
than 80% of deaths that occur in children in these continents is due to diarrhea. Statistics
show that globally, approximately 20% of all mortality occur in children under 5 years of
age (WHO, 2011) and an estimated 2.5 billion cases of diarrhea occur yearly among pre-
school children (UNICEF/WHO, 2009). In 2012, 6.6 million pre-school children died
from many causes with diarrhea related causes being the second highest (WHO, 2013).
Page 17
5
Furthermore, according to the 2013 WHO facts, an estimated 760,000 deaths occurring
yearly amongst children less than 5 years old is attributed to diarrhea. Diarrhea causes
loss of lives in pre-school children more than malaria, AIDS and measles combined. The
burden of diarrhea on the persons affected, the public health sector and the total
economic development of a nation is so large that it is estimated that 13% of all
Disability Adjusted Life-Year (DALY) are caused by diarrhea (WHO, 2011). DALY is
defined by the WHO as the sum of years of potential life lost due to premature mortality
and the years of productive life lost due to disability. Simply, one DALY is defined as
one lost year of healthy life. According to the United Nations (UN) Millennium
Development Goals, child mortality is to be reduced by two thirds between 1990 and
2015. Progress has been made by reducing childhood mortality to 47%, from 12.4
million in 1990 to 6.6 million in 2012 (UN, 2013). The average rate of death from
diarrhea has also decreased in recent years from about 1.5 million in 2009
(UNICEF/WHO, 2009) to about 760,000 in 2012 (WHO, 2013). However, 6.6 million
total deaths and 760, 000 deaths due to diarrhea is still an alarming number of young
human resources being lost each year; especially in sub-Saharan Africa, where 1 in 10
children die before their 5th birthday (UN, 2013).
1.2. Causes and mechanisms
The major causes of diarrhea are gastrointestinal infections and malnutrition
(UNICEF/WHO, 2009). In cases of diarrhea caused by gastrointestinal infections, the
major pathogen involved is rotavirus which is responsible for 40% of diarrheal cases
(UNICEF/WHO, 2009). The other most common causative agents which are of bacterial
origin include the species Shigella, Campylobacter, Salmonella and E. coli. Diarrheal
Page 18
6
infections from protozoan sources are rare but in some cases, Cryptosporidium species
have been isolated from patients (Manary et al., 2012). It is a common assumption that
cholera causes numerous childhood mortalities due to diarrhea however, such deaths
occur more in adults and older children than in pre-school children (UNICEF/WHO,
2009).
All populations are susceptible to diarrhea but pre-school children are at a greater
risk of life-threatening dehydration caused by diarrhea because water constitutes a bigger
part of a child’s body. Additionally, children have a higher metabolic rate and their
kidneys cannot conserve much water which leads to a more harmful effect when they are
dehydrated (UNICEF/WHO, 2009). The secretion and absorption of water and
electrolytes in the gastrointestinal system is a highly dynamic and balanced process and
the intestines handle large volumes of electrolytes, water and nutrients daily with the
secretion and absorption of fluids occurring simultaneously (Whyte and Jenkins, 2012).
If the amount of fluid secreted from the small intestines exceeds the absorptive capacity
of the large intestines and the efficiency of reabsorption of fluids in the intestines reduces
from 99% to even about 98%, diarrhea could occur (Schiller, 2012; Whyte and Jenkins,
2012). Excess water in feces occurs through one of the following mechanisms: poorly
absorbed ingested materials with high osmotic activity that hold excess fluid, reduction in
the rate of absorption of fluid from the intestines, and increase in the secretion rate of
fluids (Schiller, 2012). In general, two forms of diarrhea are usually seen in patients;
osmotic and secretory diarrhea (Schiller, 2012; Whyte and Jenkins, 2012; Pezzella et al.,
2013).
Page 19
7
Osmotic diarrhea is caused by excess osmotically active particles in the gut lumen
which causes inflammation within the gut mucosa and also drives water into the lumen
via osmotic force (Whyte and Jenkins, 2012). The overload of malabsorbed osmotically
active substances is what causes the water to be retained in the intestinal lumen, causing a
watery diarrhea (Dinesen and Harbord, 2013). In the event of osmotic diarrhea, the
osmotically active substances retain water within the intestines because water is freely
permeable in the intestines (Schiller, 2012). Excessive intake of laxatives and
magnesium containing drugs can result in osmotic diarrhea (Dinesen and Harbord, 2013).
Additionally, malabsorption of solutes like lactose, motility disorders and damage to
absorptive area of the mucosa can result in osmotic diarrhea (Whyte and Jenkins, 2012).
Secretory diarrhea on the other hand is characterized by the secretion of excess
amount of fluids by the bowel mucosa into the lumen; causes include toxins, pathogenic
infections, and also abnormalities in absorptive mechanisms (Dinesen and Harbord,
2013). Toxins and peptides cause secretory diarrhea by abnormal ion transport across
intestinal epithelial cells (Dinesen and Harbord, 2013). In the intestines, the cells in the
Lieberkuhn's crypts function as net secretors of electrolytes and water and also contain a
bidirectional sodium/chloride channel which opens up when there are higher levels of
cyclic AMP (cAMP) and calcium ions (Whyte and Jenkins, 2012). When these channels
open, there is a net movement of chloride, sodium and water into the lumen and a slight
change in the flow across the channel causes an enormous increase in secretion. Toxins
including cholera toxin and pathogenic bacteria like E. coli causes increase in cAMP
levels, which drive chloride across the brush border membrane into the lumen, causing a
net movement of excess water, resulting in watery secretory diarrhea (Whyte and Jenkins,
Page 20
8
2012). Furthermore, abnormal motility, which causes intestinal contents to rush past
absorptive sites before absorption is completed, can result in either osmotic and secretory
diarrhea; it causes secretory diarrhea when water and electrolytes are incompletely
absorbed and it cause osmotic diarrhea when the digestive process for osmotically active
substances is partial (Schiller, 2012). Osmotic diarrhea can be controlled when a child is
fasted; however secretory diarrhea is aggravated when food is withdrawn from the child.
Additionally, there are situations where both osmotic and secretory diarrhea can occur
concurrently (Whyte and Jenkins, 2012, Pezzella et al., 2013).
1.3. Clinical presentation
Diarrhea in children is mostly caused by infectious agents of viral, bacterial and
parasitic origins (WHO, 2013) and is transmitted through the fecal-oral route
(UNICEF/WHO, 2009). The condition exhibits in three main clinical forms which
include acute watery diarrhea, bloody diarrhea and persistent diarrhea (WHO, 2005,
UNICEF/WHO, 2009). Other clinical presentations will also be discussed in addition to
the three mentioned.
1.3.1. Acute diarrhea
Acute watery diarrhea is usually caused by Vibrio cholerae, rotavirus and E. coli
and is characterized by large amounts of fluid losses and usually causes rapid dehydration
in affected children (UNICEF/WHO, 2009; Kelly, 2011). This type of diarrhea can last
for several hours up to about 7 days (UNICEF/WHO, 2009; Kelly, 2011). The key risk
for this type of diarrhea is dehydration and weight loss in children who are not well fed
(WHO, 2005). In the case of severe dehydration, if prompt rehydration therapy is not
Page 21
9
undertaken, metabolic acidosis occurs, consciousness may be impaired and can
eventually lead to coma (Kelly, 2011).
1.3.2. Bloody diarrhea (dysentery)
Bloody diarrhea also known as dysentery is characterized by blood in the watery
stools. There is intestinal damage and rapid nutrient losses in affected individuals; and
bacterial pathogens involved include Shigella spp, Salmonella spp, Campylobacter jenuni
and enterohemorrhagic E. coli (Kelly, 2011). Dehydration may also occur with this type
of diarrhea (WHO, 2005).
1.3.3. Persistent diarrhea
Individuals suffer from episodes of diarrhea which lasts for at least 14 days and
feces may or may not have blood. Persistent diarrhea is very common in malnourished
children or children with AIDS, and enteropathogenic E. coli and enteroaggregative E.
coli are mostly associated with it. This type of diarrhea aggravates malnourishment and
disease conditions in these children (WHO, 2005; UNICEF/WHO, 2009).
1.3.4. Chronic diarrhea
Chronic diarrhea refers to diarrhea that persists for more than 3 (Whyte and
Jenkins, 2012) to 4 (Gorospe and Oxentenko, 2012) weeks.
1.3.5. Antibiotic Associated Diarrhea (AAD)
In certain situations, antibiotic therapy is used in the treatment of infectious
diarrhea (WHO, 2005; Kelly, 2011; Guarino et al., 2012; Dinesen and Harbord, 2013).
Another form of diarrhea that is present in children is known as Antibiotic-Associated
Diarrhea (AAD). AAD is defined as otherwise unexplained diarrhea that occurs with the
administration of antibiotics, and its occurrence in the pediatric population is 11 – 40%
Page 22
10
between the initiation of therapy and up to 2 months after cessation (Szajewska and
others 2006). Beaugerie and Petit (2004) also defined AAD as diarrhea that develops
from few hours after the onset of antibiotic therapy to 6-8 weeks after therapy has ended.
It is documented that antibiotic usage disrupts the integrity of the gut barrier which
results in an individual’s susceptibility to pathogen colonization and growth until the
normal microflora is re-established (McFarland, 2009). AAD may occur due to the
overgrowth of pathogenic microorganisms, direct toxic effect of antibiotics on the
intestines or the alteration of digestive functions which results from low populations of
normal gut flora (Beaugerie and Petit, 2004).
1.3.6. Diarrhea with severe malnutrition (kwashiokor or marasmus)
This form of diarrhea causes high rates of mortality with symptoms of heart
failure, protein, vitamin and mineral deficiency, severe dehydration and systemic
infections (WHO, 2005). Furthermore, persistent diarrhea and bloody diarrhea also
accounts for increasing numbers of deaths with these conditions (WHO, 2005; de Mattos
et al., 2009).
2. The relationship between diarrhea, malnutrition and gastrointestinal health in
pre-school children
Diarrhea is in actual fact a combination of a nutritional disease with fluid and
electrolyte loss. Severe acute malnutrition creates a vulnerable fluid and nutrition
homeostasis and also, diarrhea reduces fluid and nutrient absorption (Manary et al.,
2012). For several years in times past, malnutrition has been known to exacerbate the
burden of life-threatening diseases in developing countries (Pelletier et al., 1995). Even
Page 23
11
though risk of dying is high amongst severely malnourished children, because the
prevalence of moderate malnourishment is high, many of the deaths that occur as a result
of malnutrition are attributable to moderate under-nutrition (Pelletier et al., 1995). In
recent years, malnutrition in young children is still a major contributing factor to disease
prevalence in children with diarrhea being no exception (Caufield et al., 2004). Diarrhea
is both a cause and a consequence of malnutrition in pre-school children; a vicious cycle
exists between malnutrition and diarrhea (UNICEF/WHO, 2009; Manary et al., 2012;
WHO, 2013). When children are undernourished, they are at a higher risk of frequent
episodes of diarrhea which are very severe and go on for several days. Unfortunately,
when these children go through repeated bouts of diarrhea, their nutritional and health
statuses worsen because they are not able to feed well and nutrient absorption is
decreased which exacerbates malnourishment. For this reason, diarrhea has been
documented to be one of the causes of stunted growth (UNICEF/WHO, 2009). A high
risk for death and disability occurs when children with severe acute malnourishment have
numerous incidence of diarrhea because high loss of water from diarrhea can lead to
dehydration, shock, electrolyte imbalance and poor mental health (Suh et al., 2010).
Most malnourished children who do not die from diarrhea face chronic problems in their
physiological and intellectual development (Whyte and Jenkins, 2012). Furthermore,
when children suffer from severe and numerous bouts of diarrhea, they become
susceptible to morbidity and mortality from other infections and diseases (Moore et al.,
2010).
There is a bidirectional causal relationship between chronic diarrhea and
malnutrition, and the nature and severity of malnourishment depends on cause of the
Page 24
12
chronic diarrhea coupled with the location and extent of gastrointestinal involvement
(Gorospe and Oxentenko, 2012). Chronic diarrhea predisposes a child to a poor
nutritional status, and malnutrition increases the risk of having prolonged diarrhea due to
poor immune response and other adverse mucosal conditions (Gorospe and Oxentenko,
2012). Malnutrition broadly refers to an imbalance of nutritional intake and utilization,
and the type of malnutrition presented in developing and under developed countries is
under-nutrition and/or protein-energy malnutrition. Malnutrition in pre-school children is
mostly due to inadequate intake of appropriate nutrients and/or the inability to maintain
adequate stores of calories and essential nutrients due to underlying causes such as
chronic diarrhea (Gorospe and Oxentenko, 2012). Malabsorption refers to defective
mucosal absorption of nutrients mostly in the small intestines and is an underlying
process for both malnutrition and chronic diarrhea. Chronic diarrhea may also result in
lethargy and increased nutrient losses which eventually leads to malnutrition; this vicious
cycle continues with impairment to intestinal recovery, and consequently, increasing rates
of malabsorption and, aggravating malnutrition and diarrhea. Fig. 2.1 (adapted from
Gorospe and Oxentenko, 2012) depicts the simple vicious cycle of malnutrition and
chronic diarrhea. There also exists a relationship between gastrointestinal infections,
chronic diarrhea and malnutrition (Gorospe and Oxentenko, 2012). Infections directly
cause malnutrition by increasing catabolism and caloric loss and indirectly cause
malnutrition by inducing mucosal injury and inflammation, subsequently resulting in
chronic diarrhea. Malnutrition can also prolong the period an infection persists as it
impairs the host's immune response and gut mucosal barrier functions (Gorospe and
Oxentenko, 2012). Fig. 2.2 shows the relationship between gastrointestinal infections
Page 25
13
and malnutrition as adapted from (Gorospe and Oxentenko, 2012). It is impossible to
discuss diarrhea without considering intestinal health. To combat malnutrition and
reduce the mortality of young children, the importance of intestinal health cannot be
overlooked (Sekirov et al., 2010). In 400 B.C., Hippocrates, made a phenomenal
statement: “death sits in the bowels” and “bad digestion is the root of all evil” (Sekirov et
al., 2010). Colonization of the gastrointestinal tract starts during the birthing process and
an individual’s microbiota is influenced by genetic factors, antibiotic usage, neonatal
nutrition, adult nutrition, mode of infant delivery and hygienic factors (Brown et al.,
2012). Research suggests that, the numbers and composition of microbes in the gut is
related to disease; it has an influence on the susceptibility of an individual to chronic
diseases like irritable bowel syndrome, obesity, diabetes, celiac disease and Crohn’s
disease and has been implicated in several cases of these diseases (Sekirov et al., 2010;
Brown et al., 2012). A number of studies has shown that there are differences in the
microbiota of individuals based on their diet which directly influences their susceptibility
to both infections and chronic ailments; and the microbiota of the gastrointestinal tract is
one of the most critical factors in determining the susceptibility of an individual to
gastrointestinal infections (Sekirov et al., 2010; Brown et al., 2012). Diet and nutrition,
especially relating to neonates and in children less than 5 years of age play one of the
most important roles in the diversity and function of the gut microflora (Brown et al.,
2012). de Lange et al. (2010) reported that, feeding young pigs with dietary fiber, crude
protein, plasma proteins, feed enzymes, probiotics, prebiotics and essential oils
stimulated the establishment of a healthy gut microbiota, improved growth and reduced
the incidence of infections especially diarrhea. A study conducted in Bangladesh
Page 26
14
revealed that the gut microbiota of healthy and malnourished children differed
significantly especially with the malnourished children having higher numbers of
pathogenic bacteria from the genera Escherichia and Klebsiella (Monira et al., 2011).
Results from that study confirm that diet plays a very unique and important role in the
balance and function of the gut microbiota and the overall health of children less than 5
years of age. The relationship between diet and gastrointestinal health suggests why
severely and/or moderately malnourished children are more prone to diarrheal diseases.
3. Current intervention methods and the role of probiotics
Regardless of whichever type of clinical diarrhea may persist, one or more of the
following interventions may be involved; they can be broadly categorized into
rehydration therapy, pharmacologic therapy, micronutrient supplementation and dietary
therapy (Podewils et al., 2004; WHO, 2009).
3.1. Rehydration therapy
Loss of water and electrolytes occur during diarrhea, is a situation that is highly
linked to death. The WHO has recommended oral rehydration therapy since 1970 to
prevent severe dehydration associated with diarrhea; rehydration is the first aid in the
treatment plan for all forms of diarrhea (WHO, 2005). In the event of severe dehydration
intravenous rehydration is required (Kelly, 2011); normal saline or lactated ringer
solution should be administered intravenously immediately at a rate of 30 mL/kg of body
weight for 30 min to 1 h and then 70 mL/kg body weight for 2.5 to 5 h until the
perfusion, pulse and mental status normalizes, thereafter oral therapy is administered
(Podewils et al., 2004; WHO, 2005). In the event of mild to moderate dehydration, Oral
Page 27
15
Rehydration Therapy (ORT) should be initiated (Podewils et al., 2004) and the most
common rehydration therapy used is the Oral Rehydration Salt (ORS) administered at a
rate of 75 mL/kg of body weight per h for 4 h (Podewils et al., 2004; WHO, 2005). The
WHO (2005) reported that an improved ORS has been developed after 20 years of
research. The new formula is called low or reduced osmolarity ORS. Its use reduces the
need for supplemental intravenous fluid therapy by 33% after initial rehydration. The
WHO findings recorded that, upon administration of the low osmolarity ORS, the
incidence of stool volume is reduced by 20% and the incidence of vomiting by 30%; this
new formula is currently recommended by UNICEF/WHO. There are other available
commercial rehydration fluids and homemade fluids which include gruels of very thin
consistency made from maize, rice, potato, millet or sorghum with salt and some sugar
added; generally foods or fluids with very thin consistency which contains salt are
recommended (WHO, 2005). Furthermore, breastfeeding is a good rehydration therapy
for young children (WHO, 2005; Kelly, 2011). The administration of ORS does not
directly stop diarrhea but rather controls dehydration. In 1966, scientists discovered that
the sodium glucose transporter is not affected by the pathogens responsible for diarrhea
and thus in the presence of sodium and glucose in the lumen, the transport mechanism
continues to work even as the chloride channel continues to cause secretion of fluids
(Whyte and Jenkins, 2012). Thus, because ORS contains both sodium and glucose in the
correct proportions, when administered, the absorption of sodium is increased, thereby
promoting passive absorption of water. Therefore by administering ORS to affected
children, they are hydrated until the causative pathogen is eliminated from the body
(Whyte and Jenkins, 2012).
Page 28
16
3.2. Pharmacologic therapy
Antimicrobials are not part of the normal routine for diarrheal treatment and its
use is controversial as diarrheal cases is self-limiting (Podewils, 2004). The WHO
recommends that antimicrobials should not be used routinely because it is a hurdle to
clinically distinguish between cases caused by enterotoxigenic E. coli from those caused
by rotavirus and Cryptosporidium, which cannot be eliminated by antimicrobials (WHO,
2005). According to the WHO (2005), the sensitivity of the causative agent is needed
for proper antimicrobial administration and such information is usually unavailable.
Additionally, antimicrobial usage increases the risk of adverse reaction and promotes the
development of resistant bacteria (Servin, 2004). However, antimicrobial treatment
decreases the duration of the ailment and also reduces the fluid requirements (Podewils,
2004). Antimicrobials are used in some cases including Campylobacter infections,
dysenteric shigellosis, cholera, and some protozoal infection in severe
immunocompromised patients and patients with bacterial overgrowth in the intestines
(Podewils et al., 2004; WHO, 2005; Kelly, 2011; Guarino et al, 2012; Whyte and Jenkins,
2012).
3.3. Micronutrient supplementation
Zinc and vitamin A are the most common micronutrients given during episodes of
diarrhea as an adjunct therapy (Manary et al., 2012). Treatment package recommended
by UNICEF/WHO for diarrhea control includes two main components which are
rehydration and zinc supplementation (UNICEF/WHO, 2009), thus making zinc
supplementation a very important factor in diarrhea management. The WHO
recommends the administration of zinc (10-20 mg/day administration for 10-14 days) to
Page 29
17
children suffering from acute or persistent diarrhea (Podewils et al., 2004; WHO, 2005;
UNICEF/WHO, 2009) and it has been documented that zinc shortens the duration of
diarrhea and lessens the severity. The administration of zinc has also proven to reduce
mortality rates from persistent diarrhea by 75% (Podewils et al., 2004). Zinc is both
preventive and therapeutic in diarrheal management and stimulates immune response, ion
absorption, and promotes the repair and proliferation of epithelial cells (Guarino et al.,
2012). Podewils et al. (2004) reported poor consistent research results on the
effectiveness of Vitamin A for reducing the severity of diarrhea. However, WHO reports
that vitamin A supplementation has been shown to decrease the duration, severity and
complications associated with diarrhea (UNICEF/WHO, 2009).
3.4. Dietary therapy
The main objective of any treatment package in the event of diarrhea is to prevent
dehydration and also to improve the nutritional status of the affected child (WHO, 2005)
and thus the importance of food in diarrheal management cannot be underestimated.
Food consumption in the form of a soft bland diet during the period of diarrhea is
recommended as it helps in fluid absorption and consequently rehydration, speeds up
recovery of intestinal function, and aid in the repair of enterocytes (Whyte and Jenkins,
2012; Dinesen and Harbord, 2013). As a rule, the WHO recommends that the usual diet
of a child should not be withheld or diluted but continued during diarrhea and increased
after the diarrhea clears and children being breastfed should continue breastfeeding
(WHO, 2005). When a child suffering from diarrhea does not feed well, the duration of
illness increases and restoration of normal intestinal functions prolongs. In addition,
because most malnourished children suffer from diarrhea, withholding food from them
Page 30
18
worsens their nutritional status and increases mortality rate (UNICEF/WHO, 2009). The
importance of food in diarrhea management was reported in a study by de Mattos et al.
(2009). They observed the duration of persistent diarrhea in children when fed with four
different diets; children fed with a yoghurt-based or amino acid-based diet, experienced a
significant reduction in the duration of diarrhea and in the stool output. However, soy-
based and casein-based diets did not have any benefit in the management of persistent
diarrhea in the children. Their findings suggest that indeed diet plays a role in the
occurrence and management of diarrhea.
3.5. Probiotics
Some authors have reported that the role of probiotics in the management of
diarrhea is unclear and thus administration is not routinely recommended (Podewils et al,
2004; Kelly, 2011; Whyte and Jenkins, 2012). A report by Manary et al. (2012) indicates
that specific probiotics (L. rhamnosus GG. L. bulgaricus and S. thermophilus) decreased
diarrhea frequency and duration in well-nourished children but data from malnourished
children was mixed. Regardless, numerous preliminary experiments and clinical studies
show probiotics as an important new therapy for the prevention and treatment of
infectious diarrhea (Saavedra, 2000). There are numerous documentations from clinical
studies that suggest the effectiveness of probiotics in reducing the incidence of diarrhea,
shortening the duration and/or reducing the severity of diarrhea (Marteau, 2001;
Cremonini et al., 2002; Tuohy et al., 2003; Isolauri, 2004; Nomoto, 2005; Binns and Lee,
2010).
Page 31
19
4. What probiotics are
In recent years, there is more awareness on the relationship between diet and
health and this has birthed functional foods. The term functional food is not defined by
law or in the dictionary and is an emerging term for foods that have health benefits
beyond basic nutrition. Different organizations have different definitions for the term but
they all have a common root. IFT’s functional food experts define functional foods as
foods and food components that provide essential nutrients often beyond quantities
necessary for normal maintenance, growth, and development, and/or other biologically
active components that impart health benefits or desirable physiological effects (IFT,
2014). Functional foods are placed between foods which supply basic physiological
needs and drugs that treat diseases and are used to sustain good health and counterbalance
small physiological changes that may occur in a healthy individual (Jankovic et al.,
2010). In recent times, most functional food products target gastrointestinal health
because the gut acts as an interface between diet and metabolic pathways in the human
body (Zubillaga et al., 2001; Reid, 2008) and hence, probiotic organisms are of much
interest in the functional food industry. As early as 1992, Roy Fuller defined probiotic
foods as foods containing live microorganisms believed to actively enhance health by
promoting the balance of microflora in the gut (Shah, 2007). Probiotics are classified as
functional food components and the current definition is live microorganisms which,
when administered in adequate amounts, confer a health benefit to the host (FAO/WHO,
2001). It must also be noted that probiotics are not commensal microorganisms found in
the gut (Reid, 2008). Prior to this definition, a very popular one existed which was live
microbial supplements that beneficially affect the host by improving its intestinal
Page 32
20
microbial balance (Fuller, 1989). Both the past and recent definitions propose probiotics
as microorganisms which improve the health status of the consumer. The word
'probiotic' is originally from the Greek word 'pros bios' which means 'for life' (Gismondo
et al., 1999). Members of the genera Bifidobacterium and Lactobacillus are the mostly
used probiotics and with many documentation on their effectiveness (Gomes and Malcata
1999; Shah, 2007; Alegre et al., 2011; Butel, 2013). Furthermore, some species from the
genera Leuconostoc, Enterococcus and Pediococcus also exhibit probiotic properties
(Shah, 2007; Butel, 2013). Many probiotic microorganisms are lactic acid producing
bacteria which are gram positive, nonmotile, non-sporeforming rod and coccus-shaped
organisms that ferment carbohydrates and alcohol to predominantly produce lactic acid
(Stiles and Holzapfel, 1997). To be considered as a probiotic organism, a bacterium must
be resistant to acids and bile, attach to human epithelial cells, colonize in the human
intestines, produce antimicrobial substances, have good growth characteristics and also
have some proposed health benefits (Prado et al., 2008; Ranadheera et al., 2010; Sarkar,
2010). The intestinal microbiota plays a role in homeostasis, as well as metabolic,
nutritional, physiological and immunological processes in the human body (Sekirov et al.,
2010; Gerritsen et al., 2011). The gut microbiota is rich with a diversity of
microorganisms (about 100 trillion of over 1000 species) with differences in numbers and
composition at different sections of the gastrointestinal tract (Sekirov et al., 2010;
Gerritsen et al., 2011; Jost et al., 2012). The gastrointestinal tract is a large organ and
harbors a large percentage of the human microflora with the colon alone containing over
70% of the microbes in the body (Sekirov et al., 2010). As already stated, there is an
important relationship between the microbiota of an individual and the function of the
Page 33
21
intestines so it is vital that the microbiota functions normally to maintain a balance
immunity and homeostasis (Brown et al., 2012) which thus makes probiotics
indispensable in maintaining good gastrointestinal health. Recently, there have been
much research on probiotics and numerous health benefits have been proposed.
Although the mechanisms of action are not very understood there are few proposed one
and are listed below.
4.1. Proposed mechanisms of action
4.1.1. Modulation of host's microbiota
Originally, the purpose for probiotics was to change the composition of the
normal intestinal microflora from a potentially harmful composition into a microflora that
would be beneficial towards an individual (Ouwehand et al., 2002). This statement
suggests that the modulation of host's microbiota is one of the important and/or initial
mechanisms by which probiotics exert their health benefits. The microbiota is an
important constituent of the intestine's defense barrier because it induces and maintains
specific immune responses and hypo-responsiveness to antigens (Tuohy et al., 2003).
Modulation of the host's microbiota produces what is called the "barrier effect" which is
the resistance to colonization by pathogenic microorganisms (Butel, 2013). Inhibition of
pathogens may be due to the production of metabolites such as short chain fatty acids that
reduces lumen pH, production of bio-surfactants and other substances with antimicrobial
activity, competition for binding and adhesion sites, production of broad spectrum
bacteriocin, and inhibition of adhesion (Ouwehand et al., 2002; Nomoto, 2005;
Oelschlaeger, 2010; Butel, 2014).
Page 34
22
4.1.2. Enhanced gut barrier functions
Intestinal mucosa provides protection to the host against antigens in the gut lumen
that originate from ingested food as well as the normal microflora (Ouwehand et al.,
2002). The permeability of the intestines is a reflection of the gut-barrier function and an
immature gut barrier could lead to severe intestinal permeability, immune responses and
abnormal antigen transfer which increase the host's vulnerability to inflammation and
infections (Isolauri, 2001). Some of gut barrier functions include peristalsis, production
of gastric acid and mucus, intestinal proteolysis and intracellular junction complexes
(Ouwehand et al., 2002). Probiotics are known to improve gut barrier functions and one
mechanism is by increasing the expression of mucins that leads to improved barrier
effects by preventing direct contact of pathogens with the intestinal lumen (Isolauri,
2001; Butel, 2014). Additionally, probiotics are suggested to improve the junctions
between intestinal epithelial cells as a physiological barrier function and improve the
production of antimicrobial peptides (Butel, 2014).
4.1.3. Immune modulation
More than 70% of immune cells are present in the gut, making the intestines one
of the largest organs that controls immune functions in the body (Butel, 2013). The
gastrointestinal barrier controls antigen transport and the generation of immunologic
phenomena in the gut and an immature or poor gut barrier may cause an increase in
intestinal permeability and irregular antigen transfer and immune responses which makes
a person susceptible to infections, inflammation and hypersensitivity (Isolauri, 2001).
Probiotics may indirectly influence the body's immune functions by changing the activity
and of composition of the intestinal flora (Ouwehand et al., 2002; Shah, 2007). Isolauri
Page 35
23
(2001) elaborated that consumption of probiotics reinforces immune regulation, immune
elimination and immune exclusion. Interaction of probiotics with host epithelial cells via
adhesion can activate a signaling cascade that could lead to immune modulation
(Oelschlaeger, 2010). In addition, stimulation of secretory IgA is increased (Butel, 2014)
and a proposed mechanism of stimulation is: some probiotics can liberate low molecular
weight peptides that trigger an immune response that stimulates the production of IgA in
response to antigenic stimulus (Tuohy et al., 2003). L. casei shirota has been reported to
promote the proliferation of macrophages and neutrophils in the bone marrow and spleen
(Nomoto, 2005). Data also suggest that in neonates when the gut microbiota delays in
development, there is delayed maturation of circulating IgA and IgM secreting cells
(Isolauri, 2001), hence confirming the importance of a gastrointestinal health in immune
function.
4.2. Proposed health benefits
4.2.1. Improvement in lactose metabolism
One of the most widely accepted health benefits of probiotic microorganisms is
the relief of the symptoms of lactose malabsorption (Shah, 2007). Lactose intolerance is
a digestive problem, which is very common amongst many populations worldwide and is
caused by the deficiency of the enzyme β-D-galactosidase. This enzyme is responsible
for the cleaving of lactose into glucose and galactose. Probiotic cultures produce β-D-
galactosidase which is released into the intestines when the bacteria are lysed by bile salts
(Tuohy et al., 2003). Thus, probiotics can help in alleviating lactose malabsorption
(Gismondo et al., 1999; Kailasapathy and Chin, 2000; Zubillaga et al., 2001; Shah, 2007).
Page 36
24
4.2.2. As an adjunct therapy in inflammatory bowel disease (IBD) and irritable
bowel syndrome
One of the well documented clinical applications of probiotics is its use as adjunct
therapy in gut-inflammatory conditions (Isolauri, 2001). Some authors have proposed
that although the mechanism of IBD is not clear, it is assumed that the disease is a result
of dysfunction of the host immune response towards normal gastrointestinal microbiota
or from a defective mucosal barrier (Anukam, 2007). Because research has shown that
the numbers of Lactobacillus and Bifidobacterium in patients with Crohn's disease and
ulcerative colitis is very low (Shah, 2007), a possible relationship between microbiota
and mucosal inflammation is suggested (Butel, 2014). The role of probiotics in
inflammatory bowel disease is not curative rather, the use of probiotics prolongs periods
of remission after treatment with corticosteroids, hence preventing frequent relapse
(Ouwehand et al., 2002; Sullivan, 2002; Tuohy et al., 2003; Shah, 2007; Butel, 2014).
The prevention of relapse is believed to be either through the regulation of inflammatory
response or modulation of the gut microbiota composition or its activities (Tuohy et al.,
2003). Butel (2014) believed after conducting some clinical control trials that, probiotics
are a potential therapy for the management of irritable bowel syndrome.
4.2.3. Control of Helicobacter pylori infections
H. pylori is associated with the development of peptic ulcer, gastric cancer and
chronic gastritis and it produces urease which hydrolysis urea to ammonium thus
increasing the pH of the stomach, consequently promoting colonization of the pathogen
(Sullivan and Nord, 2002; Shah, 2007). This infection is typically treated with antibiotics
which usually have side effects (Shah, 2007). Several in vitro studies have shown that
Page 37
25
some strains of Lactobacillus and Bifidobacterium inhibit the growth and attachment of
H. pylori and reduce the load of the bacteria (Zubillaga et al., 2001; Sullivan and Nord,
2002; Shah, 2007). Nomoto (2005) reported that in a clinical study that involved 53
individuals infected with H. pylori, the patients who were administered with fermented
milk containing L. johnsonii La1 had lower populations of H. pylori in the stomach at the
end of the study. S. boulardii has also been shown to be a promising adjuvant for
antibiotic therapy in treating H. pyori infections (Butel, 2014).
4.2.4. Reduction in serum cholesterol
Some studies have shown that probiotic bacteria are able to de-conjugate bile salts
and de-conjugated bile salts does not absorb lipids as readily as conjugated bile salts and
consequently reduces cholesterol levels (Gomes and Malcata, 1999; Kailasapathy and
Chin, 2000; Shah, 2007; Oelschlaeger, 2010).
4.2.5. Management of diarrhea
One of the well proven and best documented benefits of the administration of
probiotics is the prevention and treatment of infectious diarrhea and antibiotic associated
diarrhea (Gorbach, 2002) especially as occurs in children. Probiotics have been proven
to be effective against diarrheal causing pathogens including rotavirus, Salmonella,
Clostridium difficile, and E. coli (Shah, 2007). Probiotics reduce the incidence, duration
and severity of diarrhea, and prevents the occurrence of diarrhea in children (Marteau,
2001; Cremonini et al., 2002; Tuohy et al., 2003, Isolauri, 2004; Sazawal et al., 2006;
Szajewska et al., 2006; McFarland, 2009; Binns and Lee, 2010; Butel, 2013). L.
rhamnosus GG, L. reuteri, L. casei and B. lactis Bb12 are some of the strains which have
been adequately studied as effective in managing diarrhea though well controlled clinical
Page 38
26
trials (Sullivan and Nord, 2002; Tuohy et al., 2003; Isolauri, 2004; Shah, 2007). In a
review of 63 clinical studies of about 10,000 participants, of which 56 of the studies
involved infants and young children it was recorded that, notwithstanding the study
endpoints and the nutritional status of the patients, the frequency and duration of acute
infectious diarrhea was significantly reduced in patients administered with probiotics
(Hom, 2011).
Of all the probiotic strains, L. rhamnosus GG is the most widely used and also
the one with lots of positive clinical reports on their effectiveness in the control,
treatment and prevention of diarrhea in children (Gismondo et al., 1999, Gorbach, 2002;
Tuohy et al., 2003; Nomoto, 2005). L. rhamnosus GG has been reported to be more
effective in the treatment of rotaviral diarrhea than L. bulgaricus and S. thermophilus
(Shah, 2007). As early as in the late 90s, Guarino et al. (1997) reported that
administration of L. rhamnosus GG reduced the duration of rotaviral diarrhea and
decreased the shedding of the virus in infected children. In another study, L. rhamnosus
GG was able to significantly reduce rotavirus diarrhea in more than 100 children in 3
randomized controlled trials (Butel, 2014). L. rhamnosus GG was proven to be effective
when its administration significantly shortened the duration of rotaviral diarrhea and
reduced the risk of nosocomial diarrhea in neonates (Nimoto, 2005). Apart from rotaviral
infection, L. rhamnosus GG is shown to be useful in the management of AAD. The
simultaneous administration of L. rhamnosus GG with erythromycin decreased the risk of
AAD with the occurrence of diarrhea being 17% in treatment group and 48% in the
control group (Cremonini et al., 2002). Researchers of another study observed the effects
of probiotic consumption on AAD and they observed that the frequency of AAD in 269
Page 39
27
children was 3.4% in treatment group and 17.3% in placebo group (McFarland, 2009).
The reduction in the duration of AAD with the administration of L. rhamnosus GG was
also reported by Gismondo et al., (1999) and Tuohy et al., (2003). Several studies have
also shown that L. rhamnosus GG was effective in reducing the duration of infantile and
acute diarrhea (Sullivan and Nord, 2002; Tuohy et al., 2003; Shah, 2007).
4.2.6. Other proposed functions
Probiotics are also proposed to have some other functions including: alleviating of
allergic reactions, anti-inflammatory response, anti-mutagenic and anti-cancerous effects
(Zubillaga et al., 2001; Gorbach, 2002; Ouwehand et al., 2002; Sullivan and Nord, 2002;
Touhy et al., 2003; Isolauri, 2004; Shah, 2007; Butel, 2014).
5. Role of food matrix in probiotic survival and actions
5.1. What is a probiotic food?
Probiotic food product is defined as a food product that contains viable
microorganisms in sufficient populations incorporated in a suitable matrix (Cruz et al.,
2009). To provide health benefits related to probiotics, recommendations for minimum
viable cells in a food product vary and there are no official or specific set standards (Reid
2008; Karimi et al., 2011). Some authors suggest a minimum level of 106 CFU/g or
CFU/mL (Thamaraj and Shah 2004; Helland et al., 2004; Possemiers et al., 2010).
However, others recommend a daily consumption of at least 108 – 1010 cells in about 100
g/mL of products; equivalent to 106 – 107 viable cells in a g or mL of food (Angelov et
al., 2005; Cruz et al., 2009; Champagne et al., 2011; Karimi et al., 2011). Furthermore,
Page 40
28
the Canadian Food Inspection Agency recommends an arbitrary number of 109 CFU per
serving (Champagne et al. (2011).
The type of food matrix used as a carrier for probiotic delivery has a significant
influence on their survival during the storage of the food product and on their efficacy
when consumed (Ranadheera et al., 2010). Food substrate is one of the major factors
regulating the colonization of microorganisms in the gastrointestinal tract and protecting
probiotic bacteria during transit in the stomach; food may contain ingredients that could
interact with probiotics to improve their functionality (Ranadheera et al., 2010). The
nature of a food matrix or its formulation is a major technological factor that influences
the functionality of probiotics (Mattila-Sandholm et al., 2002). Probiotics are not new
products and for centuries, mainly have been carried in cultured/fermented milk
(Boylston et al., 2004; Rivera-Espinoza and Gallardo-Navarro, 2010; Champagne et al.,
2011; Nousia et al., 2011) which appear to be very good vehicles (Champagne and
Gardner, 2005; Ranadheera et al., 2010).
5.2. Current trends in probiotic products
Recently, a lot of research is being done on the possibility of using other dairy
products and non-dairy products as potential carriers of probiotic cultures. Consumers
are having increasing demand for non-dairy probiotic products because of taste for
variety, increase in numbers of vegetarians, cholesterol content of dairy foods, and
lactose intolerance issues (Heenan et al., 2004; Prado et al., 2008; Granato et al., 2010;
Rivera-Espinoza and Gallardo-Navarro, 2010). It is essential that probiotic foods and
beverages are part of regular and daily diet of a population so that therapeutic levels are
easily achieved (Rodgers, 2008; Ranadheera et al., 2010) supporting the need for more
Page 41
29
variety of both dairy and non-dairy probiotic foods and beverages. Probiotic bacterial
cells are required to survive processing steps used to incorporate them into food products
and should be stable during storage by maintaining viable numbers and functionality
(Knorr, 1998; Ubbink and Krüger, 2006; Cruz et al., 2009; Jankovic et al., 2010;
Champagne et al., 2011; Karimi et al., 2011). It is important to examine factors that
affect the viability of probiotics during storage separately from those that affect survival
of probiotics during processing because the ability to survive during processing is not
linked to the ability to survive during storage (Champagne et al., 2005). A key
consideration when selecting foods as vehicles for probiotics is the types and
concentration of proteins, fat and sugars, as well as the pH of the food product
(Ranadheera et al., 2010). It is essential because these contribute to the buffering
capacity of foods, an important factor which affect probiotic survival and growth in the
gut and stability during storage (Ranadheera et al., 2010; Rivera-Espinoza and Gallardo-
Navarro, 2010). There are several studies on successful development different probiotic
products, of which some are dairy-based and some are not.
5.2.1. Cheese products
Cheese is one of the most promising carriers for probiotic delivery as it has a
dense solid matrice, a relatively high fat content, a higher pH, lower titratable acidity, and
a good buffering capacity which protects probiotic cells against harsh gastric and
intestinal conditions (Karimi et al., 2011). Several studies have thus been conducted on
cheese as a plausible carrier for probiotics. Liong et al. (2009) incorporated L.
acidophilus FTCC 0291 into a soy-based cream cheese and reported that the probiotic
organism maintained the proposed therapeutic level of 106 CFU/g during a 20 d storage
Page 42
30
period at both 4 °C and 25 °C. Argentinian Fresco cheese was used to carry different
strains of Bifidobacterium and Lactobacillus and in 60 d, the probiotic microorganisms
survived satisfactorily (Vinderola et al., 2000). Cheese-based dips were found to be an
ideal carrier for three strains of Lactobacillus, one strain of Bifidobacterium and
Propionibacterium (Tharmaraj and Shah, 2004). Cheddar cheese proved to be a great
vehicle for probiotic delivery as therapeutic levels of cells were maintained for 32 wk
(Phillips et al., 2006). Fortin et al. (2011) also reported that cheddar cheese as a suitable
matrice for B. longum and white cheese was successfully made with L. acidophilus by
Kasimoğlu et al. (2004).
5.2.2. Chocolate
Dark and milk chocolate matrices served successfully as vehicles for the delivery
of L. helveticus and B. longum; and after a simulated stomach and intestinal passage, the
chocolate matrix had 5 fold more viable probiotic cells compared to milk matrix.
(Possemiers et al., 2010). Sucrose-free milk and dark chocolates were processed with
yoghurt bacteria which were shown to survive during the production of the chocolate and
remain viable during storage (Nebesny et al., 2005).
5.2.3. Vegetable, cereal and soy based products
Rathore et al. (2012) reported that a strain of L. plantarum and L. acidophilus was
able to ferment cereal substrate to produce a potential probiotic beverage, and Coda et al.
(2011) were also able to produce a fermented probiotic beverage from cereals. Soy bar
was found to be a suitable matrix for the delivery of some probiotic microorganisms
(Chen and Mustapha, 2012). A series of successful probiotic incorporation has been
Page 43
31
done with other soy products including: soy yoghurt (Bedani et al, 2014), soy beverage
(Champagne et al., 2010), and fermented soy product (Bedani et al., 2013).
5.2.4. Ice cream products
Some authors have also effectively incorporated different probiotic bacteria into
ice-cream which is one of matrices considered as suitable for probiotic delivery. Good
survival data have been documented for probiotics during processing and storage of
probiotic ice-cream (Hekmat and McMahon, 1992; Salem et al., 2005; Cruz et al., 2009;
Mohammadi et al., 2011; Nousia et al., 2011).
5.2.5. Characteristics of peanut butter that makes it a possible vehicle for probiotic
delivery as a target towards diarrhea management in children
Peanut butter is a colloidal suspension of lipid and water in a peanut meal phase
(Burnett et al., 2000). It is shelf stable, energy dense, low moisture and nutrient dense
product and is one of the major ingredients in Ready to Use Therapeutic Foods (RUTFs)
which are used to treat acute and chronic malnutrition (Manary, 2006; Diop et al., 2003;
Ndekha et al., 2005). Peanut butter is also one of the natural rich sources of arginine (ca.
2.7g/100g peanut butter). Arginine is a conditionally essential amino acid but in
neonates and young children, it is essential (Tapiero et al. 2002). Arginine plays a key
role in intestinal health. It modulates a lot of metabolic activities including growth and
immune function (Nieves and Langkamp-Henken, 2002). Arginine supplementation is
effective in improving intestinal barrier function and integrity (Viana et al. 2010; Wang et
al. 2009). Several studies with animal models have revealed the function of arginine in
gut integrity. When the diets of weaned piglets were supplemented with arginine, their
intestinal morphology was improved and the incidence of diarrhea was reduced compared
Page 44
32
to control groups (Shan et al. 2012). The physical and nutritional properties of peanut
butter make it an ideal vehicle to deliver probiotics and maintain probiotic viability.
Therefore probiotic peanut butter can be used to deliver probiotic cultures to manage
diarrhea and malnutrition concurrently.
REFERENCES
Alegre, I., Viñas, I., Usall, J., Anguera, M., Abadias, M., 2011. Microbiological and
physicochemical quality of fresh-cut apple enriched with the probiotic strain
Lactobacillus rhamnosus GG. Food Microbiology 28, 59-66.
Angelov, A., Gotcheva, V., Hristozova, T., Gargova, S., 2005. Application of pure and
mixed probiotic lactic acid bacteria and yeast cultures for oat fermentation.
Journal of the Science of Food and Agriculture 85, 2134-2141.
Anukam, K.C., Reid, G., 2007. Probiotics: 100 years (1907-2007) after Elie
Metchnikoff's observation. In: A. Mendez-vilas (Ed.), Communicating Current
Research and Educational Topics and Trends in Applied Microbiology. Spain, pp.
466-474.
Beaugerie, L., Petit, J-C. 2004. Antibiotic-associated diarrhea. Best Practice and
Research Clinical Gastroenterology 18(2), 337-352.
Bedani, R., Rossi, E.A., Saad, S.M.I., 2013. Impact of inulin and okara on Lactobacillus
acidophilus La-5 and Bifidobacterium animalis Bb-12 viability in a fermented soy
product and probiotic survival under in vitro simulated gastrointestinal conditions.
Food Microbiology 34, 382-389.
Page 45
33
Binns, C., Lee, M.K., 2010. The use of probiotics to prevent diarrhea in young children
attending child care centers: a review. Journal of Experimental and Clinical
Medicine 2, 269-273.
Boylston, T.D., Vinderola, C.G., Ghoddusi, H.B., Reinheimer, J.A., 2004. Incorporation
of bifidobacterium into cheeses: challenges and rewards. International Dairy
Journal 14, 375-387.
Brown, K., DeCoffe, D., Molcan, E., Gibson, D.L., 2012. Diet-induced dysbiosis of the
intestinal microbiota and the effects on immunity and disease. Nutrients 4, 1095-
1119.
Burnett, S.L., Gehm, E.R., Wessinger. W.R., Beuchat, L.R., 2000. Survival of Salmonella
in peanut butter and peanut spread. Journal of Applied Microbiology 89, 472-477.
Butel, M.J., 2014. Probiotics, gut microbiota and health. Médecine et maladies
infectieuses 44(1), 1-8.
Caulfield, L.E., de Onis, M., Blössner, M., Black, R.E., 2004. Undernutrition as an
underlying cause of child deaths associated with diarrhea, pneumonia, malaria,
and measles. The American Journal of Clinical Nutrition 80, 193-198.
Champagne, C.P., Gardner, N.J., Roy, D., 2005. Challenges in the addition of probiotic
cultures to foods. Critical Review in Food Science and Nutrition 45, 61-84.
Champagne, C.P., Ross, R.P., Saarela, M., Hansen, K.F., Charalampopoulos, D., 2011.
Recommendations for the viability assessment of probiotics as concentrated
cultures and in food matrices. International Journal of Food Microbiology 149,
185-193.
Page 46
34
Chen, M., Mustapha, A., 2012. Survival of freeze-dried microcapsules of α-galactosidase
producing probiotics in soy bar matrix. Food Microbiology 30, 68-73.
Coda, R., Rizzello, C.G., Trani, A., Gobbetti, M., 2011. Manufacture and characterization
of functional emmer beverages fermented by selected lactic acid bacteria. Food
Microbiology 28, 526-536.
Cremonini, F., Di Caro, S., Santarelli, L., Gabriellu, M., Candelli, M., Nista, E.C.,
Lupascu, A., Gasbarrini, G., Gasbarrini, A., 2002. Probiotics in antibiotic-
associated diarrhea. Digestive and Liver Disease 34, S78-S80.
Cruz, A.G., Antunes, A.E.C., Sousa, A.L.O.P, Faria, J.A.F., Saad, S.M.I., 2009.Ice-cream
as a probiotic food carrier. Food Research International 42, 1233-1239.
de Lange, C.F.M., Pluske, J., Gong, J., Nyachoti, C.M., 2010. Strategic use of feed
ingredients and feed additives to stimulate gut health and development in young
pigs. Livestock Science 134, 124-134.
de Mattos, A.P., Ribeiro, T.C.M., Mendes, P.S.A., Valois, S.S., Mendes, C.M.C.,
Ribeiro, H.C., 2009. Comparison of yoghurt, soybean, casein and amino acid-
based diets in children with persistent diarrhea. Nutrition Research 29, 462-469.
Dinesen, L., Harbord, M., 2013. Acute diarrhea. Medicine 41(2), 104-107.
Diop, E.H.I., Dossou, N.I.D., Ndour, M.M., Briend, A.,Wade, S., 2003. Comparison of
the efficacy of a solid ready-to-use food and a liquid, milk-based diet for the
rehabilitation of severely malnourished children: a randomized trial. American
Journal of Clinical Nutrition 78, 302-307.
Page 47
35
Food and Agriculture Organization of the United Nations/World Health Organization
[Internet]. 2001 [Accessed 2014 Mar 12]. Available from:
ftp://ftp.fao.org/docrep/fao/009/a0512e/a0512e00.pdf.
Fortin, M., Champagne, C.P., St-Gelais, D., Britten, M., Fustier, P., Lacroix, M., 2011.
Viability of Bifidobacterium longum in cheddar cheese curd during manufacture
and storage: effect of microencapsulation and point of inoculation. Dairy Science
and Technology 91, 599-614.
Fuller R. 1989. Probiotics in man and animals. Journal of Applied Bacteriology 66, 365-
378.
Gerritsen, J., Smidt, H., Rijkers, G.T., de Vos, W.M., 2011. Intestinal microbiota in
human health and disease: the impact of probiotics. Genes and Nutrition 6, 209-
240.
Gismondo, M.R., Drago, L., Lombardi, A., 1999. Review of probiotics available to
modify gastrointestinal flora. International Journal of Antimicrobial Agents 12,
287-292.
Gomes, A.M.P., Malcata, F.X., 1999. Bifidobacterium spp. and Lactobacillus
acidophilus: biological, biochemical, technological and therapeutical properties
relevant for use as probiotics. Trends in Food Science and Technology 10, 139-
157.
Gorbach, S.L., 2002. Probiotics in the third millennium. Digestive and Liver Disease 34,
S2-S7.
Gorospe, E.C., Oxentenko, A.S., 2012. Nutritional consequences of chronic diarrhea.
Best Practice and Research Clinical Gastroenterology 26, 663-675.
Page 48
36
Granato, D., Branco, G.F., Nazzaro, F., Cruz, A.G., Faria, J.A.F., 2010. Functional foods
and non-dairy probiotic food development: trends, concepts and products.
Comprehensive Reviews in Food Science and Food Safety 9, 292-302.
Guarino, A., Lo Vecchio, A., Canani, R.B., 2012. Chronic diarrhea in children. Best
Practice and Research Clinical Gastroenterology 26, 649-661.
Heenan, C.N., Adams, M.C., Hosken, R.W., Fleet, G.H., 2004. Survival and sensory
acceptability of probiotic microorganisms in a nonfermented frozen vegetarian
dessert. LWT Food Science and Technology 37, 461-466.
Hekmat, S., McMahon, J., 1992. Survival of Lactobacillus acidophilus and
Bifidobacterium bifidum in ice cream for use as a probiotic food. Journal of Dairy
Science 75, 1415-1422.
Helland, M.H., Wicklund, T., Narvhus, J.A., 2004. Growth and metabolism of selected
strains of probiotic bacteria in milk and water-based cereal puddings.
International Dairy Journal 14, 957-965.
Hom, J., 2011. Do probiotics reduce the duration and symptoms of acute infectious
diarrhea? Annals of Emergency Medicine 58(5), 445-446.
Institute of Food Technologists (IFT) [Internet]. 2014 [Accessed 2014 March 12].
Available from: http://www.ift.org/knowledge-center/focus-areas/food-health-
and-nutrition/functional-foods.aspx.
Isolauri, E., 2001. Probiotics in human disease. American Journal of Clinical Nutrition
73, 1142S-1146S.
Isolauri, E., 2004. The role of probiotics in pediatrics. Current Paediatrics 14, 104-109.
Page 49
37
Jankovic, I., Sybesma, W., Phothirath, P., Ananta, E., Mercenier, A., 2010. Application
of probiotics in food products-challenges and new approaches. Current Opinion in
Biotechnology 21, 175-81.
Jost, T., Lacroix, C., Braegger, C.P., Chassard, C., 2012. New insights in gut microbiota
establishment in healthy breastfed neonates. Plos One 7(8), 1-9.
Kailasapathy, K., Chin, J., 2000. Survival and therapeutic potential of probiotic
organisms with reference to Lactobacillus acidophilus and Bifidobacterium spp.
Immunology and Cell Biology 78(1), 80-88.
Karimi, R., Mortazavian, A.M., Da Cruz, A.G., 2011. Viability of probiotic
microorganisms in cheese during production and storage: a review. Dairy Science
and Technology 91, 283-308.
Kelly, P., 2011. Infectious diarrhea. Medicine 39(4), 201-206.
Knorr, D., 1998. Technology aspects related to microorganisms in functional foods.
Trends in Food Science and Technology 9, 295-306.
Ksaimoğlu, A., Göncüoğlu, M., Akgün, S., 2004. Probiotic white cheese with
Lactobacillus acidophilus. International Dairy Journal 14, 1067-1073.
Liong, M, Easa, A.M., Lim, P, Kang, J., 2009. Survival, growth characteristics and
bioactive potential of Lactobacillus acidophilus in a soy-based cream cheese.
Journal of the Science of Food and Agriculture 89, 1382-1391.
MacFarland, L.V., 2009. Evidence-based review of probiotics for antibiotic-associated
diarrhea and Clostridium difficile infections. Anaerobe 15, 274-80.
Manary, M., Iannotti, L., Trehan, I., Weisz, A., 2012. Systematic review of the care of
children with diarrhea in the community-based management of severe acute
Page 50
38
malnutrition. [Internet] [Accessed 2014 Mar 13]. Available from:
http://www.who.int/nutrition/publications/guidelines/updates_management_SAM
_infantandchildren_review4.pdf.
Manary, M.J., 2006. Local production and provision of ready-to-use therapeutic food
(RUTF) spread for the treatment of severe childhood malnutrition. Food and
Nutrition Bulletin 27, S83-S89.
Marteau, P., 2001. Prebiotics and probiotics for gastrointestinal health. Clinical Nutrition
20(Supplement 1), 41-45.
Mattila-Sandholm, T., Myllärinen, P., Crittenden, R., Mogensen, G., Fondén, R., Saarela,
M., 2002. Technological challenges for future probiotic foods. International Dairy
Journal 12, 173-182.
Mohammadi, R., Mortazavian, A.M., Khosrokhavar, R., da Cruz, A.G., 2011. Probiotic
ice cream-viability of probiotic bacteria and sensory properties. Annals of
Microbiology 61, 411-424.
Monira, S., Nakamura, S., Gotoh, K., Izutsu, K., Watanabe H., Alam, N.H., Endtz, H.P.,
Cravioto, A., Ali, S.K., Nakaya, T., Horii, T., Lida, T., Alam, M., 2011. Gut
microbiota of healthy and malnourished children in Bangladesh. Frontiers in
Microbiology 2, 1-7.
Moore, S.R., Lima, N.L., Soares, A.M., Oriá, Pinkerton, R.C., Barrett, L.J., Guerrant,
R.L., Lima, A.A.M., 2010. Prolonged episodes of acute diarrhea reduce growth
and increases risk of persistent diarrhea in children. Gastroenterology, 139(4)
1156–1164.
Page 51
39
Ndekha, M.J., Manary, M.J., Ashorn, P., Briend, A., 2005. Home-based therapy with
ready-to-use therapeutic food is of benefit to malnourished, HIV-infected
Malawian children. Acta Paediatrica 94, 222-225.
Nebesny, E., Żyżelewicz, D., Motyl, I., Libudzisz, Z., 2007. Dark chocolates
supplemented with Lactobacillus strain. European Food Research and
Technology 225, 33-42.
Nieves, C., Langkamp-Henken, B., 2002. Arginine and immunity: a unique perspective.
Biomedicine and Pharmacotherapy 56, 471-482.
Nomoto, K., 2005. Prevention of infections by probiotics. Journal of Bioscience and
Bioengineering 100(6), 583-592.
Nousia, F.G., Androulakis, P.I., Fletouris, D.J., 2011. Survival of Lactobacillus
acidophilus LMGP-21381 in probiotic ice-cream and its influence on sensory
acceptability. International Journal of Dairy Technology 64(1), 130-136.
Oelschlaeger, T.A., 2010. Mechanisms of probiotic actions -A review. International
Journal of Medical Microbiology 300, 57-62.
Ouwehand, A.C., Kurvinen, T., Rissanen, P., 2004. Use of a probiotic Bifidobacterium in
a dry food matrix, an in vivo study. International Journal of Food Microbiology
95, 103-106.
Pelletier, D.L., Frongillo, E.A., Schroeder, D.G., Habicht, J.P., 1995. The effects of
malnutrition on child mortality in developing countries. Bulletin of The World
Health Organization 73 (4), 443-448.
Page 52
40
Pezzella, V., De Martino, L., Passariello, A., Cosenza, L., Terrin, G., Canani, R.B., 2013.
Investigation of chronic diarrhea in infancy. Early Human Development 89, 893-
897.
Phillips, M., Kailasapathy, K., Tran, L., 2006. Viability of commercial probiotic cultures
(L. acidophilus, Bifidobacterium sp., L. casei, L. paracasei and L. rhamnosus) in
cheddar cheese. International Journal of Food Microbiology 108, 276-280.
Podewils, L.J., Mintz, E.D., Nataro, J.P., Parashar, U.D., 2004. Acute infectious diarrhea
among children in developing countries. Seminars in Pediatric Infectious Diseases
15, 155-168.
Possemiers, S., Marzorati, M., Verstraete, W., Van de Wiele, T., 2010. Bacteria and
chocolate: A successful combination for probiotic delivery. International Journal
of Food Microbiology 141, 97-103.
Prado, F.C., Parada, J.L., Pandey, A., Soccol, C.R., 2008. Trends in non-dairy probiotic
beverages. Food Research International 41, 111-123.
Ranadheera, R.D.C.S., Baines, S.K., Adams, M.C., 2010. Importance of food in probiotic
efficacy. Food Research International 43,1-7.
Rathore, S., Salmerón, I., Pandiella, S.S., 2012. Production of potentially probiotic
beverages using single and mixed cereal substrates fermented with lactic acid
bacteria cultures. Food Microbiology 30, 239-244.
Reid, G., 2008. Probiotics and prebiotics- Progress and challenges. International Dairy
Journal 18, 969-975.
Rivera-Espinoza, Y., Gallardo-Navarro, Y., 2010. Non-diary probiotic products. Food
Microbiology 27, 1-11.
Page 53
41
Rodgers, S., 2008. Novel applications of live bacteria in food services; probiotics and
protective cultures. Trends in Food Science and Technology 19, 188-197.
Saavedra, J., 2000. Probiotics and infectious diarrhea. The American Journal of
Gastroenterology 95 (1), S16-18.
Salem, M.M.E., Fathi, F.A., Awad, R.A., 2005. Production of probiotic ice-cream. Polish
Journal of Food and Nutrition Sciences 14/55 (3), 267-271.
Sarkar, S., 2010. Approaches for enhancing the viability of probiotics: a review. British
Food Journal 112, 239-249.
Sazawal, S., Hiremath, G., Dhingra, U., Malik, P., Deb, S., Black, R.E., 2006. Efficacy of
probiotics in prevention of acute diarrhea: a meta-analysis of masked,
randomized, placebo-controlled trials. Lancet Infectious Diseases 6, 374-382.
Schiller, L.R., 2012. Definitions, pathophysiology, and evaluation of chronic diarrhea.
Best Practice and Research Clinical Gastroenterology 26, 551-562.
Sekirov, I., Russell, S.L., Antunes, L.C.M., Finlay, B.B., 2010. Gut microbiota in health
and disease. Physiological Reviews 90, 859-904.
Servin, A.L., 2004. Antagonistic activities of lactobacilli and bifidobacteria against
microbial pathogens. FEMS Microbiology Reviews 28, 405-440.
Shah, N.P., 2007. Functional cultures and health benefits. International Dairy Journal 17,
1262-1277.
Stiles, M.E., Holzapfel, W.H., 1997. Lactic acid bacteria of foods and their current
taxonomy. International Journal of Food Microbiology 36, 1-29.
Suh, J.S., Hahn, W.H., Cho, B.S. 2010. Recent advances of oral rehydration therapy
(ORT). Electrolyte Blood Pressure 8(2), 82–86.
Page 54
42
Sullivan, A., Nord, C.E., 2002. The place of probiotics in human intestinal infections.
International Journal of Antimicrobial Agents 20, 313-319.
Szajewska, H., Ruszczynski, M., Radzikowski, A., 2006. Probiotics in the prevention of
antibiotic-associated diarrhea in children: a meta-analysis of randomized
controlled trials. Journal of Pediatrics 149, 367-72.
Tapiero, H., Mathé, G., Couvreur, P., Tew, K.D., 2002. I. Arginine. Biomedicine and
Pharmacotherapy 56, 439-445.
Tharmaraj, N., Shah, N.P., 2004. Survival of Lactobacillus acidophilus, Lactobacillus
paracasei subsp. paracasei, Lactobacillus rhamnosus, Bifidobacterium animalis,
and Propionibacterium in cheese-based dips and the suitability of dips as
effective carriers of probiotic bacteria. International Dairy Journal 14, 1055-1066.
The United Nations Children's Emergency Fund (UNICEF)/World Health Organization
(WHO) [Internet]. 2009 [Accessed 2014 January 5]. Available from:
http://apps.who.int/iris/bitstream/10665/44174/1/9789241598415_eng.pdf.
The United Nations Millennium Development Goals [Internet]. 2013 [Accessed 2014
March 11]. Available from:
http://www.un.org/millenniumgoals/pdf/Goal_4_fs.pdf.
Tuohy, K.M., Probert, H.M., Smejkal, C.W., Gibson, G.R., 2003. Using probiotics and
prebiotics to improve gut health. Drug Discovery Today 8(15), 692-70.
Ubbink., J., Krüger, J., 2006. Physical approaches for the delivery of active ingredients in
foods. Trends in Food Science and Technology 17, 244-254.
Page 55
43
Viana, M.L., Santos, R.G.C., Generoso, S.V., Arantes, R.M.E., Correia, M.I.T.D.,
Cardoso, V.N., 2010. Pretreatment with arginine preserves intestinal barrier
integrity and reduces bacterial translocation in mice. Nutrition 26, 218-223.
Vinderola, C.G., Prosello, W., Ghiberto, D., Reinheimer, J.A., 2000. Viability of
probiotic (Bifidobacterium, Lactobacillus acidophilus and Lactobacillus casei)
and nonprobiotic microflora in argentinian fresco cheese. Journal of Dairy cience
83, 1905-1911.
Wang, W.W., Qiao, S.Y., Li, D.F., 2009. Amino acids and gut function. Amino Acids 37,
105-110.
Whyte, L.A., Jenkins, H.R., 2012. Pathophysiology of diarrhea. Pediatrics and Child
Health 22(10), 443-447.
World Health Organization (WHO) [Internet]. 2005 [Accessed 2013 December 9].
Available from: http://whqlibdoc.who.int/publications/2005/9241593180.pdf.
World Health Organization (WHO) [Internet]. 2011 [Accessed 2014 January 24].
Available from:
http://www.who.int/gho/publications/world_health_statistics/EN_WHS2011_Full.
pdf.
World Health Organization (WHO) [Internet]. 2013 [Accessed 2013 February 18].
Available from: http://www.who.int/mediacentre/factsheets/fs330/en/.
Zubillaga, M., Weill, R., Postaire, E., Goldman, C., Caro, R., Boccio, J., 2001. Effect of
probiotics and functional foods and their use in different diseases. Nutrition
Research 21, 569-579.
Page 56
44
Figure Legends
Fig. 2.1. Vicious cycle of malnutrition and chronic diarrhea (Adapted from Gorospe and
Oxentenko, 2012)
Fig. 2.2. Relationship between gastrointestinal infections and malnutrition (Adapted from
Gorospe and Oxentenko, 2012)
Page 57
45
Fig. 2.1
MALNUTRITION DIARRHEA
Poor mucosal
healing
Inflamed and
injured mucosa
Higher losses
in nutrient Lethargy and
poor appetite
Page 58
46
Fig. 2.2
MALNUTRITION
CHRONIC
DIARRHEA
GASTROINTESTINAL
INFECTIONS
General weakness
Catabolism
Mucosal damage
Inflammation
Catabolism
Nutrient
sequestration
Impaired immunity
Damaged
mucosal barrier
Page 59
47
CHAPTER 3
SURVIVAL OF LACTOBACILLUS RHAMNOSUS GG AS INFLUENCED BY
STORAGE CONDITIONS AND PRODUCT MATRIXES1
1 Klu, Y.A.K., J.H. Williams, R.D. Phillips and J. Chen. 2012. Journal of Food Science.
77(12):M659-M663
Reprinted here with permission of the publisher
Page 60
48
Abstract: Mortality resulting from diarrhea especially that occurs in children younger
than 5 years of age ranks 3rd among all deaths caused by infectious diseases worldwide.
Probiotics such as Lactobacillus rhamnosus GG are clinically shown to effectively
reduce the incidence of diarrhea in children. A food substrate is one of the major factors
regulating the colonization of microorganisms in human gastrointestinal tracts. Peanut
butter is a nutritious, low-moisture food that could be a carrier for probiotics. In this
study, we observed the influence of storage conditions and product matrixes on the
survival of L. rhamnosus GG. Cells of L. rhamnosus GG were inoculated into full fat or
reduced fat peanut butter at 107 CFU/g. Inoculated peanut butter was stored at 4, 25 or 37
°C for 48 wk. Samples were drawn periodically to determine the populations of L.
rhamnosus GG. Results showed that there was no significant decrease in the viable
counts of L. rhamnosus GG in products stored 4 °C. The survivability of L. rhamnosus
GG decreased with increasing storage temperature and time. Product matrixes did not
significantly affect the survival of L. rhamnosus GG except at 37 °C. Populations of L.
rhamnosus GG were preserved at > 6 logs in products stored at 4 °C for 48 wk and at 25
oC for 23-27 wk. At 37 oC, the 6 log level could not be maintained for even 6 wk. The
results suggest that peanut butter stored at 4 and 25 oC could serve as vehicles to deliver
probiotics.
Keywords: Survival, probiotics, Lactobacillus rhamnosus GG, peanut butter
Page 61
49
Introduction
The World Health Organization (WHO) statistics shows that globally
approximately 20% of all deaths are related to children younger than 5 years of age
(WHO 2011). Diarrheal diseases are a common contributing factor of childhood
mortality. The morbidity rate of diarrheal diseases in the developing world is 3.2 cases
per year per child. Approximately 1.7 – 2.5 million annual deaths occur due to diarrhea,
and most of these deaths occur in children under the age of 5.
Podewils and others (2004) stated that the causative agents of diarrhea in young
children include bacteria, viruses and parasites with bacteria and viruses being
responsible for majority of the cases. Therapeutic interventions for diarrheal diseases
include rehydration, dietary [including micro-nutrient supplementation (zinc)] and
pharmacological (antibiotic usage) remedies (Podewils and others 2004). Administration
of sub-therapeutic levels of antibiotics is currently one of the major preventive
interventions in developing countries, which unfortunately promotes the development of
antibiotic resistance among pathogens and induces antibiotic-associated diarrhea (AAD).
AAD is defined as otherwise unexplained diarrhea that occurs with the administration of
antibiotics, and its occurrence in the pediatric population is 11 – 40% between the
initiation of therapy and up to 2 months after cessation (Szajewska and others 2006).
Several clinical studies have shown that diarrheal incidence particularly in children
younger than 5 years of age can be controlled or reduced by the administration of
probiotics (McNaught and Macfie 2001; Sullivan and Nord 2002; Nomoto 2005;
Szajewska and others 2006; Sazawal and others 2006). Probiotics are live
Page 62
50
microorganisms which when administered in adequate amounts confer a health benefit on
the host (Karimi and others 2011).
Many health benefits have been proposed including immune modulation and
maintenance of gut integrity especially through the prevention and control of
gastrointestinal malfunctions and infections (Oelschlaeger 2010; Jankovic and others
2010). Lactobacillus rhamnosus GG can readily colonize the gastrointestinal tracts of
children (Galpin and others 2005), aid in the treatment of Clostridium difficile infections,
and prevents AAD (Gismondo and others 1999; MacFarland 2009). The bacterium has
been shown to reduce the duration of diarrhea by about 50% (Tuohy and others 2003).
McNaught and MacFie (2001) reported that in a study of 100 children admitted to a
hospital with acute diarrhea, the duration of the illness was 3 days in children receiving L.
rhamnosus GG compared with 6 days in the control group. A meta-analysis of masked
randomized, placebo-controlled trials conducted by Sazawal and others (2006) concluded
that consumption of L. rhamnosus GG as well as other probiotic strains reduced the
incidence of AAD by 52% and the risk of acute diarrhea among children by 57%. In
another meta-analysis of randomized controlled trials, Szajewska and others (2006)
confirmed that some probiotic strains including L. rhamnosus GG could reduce the risk
of AAD among children.
To provide health benefits related to probiotics, recommended minimum number
of cells in a food product varies with no set standards (Reid 2008; Karimi and others
2011). Some suggest a minimum level of 106 CFU per g/mL (Thamaraj and Shah 2004;
Helland and others 2004; Possemiers and others 2010), and others recommend a daily
consumption level of at least 108 – 109 CFU per 100 g/mL of products, equivalent to 106 –
Page 63
51
107 CFU per g/ml (Angelov and others 2005; Cruz and others 2009; Karimi and others
2011). Mostly recently, higher daily intake levels such as 108 – 1010 CFU have also been
recommended (Champagne and others 2011). Generally, the efficacy of probiotics is
enhanced when the cultures are ingested with a food product (Gardiner and others 1999;
Alegre and others 2011). The fat content, concentration and type of proteins, sugars and
product pH are some of the factors that could affect probiotic growth and survival in food
(Ranadheera and others 2009). It was stated that a food substrate is one of the major
factors in regulating colonization of microorganisms in human gastrointestinal tracts.
Poor nutrition is a predisposing factor to diarrhea morbidity and mortality in
children in the developing world; recovery from all kinds of ailments is promoted under
non-immune compromised, healthy body systems, and diarrhea in children is no
exception. Peanut butter is a relatively inexpensive, shelf stable, energy dense and highly
nutritious product, and a handful of peanut contains at least 17% of the daily requirement
of each indispensable amino acid. This study was undertaken to observe the survival
trends of L. rhamnosus GG in full fat and reduced fat peanut butter under refrigeration (4
°C), ambient (25 °C), and abusive (37 °C) storage conditions and to determine the
influence of food matrixes on the survival of L. rhamnosus GG.
Materials and Methods
Materials
A full fat peanut butter product and a reduced fat peanut butter product were
obtained from the American Blanching Company (Fitzgerald, Ga., U.S.A.). The full fat
peanut butter contains peanuts, sugar, hydrogenated vegetable oil (rapeseed, cottonseed
Page 64
52
and soybean), salt and molasses. The ingredients for the reduced fat peanut butter
include peanuts, partially defatted peanut flour, sugar, hydrogenated vegetable oil
(rapeseed and cottonseed), salt, molasses, monoglycerides, tocopherol, acetate and
pyridoxine HCl. Nutrition labels revealed that each 100 g of full fat product contains
21.31 g of protein, 26.31 g of carbohydrate, 10.57 g of sugar, 7.20 g of fiber, 431.61 mg
of sodium and 595.00 mg of potassium. Each 100 g of reduced fat product has 28.12 g of
protein, 27.51 g of carbohydrate, 11.67 g of sugar, 8.57 g of fiber, 479.04 mg of sodium
and 707.69 mg of potassium. Both products have a total solid content of about 99.00%.
L. rhamnosus GG [Culturelle® (Natural Health and Wellness; 30 capsules per package)]
was purchased from Amerifit, Inc. (Cromwell, Conn., U.S.A.). Each capsule is claimed
by the manufacturer to have 10 billion live cells and contains microcrystalline cellulose
and milk proteins as carriers. Polyethylene terephthalate (PET) jars (4 oz) and smooth
polypropylene (PP) lids with pressure sensitive liner were purchased from Container and
Packaging Supply (Eagle, Idaho, U.S.A.).
The fat content of peanut butter products
The fat contents of the two peanut butter products were analyzed using the
Goldfisch extraction method 948.22a (AOAC, 2000) and a Goldfisch Fat and Oil
Extractor (Labconco Co., Kansas City, Mo., U.S.A.). Briefly, 4 g samples were placed
into Oil Extraction Cellulose Thimbles (Fisher Scientific, Pittsburg, Pa., U.S.A.). The
samples in the thimbles were fixed on the Goldfisch Fat and Oil Extractor. A 50 mL
volume of petroleum ether (J. T. Baker, Phillipsburg, N.J., U.S.A.) was used to extract
the fat for about 24 h. Fat content of the samples was derived based on the following
calculation: % total fat = (weight of extracted fat × 100) / weight of dry sample.
Page 65
53
The water activity and pH of peanut butter products
The pH of peanut butter homogenate (25 g of peanut butter in 50 mL of water)
was estimated using a pH meter (model 8000; VWR International, Pa., U.S.A.). The
water activity of the peanut products was measured using the Pawkit Water Activity
Meter according to the manufacturer’s instructions (Decagon Devices, Wash., U.S.A.).
The inoculation level of Lactobacillus
The actual counts of L. rhamnosus GG in each capsule was determined by
averaging the cell populations in 5 individual capsules. A 0.1 g of the culture in each
capsule was mixed in 9.9 mL of 0.1% sterile peptone water which was pre-heated to 37
°C. After mixing, 1 mL aliquots of the sample was serially diluted in 9 mL of 0.1%
sterile peptone water, and 0.1 mL of last three dilutions were spread plated in duplicate
onto de Man, Rogosa and Sharpe (MRS) agar (Becton, Dickinson and Co., Sparks, Md.,
U.S.A. ) and Lactobacillus Selection (LBS) agar (Becton, Dickinson and Co.).
Inoculated plates were incubated under anaerobic condition for 72 h at 37 °C using the
BD GasPak™ EZ in a BBL GasPak® System (Becton, Dickinson and Co.). Cell colonies
were enumerated using the Leica Quebec Darkfield Colony Counter (Leica, Buffalo,
N.Y., U.S.A.). Average colony counts from LBS and MRS were reported since the two
media gave comparable results. From the enumeration results, the actual amount of L.
rhamnosus GG cells per capsule was calculated by multiplying the cell counts in 0.1 g of
capsule content with the average weight of the contents in 20 different capsules. This
information is important for verifying the manufacturer’s claims and determining the
amount of capsule content needed for peanut butter inoculation.
Page 66
54
Inoculation of peanut butter with L. rhamnosus GG
The PET jars and PP lids, commonly used packaging materials for commercial
peanut butter were sterilized under UV light for 15 min in a Level II Biosafety Cabinet
(NuAire Laboratory Equipment Supply, Plymouth, Minn., U.S.A.). The full fat and
reduced fat peanut butter described above were pre-heated in a Stabil-Therm Electric
Oven (Blue M Electric Co., Blue Island, Ill., U.S.A.) at 37 °C for 6 h to reduce product
viscosity and aid in uniform mixing. Precisely 2.5 kg of peanut butter was placed into a
KitchenAid® mixer, and a pre-determined amount of L. rhamnosus GG culture in the dry
form was inoculated into the product to achieve an inoculation level of 107 CFU/g. The
peanut butter and probiotic culture was mixed at room temperature for 15 min at 66 and
148 rpm for orbital and beater speeds, respectively. Nitrogen gas was incorporated into
the product during the mixing to remove oxygen that might cause excessive
rancidification of fats in the products during storage. Peanut butter exhibits thixotropic
behavior and thus after mixing, samples of the inoculated peanut butter (10 mL) were
easily dispensed into the PET jars using a sterile syringe (Becton, Dickinson and Co.)
which had its end altered to aid product flow. The headspace of the jars was flushed with
nitrogen for 30 s to remove oxygen, and the jars were then tightly closed with the PP lids.
The weights of peanut butter in each container (22.14 ± 1.75 g) were determined by
subtracting the average weight of 20 individual empty containers (23.90 g) from the
combined weights of the product and the container. Inoculated peanut butter was stored
at 4, 25 or 37 °C for 48 wk to mimic refrigeration, ambient and abusive storage condition,
respectively. Un-inoculated peanut butter was used as negative controls.
Page 67
55
Enumeration of Lactobacillus
The initial population of the Lactobacillus was determined immediately after the
inoculation. Subsequently, samples were drawn monthly from each storage condition for
enumeration during the 48 wk storage period. Previously unopened containers were used
at each sampling interval. Sterile 0.1% peptone water pre-warmed to 37 °C was added to
a sample in the container to achieve a 2-fold dilution based upon the weight of peanut
butter in each container. The samples were mixed by vigorous manual shaking for 1 min.
After mixing, 1 mL aliquot of the sample was serially diluted in 9 mL 0.1% sterile
peptone water. A 0.1 mL of appropriate dilutions was plated using the method described
above.
Statistical analysis
Two replicate experiments were conducted. Version 9.1 of SAS (SAS Inst. Inc.,
Cary, N.C., U.S.A.) was used for data analysis. A 3-way Analysis of Variance
(ANOVA) F-test was conducted, and the General Liner Model (GLM) procedure was
used to analyze L. rhamnosus GG counts as influenced by storage temperature, storage
time, food matrix and the interactions between them. The Fisher’s Least Significant
Difference (LSD) was employed to compare the significant differences between the
counts of L. rhamnosus GG in the two peanut products stored at three different
temperatures for an extended period of time. All analyses were conducted at a 95%
confidence level.
Page 68
56
Results and Discussion
Fat content, water activity and pH of full fat and reduced fat peanut butter
The average fat content of full fat peanut butter was 50.10 ± 1.16% and that of
reduced fat peanut butter was 39.90 ± 0.62%. The average water activity of both
products was 0.44 whiles the pH of the products ranged from 6.10 to 6.35. Product pH is
an important parameter that affects the survivability of probiotics (Nebesny and others
2007; Abe and others 2009; Nualkaekul and Charalampopoulos 2011). Champagne and
Gardner (2008) found that probiotics lose their viability during storage at pH 4.0-5.0.
Water activity is another important factor influencing the survival of probiotic cultures;
Abe and others (2009) observed that at four different storage temperatures, 25, 37, 45 and
60°C, the inactivation rate of Bifidobacterium increased proportionally in powdered food
products with increasing water activity. Low water activity reduced the extent of
viability loss of freeze dried Lactobacillus (Champagne and others 1996; Weinbreck and
others 2010). The near neutral pH and low water activity of peanut butter makes it a
promising vehicle for probiotic delivery.
Survival of L. rhamnosus GG
At all sampling points, the control samples had no background flora on MRS and
LBS agar (data not shown). The initial counts of L. rhamnosus GG in full fat and
reduced fat peanut butter ranged between 7.07 and 7.15 log CFU/g (data not shown).
Figure 3.1 shows the survival trends of L. rhamnosus GG in full fat and reduced fat
peanut butter during the 48 wk storage period under the three different storage conditions
used in the study. It was observed that by the end of the experimental period L.
Page 69
57
rhamnosus GG decreased less than 1 log CFU/g at 4°C in both full fat and reduced fat
peanut butter. At 25°C, the counts of L. rhamnosus GG decreased 3 to 4 log CFU/g
during the same time period. At 37 °C, the counts of L. rhamnosus GG in full fat peanut
buffer reached to an undetectable level (< 8 CFU/g) by wk 19. A different trend was
observed with the bacterium inoculated in reduced fat peanut butter, and the counts of L.
rhamnosus GG decreased to 3.35 log CFU/g at the same sampling point.
Results of statistical analysis showed that the type of peanut butter, storage
temperature, storage time (Table 3.1 and Table 3.2) and the interactions between them
(data not shown) significantly (P < 0.0001) affected the survival of L. rhamnosus GG.
Greater survival rates were observed at 4°C, followed by 25 °C and then 37 °C (Tables
3.2 and 3.3). Although the results of overall statistical analysis suggest that L. rhamnosus
GG had a better survivability in reduced fat peanut butter under all three storage
conditions (Table 3.3), significant population differences at individual sampling points
were only observed at 37 oC from wk 10 till the end of the storage period (Table 3.1).
The counts of L. rhamnosus GG in full fat and reduced fat products were not significantly
different when stored at 4 °C (Table 3.1) and at 25 °C except at the 27 and 40 wk
sampling points (Table 3.1).
Bruno and Shah (2003) stated that appropriate storage temperature was essential
to maintain viable populations of probiotic bacteria. Nebesny and others (2007) observed
that approximately 89 – 94% of Lactobacillus cells inoculated into dark chocolates
survived a 12 mo storage period at 4 °C. Saarela and others (2006) detected a better
survival rate of Bifidobacterium in milk and fruit juices stored at 4 °C compared to
products stored at 20 °C. Similar phenomenon was also observed by Bruno and Shah
Page 70
58
(2003). After 5 mo, Bifidobacterium stored at 20 °C could not be detected whiles the
counts of Bifidobacterium stored at 4 °C had declined from 10.61 to 6.02 log CFU/mL
over a 20 mo storage period. Results of this and some previous studies have shown that
storage of food at low temperature helps preserve the viability of probiotic cultures.
Relatively lower rate of probiotic survival at 25 oC is contributed to the increased
metabolic activity of the organisms compared to the activity at refrigeration temperature
(Bruno and Shah 2003). At 37 °C, loss of viability was highest, and this was consistent
with the findings of Ananta and others (2005) who observed more pronounced loss in
viability of sprayed-dried L. rhmanosus GG stored for 5 wk at 37 °C compared to
cultures stored at 25 °C.
The relatively lower survivability of L. rhamnosus GG in full fat peanut butter at
37 °C could also be attributed to the reactive oxygen species formed during lipid
oxidation. Although lipid oxidation could take place in both full fat and reduced
products, it is expected to occur at elevated rates in the full fat product due to its higher
fat content. During extended storage of peanut products, oxidation of peanut fat could
lead to the formation of primary and secondary oxidative compounds such as peroxyl,
alkoxyl radicals, aliphatic aldehydes, ketones, and alcohols (Wambura and Yang 2010;
Nepote and others 2006). These compounds could damage cell membranes, proteins and
nucleic acids, leading to the death of probiotic bacterial cells (Storz and Imlay 1999;
Dowds 1994; Storz and others 1990). Nepote and others (2006) studied lipid oxidation
that occurred in roasted peanuts at 15, 23 or 40 °C and found that greater lipid oxidation
occurred as storage temperature and storage time increased. Additionally, the protein,
carbohydrate, sugar, fiber and salt contents of reduced fat peanut butter were all slightly
Page 71
59
higher than those in full fat peanut butter. It is not clear whether these ingredients
impacted the survival of probiotic bacteria at 37 oC.
As stated previously, there is no recognized number of probiotic bacteria for
efficacy (Reid, 2008). There are instances where, to reach expected health benefits,
probiotics only need to be above 6 log CFU/g of a food product at the time of
consumption (Nebesny and others 2007; Liong and others 2009). In the present study,
this level was preserved in products stored at 4 °C for 48 wk, at 25 °C for 23 wk in full
fat peanut butter and for 27 wk in reduced fat peanut butter. At 37 °C, the 106 CFU/g
level could not be maintained in both products for even 6 wk.
Conclusions
The present study shows that the survival of L. rhamnosus GG was influenced by
storage temperature and storage time. Generally, the viability of L. rhamnosus GG
decreased in both product types with increasing storage temperature and storage time.
Higher survivability of L. rhamnosus GG was observed in reduced fat peanut butter as
compared to full fat peanut butter only at 37oC. Products stored at 4 oC for 48 wk and at
25 oC for 23 or 27 wk could maintain probiotic counts of at least 106 CFU/g. These
results suggest that peanut butters could be used to deliver probiotic organisms.
However, if one considers the recommendation of 109 CFU as the minimum daily intake,
a higher level of probiotic bacteria will have to be inoculated into peanut butter at the
initial stage of the project. This can be easily accomplished without significant
challenges. Results of the study also suggest that probitic peanut butter has the potential
to be used as one of the strategies to control diarrhea and malnutrition in developing
Page 72
60
countries. In developed countries where malnutrition is not such a problem, peanut
butter, which is rich in arterial dilating substances, can be used to offer health benefits to
aged populations and individual with cardiovascular diseases.
Acknowledgements
This research was partially supported by the Peanut Collaborative Research
Support Program. Sincere appreciation goes to Mr. Edward Parker of the American
Blanching Company and Jerry Davis of UGA.
References
Abe F, Miyauchi H, Uchijima A, Yaeshima T, Iwatsuki K. 2009. Effects of storage
temperature and water activity on the survival of Bifidobacterium in powder form.
Soc Dairy Technol 62(2):234-9.
Alegre I, Viñas I, Usall J, Anguera M, Abadias M. 2011. Microbiological and
physicochemical quality of fresh-cut apple enriched with the probiotic strain
Lactobacillus rhamnosus GG. Food Microbiol 28:59-66.
Ananta E, Volkert M, Knorr D. 2005. Cellular injuries and storage stability of spray-dried
Lactobacillus rhamnosus GG. Int Dairy J 15:399-409.
Angelov A, Gotcheva V, Hristozova T, Gargova S. 2005. Application of pure and mixed
probiotic lactic acid bacteria and yeast cultures for oat fermentation. J Sci Food
Agric 85:2134-41.
AOAC. 2000. Official Methods of Analysis. 17th Ed., AOAC International, Gaithersburg,
Md.
Page 73
61
Bruno FA, Shah NP. 2003. Viability of two freeze-dried strains of Bifidobacterium and of
commercial preparations at various temperatures during prolonged storage. J Food
Sci 68(7):2336-9.
Champagne CP, Mondou F, Raymond Y, Roy D. 1996. Effect of polymers and storage
temperature on the stability of freeze-dried lactic acid bacteria. Food Res Int 29(5-
6): 555-62.
Champagne CP, Gardner NJ. 2008. Effect of storage in a fruit drink on subsequent
survival of probiotic lactobacilli to gastro-intestinal stresses. Food Res Int 41:539-
43.
Champagne CP, Ross RP, Saarela M, Hansen KF, Charalampopoulos D. 2011.
Recommendations for the viability assessment of probiotics as concentrated
cultures and in food matrices. Int J Food Microbiol 149:185-93.
Cruz AG, Antunes AEC, Sousa ALOP, Faria JAF, Saas SMI. 2009. Ice-cream as a
probiotic food carrier. Food Res Int 42:1233-39.
Culturelle Probiotic® [Internet]. [Accessed 2010 August 10]. Available from
http://www.culturelle.com/about_culturelle/product_edh30.
Dowds BCA. 1994. The oxidative stress response in Bacillus subtilis. FEMS Microbiol
Lett 124:255:64.
Galpin P, Manary MJ, Fleming K, Ou C. Ashorn P, Shulman R. 2005. Effect of
Lactobacillus GG on intestinal integrity in Malawian children at risk of tropical
enteropathy. Am J Clin Nutr 82:1040-5.
Page 74
62
Gardiner G, Stanton C, Lynch PB, Collins JK, Fitzgerald G, Ross RP. 1999. Evaluation
of cheddar cheese as a food carrier for delivery of a probiotic strain to the
gastrointestinal tract. J Dairy Sci 82:1379-87.
Gismondo MR, Drago L, Lombardi A. 1999. Review of probiotics available to modify
intestinal flora. Int J Antimicrob Ag 12:287-92.
Helland MH, Wicklund T, Narvhus JA. 2004. Growth and metabolism of selected strains
of probiotic bacteria in milk- and water-based cereal puddings. Int Dairy J
14:957-65.
Jankovic I, Sybesma W, Phothirath P, Ananta E, Mercenier A. 2010. Application of
probiotics in food products-challenges and new approaches. Curr Opin Biotech
21:175-81.
Karimi R, Mortazavian AM, Da Cruz AG. 2011. Viability of probiotic microorganisms in
cheese during production and storage: a review. Dairy Sci Technol 91:283-308.
Liong M, Easa AM, Lim P, Kang J. 2009. Survival, growth characteristics and bioactive
potential of Lactobacillus acidophilus in a soy-based cream cheese. J Sci Food
Agric 89:1382-91.
MacFarland LV. 2009. Evidence-based review of probiotics for antibiotic-associated
diarrhea and Clostridium difficile infections. Anaerobe 15:274-80.
McNaught CE, MacFie J. 2001. Probiotics in clinical practice: a critical review of the
evidence. Nutr Res 21:343-53.
Nebsesny E, Żyżelewicz D, Motyl I, Libudzisz Z. 2007. Dark chocolates supplemented
with Lactobacillus strain. Eur Food Res Technol 225:33-42.
Page 75
63
Nepote V, Mestrallet MG, Ryan L, Conci S, Grosso NR. 2006. Sensorial and chemical
changes in honey roasted peanuts stored under different temperatures. J Sci Food
Agric 86:1057-63.
Nomoto K. 2005. Prevention of infections by probiotics. J Biosci Bioeng 100(6):583-92.
Nualkaekul S, Charalampopoulos D. 2011. Survival of Lactobacillus plantarum in model
solutions and fruit juices. Int J Food Microbiol 146:111-7.
Oelschlaeger TA. 2010. Mechanisms of probiotic actions -A review. Int J Medical
Microbiol 300:57-62.
Podewils LJ, Mintz ED, Nataro JP, Parashar UD. 2004. Acute infectious diarrhea among
children in developing countries. Sem Pediatr Infect Dis 15:155-68.
Possemiers S, Marzorati M, Verstraete W, Van de Wiele T. 2010. Bacteria and chocolate:
A successful combination for probiotic delivery. Int J Food Microbiol 141:97-
103.
Ranadheera RDCS, Baines SK, Adams MC. 2009. Importance of food in probiotic
efficacy. Food Res Int 43:1-7.
Reid G. 2008. Probiotics and prebiotics- Progress and challenges. Int Dairy J 18:969-75.
Saarela M, Virkajärvi I, Alakomi H-L, Sigvart-Mattila P, Mättö J. 2006. Stability and
functionality of freeze-dried probiotic Bifidobacterium cells during storage in
juice and milk. Int Dairy J 16:1477-82.
Sazawal S, Hiremath G, Dhingra U, Malik P, Deb S, Black RE. 2006. Efficacy of
probiotics in prevention of acute diarrhea: a meta-analysis of masked,
randomized, placebo-controlled trials. Lancet Infect Dis 6:374-82.
Page 76
64
Storz G, Tartaglia LA, Farr SB, Ames BN. 1990. Bacterial defenses against oxidative
stress. Trends Genet 6:363-8.
Storz G, Imlay JA. 1999. Oxidative stress. Curr Opin Microbiol 2:188-94.
Sullivan A, Nord CE. 2002. The place of probiotics in human intestinal infections. Int J
Antimicrob Ag 20:313-9.
Szajewska H, Ruszczyński M, Radzikowski A. 2006. Probiotics in the prevention of
antibiotic-associated diarrhea in children: a meta analysis of randomized
controlled trials. J Pediatr 149:367-72.
Tharmaraj N, Shah NP. 2004. Survival of Lactobacillus acidophilus, Lactobacillus
paracasei subsp. paracasei, Lactobacillus rhamnosus, Bifidobacterium animalis,
and Propionibacterium in cheese-based dips and the suitability of dips as
effective carriers of probiotic bacteria. Int Dairy J 14:1055-66.
Tuohy KM, Probert HM, Smejkal CW, Gibson GR. 2003. Using probiotics and prebiotics
to improve gut health. Drug Discov Today 8(15):692-70.
Wambura P, Yang WW. 2010. Ultrasonication and edible coating effects on lipid
oxidation of roasted peanuts. Food Bioprocess Technol 3:620-8.
Weinbreck F, Bodnár, Marco ML. 2010. Can encapsulation lengthen the shelf-life of
probiotic bacteria in dry products? Int J Food Microbiol 136:364-7.
World Health Organization (WHO) [Internet]. 2011 [Accessed 2012 January 5].
Available from:
http://www.who.int/gho/publications/world_health_statistics/EN_WHS2011_Full.
pdf.
Page 77
65
Table 3.1. Average Lactobacillus rhamnosus GG populations in full fat and reduced fat
peanut butter at each storage temperature
Cell population (log CFU/g)
Temperature
(°C)
Full Fat peanut
butter
Reduced fat peanut
butter
4 6.87aB 6.95aA
25 5.71bB 6.00bA
37 1.51cB 3.81cA
Average 4.70B 5.59A
Means in the same column not followed by the same lowercase letters are significantly different
(P < 0.05) in terms of storage temperature
Means in the same row not followed by the same uppercase letters are significantly different
(P < 0.05) in terms of peanut butter type)
Page 78
66
Table 3.2. Average Lactobacillus rhamnosus GG populations as affected by storage
temperature, storage time and product type (full fat or reduced fat peanut butter)
Variable Cell population (log CFU/g)
Temperature
4 °C 6.91a
25 °C 5.85b
37 °C 2.66c
Peanut butter type
Full fat 4.70b
Reduced fat 5.59a
Storage time (wk)
0 7.11a
2 6.88a
6 5.97b
10 5.28c
15 5.15cd
19 4.95def
23 5.01cde
27 4.84ef
31 4.72fg
35 4.45gh
40 4.36hi
44 3.97j
48 4.13ij
Means in the same column within the same category (storage temperature, storage time or
product type) not followed by the same letters are significantly different (P < 0.05)
Page 79
67
Figure Legend
Figure 3.1. Survival of Lactobacillus rhamnosus GG populations in full fat peanut butter
(FF) and reduced fat peanut butter (RF) stored at 4, 25 and 37 °C for 48 wk.
Page 80
68
-1.00
0.00
1.00
2.00
3.00
4.00
5.00
6.00
7.00
8.00
0 5 10 15 20 25 30 35 40 45 50
Ce
ll p
op
ula
tio
n (
log
CFU
/g)
Storage time (wk)
FF/4°C
RF/4°C
FF/25°C
RF/25°C
FF/37°C
RF/37°C
Figure 3.1. Klu et al.
Page 81
69
CHAPTER 4
SURVIVAL OF FOUR COMMERCIAL PROBIOTIC MIXTURES IN FULL FAT
AND REDUCED FAT PEANUT BUTTER
1 Klu, Y.A.K., R.D. Phillips and J. Chen. 2014. Accepted by Food Microbiology.
Reprinted here with permission of the publisher
Page 82
70
HIGHLIGHTS
Two evaluated probiotic mixtures survived better (P<0.05) than two other mixtures.
Increase in storage temperature and time adversely affected probiotic viability.
Fat content of peanut butter had no significant impacts on probiotic viability.
Bifidobacterium survived better than Lactobacillus and Streptococcus/Lactococcus.
Page 83
71
Abstract
A well-documented health benefit of probiotics is their ability to reduce the incidence of
diarrhea in young, malnourished children in the developing countries. This study was
undertaken to determine whether peanut butter, a nutritious, low-moisture food could be a
carrier for probiotics by observing the survivability of selected probiotic mixtures in
peanut butter under different storage conditions. Commercial probiotic mixtures (B, U,
N and S) comprising of multiple strains of Lactobacillus, Bifidobacterium, Streptococcus
and Lactococcus were inoculated into full fat or reduced fat peanut butter at 107 CFU/g.
Resulting products were stored at 4, 25 or 37 °C for 12 months. Populations of
Lactobacillus, Bifidobacterium and Streptococcus/Lactococcus were determined
periodically. The average viable cell counts of N and S were significantly lower than
those of B and U (p < 0.05). In all probiotic products stored at different temperatures,
Bifidobacterium had the greatest survivability, followed by Lactobacillus and
Streptococcus/Lactococcus. The probiotics used in the study had different surviving
patterns, and their survival was influenced by storage conditions. Fat content of peanut
butter had no significant impacts on probiotic viability. Results suggest that peanut butter
can be a vehicle to deliver probiotics for preventing diarrhea among malnourished
children.
Page 84
72
1. Introduction
Probiotics are live microorganisms which, when administered in adequate
amounts, confer a health benefit to the host (FAO/WHO, 2001). A well substantiated
health benefit of probiotics is the management of diarrhea (Boylston et al., 2004) which is
second to pneumonia as the highest cause of mortality in children under 5 years of age in
the developing countries (WHO, 2011). Numerous reports of clinical studies have
documented the effectiveness of probiotic consumption in the prevention, control and
treatment of diarrhea amongst children in this age group (Binns and Lee, 2010; Isolauri,
2004; Sazawal et al., 2006).
To achieve expected health benefits, the survivability of probiotic organisms is
essential since only viable cells at the time of consumption have therapeutic values.
Currently, the precise therapeutic level or dosage of probiotics for expected health
benefits has not been established (Reid, 2008). However, it has been proposed that the
viable numbers of probiotic cells at the time of consumption should be at least 106 - 107
CFU/g or mL of food product in order to reach the 108 – 109 CFU minimum daily intake
level through the consumption of 100 g or mL of a food product (Cruz et al., 2009;
Karimi et al., 2011; Rathore et al., 2012).
The survival and colonization of probiotics are regulated by food substrates with
which probiotics are consumed. Probiotic cultures have been recently incorporated into
cheese, ice-cream and butter as well as meat, cereal, fruit and vegetable based products
(Cruz et al., 2009; Rivera-Espinoza and Gallardo-Navarro, 2010; Ranadheera et al.,
2013). Compared to yoghurt which is the widely used vehicle for probiotic delivery,
cheese was found to be a more suitable carrier for probiotics due to its denser matrix,
Page 85
73
higher fat content and pH, and lower titratable acidity (Boylston et al., 2004; Karimi et
al., 2011).
Peanut butter is a shelf stable, low moisture, energy and nutrient dense product
and has been used as the major ingredient of Ready to Use Therapeutic Foods (RUTFs;
Diop et el., 2003; Manary, 2006; Ndekha et al., 2005) for treatment of severe childhood
malnutrition which could be the consequence of chronic diarrhea (Caulfield et. al, 2004).
In a previous study, we observed that at an inoculation level of 107 CFU/g of peanut
butter, a single probiotic strain, L. rhamnosus GG maintained a viability of 106 CFU/g for
48 wk at 4 oC and for 27 wk at 25 oC (Klu et al., 2012). The aims of this study were to
observe the survivability of four commercial probiotic mixtures, each containing 4 to16
different probiotic strains, and to examine the interaction of different probiotic strains in
full fat and reduced fat peanut butter at 4, 25 or 37 °C during a 12 month storage period.
The ultimate goal of the research is to use probiotic peanut butter or peanut based
probiotic RUTFs to control malnutrition and diarrhea concurrently.
2. Materials and methods
2.1. Materials
A full fat peanut butter product and a reduced fat peanut butter product were
graciously provided by the American Blanching Company (Fitzgerald, GA, USA).
Products were stored during the experiment in clear polyethylene terephthalate (PET) jars
(4 oz.) tightly covered with pressure-sensitive lined polypropylene (PP) lids (Container
and Packaging Supply, Eagle, ID, USA). The full fat peanut butter contains peanuts,
sugar, hydrogenated vegetable oil (rapeseed, cottonseed and soybean), salt and molasses.
Page 86
74
The ingredients for the reduced fat peanut butter include peanuts, partially defatted
peanut flour, sugar, hydrogenated vegetable oil (rapeseed and cottonseed), salt, molasses,
monoglycerides, tocopherol, acetate and pyridoxine HCl. Information from the
manufacturer indicates that the full fat peanut butter had a protein content of 21.31% and
reduced peanut butter 28.12%. The total carbohydrate content is 26.31% for full fat
peanut butter and 27.51% for reduced fat peanut butter. The sugar contents for full fat
and reduced fat peanut butter are 10.57% and 11.67%, respectively, and the amounts of
fiber are 7.20% and 8.57% for full fat peanut butter and reduced fat peanut butter,
respectively.
Four commercial probiotic mixtures, designated as B, U, N and S were used in the
study. Mixtures B and U had the same probiotic strains including Lactobacillus
acidophilus (CUL 60), L. acidophilus (CUL 21), Bifidobacterium bifidum (CUL 20) and
Bifidobacterium lactis (CUL 34). The only known difference between the two products
is that mixture B had a manufacturer’s claim of 25 billion CFU of viable cells per capsule
while U contained 50 billion CFU of viable cells per capsule. Mixture N had a
manufacturer’s claim of 16 billion live cells per g of powder and contained 16 different
bacterial strains including B. bifidum, Bifidobacterium breve, B. lactis, B. lactis Bif Relief
24-7™, Bifidobacterium longum, L. acidophilus, Lactobacillus brevis, Lactobacillus
bulgaricus, Lactobacillus casei, Lactobacillus gasseri, Lactobacillus paracasei,
Lactobacillus plantarum, Lactobacillus rhamnosus, Lactobacillus salivarius,
Lactococcus lactis and Streptococcus thermophilus. Mixture S had 15 billion viable cells
per capsule. According to the manufacturer, its constituents included L. acidophilus
(45%), L. rhamnosus (25%), S. thermophilus (10%), L. plantarum (7%), B. bifidum (6%),
Page 87
75
L. bulgaricus (3%), B. longum (3%) and L. salivarius (1%). The exact strain ratios of
product B, U and N are not available since they are considered proprietary information by
the manufacturers.
2.2. The fat content of peanut butter products
The fat contents of the two peanut butter products were analyzed using the AOAC
Goldfish extraction method with a Goldfish Fat and Oil Extractor (Labconco Co., Kansas
City, MO, USA); triplicate assays were performed. Briefly, 4 g samples were placed into
Oil Extraction Cellulose Thimbles (Fisher Scientific, Pittsburg, PA, USA) and were fixed
on the instrument. A 50 mL of petroleum ether (J. T. Baker, Phillipsburg, NJ, USA) was
used to extract the fat at the boiling temperature of petroleum ether (35 - 60 °C) for about
18 h. Fat content of the samples was derived based on the following calculation: % total
fat = (weight of extracted fat/weight of dry sample × 100).
2.3. The water activity and pH of peanut butter products
The pH of peanut butter homogenate (25 g of peanut butter in 50 mL of water)
was determined using a pH meter (model 8000; VWR International, PA, USA). The
water activity of the peanut products was measured using the Pawkit Water Activity
Meter according to the manufacturer’s instructions (Decagon Devices, WA, USA).
Triplicate measurements were performed.
Page 88
76
2.4. Hexanal analysis
Hexanal contents of peanut butter products were analyzed at the beginning as well
as the end of the 12 month storage period and at each sampling point, triplicate analysis
was conducted. A 3 g sample was placed into a 10 mL sample vial (Sigma-Aldrich, St.
Louis, MO, USA). Exactly 50 µL of a 30 ppm 4-Heptanone standard solution (Sigma-
Aldrich) was added to the sample, and the vial was closed with a PTFE/Silicone septum
(Sigma-Aldrich) sealed screw cap. Vials were heated on a heating block (Barnstead
Thermolyne, Dubuque, IA, USA) at 35 °C for 15 min. A 100 µm polydimethylsiloxane
stable-flex solid phase micro-extraction fiber assembly was exposed to the headspace of
the vial for 30 min, after which the needle in the fiber assembly was injected into a
Varian 3400 Gas Chromatograph with a flame ionization detector (Varian Analytical
Instruments, Walnut Creek, CA, USA). Desorption of hexanal occurred at 200 °C for 5
min, and Helium (20 cm/sec at 125 °C) was used as a carrier. The oven temperature was
initially maintained at 50 °C for 5 min and then increased to 200 °C at 10 °C increment
per min. The temperatures of the injector and detector were 200 °C and 300°C,
respectively.
2.5. Inoculation of peanut butter with probiotic mixtures
The jars and lids described previously were sterilized under UV light for 15 min
in a Level II Biosafety Cabinet (NuAire Laboratory Equipment Supply, Plymouth, MN,
USA). The peanut butter products were pre-heated in a Stabil-Therm Electric Oven
(Blue M Electric Co., Blue Island, IL, USA) at 37 °C for 6 h to reduce product viscosity
and aid in uniform mixing. Precisely 2.5 kg peanut butter was placed into a sterile
Page 89
77
KitchenAid® mixer, and a pre-determined amount of each probiotic mixture was
inoculated into the product to achieve an inoculation level of ca. 107 CFU/g. The peanut
butter and probiotic culture were mixed at room temperature for 15 min at 66 and 148
rpm for orbital and beater speeds, respectively. Nitrogen gas was incorporated into the
product during the mixing to remove oxygen that might cause excessive rancidification of
fats in the products during storage. Peanut butter exhibits thixotropic behavior and thus
after mixing, samples of the inoculated peanut butter (10 mL) were easily dispensed into
the jars using a sterile syringe (Becton, Dickinson and Co., Sparks, MA, USA) which had
its end altered to aid product flow. The headspace of the jars was flushed with nitrogen
for 30 s to remove oxygen, and the jars were then tightly closed with lids. Inoculated
peanut butter was stored at 4, 25 or 37 °C for 12 months to mimic refrigeration, ambient
and abusive condition, respectively. Un-inoculated peanut butter was used as negative
controls.
2.6. Enumeration of probiotic bacteria
The initial population levels of Lactobacillus, Bifidobacterium and
Streptoccoccus/Lactococcus species were confirmed immediately after the inoculation.
To ensure that the inoculated probiotic cells were evenly distributed, multiple samples of
peanut butter were taken from various locations of the mixer. Samples stored at each
temperature were drawn monthly during the 12 month storage period. Previously
unopened containers that had been brought to room temperature were used at each
sampling interval. Sterile 0.1% peptone water (Becton, Dickinson and Co.) warmed to
37 °C was added to samples in the containers to achieve a 2-fold dilution based upon the
Page 90
78
weight of peanut butter in each container. The samples were mixed by vigorous manual
to-and-fro shaking at an arm angle of about 45° for 1 min. After mixing, 1 mL aliquot of
the sample was serially diluted in 9 mL of 0.1% sterile peptone water. A 0.1 mL of
appropriate dilutions was plated, and inoculated plates were incubated and colonies
enumerated. All media used in the study were purchased from Becton, Dickson and Co.
Lactobacillus Selection (LBS) agar and de Man, Rogosa and Sharpe (MRS) agar were
used for the enumeration of Lactobacillus species. LBS agar supplemented with tomato
juice (Kroger, Cincinnati, OH, USA; 200 mL/L; LBST) which had been filtered with a
cheese cloth was used to enhance the growth of L. acidophilus. Both LBS and LBST
were prepared with the addition of 1.3 mL of glacial acetic acid (Fisher Scientific, Fair
Lawn, NJ, USA) per L of media. L. lactis and S. thermophilus were enumerated on M17
agar supplemented with 0.5% (final concentration) of lactose. Bifidobacterium species
were enumerated on modified Bifidobacterium agar which include 42.5 g Columbia agar
base, 2.5 g glucose, 0.01 riboflavin (Fisher Scientific), 2.5 g lactulose (EMD Chemicals
Inc. San Diego, CA, USA) and 0.5 g L-Cysteine HCl (Sigma-Aldrich) per liter of media.
The pH of the media was adjusted to 5.5 ± 0.2 by the addition of propionic acid (J.T.
Baker). Lactobacillus and Bifidobacterium species were incubated under anaerobic
condition for 72 h at 37 °C using the BD GasPak™ EZ in a BBL GasPak® System
(Becton, Dickinson and Co.). L. lactis and S. thermophilus were incubated at 30 °C and
37 °C, respectively under anaerobic condition for 48 h. Since LBS, MRS and LBST gave
comparable results, the average colony counts from the three media were used as the final
Lactobacillus counts. Enumeration results for Lactococcus lactis and Streptococcus
thermophilus was averaged. Counts of Lactobacillus, Bifidobacterium or
Page 91
79
Lactococcus/Streptococcus were either used separately for analysis on individual genera
in probiotic mixtures or added up for analysis on total populations within each probiotic
mixture.
2.7. Statistical analysis
Two replicate experiments were conducted for bacterial enumeration. Data were
analyzed using a 3-way Analysis of Variance F-test and the General Liner Model of
Statistical Analysis Software (SAS Inst. Inc., Cary, NC, USA). At a confidence level of
95%, Fisher’s Least Significant Difference Design was used to compare the significance
of differences among populations of probiotic mixtures (B, U, N and S) and individual
groups of probiotic bacteria (lactobacilli, bifidobacteria and streptococci/lactococci) in
different type of peanut butter products (full fat and reduced fat) and under various
storage conditions (time and temperature). The same statistical protocol was used to
determine the differences in the hexanal content of peanut butter products with respect to
probiotic mixtures, type of peanut butter and storage conditions.
3. Results and discussion
3.1. Physical and chemical properties of full fat and reduced fat peanut butter products
The water activity and pH of the two peanut butter products used in the present
study were comparable. The average water activity was 0.31 ± 0.03 and pH was 6.23 ±
0.12. According to the FDA, the water activity of a typical peanut butter or peanut
spread should be 0.35 or less (USFDA, 2009). The average fat content of full fat peanut
butter used in the present study was 50.10 ± 1.16% and that of reduced fat peanut butter
Page 92
80
was 39.90 ± 0.62%, and these values were consistent with FDA standards (USFDA,
2012).
Results of hexanal analysis showed that there was no statistically significance
difference between the hexanal contents in samples stored at 4 °C and 25 °C (p > 0.05).
However, a significantly higher hexanal content was detected in samples stored at 37 °C
(Table 4.1). Although the hexanal content in full fat vs. reduced fat peanut butter stored
at this temperature varied 11.12 ppm, the difference was statistically insignificant (p >
0.05; Table 4.1). Total hexanal content was significantly higher in samples inoculated
with probiotic mixtures N and S than those inoculated with mixture B (p < 0.05; Table
4.1). The mean hexanal content in samples inoculated with mixture U was not
significantly different from those inoculated with the other three probiotic mixtures
(Table 4.1). The mean hexanal content of all samples tested in the present study
increased from 2.15 ppm at the beginning of the experiment to 71.27 ppm after the 12
month storage period (Table 4.1).
Hexanal is a sensitive and reliable indicator of fatty acid oxidation that occurs
during product storage, and the amount of hexanal formed in a product has a direct
correlation with its storage temperature (Holse et al., 2012; Panseri et al., 2011). In
peanuts, hexanal is formed mostly from the oxidation of linoleic acid (Wambura and
Weihua, 2010). The present study detected more hexanal in peanut butter products stored
at 37 oC than at 25 and 4 oC (Table 4.1). Similar to what was observed in the present
study, Nepote et al. (2006) reported that during storage, higher levels of lipid oxidation
products were formed in dry roasted and honey roasted peanuts at 40 oC compared to -15
and 23 oC. Hexanal and other products of lipid oxidation could damage cellular protein
Page 93
81
and nucleic acid as well as cell membrane, thereby impacting the viability of probiotic
cells (Dowds 1994; Storz and Imlay 1999). In the present study, however, a higher
hexanal content of peanut butter product did not always co-relate to lower probiotic cell
viability (Table 4.1).
3.2. Influence of storage conditions on the populations of different probiotic mixtures
Statistical analysis revealed that storage temperature and storage time had a
significant influence on the populations of the four probiotic mixtures during storage (p <
0.05; Table 4.1). The average cell counts of the four probiotic mixtures decreased with
increasing storage temperature (Table 4.1). By the end of the 12 month storage period,
the average counts of the four probiotic mixtures in the two peanut butter products stored
at the three temperatures had a 2.65 log CFU/g decrease (Table 4.1). Although the mean
probiotic bacterial count of the four probiotic mixtures in reduced fat peanut butter was
significantly higher than the count in full fat peanut butter (p < 0.05; Table 4.1), the
difference between the two counts was only 0.14 log CFU/g. No background lactic acid
bacteria were found in the negative controls at all storage conditions.
The graphs in Fig. 4.1 show the survival trends of the probiotic mixtures in peanut
butter products stored at different temperatures. At 4 oC, all four probiotic mixtures
maintained their viabilities with the exception of mixture S whose counts decreased
approximately 1 log CFU/g in both full fat and reduced fat peanut butter by the end of the
12 month storage period. Probiotic bacterial populations in samples stored at 25 oC
decreased approximately 1 - 3 log CFU/g at the end of 12 month storage period. The
counts of the probiotic mixtures were relatively lower in samples stored at 37 oC at the
Page 94
82
same sampling point; largely between 2.50 – 3.75 log CFU/g except for mixtures N and
S. Cell counts of mixture N in full fat peanut butter fell below the detectable limit (< 8
CFU/g) at the end of 11 months, and those of mixture S dropped from the initial 7 log
CFU/g to approximately 1 log CFU/g in full fat peanut butter at the end of the 12 month
storage period.
Previous literatures have documented a reverse relationship between storage
temperature and probiotic viability. Wang et al. (2004) observed that the viabilities of S.
thermophilus and B. longum decreased with increase in storage temperature in dried
fermented soymilk stored at 4 °C and 25 °C. Higher populations of viable probiotic cells
were observed in products held at 4°C (68.8%) compared to 25 °C (60.8%) after a 4
month storage period. Furthermore, Champagne et al. (1996) observed significant
differences in probiotic survival rate at -20, 4 and 20 °C; and as storage temperature
increased, mortality of probiotic cultures also increased during storage especially at 20
°C. Abe et al. (2009) documented a decrease in the survivability of Bifidobacterium with
increasing storage temperature from 5, 25, 37, 45 to 60 °C. In a previous study in our
laboratory, viability of L. rhamnosus GG in full fat and reduced fat peanut butter
decreased as temperature increased from 4 °C to 25°C and 37 °C (Klu et al., 2012). It is
believed that a high storage temperature results in an increases in metabolic and cellular
activities which leads to the exhaustion of nutrients stored within probiotic cells and
eventually cell death (Bruno and Shah, 2003).
The average counts of mixture U were higher than the counts of the other three
probiotic mixtures in both peanut butter products (p < 0.05; Table 4.2). The average
count of mixture B was significantly higher than the counts of mixtures N and S in full
Page 95
83
fat peanut butter. However, the average counts of mixtures N and S in full fat peanut
butter were not significantly different as were the counts of mixtures B, N and S in
reduced fat peanut butter (p > 0.05; Table 4.2). Food component such as fat is expected
to protect probiotic cells during storage (Karimi et al., 2011; Possemiers et al., 2010).
However, this phenomenon was not clearly observed in the present study (Table 4.2)
which is consistent with the findings of Tharmaraj and Shah (2004) who reported that the
addition of oil to cheese-based dips did not offer any additional protective effect for
probiotics.
Previous studies have shown that L. acidophilus and Bifidobacterium species are
the normal inhabitants of human gastrointestinal tracts (Shah, 2007; Champagne et al.,
2005). They are widely used as probiotics in food because of their health benefits (Shah,
2007; Gueimonde et al., 2004) and tolerance to acid and bile (Gomes and Malcata, 1999).
However, since all four probiotic products used in this study contained Bifidobacterium
and L. acidophilus, the greater survival rates of U and B must have been attributed by
other factors. It is suggested that the survival rate of a particular probiotic depends on the
co-existence of other probiotic bacteria in a same mixture. Tharmaraj and Shah (2004)
reported that L. acidophilus survived better, in cheese based dips, in combination with
Bifidobacterium animalis and L. paracasei than with B. animalis, P. shernanii and L.
paracasei. B. animalis had a better survivability when in combination with L.
acidophilus, L. paracasei and P. shernanii than when combined with a L. acidophilus and
L. paracasei. Additionally, the authors observed a mutual antagonistic effect of B.
animalis on L. rhamnosus and L. paracasei. In the present study, products N and S had
16 and 8 different probiotic bacteria, respectively. It is not clear whether the co-existence
Page 96
84
of different bacterial strains in the probiotic mixture had an effect on their viabilities
during storage.
3.3. Survival of lactobacilli, bifidobacteria and streptococci/lactococci
As shown in Table 4.3, the average counts of bifidobacteria were significantly
higher than the counts of lactobacilli in mixtures U, B and N (p < 0.05). In mixture S
however, the two populations were similar (p > 0.05). The average populations of
streptococci/lactococci were significantly lower than those of bifidobacteria and
lactobacilli in mixtures N and S (p < 0.05). It should be kept in mind that although the
total probiotic inoculation level was kept at 107 CFU/g, the initial counts of
Bifidobacterium, Lactobacillus and Streptococcus/Lactococcus were not exactly the
same.
Fig. 4.2 shows the ratios of bifidobacteria or lactobacilli to total probiotic
population (sum of the counts of all present probiotic strains) in probiotic mixtures B and
U in full fat and reduced fat peanut butter under different storage conditions. After 1
month storage at different conditions, Bifidobacterium species accounted for 25-32% of
the total probiotic population in mixture B in full fat peanut butter (Fig. 4.2A) and 22-
29% of the total probiotic population in reduced fat peanut butter (Fig. 4.2B). At the
same time interval, the species accounted for 10% of the total probiotic population in
mixture U in full fat peanut butter (Fig. 4.2C) and 45% in reduced fat peanut butter (Fig.
4.2D). At the 6 month sampling point the proportion of Bifidobacterium species in
mixture B ranged from 50-74% in full fat peanut butter (Fig. 4.2A) and 48-75% in
reduced peanut butter (Fig. 4.2B), while in mixture U, Bifidobacterium species comprised
Page 97
85
47-74% of total probiotic bacterial populations in full fat peanut butter (Fig. 4.2C) and
48-78% of the probiotic population in reduced fat peanut butter (Fig. 4.2D). At the 12
month sampling point, Bifidobacterium proportions increased in mixture B stored at 4
and 25 oC compared with the results collected at the end of 6 month of the storage (Figs.
4.2A and 4.2B). In samples stored at 37 oC, however the proportions of Bifidobacterium
either remained steady or slightly decreased. Bifidobacterium proportions in mixture U
remained mostly steady at 25 oC between the 6 and 12 month sampling points (Figs. 4.2C
and 4.2D). However, the proportions in reduced fat peanut butter slightly increased at 4
oC and decreased at 37 oC (Fig. 4.2D) while in full fat peanut butter the proportions
increased slightly at both storage temperatures (Fig. 4.2C). After the 12 month storage
period, the overall proportions of Bifidobacterium from all storage temperatures had
increased from the initial 25-32% to 57 –76% in mixture B. In mixture U, the increment
was from the initial 10-45% to the final 51-80%.
These results suggest that Bifidobacterium strains in mixtures U and B were more
persistent than Lactobacillus in peanut butter products. Similar observations have been
made in earlier studies. Heenan et al. (2004) studied the survival of probiotics in a frozen
vegetarian dessert (pH 7). At the end of a 25 wk storage at -20 °C, the two B. lactis
strains had a higher percentage of survival (88.0 and 84.7% respectively) than did the L.
acidophilus and L. paracasei strains (59.4 and 44.6% respectively) used in the study. In
another study, L. acidophilus La-5 and B. lactis Bb-12 were incorporated into ice cream
(pH 6.51) either separately or as a mixture and the resulting products were stored for 60 d
at -25 °C (Magariños et al., 2007). When the probiotic bacteria were incorporated
separately, L. acidophilus had a survival rate of 87% and B. lactis, 90%. When the two
Page 98
86
bacteria were added to the ice cream as a mixture, L. acidophilus and B. lactis had 82 and
92% survivability, respectively after the 60 d of storage. Hekmat and McMahon (1992)
inoculated B. bifidum and L. acidophilus into a fermented ice cream mix (pH of 4.7). It
was observed that, after a 17 wk storage period at -29 °C, L. acidophilus had reduced to 3
× 106 CFU/mL whiles B. bifidum to 1 × 10⁷ CFU/mL from the initial number of 5 × 10⁸
CFU/mL for both probiotic bacteria.
As described previously, probiotic mixture N and S contained not only
Lactobacillus and Bifidobacterium but also Streptococcus/Lactococcus. Interactions
among the members of each mixture in peanut butter products were complicated and no
clear and consistent trend was observed.
4. Conclusions
Storage conditions played a key role in maintaining the viability of probiotic
cultures, and cell survival rate decreased with increasing storage temperature and time.
Overall, probiotic mixture U has the greatest survival rate followed by B, N and S.
Bifidobacterium species had the highest survivability followed by Lactobacillus species
and then Streptococcus/Lactococcus. Peanut butter is a suitable food matrix to deliver
probiotics, and the fat content of peanut butter did not significantly influence the
survivability of the probiotic mixtures included in the present study.
Page 99
87
Acknowledgements
This research was partially supported by the Peanut Collaborative Research
Support Program. Sincere appreciation goes to Mr. Edward Parker of the American
Blanching Company and Jerry Davis of the University of Georgia.
References
Abe, F., Miyauchi, H., Uchijima, A., Yaeshima, T., Iwatsuki, K., 2009. Effects of storage
temperature and water activity on the survival of Bifidobacterium in powder form.
International Journal of Dairy Technology 62, 234-239.
Binns, C., Lee, M.K., 2010. The use of probiotics to prevent diarrhea in young children
attending child care centers: a review. Journal of Experimental and Clinical
Medicine 2, 269-273.
Boylston, T.D., Vinderola, C.G., Ghoddusi, H.B., Reinheimer, J.A., 2004. Incorporation
of bifidobacterium into cheeses: challenges and rewards. International Dairy
Journal 14, 375-387.
Bruno, F.A., Shah, N.P., 2003. Viability of two freeze-dried strains of Bifidobacterium
and of commercial preparations at various temperatures during prolonged storage.
Journal of Food Science 68, 2336-2339.
Caulfield, L.E., de Onis, M., Blössner, M., Black, R.E., 2004. Undernutrition as an
underlying cause of child deaths associated with diarrhea, pneumonia, malaria,
and measles. The American Journal of Clinical Nutrition 80, 193-198.
Page 100
88
Champagne, C.P., Mondou, F., Raymond, Y., Roy, D., 1996. Effect of polymers and
storage temperature on the stability of freeze-dried lactic acid bacteria. Food
Research International 29, 555-562.
Champagne, C.P., Gardner, N.J., Roy, D., 2005. Challenges in the addition of probiotic
cultures to foods. Critical Review in Food Science and Nutrition 45, 61-84.
Cruz, A.G., Antunes, A.E.C., Sousa, A.L.O.P., Faria, J.A.F., Saad, S.M.I., 2009. Ice-
cream as a probiotic food carrier. Food Research International 42, 1233-1239.
Diop, E.H.I., Dossou, N.I.D., Ndour, M.M., Briend, A., Wade, S., 2003. Comparison of
the efficacy of a solid ready-to-use food and a liquid, milk-based diet for the
rehabilitation of severely malnourished children: a randomized trial. American
Journal of Clinical Nutrition 78, 302-307.
Dowds, B.C.A., 1994. The oxidative stress response in Bacillus subtilis. FEMS
Microbiology Letters 124, 255-264.
Food and Agriculture Organization of the United Nations/World Health Organization
[Internet]. 2001 [Accessed 2013 July 12]. Available from:
http://www.who.int/foodsafety/publications/fs_management/en/probiotics.pdf.
Gomes, A.M.P, Malcata, F.X., 1999. Trends in Food Science and Technology 10, 139-
157.
Gueimonde, M., Delgado, S., Mayo, B., Ruas-Madiedo, P., Margolles, A., de los Reyes-
Gavilán, C.G., 2004. Food Research International 37, 839-850.
Heenan, C.N., Adams, M.C., Hosken, R.W., Fleet, G.H., 2004. Survival and sensory
acceptability of probiotic microorganisms in a nonfermented frozen vegetarian
dessert. LWT Food Science and Technology 37, 461-466.
Page 101
89
Hekmat, S., McMahon, J., 1992. Survival of Lactobacillus acidophilus and
Bifidobacterium bifidum in ice cream for use as a probiotic food. Journal of Dairy
Science 75, 1415-1422.
Holse, M., Skov, T., Hansen, A., 2102. Oxidative storage stability of roasted marama
beans (Tylosema esculentum). Food Research International 47, 385-391.
Isolauri, E., 2004. The role of probiotics in pediatrics. Current Paediatrics 14, 104-109.
Karimi, R., Mortazavian, A.M., Da Cruz, A.G., 2011. Viability of probiotic
microorganisms in cheese during production and storage: a review. Dairy Science
and Technology 91, 283-308.
Klu, Y.A.K., Williams, J.H., Phillips, R.D., Chen, J., 2012. Survival of Lactobacillus
rhamnosus GG as influenced by storage conditions and product matrixes. Journal
of Food Science 77 (12), 659-663.
Magariños, H., Selaive, S., Costa, M., Flores, M., Pizzaro, O., 2007. Viability of
probiotic microorganisms (Lactobacillus acidophilus La-5 and Bifidobacterium
animalis subsp. lactis Bb-12) in ice cream. Society of Dairy Technology 60 (2),
128-134.
Manary, M.J., 2006. Local production and provision of ready-to-use therapeutic food
(RUTF) spread for the treatment of severe childhood malnutrition. Food and
Nutrition Bulletin 27, S83-S89.
Ndekha, M.J., Manary, M.J., Ashorn, P., Briend, A., 2005. Home-based therapy with
ready-to-use therapeutic food is of benefit to malnourished, HIV-infected
Malawian children. Acta Paediatrica 94, 222-225.
Page 102
90
Nepote, V., Mestrallet, M.G., Ryan, L., Conci, S., Grosso, N.R., 2006. Sensorial and
chemical changes in honey roasted peanuts and roasted peanuts stored under
different temperatures. Journal of the Science of Food and Agriculture 86, 1057-
1063.
Panseri, S., Soncin, S., Chiesa, L.M., Biondi, P.A., 2011. A headspace solid-phase
microextraction gas-chromatographic mass-spectrometric method (HS-SPME-
GC/MS) to quantify hexanal in butter during storage as a marker of lipid
oxidation. Food Chemistry 127, 886-889.
Ranadheera, C.S., Evans, C. A., Adams, M.C., Baines, S.K., 2013. Production of
probiotic ice cream from goat's milk and effect of packaging materials on product
quality. Small Ruminant Research 112, 174-180.
Possemiers, S., Marzorati, M., Verstraete, W., Van de Wiele, T., 2010. Bacteria and
chocolate: A successful combination for probiotic delivery. International Journal
of Food Microbiology 141, 97-103.
Rathore, S., Salmerón, I., Pandiella, S.S., 2012. Production of potentially probiotic
beverages using single and mixed cereal substrates fermented with lactic acid
bacteria cultures. Food Microbiology 30, 239-244.
Reid, G., 2008. Probiotics and prebiotics- Progress and challenges. International Dairy
Journal 18, 969-975.
Rivera-Espinoza, Y., Gallardo-Navarro, Y., 2010. Non-diary probiotic products. Food
Microbiology 27, 1-11.
Sarkar, S., 2010. Approaches for enhancing the viability of probiotics: a review. British
Food Journal 112, 239-349.
Page 103
91
Sazawal, S., Hiremath, G., Dhingra, U., Malik, P., Deb, S., Black, R.E., 2006. Efficacy of
probiotics in prevention of acute diarrhea: a meta-analysis of masked,
randomized, placebo-controlled trials. Lancet Infectious Diseases 6, 374-382.
Shah, N.P., 2007. Functional cultures and health benefits. International Dairy Journal 17,
1262-1277.
Storz, G., Imlay, J.A., 1999. Oxidative stress. Current Opinion in Microbiology 2, 188-
194.
Tharmaraj, N., Shah, N.P., 2004. Survival of Lactobacillus acidophilus, Lactobacillus
paracasei subsp. paracasei, Lactobacillus rhamnosus, Bifidobacterium animalis,
and Propionibacterium in cheese-based dips and the suitability of dips as
effective carriers of probiotic bacteria. International Dairy Journal 14, 1055-1066.
United States Food and Drug and Administration (USFDA) [Internet]. 2009 [Accessed
2012 May 11]. Available from:
http://www.fda.gov/Food/GuidanceComplianceRegulatoryInformation/Guidance
Documents/ProduceandPlanProducts/ucm115386.htm.
United States Food and Drug and Administration (USFDA) [Internet]. 2012 [Accessed 2
012 July 10]. Available from:
http://www.fda.gov/Food/LabelingNutrition/LabelClaims/QualifiedHealthClaims/
ucm073992.htm#nuts.
Wambura, P., Yang, W.W., 2010. Ultrasonication and edible coating effects on lipid
oxidation of roasted peanuts. Food and Bioprocess Technology 3, 620-628.
Page 104
92
Wang, Y.C., Yu, R.C., Chou, C.C., 2004. Viability of lactic acid bacteria and
bifidobacterium in fermented soymilk after drying, subsequent rehydration and
storage. International Journal of Food Microbiology 93, 209-217.
World Health Organization (WHO) [Internet]. 2011 [Accessed 2012 January 5].
Available from:
http://www.who.int/gho/publications/world_health_statistics/EN_WHS2011_Full.
pdf.
Page 105
93
Table 4.1.
Results of statistical analysis - Average probiotic bacteria populations and hexanal contents in
samples inoculated with B, U, N or S as affected by storage temperature, peanut butter type, and
storage time during a 12 month storage period at 4, 25 and 37 oC.
Means in the same column not followed by the same letter are significantly different (P < 0.05).
ND: Not determined
-*: Below detectable level (< 8 CFU/g)
Variable Cell population (log CFU/g) Hexanal (ppm)
Temperature (oC)
4 7.05a 4.71b
25 6.24b 6.43b
37 4.54c 189.83a
Peanut butter type
Full fat peanut butter 5.87b 68.88a
Reduced fat peanut butter 6.01a 65.10a
Probiotic mixtures
B 5.99b 23.55b
U 6.75a 78.90ab
N 5.55c 97.63a
S 5.48c 85.00a
Control - * 49.87ab
Storage time (mo)
0 7.33a 2.15b
1 6.94b ND
2 6.58c ND
3 6.34d ND
4 6.16e ND
5 6.10ef ND
6 5.97fg ND
7 5.82g ND
8 5.59h ND
9 5.50h ND
10 5.22i ND
11 5.01j ND
12 4.68k 66.99a
Page 106
94
Table 4.2.
Results of statistical analysis - Average probiotic populations of B, U, N and S as affected by
peanut butter type during a 12 month storage period at all three storage temperatures (4, 25 and
37 °C).
Cell population (log CFU/g)
Probiotic
Mixture
Full fat peanut
butter
Reduced fat peanut
butter
B 5.99bA 5.98bA
U 6.71aA 6.79aA
N 5.47cA 5.62bA
S 5.30cA 5.66bA
Means in the same column not followed by the same lowercase letters are significantly different (P < 0.05)
in terms of probiotic mixture.
Means in the same row not followed by the same uppercase letters are significantly different (P < 0.05) in
terms of type of peanut butter.
Page 107
95
Table 4.3.
Results of statistical analysis - Average cell populations of different probiotic species in each
probiotic mixture during a 12 month storage period at all three storage temperatures (4, 25 and
37°C).
Means in the same column not followed by the same lowercase letters are significantly different (P < 0.05)
in terms of probiotic mixture.
Means in the same row not followed by the same uppercase letters are significantly different (P < 0.05) in
terms of type of bacteria.
Cell population (log CFU/g)
B U N S
Bacteria type
Lactobacillus 5.82bB 6.62bA 5.40bC 5.53aC
Bifidobacterium 6.10aB 6.81aA 5.61aC 5.66aC
Streptococcus +
Lactococcus
4.86cA 4.83bA
Page 108
96
Fig. legends
Fig. 4.1.- Survival of probiotic bacteria in mixtures B, U, N and S in full fat peanut
butter (FF) or reduced fat peanut butter (RF) at 4 °C (A), 25 °C (B), and 37 °C (C)
Fig. 4.2.- Ratios of probiotic species, Lactobacillus (Lacto) or Bifidobacterium (Bifi) to
total probiotic population in mixture B in in full fat peanut butter (A) and reduced fat
peanut butter (B) and in mixture U in full fat peanut butter (C) and reduced fat peanut
butter (D) during a 12 month storage period at 4, 25 or 37 °C
Page 109
97
Figure 4.1 Klu et al.
A
B
C
Page 110
98
Figure 4.2 Klu et al.
A
B
C
D
Page 111
99
CHAPTER 5
EFFECT OF PEANUT BUTTER MATRICES ON THE FATE OF PROBIOTICS
DURING SIMULATED GASTROINTESTINAL PASSAGE
1 Klu, Y.A.K., R.D. Phillips and J. Chen. 2014. To be submitted to International Journal
of Food Microbiology
Page 112
100
Abstract
Diarrheal diseases are very common in pre-school children especially
malnourished ones in developing countries. Studies have found that probiotics are
effective in controlling diarrhea in these children and peanut butter is a suitable matrix for
preserving the viability of some probiotics under different storage conditions. This study
was undertaken to observe the ability of peanut butter in enhancing the viability of
selected probiotic bacteria during a simulated gastrointestinal passage. Full-fat and
reduced-fat peanut butter were inoculated with lyophilized commercial probiotic product
U (4-strain mixture), N (16-strain mixture) or C (single-strain culture) at ca. 107 CFU/g.
Inoculated peanut butter products were homogenized in 0.5% NaCl solution, and a same
population of lyophilized probiotics suspended in 0.5% NaCl solution served as a control.
To mimic digestion in the stomach, the pH (ca. 6) of the samples was reduced to 1.6 and
pepsin and lipase were added. Samples were incubated for 2 h with agitation at 37 °C.
Bile and pancreatin were subsequently added to simulate digestion in the upper small
intestine. Samples were incubated at 37 °C with agitation for 2 h after sample pH was
increased to 4.7. Finally, the pH of the samples was adjusted to 7.1 to simulate
conditions in the lower small intestines. Samples were incubated under the condition
described above. Aliquots were collected after incubation for 30 min and 2 h (gastric
phase) as well as 4 h (enteric phase 1) and 6 h (enteric phase 2). Probiotic bacteria in
collected samples were enumerated. A lower cell population was observed in samples
inoculated with probiotic culture C, followed by probiotic mixture U and mixture N (p <
0.05). At the end of the 6 h incubation period, in peanut butter homogenates, probiotic
bacteria population from product N (5.67 log CFU) was higher than that in product U
Page 113
101
(3.48 log CFU) and product C (3.00 log CFU). On average, Streptococcus/Lactococcus
species had the highest survival rate followed by Bifidobacterium and Lactobacillus
species during the simulated passage. Overall, the fat content of peanut butter did not
have a significant impact on probiotic survivability. The study suggests that the peanut
butter matrices are able to protect probiotic bacteria during simulated gastrointestinal
passage, making them possible vehicles for probiotic delivery to children prone to
diarrhea.
Keywords: Gastric, enteric, L. rhamnosus GG, peanut butter, reduction
Page 114
102
1. Introduction
In most developing countries, a major public health concern is the alarming rate
of diarrhea and related mortality in pre-school children (WHO, 2013). Malnutrition is a
major cause of diarrhea which subsequently worsens malnourishment in these children
(WHO, 2013). In addition to several intervention strategies including good nutrition,
zinc supplementation, safe drinking water, rehydration and improved environmental
sanitation (WHO, 2013) , many clinical studies have found that probiotics, live
microorganisms which confer a health benefit to the host when administered in adequate
amounts (FAO/WHO, 2001), are effective in preventing, controlling and treating diarrhea
in pre-school children (Binns and Lee, 2010; Isolauri, 2004; Nomoto, 2005; Sazawal et
al., 2006; Sullivan and Nord, 2002).
To exert proposed health benefits, probiotic bacteria must be available in high
numbers at the time of consumption and be viable after passing through gastrointestinal
tract (Jensen et al., 2012; Ranadheera et al., 2010; Valerio, et al, 2006). Several authors
have addressed the importance of food in maintaining probiotic viability during storage
and in the digestive tract (Alegre et al., 2011; Karimi et al., 2011; Ranadheera et al.,
2010). Chocolate (Nebesny et al., 2005; Possemiers et al., 2010), ice-cream (Hekmat and
McMahon, 2002; Magariños et al., 2007; Ranadheera et al., 2012; Salem et al., 2005),
fermented soy product (Bedani et al., 2013) and cheese (Boylston et al., 2004; Karimi et
al., 2011; Madureira et al., 2005) have been documented as suitable vehicles for probiotic
delivery. Ranadheera et al. (2012) stated that foods with high pH and a high buffering
capacity could reduce the acidity of the human stomach and enhance the viability of
probiotic cells. In a laboratory study, Ross et al. (2005) observed that the addition of
Page 115
103
milk proteins to gastric juice or microbiological media significantly increased their pH
and subsequently enhanced the survival of some Bifidobacterium and Lactobacillus
species. In addition to directly impacting cell viability, the physical property of food was
reportedly affect the transit time of probiotics through human stomach; with liquid foods
moving faster than solid foods (Huang and Adams, 2004). Furthermore, the functional
properties of probiotics are influenced by the food ingredients used for their delivery, and
these include prebiotic substances such as inulin, fructooligosaccharides,
galactooligosaccharides and lactulose (Ranadheera et al., 2010). Thus, it is the tolerance
of probiotic bacteria, in their delivering food matrix, towards gastrointestinal conditions
that is important in maintaining the health benefits of probiotics. Most recently, Klu et al.
(2012) reported that probiotic bacterium Lactobacillus rhamnosus GG could maintain its
viability in peanut butter for as long as 48 wk at refrigeration temperature and up to 27
wk under ambient storage condition. The purpose of this study was to observe whether
peanut butter could protect probiotic bacteria during a simulated gastrointestinal passage.
Since peanut butter based Ready-to-Use Therapeutic Foods have been widely used to
treat malnutrition amongst children in developing countries (Manary et al., 2006; Ndekha
et al., 2005), ultimately, the goal is to use probiotic peanut butter to address the problem
of malnutrition and diarrhea concurrently.
2. Materials and methods
2.1. Materials
Full-fat and reduced-fat peanut butter products, both having a solid content of
99.00% and a fat content of 50.10 ± 1.16% and 39.90 ± 0.62%, respectively were
Page 116
104
provided by American Blanching (Fitzgerald, GA, USA). Both products contained
peanuts, hydrogenated vegetable oils (rapeseed, cottonseed and soybean), sugar, molasses
and salt. In addition, the reduced-fat peanut butter also contained partially defatted
peanut flour, monoglycerides, tocopherol, acetate and pyridoxine HCl. Information from
the manufacturer reveals comparable total carbohydrate, sugars, fiber, sodium and
potassium for both products. However, the reduced-fat peanut butter had a protein
content of 28.12% comparing to a protein content of 21.31% for the full-fat peanut butter.
Three commercial probiotic products, designated as C, N and U were used in the
study. Product C contained L. rhamnosus GG, and each capsule had a manufacturer’s
claim of 10 billion viable cells. Product N had a manufacturer’s claim of 16 billion live
cells per g of powder and was made up of 16 different probiotic bacteria which included
Bifidobacterium bifidum, Bifidobacterium breve, Bifidobacterium lactis, B. lactis Bif
Relief 24-7™, Bifidobacterium longum, Lactobacillus acidophilus, Lactobacillus brevis,
Lactobacillus bulgaricus, Lactobacillus casei, Lactobacillus gasseri, Lactobacillus
paracasei, Lactobacillus plantarum, Lactobacillus rhamnosus, Lactobacillus salivarius,
Lactococcus lactis and Streptococcus thermophilus. Product U contained a mixture of
strains including L. acidophilus (CUL 60), L. acidophilus (CUL 21), B. bifidum (CUL 20)
and B. lactis (CUL 34). Each capsule was claimed by the manufacturer to contain 50
billion live cells.
2.2. Inoculation of peanut butter with probiotics
The probiotic bacteria were inoculated into the peanut butter products as
previously described by Klu et al. (2012). Specifically, the full-fat and reduced-fat
Page 117
105
peanut butter were pre-heated in a Stabil-Therm Electric Oven (Blue M Electric Co.,
Blue Island, IL, USA) at 37 °C for 6 h to reduce product viscosity and aid in uniform
mixing. Precisely 1.5 kg peanut butter was placed into a sterile KitchenAid® mixer, and a
pre-determined amount of each probiotic product was inoculated into the peanut butter to
achieve an inoculation level of ca. 107 CFU/g. The peanut butter and probiotics were
mixed at room temperature for 15 min at 66 and 148 rpm for orbital and beater speeds,
respectively. Samples of the inoculated peanut butter were dispensed into pre-sterilized
(15 min under UV light in a Level II Biosafety Cabinet- NuAire Laboratory Equipment
Supply, Plymouth, MN, USA) clear polyethylene terephthalate jars (4 oz.) and were
covered with pressure-sensitive lined polypropylene lids (Container and Packaging
Supply, Eagle, ID, USA).
2.3. Survival of probiotic bacteria under simulated gastrointestinal conditions
Gastrointestinal conditions were simulated by adopting a method described by
Buriti et al. (2010). Based on the weight of product, full-fat or reduced-fat probiotic
peanut butter products were suspended in 0.5% NaCl solution (Fisher Scientific, Fair
Lawn, NJ, USA). The samples were mixed by vigorous manual to-and-fro shaking at an
arm angle of about 45° for 1 min. Ten mL of each homogenate was transferred into a
sterile 50 mL polypropylene conical tube (Becton, Dickinson and Co., Sparks, MA,
USA). To mimic digestion in the stomach (gastric phase), the pH (ca. 6) of the samples
was adjusted to 1.6 with 1 M HCl solution (Fisher Scientific). Pepsin from porcine
gastric mucosa (Sigma-Aldrich, St. Louis, MO, USA) and lipase from Rhizopus arrhizus
(Sigma-Aldrich) were added to reach a concentration of 0.03 g/10 mL and 0.009 mg/10
Page 118
106
mL, respectively. Samples were incubated for 2 h at 37 °C with an agitation of 150 rpm
in a G24 Environment Incubator Shaker (New Brunswick Scientific Co., Edison, NJ,
USA) to mimic gastric phase. After the incubation, the pH of the samples was adjusted
to ca. 4.7 using a sterile alkaline solution (1 liter contains 150 mL of 1M NaOH and 14 g
of NaH2PO4). Bile of bovine source (Sigma-Aldrich) and pancreatin from porcine
pancreas (Sigma-Aldrich) were subsequently added to reach a concentration of 0.1 g/10
mL and 0.01 g/10 mL, respectively. Samples were incubated for 2 h to simulate
digestion in the upper small intestines (enteric phase 1) under the conditions specified
above. After the 2 h incubation, the alkaline solution was used to further increase the pH
of the samples to 7.1. In addition, the concentrations of bile and pancreatin were adjusted
to 0.1 g/10 mL and 0.01 g/10 mL, respectively. The samples were incubated for another
2 h to simulate digestion in the lower small intestines (enteric phase 2) at aforementioned
conditions, to complete a total of 6 h assay. At 30 min, 2 h, 4 h and 6 h intervals, aliquots
were collected and probiotic bacteria were enumerated as described below. Probiotic
culture/mixtures suspended in 10 ml of 0.5% NaCl solution that did not have the
protection of peanut butter matrices were used as controls (107 CFU/mL). The pH of
peanut butter homogenate and “no peanut butter control” was determined using a pH
meter (model 8000; VWR International, PA, USA). All enzymatic solutions used in the
experiments were sterilized using sterile syringes (Becton, Dickinson and Co.) and 0.45
µm sterile nylon filter units (Fisher Scientific).
2.4. Enumeration of probiotic bacteria
The 1 mL aliquots taken at each sampling interval were serially diluted, when
necessary and 0.1 mL of appropriately diluted samples was plated on microbiological
Page 119
107
media purchased from Becton, Dickson and Co. (Sparks, MA, USA). Rogosa (LBS) agar
and de Man, Rogosa and Sharpe (MRS) agar were used for the enumeration of
Lactobacillus species. LBS agar modified with filtered tomato juice (200 mL/L; LBST)
was used to enhance the growth of L. acidophilus. Both LBS and LBST were prepared
with the addition of 1.32 mL of glacial acetic acid (Fisher Scientific) per L of media. L.
lactis and S. thermophilus were enumerated on M17 agar supplemented with 0.5% (final
concentration) of lactose. Bifidobacterium species were enumerated on modified
Bifidobacterium agar, each liter of which includes 42.5 g Columbia agar base, 2.5 g
glucose, and 0.01 g riboflavin (Fisher Scientific), 2.5 g lactulose (EMD Chemicals Inc.
San Diego, CA, USA) and 0.5 g/L cysteine HCl (Sigma-Aldrich). The pH of the media
was adjusted to 5.5 ± 0.2 by the addition of propionic acid (J. T. Baker, Phillipsburg, NJ,
USA). All probiotic bacteria species were incubated under anaerobic conditions using
the BD GasPak™ EZ in a BBL GasPak® System (Becton, Dickinson and Co.).
Lactobacillus and Bifidobacterium species were incubated at 37 °C for 72 h whiles L.
lactis and S. thermophilus were incubated at 30 °C and 37 °C, respectively for 48 h. All
cell colonies were counted using the Leica Quebec Darkfield Colony Counter (Leica,
Buffalo, N.Y., U.S.A.). Log reductions of probiotic cell populations were computed by
subtracting the cell populations enumerated at each sampling point from the initial
bacterial counts. To avoid confusions that might be caused by sample volume increase
due to the adjustment of pH and enzyme concentrations during the course of the
experiment, results were expressed as logarithm values of colony forming units (log
CFU) in total volume of peanut butter homogenate at each sampling point.
Page 120
108
2.5. Statistical analysis
Experiments were conducted in three trials with replicate samples at each trial.
Data was analyzed using a 3-way Analysis of Variance F-test and the General Liner
Model of Statistical Analysis Software (SAS Inst. Inc., Cary, NC, USA). At a confidence
level of 95%, Fisher’s Least Significant Difference Design was used to compare the
significance of differences among bacterial populations in different probiotic products (C,
N and U) and individual groups of probiotic bacteria (lactobacilli, bifidobacteria
streptococci/lactococci) in different type of peanut butter products (full fat and reduced
fat) as influenced by length of simulated gastrointestinal passage.
3.0 Results
3.1. Survival of different probiotic products during gastrointestinal passage
Table 5.1 shows the overall survival of bacteria in all three probiotic products
during the simulated gastrointestinal passage. The average bacterial populations from the
three probiotic products decreased significantly (p < 0.05) after 30 min in simulated
gastric phase and remained at similar levels subsequently (p > 0.05; Table 5.1). More
probiotic bacteria survived in the two peanut butter homogenates than in the “no peanut
butter control”, and additionally, the fat content of peanut butter products had no
significant influence on probiotic survival during simulated gastrointestinal passage (p <
0.05; Table 5.1). Higher cell population was observed in samples inoculated with
probiotic product N, followed by product U and product C (p < 0.05; Table 5.1).
Fig 5.1 shows cell population reductions in samples inoculated with probiotic
products C, N and U at different phases of simulated gastrointestinal passage. The
Page 121
109
number of L. rhamnosus GG cells in samples inoculated with product C demonstrated a
steady decline in both peanut butter homogenates and in the “no peanut butter control”
within 30 min into the gastric phase (Fig 5.1A). However, a higher reduction of ca. 6 log
CFU was observed with the “no peanut butter control” sample (Fig 5.1A). Between the
30 min and 2 h sampling points a slight decline of ca. 1 log CFU in L. rhamnosus
population was observed in the three samples (Fig 5.1A). From the 2 h to 4 h sampling
points, L. rhamnosus populations increased from 0.29 to 1.47 log CFU in the three
samples (Fig 5.1A). At the end of the 6 h incubation period, the average cell populations
of L. rhamnosus GG in the “no peanut butter control” had decreased 6.97 log CFU. In
full-fat and reduced-fat peanut butter homogenates however, the populations decreased
by 3.90 and 4.09 log CFU, respectively from the initial counts (Fig 5.1A).
Fig 5.1B shows the survival trend of probiotic bacteria in samples inoculated with
probiotic mixture N during simulated gastrointestinal passage. A population reduction of
0.78 log CFU was observed at the 30 min sampling interval in both peanut butter
homogenates; in “no peanut butter control” however, ca. a 3 time higher decline of 2.56
log CFU was observed. Cell populations in peanut butter homogenates and “no peanut
butter control” sample were stable thereafter throughout the experiment. At the end of
the 6 h experiment, the average log reduction of probiotic bacteria from the initial counts
was 1.23 and 1.43 log CFU in full-fat and reduced-fat peanut butter homogenate,
respectively whiles in the “no peanut butter control” the probiotic population had
decreased 3.41 log CFU (Fig. 5.1B).
Fig. 5.1C shows how probiotic bacteria survived in samples inoculated with
product U during the experimental period. As the experiment progressed, there was a
Page 122
110
steady reduction in cell populations of ca. 1 log CFU in both peanut butter homogenates
at most sampling points. As observed with product C, comparatively a greater population
reduction of U was observed in “no peanut butter control” sample. At the end of the
study, probiotic cell populations in full-fat and reduced-fat peanut butter decreased by
3.93 and 3.11 log CFU, respectively from the initial counts. In “no peanut butter control”
however, a reduction of 4.57 log CFU was observed at the end of 2 h incubation period,
and by the end of 4 h incubation period, the probiotic counts had reduced 7.05 logs (Fig.
1C Fig 5.1C).
Many authors have reported the protective effect of different food matrices on
probiotic bacterial survival during simulated gastrointestinal passage (Bedani et al., 2013;
Blaiotta et al., 2013; Buriti et al., 2010; Huang and Adams, 2004; Pitino et al., 2012;
Ranadheera et al., 2012). It is evident that peanut butter homogenates offered protection
to the bacteria from each probiotic product used in the present study (Fig. 1). The two
peanut butter products in this work had similar ingredients however; the full-fat peanut
butter had more fat and reduced-fat peanut butter had more protein. Although fat has
been reported to protect probiotic cells in gastrointestinal tracts (Karimi et al., 2011;
Possemiers et al., 2010; Ranadheera et al., 2012), a similar phenomenon was not
observed in the present study. The low fat content in the reduced-fat peanut butter was
compensated by the high protein content in the present study. Proteins have been
proposed to improve the tolerance of probiotic bacteria to gastrointestinal conditions
(Ranadheera et al., 2010, 2012). Buriti et al. (2010) reported that substitution of milk fat
by inulin in guava mousses increased the survival of L. acidophilus in simulated gastric
and enteric conditions, suggesting that fat is not the only food ingredient that is capable
Page 123
111
of providing protection to probiotic bacteria in simulated gastrointestinal environment.
The fat and protein constituents of the peanut butter products in combination may have
offered equal protection to probiotic bacteria as they went through the simulated
gastrointestinal passage in the present study.
It was observed in the present study that on the average, exposure of probiotic
cells to acidic conditions and gastric enzymes had an adverse effect on the viability of
probiotic bacteria (Fig. 5.1). Other researchers have also observed high rates of probiotic
inactivation at gastric pH levels (Bove et al., 2013; Mainville et al., 2005; Marteau et al.,
1997; Pitino et al., 2012). Ranadheera et al. (2012) reported that during a simulated
gastrointestinal study, a greater probiotic bacterial inactivation occurred when the pH was
2 compared to pH at 3 or 4. Bove et al. (2013) studied the effect of a food matrix on the
survival of L. plantarum through an oro-gastro-intestinal tract simulator. The lower
probiotic survival occurred when the food matrice was exposed to pH 1.5 as compared to
higher pH used in the study.
In the present study, it is evident that L. rhamnosus GG from probiotic product C
was relatively intolerant of gastric conditions compared to the bacteria from the other two
probiotic products and an average of 5.40 log reduction in peanut butter homogenates and
6.92 log reduction in "no peanut butter control" were observed during the gastric phase of
the experiment (Fig. 5.1). However, the number of L. rhamnosus GG in peanut butter
homogenates increased by 1.40 log CFU by the end of enteric passage (Fig. 5.1). Buriti
et al. (2010) noticed that L. acidophilus cells in guava mousse reached an undetectable
level in the gastric phase but viable cells were recovered in the enteric phase when pH
Page 124
112
(1.6) of the sample was increased to 7.1. It is possible that some sub-lethally injured
probiotic bacterial cells had recovered during the enteric phase of the study.
Comparing to the bacterial cells from probiotic product C, those from product N
exhibited higher tolerance to both simulated gastric conditions. At the end of the 6 h
experiment, the populations of probiotic bacteria from product N were ca. 3 logs higher
than the population of L. rhamnosus GG in the peanut butter homogenates (Figs. 5.1A
and 5.1B). Product N had 16 probiotic strains, and the presence of multiple bacterial
strains could have contributed to the observed phenomenon as different researchers have
reported that the ability of probiotics to tolerate gastric pH and bile salts is strain specific
(Madureira et al., 2005; Mainville et al., 2005; Papamanoli et al., 2003; Pitino et al.,
2010). Product U, nevertheless, had fewer bacterial strains compared to product N, and
at the end of the 6 h simulated study peanut butter homogenate inoculated with the
bacteria from product U only had ca. 0.5 log more viable cells compared to those in
samples inoculated with L. rhamnosus GG (Figs. 5.1A and 5.1C). In the control samples
probiotic cells from product U were below the detectable limit by the 4th h of the
experiment. These results suggest that both the number and the type of probiotic species
and strains are important for their overall survival under simulated gastrointestinal
conditions.
It is evident that peanut butter homogenates protected the bacteria from all three
probiotic products used in this study. However, this protective effect was more evident
for probiotic strains from product U judging by the size of population difference between
peanut butter homogenates and the control samples (Fig. 5.1C). This result suggests that
Page 125
113
ingestion with food might be necessary in order to receive expected health benefits from
the probiotic bacteria from product U.
3.2. Survival pattern of lactobacilli, bifidobacteria and streptococci/lactococci during
simulated gastrointestinal passage
Table 5.1 shows that Lactobacillus had the highest cell population loss during the
6 h simulated gastrointestinal passage, followed by Bifidobacterium. In comparison,
Streptococcus/Lactococcus had the lowest cell population loss among the three different
probiotic bacterial species used in the study.
Table 5.2 shows the survival trends of the three bacteria species from products N
and U. It was observed that at the end of the gastric phase (2 h), Lactobacillus cells from
product N had a population reduction (p < 0.05) of 1.61 and 1.89 log CFU in full-fat and
reduced-fat peanut butter homogenates, respectively, but in the “no peanut butter control”
an approximate 2 times higher reduction of 3.80 log CFU was observed. A similar
phenomenon was observed at the end of the enteric phase (6 h), the reductions in
Lactobacillus populations were 2.86 and 2.43 log CFU, respectively in the two peanut
butter homogenates while the reduction in the control was 3.40 log CFU (p < 0.05).
At the 30 min sampling point, Bifidobacterium cells from product N in both
peanut butter homogenates had a 0.72 log CFU reduction whiles the reduction in the “no
peanut butter control” was approximately 3 times higher (2.38 log CFU). From this
sampling point forward to the 2 h sampling interval, Bifidobacterium cell counts in the
two peanut butter homogenates remained fairly stable (p > 0.05; Table 5.2). The same
counts in the control sample however, had a 3.79 log CFU reduction (p < 0.05) from the
Page 126
114
initial count. At the end of 6 h incubation period, Bifidobacterium populations in peanut
butter homogenates were 2.44 to 2.73 logs higher (p < 0.05) compared to those in the “no
peanut butter control”.
Streptococcus/Lactococcus species did not exhibit any clear survival trend in the
present study. The reductions of Streptococcus/Lactococcus population were 0.42 or
0.34 log CFU in full fat or reduced fat peanut butter homogenate, respectively at the 30
min sampling interval while a reduction of 1.80 log CFU was observed in the control
sample. At the end of the enteric phase (6 h), similar log reductions of 0.84 and 0.80
CFU (p > 0.05) were seen in samples with peanut butter products but in the control
sample, the reduction was 2.84 logs higher (p < 0.05) (Table 5.2). Comparatively,
Streptococcus and Bifidobacterium species from product N had a greater survival (p <
0.05) than Lactobacillus species in the peanut butter homogenates at most sampling
points (Table 5.2).
After 30 min into gastric phase, Lactobacillus populations in product U in the
full-fat and reduced-fat peanut butter homogenates declined 0.83 and 0.65 log CFU,
respectively. But in the control sample, the reduction of the same population was as high
as 3.59 log CFU. Furthermore, cell population reductions were similar (p > 0.05) in both
peanut butter homogenates at this sampling point but they were significantly different (p
< 0.05) from the same population in the “no peanut butter control” sample. A steady
decline in Lactobacillus populations was observed in all three types of samples at all
phases of the experiment; At 4 h, Lactobacillus cells in “no peanut butter control”
declined to the undetectable level (< 0.6 log CFU/mL), giving an average log reduction of
Page 127
115
7.05 log CFU. At the end of 6 h experiment, cell populations in the two peanut butter
products were 4.16 to 4.88 log CFU higher than those in the control samples (p < 0.05).
Similar to the trend observed with Lactobacillus, Bifidobacterium in product U
declined steadily from the initial count through all phases of the experiment (p < 0.05);
yet after 4 h into the experiment, Bifidobacterium cells were undetectable in the control
samples. At 6 h, ca. 5 to 6 log CFU more reductions were observed in “no peanut butter
controls” when compared to cell populations in full fat and reduced peanut butter
homogenates (Table 5.2). Similar to what was observed in peanut butter homogenates
containing product N, Lactobacillus had relatively greater cell population loss than
Bifidobacterium (p < 0.05; Table 5.2).
With the exclusion of the samples collected at 30 min and 2 h, Bifidobacterium
cells from product N survived better than the cells of Lactobacillus in the two peanut
butter homogenates (p < 0.05; Table 5.2). However, the populations of Lactobacillus and
Bifidobacterium species from product U were significantly higher in reduced-fat peanut
butter homogenate compared to full fat peanut butter homogenate with the exception of
samples collected at 30 min (p < 0.05; Table 5.2)
S. thermophilus is reported to have poor survival rate in gastrointestinal
environments when consumed without food matrices (Conway et al., 1987), but Lick et
al. (2001) reported that it had improved survival in the intestines of Gottingen minipigs
when fed with yoghurt. Similar protective effect of peanut butter homogenates towards
the cells of S. thermophilus and L. lactis was observed in the present study (Table 5.2).
The two bacteria survived better than Bifidobacterium and Lactobacillus (Table 1), which
is in contradiction to what was reported by Marteau et al. (1997) who observed that B.
Page 128
116
bifidum and L. acidophilus survived better at all stages of a simulated gastrointestinal
passage than S. thermophilus and L. bulgaricus when administered with fermented milk
products. Unlike the study of Marteau et al., the present work sampled a combination of
L. lactis and S. thermophilus. S. thermophilus was accompanied by other probiotic
strains in our study, and it is possible that some strains have a higher tolerance to low pH
and bile salts as what was observed by Blaiotta et al. (2013). Furthermore, the present
study and the study of Marteau et al. used different type of foods as matrices, and
Ranadheera et al. (2012) suggested that the tolerance of probiotics to gastric pH and bile
salts can be influenced by carrier foods. Possemiers et al. (2010) observed a 5-fold
higher viability of L. helveticus and B. longum when the probiotic bacteria were delivered
by chocolate compared to milk.
The different survival trend of Lactobacillus and Bifidobacterium from probiotic
products N and U (Table 5.2) is a clear indication of the importance of probiotic
species/strain variability in the survival of probiotic cells under simulated gastric and
enteric conditions. Using 7 strains of L. rhmanosus in cheese during a simulated human
digestion, Pitino et al. (2012) found that the survival of L. rhmanosus was strain specific
at each stage of the digestion. Strain specific tolerance to gastric acidity and bile salts
was also observed in two other studies by same authors (Pitino et al. 2010; Lo Curto et.
al, 2011).
Our results showed that on the average, Bifidobacterium strains had higher
survival rates than Lactobacillus strains and this observation was supported by several
previous studies. Bedani et al. (2013) reported that Bifidobacterium animalis Bb-12 in a
fermented soy product was more robust and tolerant during in vitro simulated
Page 129
117
gastrointestinal passage, maintaining a mean population of ca. 8 log CFU/g whiles L.
acidophilus La-5 could only maintain a mean population below 5 log CFU/g. Similar
observation was made by Madureira et al. (2011). B. animalis was found to have better
resistance than L. acidophilus and L. casei to simulated stomach and intestinal conditions.
Salaün et al., (2005) reported that a major factor affecting changes in pH in any
given system is the buffering capacity of the food product. Foods like cheese, ice-cream
and chocolate have good buffering capacities, thereby enhancing the survival of bacterial
cells. In addition to the buffering capacity of food, physical encapsulation of probiotic
cells by food components is another possible protective mechanism for probiotic cells
(Työppönen et al., 2003). Future research is needed to elucidate the molecular basis of
the protective mechanisms observed in the present study.
Conclusion
Full-fat and reduced-fat peanut butter homogenates offered equal protection to
probiotic bacteria from products C, N and U during simulated gastrointestinal passage.
Overall, streptococci and lactococci had the highest survival, followed by bifidobacteria
and lactobacilli. At the end of 6 h gastrointestinal passage, in both peanut butter
homogenates, probiotic bacteria from product N had the highest survival, followed by
probiotic bacteria from products U and C. Results from this study suggests that peanut
butter matrices are capable of protecting probiotic bacteria under simulated
gastrointestinal conditions and are possible vehicles to deliver probiotic to children prone
to diarrhea.
Page 130
118
Acknowledgements
This research was partially supported by the Peanut Collaborative Research
Support Program. Sincere appreciation goes to Mr. Edward Parker of the American
Blanching Company and Jerry Davis of the University of Georgia.
References
Alegre, I., Viñas, I., Usall, J., Anguera, M., Abadias, M., 2011. Microbiological and
physicochemical quality of fresh-cut apple enriched with the probiotic strain
Lactobacillus rhamnosus GG. Food Microbiology 28, 59-66.
Bedani, R., Rossi, E.A., Saad, S.M.I., 2013. Impact of inulin and okara on Lactobacillus
acidophilus La-5 and Bifidobacterium animalis Bb-12 viability in a fermented soy
product and probiotic survival under in vitro simulated gastrointestinal conditions.
Food Microbiology 34, 382-389.
Binns, C., Lee, M.K., 2010. The use of probiotics to prevent diarrhea in young children
attending child care centers: a review. Journal of Experimental and Clinical
Medicine 2, 269-273.
Blaiotta, G., La Gatta, B., Di Capua, M., Di Luccia, A., Coppola, R., Aponte, M., 2013.
Effect of chestnut extract and chestnut fiber on viability of potential probiotic
Lactobacillus strains under gastrointestinal tract conditions. Food Microbiology
36, 161-169.
Bove, P., Russo, P., Capozzi, V., Gallone, A., Spano, G., Fiocco, D., 2013. Lactobacillus
plantarum passage through an oro-gastro-intestinal tract simulator: carrier matrix
Page 131
119
effect and transcriptional analysis of genes associated to stress and probiosis.
Microbiological Research 168, 351-359.
Boylston, T.D., Vinderola, C.G., Ghoddusi, H.B., Reinheimer, J.A., 2004. Incorporation
of bifidobacterium into cheeses: challenges and rewards. International Dairy
Journal 14, 375-387.
Buriti, F.C.A, Castro, I.A, Saas, S.M.I., 2010. Viability of Lactobacillus acidophilus in
synbiotic mousses and its survival under in vitro simulated gastrointestinal
conditions. International Journal of Food Microbiology 137, 121-129.
Conway, P.L., Gorbach, S.L., Goldin, B.R., 1987. Survival of lactic acid bacteria in the
human stomach and adhesion to intestinal cell. Journal of Dairy Science 70, 1-12.
Food and Agriculture Organization of the United Nations/World Health Organization
[Internet]. 2001 [Accessed 2014 Jan 18]. Available from:
ftp://ftp.fao.org/docrep/fao/009/a0512e/a0512e00.pdf
Hekmat, S., McMahon, J., 1992. Survival of Lactobacillus acidophilus and
Bifidobacterium bifidum in ice cream for use as a probiotic food. Journal of Dairy
Science 75, 1415-1422.
Huang, Y., Adams, M.C., 2004. In vitro assessment of the upper gastrointestinal
tolerance of potential probiotic dairy propionibacteria. International Journal of
Food Microbiology 91, 253-260.
Isolauri, E., 2004. The role of probiotics in pediatrics. Current Paediatrics 14, 104-109.
Jensen, H., Grimmer, S., Naterstad, K., Axelsson, L., 2012. In vitro testing of commercial
and potential probiotic lactic acid bacteria. International Journal of Food
Microbiology 153, 216-222.
Page 132
120
Karimi, R., Mortazavian, A.M., Da Cruz, A.G., 2011. Viability of probiotic
microorganisms in cheese during production and storage: a review. Dairy Science
and Technology 91, 283-308.
Lick, S., Drescher, K., Heller, K.J., 2001. Survival of Lactobacillus delbrueckii subsp.
bulgaricus and Streptococcus thermophilus in the terminal ileum of fistulated
Göttingen minipigs. Applied and Environmental Microbiology 67(9), 4137-4143.
Lo Curto, A., Pitino, I., Mandalari, G., Dainty, J.R., Faulks, R.M., Wickham, M.S.J.,
2011. Survival of probiotic lactobacilli in the upper gastrointestinal tract using an
in vitro gastric model of digestion. Food Microbiology 28, 1359-1366.
Manary, M.J., 2006. Local production and provision of ready-to-use therapeutic food
(RUTF) spread for the treatment of severe childhood malnutrition. Food and
Nutrition Bulletin 27, S83-S89.
Madureira, A.R., Pereira, C.I., Truszkowska, K., Gomes, A.M., Pintado, M.E., Malcata,
F.X., 2005. Survival of probiotic bacteria in a whey cheese vector submitted to
environmental conditions prevailing in the gastrointestinal tract. International
Dairy Journal 15, 921-927.
Madureira, A.R., Amorim, M., Gomes, A.M., Pintado, M.E., Malcata, F.X., 2011.
Protective effect of whey cheese matrix on probiotic strains exposed to simulated
gastrointestinal conditions. Food Research International 44, 465-470.
Magariños, H., Selaive, S., Costa, M., Flores, M., Pizzaro, O., 2007. Viability of
probiotic microorganisms (Lactobacillus acidophilus La-5 and Bifidobacterium
animalis subsp. lactis Bb-12) in ice cream. Society of Dairy Technology 60 (2),
128-134
Page 133
121
Mainville, I., Arcand, Y., Farnworth, E.R., 2005. A dynamic model that simulates the
human upper gastrointestinal tract for the study of probiotics. International
Journal of Food Microbiology 99, 287-296.
Marteau, P., Minekus, M., Havenaar, R., Huis In’t Veld, J.H.J., 1997. Survival of lactic
acid bacteria in a dynamic model of the stomach and small intestine: validation
and the effects of bile. Journal of Dairy Science 80 (6), 1031-1037.
Nebesny E, Żyżelewicz D, Motyl I, Libudzisz Z. 2007. Dark chocolates supplemented
with Lactobacillus strain. European Journal of Food Research and Technology
225:33-42.
Ndekha, M.J., Manary, M.J., Ashorn, P., Briend, A., 2005. Home-based therapy with
ready-to-use therapeutic food is of benefit to malnourished, HIV-infected
Malawian children. Acta Paediatrica 94, 222-225.
Papamanoli, E., Tzanetakis, N., Litopoulou-Tzanetakis, E., Kotzeidou, P., 2003.
Characterization of lactic acid bacteria isolated from Greek dry-fermented
sausage in respect of their technological and probiotic properties. Meat Science
65, 859-867.
Pitino, I., Randazzo, C.L., Mandalari, G., Lo Curto, A., Faulks, R.M., Le Marc, Y.,
Bisignano, C., Caggia, C., Wickham, M.S.J., 2010. Survival of Lactobacillus
rhamnosus strains in the upper gastrointestinal tract. Food Microbiology 27,
1121-1127.
Pitino, I., Randazzo, C.L., Cross, K.L., Parker, M.L., Bisignano, C., Wickham, M.S.J.,
Mandalari, G., Caggia, C., 2012. Survival of Lactobacillus rhamnosus strains
Page 134
122
inoculated in cheese matrix during simulated human digestion. Food
Microbiology 31, 57-63.
Possemiers, S., Marzorati, M., Verstraete, W., Van de Wiele, T., 2010. Bacteria and
chocolate: A successful combination for probiotic delivery. International Journal
of Food Microbiology 141, 97-103.
Ranadheera, R.D.C.S., Baines, S.K., Adams, M.C., 2010. Importance of food in probiotic
efficacy. Food Research International 43,1-7.
Ranadheera, C.S., Evans, C.A., Adams, M.C., Baines, S.K., 2012. In vitro analysis of
gastrointestinal tolerance and intestinal cell adhesion of probiotics in goat's milk
ice cream and yogurt. Food Research International 49, 619-625.
Ross, R.P., Desmond, C., Fitzgerald, G.F., Stanton, C., 2005. Overcoming the
technological hurdles in the development of probiotic foods. Journal of Applied
Microbiology 98, 1410-1417.
Salaün, F., Mietton, B., Gaucheron, F., 2005. Buffering capacity of dairy products.
International Dairy Journal 15, 95-109.
Salem, M.M.E., Fathi, F.A., Awad, R.A., 2005. Production of probiotic ice-cream. Polish
Journal of Food and Nutrition Sciences 14/55 (3), 267-271.
Sazawal, S., Hiremath, G., Dhingra, U., Malik, P., Deb, S., Black, R.E., 2006. Efficacy of
probiotics in prevention of acute diarrhea: a meta-analysis of masked,
randomized, placebo-controlled trials. Lancet Infectious Diseases 6, 374-382.
Sullivan, A., Nord, C.E., 2002. The place of probiotics in human intestinal infections.
International Journal Antimicrobial Agents 20, 313-319.
Page 135
123
Työppönen, S., Petäjä, E., Mattila-Sandholm, T., 2003. Bioprotectives and probiotics for
dry sausages. International Journal of Food Microbiology 83, 233-244.
Valerio, F., De Bellis, P., Lonigro, S.L., Morelli, L., Visconti, A., Lavermicoccal, P.,
2006. In vitro and in vivo survival and transit tolerance of potentially probiotic
strains carried by artichokes in the gastrointestinal tract. Applied and
Environmental Microbiology 72(4), 3042-3045.
World Health Organization (WHO) [Internet]. 2013 [Accessed 2013 February 18].
Available from: http://www.who.int/mediacentre/factsheets/fs330/en/.
Page 136
124
Table 5.1
Average reduction (log CFU) of total probiotic bacteria populations and probiotic species
(Lactobacillus, Bifidobacterium and Streptococcus/Lactococcus) in probiotic products C, N and
U as observed in full fat-peanut butter, reduced-fat peanut butter and “no peanut butter control”
during a 6 h (360 min) simulated gastrointestinal study
Reduction in cell population
(logCFU)
Probiotic culture/mixture
C 4.10c
N 1.50a
U 2.48b
Probiotic bacteria
Lactobacillus 2.38c
Bifidobacterium 1.93b
Streptococcus/Lactococcus 0.98a
Food matrix
Full fat peanut butter 2.14a
Reduced fat peanut butter 2.13a
No peanut butter control 3.99b
Time in simulated
gastrointestinal fluid (min)
0 0.00a
30 2.55b
120 3.59c
240 3.60c
360 3.78c
Means in the same column not followed by the same letters are significantly different (P < 0.05)
Page 137
125
Table 5.2
Average reduction (log CFU) of Lactobacillus (Lacto), Bifidobacterium (Bifi) and Streptococcus/Lactococcus (Strep) in probiotic mixtures N and
U in full-fat (FF) and reduced-fat (RF) peanut butter and “no peanut butter control” (C) during a 6 h (360 min) simulated gastrointestinal study
Reduction in cell population (log CFU)
Mixture N Mixture U
FF RF C FF RF C
Lacto Bifi Strep Lacto Bifi Strep Lacto Bifi Strep Lacto Bifi Lacto Bifi Lacto Bifi
0 min 0.00aA 0.00aA 0.00abA 0.00aA 0.00aA 0.00abA 0.00aA 0.00aA 0.00aA 0.00aA 0.00aA 0.00aA 0.00aA 0.00aA 0.00aA
30
min
0.91abB 0.72bB *0.42aA 0.92abB 0.72bB *0.34aA 2.90bEF 2.38bDE 1.80bCD 0.83aB 1.12bBC 0.65abB 1.01bB 3.59bF 3.11bF
120
min
1.61bcBCD 0.96bABC 0.22abA 1.89bcDEF 0.85bAB 0.26abA 3.80cHI 3.79cHI 3.06cGH 2.53bFG 2.43cEFG 1.74bDE 1.68bcCDE 4.50cIJ 4.87cJ
240
min
2.38bcCDE 0.95bAB 1.05bABC 2.67cDEF 0.84bAB 0.46bcA 3.59cEF 3.62cEF 3.32cDEF 3.91cF 3.00cdDEF 3.56cDEF 2.20cdBCD 7.03dG 7.10dG
360
min
2.86cBC 0.74bA 0.84abA 2.43cB 1.03bA 0.80cA 3.40bcBCD 3.47cCD 3.64cCD 4.38cD 3.58dCD 3.66cCD 2.75dBC 7.03dE 7.10dE
Means in the same column not followed by the same lowercase letters are significantly different (P < 0.05) in terms of treatment time
Means in the same row not followed by the same uppercase letters are significantly different (P < 0.05) in terms of probiotic mixture, probiotic species and food matrix
Numbers with an asterisk (*) indicates a log CFU increment, not a log CFU reduction
Page 138
126
Fig. legends
Fig. 5.1.- Reduction of mixed cell populations (log CFU) of probiotic products C (A), N
(B) and U (C) in full-fat peanut butter (FF), reduced-fat peanut butter (RF) and “no
peanut butter control” (C) during a 6 h (360 min) simulated gastrointestinal study
Page 139
127
Fig. 5.1. Klu et al.
A
B
C
Page 140
128
CHAPTER 6
INFLUENCE OF PROBIOTICS IN PEANUT BUTTER ON THE FATE OF
SELECTED SALMONELLA AND LISTERIA STRAINS UNDER SIMULATED
GASTROINTESTINAL CONDITIONS
1 Klu, Y.A.K., R.D. Phillips and J. Chen. 2014. To be submitted to Applied and
Environmental Microbiology.
Page 141
129
ABSTRACT
This study sought to observe the behavior of probiotics and Salmonella enterica
or Listeria monocytogenes co-inoculated into peanut butter during a simulated
gastrointestinal study. Homogenates of peanut butter co-inoculated with Salmonella or
Listeria (5 log CFU/mL) and lyophilized or cultured probiotics (9 log CFU/mL) was
exposed to simulated gastrointestinal conditions, and samples inoculated with only
pathogens served as controls. Sample pH, titratable acidity and pathogen populations
were determined during a 24 h period at 37oC. An agar diffusion assay was performed to
determine the inhibitory effect of probiotic culture supernatants with either natural (3.80,
3.78 or 5.17) or neutralized (6.0) pH and fresh broths with their pH acidified to levels of
the probiotic culture supernatants. Antibacterial activity of crude bacteriocin extracts was
evaluated against Salmonella and Listeria. After the 24 h assay period, samples with
probiotics had lower pH and higher titratable acidity than those without probiotics.
Overall, the presence of probiotics caused a significant reduction (p < 0.05) in pathogen
populations in simulated gastrointestinal fluid. Filter-sterilized supernatants of
Bifidobacterium and Lactobacillus cultures inhibited pathogen growth. However, the
elevation of pH diminished their antibacterial activities. When acidified fresh broths
were used, the effect of low pH on pathogen inhibition was observed. Crude bacteriocin
extracts had a stain-specific inhibitory effect only towards L. monocytogenes. Probiotic
bacteria in the "probiotic peanut butter" survived simulated gastrointestinal conditions
and were able to inhibit the growth of Salmonella and Listeria. Results suggest peanut
butter is a plausible carrier to deliver probiotics to improve gastrointestinal health.
Page 142
130
Approximately 760,000 pre-school children in the developing countries die from diarrhea
related causes each year (1). The burden of diarrhea on the persons affected, the public
health sector and the total economic development of a nation is so large that it is
estimated that 13% of all Disability Adjusted Life-Year, defined as the sum of years of
potential life lost due to premature mortality and the years of productive life lost due to
disability, are caused by diarrhea (2). Another devastating medical condition, severe
acute malnutrition affects almost 20 million preschool children worldwide and is a
causative factor of a third of the deaths that occur in these children (1). A vicious cycle
exists between malnutrition and diarrhea; and diarrhea is both a cause and a consequence
of malnutrition in pre-school children (1, 3, 4).
Reports of numerous clinical studies suggest that probiotics are effective in
controlling, managing and preventing diarrhea in children. The proposed mechanisms of
actions of probiotics include immunomodulation, barrier function enhancement,
cytoprotective effects and antimicrobial functions (5). Specific benefits of probiotics in
terms of promoting gastrointestinal health include inhibition of pathogen growth,
prevention of attachment and colonization via antagonism (5-9). There is much research
interest on the effectiveness of specific genus and strains of probiotics, and how their
usage as single strains or mixtures exhibit proposed health benefits (10-13). For these
mechanisms of actions to occur, it is important that the probiotic bacteria survive in the
gastrointestinal tract and colonize the intestinal walls. It has been documented that food
matrixes help in probiotic survival and colonization (14, 15) thus the type of food matrix
may influence probiotic actions. Peanut butter is being used as major ingredient of
Ready to Use Therapeutic Foods (RUTFs) for the treatment of severe malnutrition.
Page 143
131
Studies conducted in our laboratory have showed that peanut butter matrix is able to
protect different probiotic bacteria during storage (16, 17) and under simulated
gastrointestinal conditions (18). Thus, "probiotic peanut butter" has been identified as a
possible intervention to address malnutrition and diarrhea concurrently in the developing
countries. The purpose of this study was to observe the behavior of probiotics and
Salmonella enterica or Listeria monocytogenes co-inoculated in peanut butter during a
simulated gastrointestinal study and the ability of probiotics to inhibit the growth of the
two pathogens.
MATERIALS AND METHODS
Peanut butter, probiotics and pathogens. Peanut butter was kindly provided by the
American Blanching Company (Fitzgerald, GA, USA). A commercial probiotic product
designated as N was used in the project. The product had a manufacturer’s claim of 16
billion live cells per g of powder and was made up of 16 different probiotic bacteria
which included Streptococcus thermophiles, Bifidobacterium bifidum, Bifidobacterium
breve, Bifidobacterium lactis, B. lactis Bif Relief 24-7™, Bifidobacterium longum,
Lactobacillus acidophilus, Lactobacillus brevis, Lactobacillus bulgaricus, Lactobacillus
casei, Lactobacillus gasseri, Lactobacillus paracasei, Lactobacillus plantarum,
Lactobacillus rhamnosus, Lactobacillus salivarius and Lactococcus lactis. The
pathogens used in this study included Salmonella Typhimurium 4-1, Salmonella
Heidelberg 4-2, Salmonella Enteritidis 4-56, Listeria monocytogenes 7764, L.
monocytogenes 7969 and L. monocytogenes 8733. All the pathogen strains are from our
laboratory culture collections.
Page 144
132
Preparation of bacterial inocula. Bifidobacterium species in probiotic mixture
N were grown on modified Bifidobacterium agar which include 42.5 g Columbia agar
base, 2.5 g glucose, 0.01 riboflavin (Fisher Scientific, Fair Lawn, NJ, USA), 2.5 g
lactulose (EMD Chemicals Inc. San Diego, CA, USA) and 0.5 g L-Cysteine HCl (Sigma-
Aldrich, St. Louis, MO, USA) per liter of media. The pH of the media was adjusted to
5.5 ± 0.2 by the addition of propionic acid (J.T. Baker, Phillipsburg, NJ, USA). The de
Man, Rogosa and Sharpe (MRS) agar was used to grow Lactobacillus species. L. lactis
and S. thermophilus were grown on M17 agar supplemented with 0.5% (final
concentration) of lactose. The media were purchased from Becton, Dickinson and Co.
(Sparks, MA, USA). All probiotic bacteria were incubated under anaerobic conditions
for 48-72 h using the BD GasPak™ EZ in a BBL GasPak® System (Becton, Dickinson
and Co.). After the incubation, each probiotic culture was harvested with sterile distilled
water. Equal numbers of each culture were mixed using a vortex mixer (Fisher
Scientific) to form a single, uniform probiotic inoculum (ca. 1010 CFU/mL). Inoculum of
lyophilized probiotics was prepared by mixing 1 g of lyophilized probiotic powder in 9
mL of sterile water, and the bacterial cell population in the inoculum was ca. 1010
CFU/mL.
Each strain of Salmonella or Listeria was grown for 16-18 h in tryptic soy broth
(TSB; Becton, Dickinson and Co.) under aerobic condition. To form a 3-strain mixture,
equal number of cells of each strain was mixed. The two pathogen mixtures were serially
diluted in sterile water to a level of ca. 6 log CFU/mL.
Simulated gastrointestinal studies. Gastrointestinal conditions were simulated
by adopting a method described by (19). The peanut butter was suspended in 0.5% NaCl
Page 145
133
solution, and the samples were mixed by vigorous manual to-and-fro shaking at an arm
angle of about 45° for 1 min. Resulting peanut butter homogenate was inoculated with
the three-strain mixture of S. enterica or L. monocytogenes to a level of ca. 5 log
CFU/mL. Ten mL of each inoculated peanut butter homogenate was transferred into a
sterile 50 mL polypropylene conical tube (Becton, Dickinson and Co.) and subsequently
inoculated with either lyophilized probiotic powder or fresh grown probiotic cultures of
product N at 9 log CFU/mL. The control sample was only inoculated with Salmonella or
Listeria at ca. 5 log CFU/mL.
To mimic digestion in the stomach, the pH (ca. 6) of the samples was adjusted to
1.6 with 1 M HCl solution (Fisher Scientific). Pepsin from porcine gastric mucosa
(Sigma-Aldrich, St. Louis, MO, USA) and lipase from Rhizopus arrhizus (Sigma-
Aldrich) were added to reach a concentration of 0.03 g/10 mL and 0.009 g/10 mL,
respectively. Samples were incubated for 2 h at 37 °C with an agitation of 150 rpm in a
G24 Environment Incubator Shaker (New Brunswick Scientific Co., Edison, NJ, USA) to
mimic the gastric phase. After the incubation, the pH of the samples was adjusted to ca.
4.7 using a sterile alkaline solution (1 liter contains 150 mL of 1M NaOH and 14 g of
NaH2PO4). Bile of bovine source (Sigma-Aldrich) and pancreatin from porcine pancreas
(Sigma-Aldrich) were subsequently added to reach a concentration of 0.1 g/10 mL and
0.01 g/10 mL, respectively. Samples were incubated for 2 h (enteric phase 1) under the
conditions specified above. After the 2 h incubation, the alkaline solution was used to
further increase the pH of the samples to 7.1. In addition, the concentrations of bile and
pancreatin were adjusted to 0.1 g/10 mL and 0.01 g/10 mL respectively. The samples
were incubated for 20 h at the abovementioned conditions, to achieve a total of 24 h
Page 146
134
assay. At 2 h, 4 h, 6 h, 9 h, 12 h and 24 h intervals, aliquots were collected and pathogen
and probiotic populations were enumerated as described below. All enzymatic solutions
used in the experiments were suspended in water and sterilized using sterile syringes
(Becton, Dickinson and Co.) and 0.45 µm sterile nylon filter units (Fisher Scientific).
Bacterial enumeration. Collected samples were serially diluted and when
necessary and 0.1 mL of appropriately diluted samples were plated on the following
microbiological media. Bismuth sulfite agar was used for the enumeration of Salmonella
whiles Modified Oxford Agar (MOX) supplemented with moxalactam sodium (20 mg/L)
and colistin sulphate (10 mg/L) was used to enumerate Listeria. Lactobacillus selection
(LBS) agar and MRS agar were used for the enumeration of Lactobacillus species. LBS
agar modified with filtered tomato juice (200 mL/L; LBST) was used to enhance the
growth of L. acidophilus. Both LBS and LBST were prepared with the addition of 1.32
mL of glacial acetic acid (Fisher Scientific) per L of media. L. lactis and S. thermophilus
were enumerated on M17 agar supplemented with 0.5% lactose solution and
Bifidobacterium species were enumerated on modified Bifidobacterium agar as described
above. The media were purchased from Becton, Dickinson and Co. Salmonella and
Listeria were incubated at 37 °C for 24–48 h. Probiotic bacteria species were incubated
under anaerobic conditions as described above. All cell colonies were counted using the
Leica Quebec Darkfield Colony Counter (Leica, Buffalo, N.Y., U.S.A.).
Changes in sample pH and acidity during simulated gastrointestinal study.
At each sampling points, aliquots were collected and the pH and titratable acidity was
measured. Sample pH was determined using a pH meter (model 8000; VWR
Page 147
135
International, PA, USA). Titratable acidity was performed according to the method
described by (20).
Organic acid profiles in probiotic culture supernatants. To determine the
major type and amount of organic acids produced by the probiotic bacteria, supernatants
of 72 h probiotic cell cultures in M17, MRS, and MRS supplemented with 5% (v/v)
cysteine HCl were analyzed (Covance, Madison, WI, USA) using a reversed phase HPLC
with UV detection specified in the AOAC Official Method 986.13.
Inhibition of pathogens by probiotic culture supernatants. MRS broth
supplemented with 5% (v/v) cysteine HCl (Sigma-Aldrich) was used to grow
bifidobacteria in probiotic mixture N while MRS and M17 broths (Becton, Dickinson and
Co.) were used for cultivating lactobacilli and streptococci/lactococci, respectively. The
lyophilized probiotic mixture was inoculated into each broth and incubated at 37 °C for
48-72 h under anaerobic conditions as described above. After incubation, the broths were
centrifuged at 10,000 g for 15 min at 4 °C using an Eppendorf 5810 R Centrifuge
(Eppendorf, Hamburg, Germany). Thereafter, the cell-free supernatants obtained were
filter sterilized as described above. The pH of a portion of the supernatant was adjusted
to 6.0 using sterile NaOH (Fisher Scientific). In addition, fresh, sterile MRS and M17
broths with their pH acidified, with acetic acid and lactic acid, to levels of probiotic
culture supernatants (3.80 from Lactobacillus culture, 3.78 from Bifidobacterium culture
and 5.17 from Streptococcus/Lactococcus cultures) were included in the agar diffusion
assay. Inorganic acid HCl was used as a comparison.
Each strain of S. enteric and L. monocytogenes were grown overnight in tryptic
soy broth (Becton, Dickinson and Co.). Confluent bacterial lawns were made by
Page 148
136
inoculating the overnight cultures (diluted to 5 log CFU/mL) on tryptic soy agar (Fisher
Scientific) using a sterile cotton swab. Holes of 4 mm in diameter were punched and
added into the holes were a 100 µL aliquot of probiotic culture supernatants with natural
or neutralized pH as well as acidified MRS and M17 broths. The resulting plates were
incubated upright at 37 °C for 24 h. The diameter of inhibition zones formed on the
bacterial lawn was measured after the incubation.
Inhibition of pathogens by crude bacteriocin extracts. Lactobacilli,
bifidobacteria and streptococci/lactococci from probiotic mixture N were incubated in
their respective broths as described above. Cell-free supernatants prepared according to
procedures described above were precipitated at 25 °C with 80% ammonium sulfate
(Fisher Scientific). Precipitated materials were collected by centrifugation at 10,000 g for
20 min at 4 °C and the precipitate was re-suspended in dipotassium phosphate buffer (pH
6.0; Fisher Scientific) and dialyzed against sterile water using a 1000, Mr Spectra/Por® 7
Membrane (Spectrum Laboratories, Inc., Rancho Dominguez, CA, USA) at 4 °C for 20 h
with a change of sterile water within 2 h and 4 h of the dialysis. Crude bacteriocin
extract of each probiotic species was subsequently used in an agar diffusion test as
described above.
Statistical analysis. Experiments were conducted in four trials with replicate
samples at each trial. The data obtained was analyzed using a 3-way Analysis of
Variance F-test and the General Liner Model of Statistical Analysis Software (SAS Inst.
Inc., Cary, NC, USA). At a confidence level of 95%, Fisher’s Least Significant
Difference Design was used to compare the significance of differences among pathogen
populations in different treatment groups (pathogen alone, pathogen with cultured
Page 149
137
probiotics, pathogen with lyophilized probiotics) during simulated gastrointestinal
passage. Additionally, the differences among the zones of inhibition formed by
individual strains of bacterial pathogens or crude bacteriocin extracts and among various
treatment groups were compared using the same statistical protocol.
RESULTS
Changes in pathogen populations during simulated gastrointestinal passage. Table
6.1 depicts cell populations of L. monocytogenes and S. enterica in peanut butter
homogenates with or without probiotics during the simulated gastrointestinal passage.
On the average there were no significant differences in the average populations of the two
pathogens. Furthermore, by average, the populations of the pathogens in peanut butter
homogenates without probiotic mixture N were significantly higher (p < 0.05) than the
pathogen populations in peanut butter homogenates with inoculated probiotics. There
was no significant difference (p > 0.05) between the populations of pathogens co-
inoculated with cultured probiotics or lyophilized probiotics.
Changes in the cell populations of Salmonella strains during the 24 h simulated
gastrointestinal study are presented in Table 6.2. S. enterica had relatively lower
populations in samples without probiotics at the first 4 h of the simulated study (p < 0.05;
Table 6.2). Thereafter, a significant increase in Salmonella counts was observed at each
sampling point till 24 h sampling interval (p < 0.05). When S. enterica was co-inoculated
with cultured probiotics, no specific trend was observed during the first 6 h of the
experiment. At the 9 and 12 h sampling points, however, the populations of Salmonella
increased and were not significantly different from the initial counts (p > 0.05). At the
Page 150
138
end of the experiment, ca. a 3 log cell count decrease was observed comparing to the
results obtained at 12 h sampling point (p < 0.05).
S. enterica population in samples co-inoculated with lyophilized probiotics had a
similar trend of change in population that occurred in samples co-inoculated with
cultured probiotic (p > 0.05; Table 6.2). Although at each sampling point, there were
differences in S. enterica counts among the 3 treatment groups, statistically, there were
no significant differences in the counts apart from populations observed at the end of the
experiment. The counts of S. enterica in samples co-inoculated with the two types of
probiotics had similar (p > 0.05) counts which was significantly higher than Salmonella
populations in samples without the supplementation of probiotics.
In Table 6.3, L. monocytogenes populations in samples without the probiotics
decreased throughout all sampling points but increased rapidly at the 24 h sampling point.
There were no significant differences in the population of L. monocytogenes co-
inoculated with lyophilized probiotic bacteria throughout the entire study period. Similar
to what was observed with samples inoculated with S. enterica in Table 6.2, throughout
the study period, L. monocytogenes populations across the three treatment groups at all
sampling points were statistically similar except at the 4 h and 24 h sampling points. At
4 h sampling point, the counts of L. monocytogenes co-inoculated with cultured probiotic
bacteria was lower (p < 0.05) than those in the other two samples. At the end of the
study, L. monocytogenes populations in samples without the probiotics had significantly
higher cell counts (p < 0.05) than those in samples co-inoculated with probiotics.
Organic acid profile in probiotic culture supernatants. The organic acid
profile in the supernatants of probiotic bacterial cultures is shown in Table 6.4. All three
Page 151
139
probiotic species produced significantly higher amount of lactic acid than acetic acid (p <
0.05). Lactobacillus species produced the highest amount of organic acids, followed by
Bifidobacterium and then Streptococcus (p < 0.05).
Changes in sample pH and titratable acidity. Fig. 6.1 gives a graphical
representation of the changes in sample pH and titratable acidity as simulated
gastrointestinal study proceeded. The Figures show that samples inoculated with S.
enterica and L. monocytogenes followed similar trends in changes in pH and titratable
acidity during the simulated gastrointestinal study. The pH of the samples were the
lowest (ca. 2.5) at the beginning of the study and a gradual increase in pH was observed
till the 6 h sampling point (ca. 6.80). From the sampling point at 9th h to the 24th h, there
was a gradual decrease in sample pH (Figs. 6.1A and 6.1B). From the onset of the
experiment through to the 6 h sampling points, samples with and without probiotics had
similar pH values. However, from 12 h onwards, a smaller decrease in pH was observed
in the control samples (Figs. 6.1A and 6.1B). Samples inoculated with S. enterica and
cultured or lyophilized probiotics had similar pH values from 12 to 24 h (Fig. 6.1A),
however samples inoculated with L. monocytogenes and cultured probiotics had lower pH
values than those with L. monocytogenes and lyophilized probiotics (Fig. 6.1B).
Fig. 6.1 also shows the trend in titratable acidity as the simulated gastrointestinal
study proceeded. At 2 h sampling point, the titratable acidity observed from samples
inoculated with both S. enterica and L. monocytogenes increased from the initial values
(Figs. 6.1A and 6.1B) except for the samples inoculated with Listeria and lyophilized
probiotics (Fig. 6.1A). At the 4 h sampling point, titratable acidity decreased in all
samples (Fig. 6.1). Thereafter, gradual increases were observed in titratable acidity for
Page 152
140
all samples. At the end of 24 h assay, the titratable acidity of samples inoculated with S.
enterica or L. monocytogenes alone were lower than that of samples co-inoculated with
probiotics (Fig. 6.1). Additionally, the titratable acidity value in samples with lyophilized
probiotics was lower than samples with cultured probiotics.
Inhibition of pathogens by probiotic culture supernatants. The supernatants
of Bifidobacterium and Lactobacillus cultures with natural pH values were effective
against the 3 Salmonella (Table 6.5) and Listeria (Table 6.6) strains used in the study.
When the pH of the supernatant was adjusted to 6.0, the antibacterial activity of probiotic
culture supernatants diminished. When the pH of fresh broths was lowered to the level of
probiotic cell culture supernatant, zones of inhibition of various sizes were observed.
Broths with their pH adjusted by HCL exhibited a greater inhibition towards S.
Heidelberg and S. Enteritidis than to S. Typhimurium, and acetic acid had a greater
inhibition against S. Typhimurium than to the other two Salmonella strains (Table 6.5).
Lactic acid was equally inhibitory to all 3 Salmonella strains.
The supernatants of Bifidobacterium and Lactobacillus cultures with natural pH
had a greater inhibition was observed with L. monocytogenes strain 7764 compared with
the other two strains used in the study (Table 6.6). As observed with Salmonella,
supernatants with neutralized pH lost the inhibitory activity against Listeria. The pH of
fresh broths lowered by HCL only inhibited the growth of strain 8733 while the pH of the
broths lowered by the other two acids were equally inhibitory to all 3 Listeria strains.
The supernatants of Streptococcus/Lactococcus cell culture had no inhibitory effects on
S. enterica and L. monocytogenes (Table 6.5 and Table 6.6). However, those of
Lactobacillus and Bifidobacterium cell culture had similar inhibitory effects (p > 0.05).
Page 153
141
Inhibition of pathogens by crude bacteriocin extracts. Crude bacteriocin
extracts from the cell cultures of Lactobacillus and Bifidobacterium exhibited a similar (p
> 0.05) inhibition against L. monocytogenes 8733and 7969 which were unsusceptible to
the extract from Streptococcus/Lactococcus (Table 6.7). The growth of L. monocytogens
strain 7764 was inhibited by all three crude bacteriocin extracts. However, the level of
inhibition from the extract from Streptococcus/Lactococcus cell culture supernatant was
significantly lower than the supernatants of Lactobacillus and Bifidobacterium cultures.
None of the extracts had any activity against the 3 Salmonella strains used in the study
(data not shown). It must also be noted that the zones of inhibition formed by bacteriocin
were fainter and less distinct that zones formed by cell free supernatants.
DISCUSSION
Results in Table 6.1 show that probiotic bacteria in peanut butter were able to
inhibit pathogen growth under simulated gastrointestinal conditions after a 24 h
incubation period. These results were consistent with those of an earlier study by (20)
who incubated S. Enteritidis (105 CFU/mL) with two strains of L. paracasei and a strain
of L. acidophilus (109 CFU/mL) in a laboratory system without food matrix for a period
of 24 h. In comparison to control, the presence of probiotics resulted in a 7 log reduction
in the Salmonella counts. It was observed by (21) that the growth inhibition of
Salmonella, E. coli and Campylobacter strains by co-inoculated probiotics only occurred
after a 9-24 h incubation period. A similar observation was made in this study as
inhibition of Salmonella and Listeria was only observed at the 24 h sampling point
(Tables 6.2 and 6.3). The observations made in this and the previous studies suggest that
Page 154
142
probiotic bacteria need to have an active metabolic activity within a certain time period in
order to be able to inhibit the growth of pathogens. It was stated by (23) that the resident
time for intestinal contents in the colon is 20-32 h whereas it is only 2-4 h from the
stomach up to the ileum. Since probiotics are proposed to exert their beneficial effects in
the large intestines, the results of the present study suggest that probiotic bacteria in
peanut butter should have sufficient time to interact with co-ingested foodborne
pathogens in human gastrointestinal tracts.
In the present study lactic acid and acetic acid were the major contributors to the
growth inhibition of S. enterica and L. monocytogenes. Similar results have been
reported by (24). The samples included in the simulated gastrointestinal study all had a
gradual increase in titratable acidity and decrease in pH (Fig. 6.1). However, samples
with probiotics had a greater pH reduction because the production of organic acids is a
major metabolic activity of lactic acid bacteria (25). A greater inhibition in pathogen
growth occurred in samples with lower pH and high titratable acidity (Tables 6.2 and 6.3;
Fig. 6.1). When sample pH was neutralized the inhibitory effects of probiotic culture
supernatants against Salmonella and Listeria diminished (Tables 6.2 and 6.3; Fig. 6.1).
In a previous study, cell free supernatants of Lactobacillus or Bifidobacterium with pH
4.0-4.9 inhibited the growth of enteroaggregative E. coli; however no inhibitory effect
was observed when the pH of the supernatant was adjusted to 7.0 (26). In another study,
cell free supernatants of four strains of Lactobacillus and one strain of Bifidobacterium
conferred a significantly greater inhibition on S. Enteritidis and other enteropathogens
than did neutralized cell free supernatants (22). A growth inhibition of S. Typhimurium
by cell free culture supernatants of Bifidobacterium was reported but when the pH of the
Page 155
143
control medium and cell free culture supernatants was raised to 6.5, weaker growth
inhibition was observed (24). Similarly, it was reported by (21) that when cell free
supernatants were neutralized, no inhibitory effect against Salmonella was observed. The
ability of spent culture supernatants of Lactobacillus strains to inhibit the growth of some
pathogenic bacteria including S. Typhimurium was observed by (27). Furthermore, (12)
reported a reverse relationship between the pH of cell free supernatants and growth
inhibition of S. Typhimurium by some strains of Bifidobacterium, Lactobacillus,
Lactococcus and Streptococcus.
According to results shown in Tables 6.5 and 6.6, HCl had a poorer inhibition to
the growth of Salmonella and Listeria comparing to the two organic acids. Similar
phenomenon was observed by (24). The antibacterial activity of organic acids is mainly
from the undissociated form of the acids (12, 28, 29). The non-ionized form of the acids
passes through bacterial cell membranes and then becomes ionized in the cytoplasm to
release protons that decrease intracellular pH, inhibit the metabolic activity of bacteria
and eventually cause cell death (24, 29). Strong inorganic acids like HCl are completed
dissociated into anions and protons when in solution. Cell membranes have poor
permeability to protons. However, some protons are capable of entering the cytoplasm
by interacting with the proton transport system of the cells and thus HCl has a weaker
inhibition towards pathogens (30).
Presence of bacteriocins is another likely reason for the observed growth
inhibition of Listeria when it co-existed with probiotics under simulated gastrointestinal
conditions. Bacteriocins are small peptides or proteins, produced by lactic acid bacteria
that possess activity against other gram positive bacteria such as L. monocytogenes and
Page 156
144
Staphylococcus aureus (31, 32). Although the mechanism of bacteriocin against bacterial
pathogens is not fully understood, it was proposed that bacteriocins are able to recognize
and interact with receptor molecules on bacterial surfaces. This action destabilizes
bacterial cell membrane by a detergent-like or pore making action (32, 33). The changes
that occur in the membrane induces the depletion of proton motive force which is an
electrochemical gradient serving as driving force for bacterial cellular and metabolic
activities, thus a depletion of it induces bacterial death. The disruption of cell membrane
by bacteriocin also causes a depletion in intracellular ATP levels and release of
intracellular ions and other cytoplasmic contents which eventually causes the death of
bacterial cells (34). In a well diffusion assay with neutralized cell free supernatants of
several lactic acid bacterial strains, (35) it was also observed that inhibition zones were
formed on lawns of L. monocytogenes. In a further test the inhibition zones were reduced
in the presence of proteinase K, suggesting that inhibition of Listeria was due to a
proteinaceous molecule, probably a bacteriocin. Some authors have however reported
results contradictory to that of this study. In a study by (36) their finding was that, the
antibacterial activity of 17 strains of lactobacilli against some pathogens including L.
monocytogenes was largely due to the action of organic acids and bacteriocin activity
contributed little to the antibacterial activity. Interestingly, in the present study we found
that cell free supernatants of Streptococcus/Lactococcus did not exhibit any inhibitory
effects on L. monocytogenes 7764 (Table 6.3) whereas crude bacteriocin extract from the
same species inhibited its growth (Table 6.7). Further studies are needed to confirm the
identity of functional molecules in the crude bacteriocin extract and how they inhibited
the growth of Listeria.
Page 157
145
In the present study, the growth of Listeria was inhibited by crude bacteriocin
extracts prepared from cell free supernatants of Bifidobacterium and Lactobacillus (Table
6.7), but the growth of Salmonella was not affected (Data not shown). Previous studies
have shown that bacteriocins produced by probiotics are usually not effective towards
gram negative bacteria such as Salmonella and E. coli but organic acids produced by the
same probiotics have been shown to have inhibitory effects towards these pathogens (31,
37). The outer membrane of Gram-negative bacteria comprises a complex
lipopolysaccharide which provides a rigid barrier. This outer membrane is hydrophilic in
nature and it acts as a protective outer barrier to the influx of foreign substances including
macromolecules and hydrophobic solutes. Thus, bacteriocins do not generally inhibit the
growth of Gram-negative bacteria unless their cell membrane is compromised (38-40).
The growth inhibition of Clostridium difficile, E. coli and S. Typhimurium by the
overnight cultures of different mixtures of probiotic bacteria was reported by (41). A
Lactobacillus mixture comprising L. acidophilus, L. bulgaricus, L. casei, L. plantatum, L.
rhamnosus, L. salivarius, L. fermentum and L. helveticus produced the biggest zone of
inhibition followed by a Bifidobacterium mixture (B. bifidum, B. breve, B. infantis, and B.
longum) and then L. lactis and S. thermophilus mixture. Similar results were observed in
the present study with the exception of what was observed with L. lactis and S.
thermophilus mixture. Even though the cell free supernatants of streptococci and
lactococci cultures contained some amounts of lactic and acetic acids, results from Tables
6.5 and 6.6 show that the supernatants did not inhibit either Salmonella or Listeria. It is
the possible the concentration of organic acids in the streptococci/lactococci supernatants
was not high enough to inhibit the growth of the pathogens. A study by (12) has shown
Page 158
146
that concentrated cell free supernatants of selected probiotics provided greater inhibitions
towards pathogenic microorganisms than non-concentrated supernatants.
In conclusion, results from the present study suggests that, selected probiotics in
peanut butter is able to inhibit the growth of S. enterica and L. monocytogenes under
simulated gastrointestinal conditions. The production of organic acids by the probiotics
inhibited the growth of both Salmonella and Listeria, however, bacteriocin production is
likely to have further contributed to growth inhibition of Listeria. Results also suggest
that peanut butter is a plausible carrier for probiotics and could be used in the
management of ailments caused by foodborne pathogens.
Acknowledgements
This research was partially supported by the Peanut Collaborative Research
Support Program. Sincere appreciation goes to Mr. Edward Parker of the American
Blanching Company and Jerry Davis of the University of Georgia.
References
1. World Health Organization (WHO). 2013. Diarrheal disease.
http://www.who.int/mediacentre/factsheets/fs330/en/.
2. World Health Organization (WHO). 2011. World Health Statistics.
3. The United Nations Children's Emergency Fund (UNICEF)/World Health
Organization (WHO). 2009. Diarrhea: Why children are still dying and what can be
done.
http://apps.who.int/iris/bitstream/10665/44174/1/9789241598415_eng.pdf.
Page 159
147
4. Manary M, Iannotti L, Trehan I. Weisz A. 2012. Systematic review of the care of
children with diarrhea in the community-based management of severe acute
malnutrition.
http://www.who.int/nutrition/publications/guidelines/updates_management_SAM_inf
antandchildren_review4.pdf.
5. Amalaradjou MAR, Bhunia AK. 2012. Modern approaches in probiotics research
to control foodborne pathogens. Adv. Food Nutr. Res. 67:185-239.
6. Servin AL. 2004. Antagonistic activities of lactobacilli and bifidobacteria against
microbial pathogens. FEMS Microbiol. Rev. 28:405 440.
7. De Keermaecker SCJ, Verhoeven TLA, Desair J, Marchal K, Vanderleyden J,
Nagy I. 2006. Strong antimicrobial activity of Lactobacillus rhamnosus GG against
Salmonella typhimurium due to the accumulation of lactic acid. FEMS Microbiol.
Lett. 259:89-96.
8. Ridwan BU, Koning CJM, Besselink MGH, Timmerman HM, Brouwer EC,
Verhoef J, Gooszen HG, Akkermans LMA. 2008. Antimicrobial activity of a
multispecies probiotic (Ecologic 641) against pathogens isolated from infected
pancreatic necrosis. Lett. Appl. Microbiol. 46:61-67.
9. Corr SC, Hill C, Gahan CGM. 2009. Understanding the mechanisms by which
probiotics inhibit gastrointestinal pathogens. Adv. Food Nutr. Res. 56:1-15.
10. Chapman CMC, Gibson GR, Rowland I. 2011. Health benefits of probiotics: are
mixtures more effective than single strains? Eur. J. Nutr. 50:1-17.
Page 160
148
11. Chapman CMC, Gibson GR, Rowland I. 2012. In vitro evaluation of single-and
multi-strain probiotics: interspecies inhibition between probiotic strains, and
inhibition of pathogens. Anaerobe 18:405-413.
12. Tejero-Sariñena S, Barlow J, Costabile A, Gibson GR, Rowland I. 2012. In vitro
evaluation of the antimicrobial activity of a range of probiotics against pathogens:
evidence of the effects of organic acids. Anaerobe 18:530-538.
13. Tejero-Sariñena S, Barlow J, Costabile A, Gibson GR, Rowland I. 2013.
Antipathogenic activity of probiotics against Salmonella typhimurium and
Clostridium difficile in anaerobic batch culture systems: is it due to synergies in
probiotic mixtures or the specificity of single strains? Anaerobe 24:60-65.
14. Huang Y, Adams MC. 2004. In vitro assessment of the upper gastrointestinal
tolerance of potential probiotic dairy propionibacteria. Int. J. Food Microbiol.
91(3):253-260.
15. Ranadheera RDCS, Baines SK, Adams MC. 2010. Importance of food in probiotic
efficacy. Food Res. Int .43:1-7.
16. Klu YAK, Williams JH, Phillips RD, Chen J. 2012. Survival of Lactobacillus
rhamnosus GG as influenced by storage conditions and product matrixes. J. Food Sci.
77(12):659-663.
17. Klu YAK, Phillips RD, Chen J. 2014. Survival of four commercial probiotic
mixtures in full fat and reduced fat peanut butter. Food Microbiol. doi:
10.1016/j.fm.2014.04.018.
18. Klu YAK, Phillips RD, Chen J. Effect of peanut butter matrices on the fate of
probiotics during simulated gastrointestinal passage (Unpublished data).
Page 161
149
19. Buriti FCA, Castro IA, Saas SMI. 2010. Viability of Lactobacillus acidophilus
in synbiotic mousses and its survival under in vitro simulated gastrointestinal
conditions. Int. J. Food Microbiol. 137:121-129.
20. Nielsen SS. 2003. pH and titratable acidity, 207. Sadler GD, Murphy PA, Food
Analysis, 3rd ed, Kluwer Academic/Plenum Publishers, New York, NY.
21. Drago L, Gismondo MR, Lombardi A, de Haën C, Gozzini L. 1997. Inhibition of
in vitro growth of enteropathogens by new lactobacillus isolates of human intestinal
origin. FEMS Microbiol. Lett. 153:455-463.
22. Fooks LJ, Gibson GR. 2002. In vitro investigations of the effect of probiotics and
prebiotics on selected human intestinal pathogens. FEMS Microbiol. Ecol. 39:67-75.
23. Alander M, De Smet I, Nollet I, Verstraete W., von Wright A, Mattila-Sandholm
T. 1999. The effect of probiotic strains on the microbiota of the Simulator of the
Human Intestinal Microbial Ecosystem (SHIME). Int. J. Food Microbiol. 46(1):71-
79.
24. Makras L, De Vuyst L. 2006. The in vitro inhibition of Gram-negative pathogenic
bacteria by bifidobacteria is caused by the production of organic acids. Int. Dairy J.
16:1049-1057.
25. Shah NP. 2007. Functional cultures and health benefits. Int. Dairy J. 17:1262-1277.
26. Miyazaki Y, Kamiya S, Hanawa T, Fukuda M, Kawakami H, Takahashi H,
Yokota H. 2010. Effect of probiotic bacterial strains of Lactobacillus,
Bifidobacterium and Enterococcus on enteroaggregative E. coli. J. Infect. Chemother.
16:10-18.
Page 162
150
27. Tsai C, Hsih H, Chiu H, Lai Y, Liu J, Yu B, Tsen H. 2005. Antagonistic activity
against Salmonella infection in vitro and in vivo for two Lactobacillus strains from
swine and poultry. Int. J. Food Microbiol 102:185-194.
28. Hsiao CP, Siebert KJ. 1999. Modeling the inhibitory effects of organic acids on
bacteria. Int. J. Food Microbiol 47:189-201.
29. Carey CM, Kostrzynska M, Ojha S, Thompson S. 2008. The effects of probiotics
and organic acids Shiga-toxin 2 gene expression in enterohemorrhagic Escherichia
coli O157:H7. J. Microbiol. Methods 73:125-132.
30. Lehrke G, Hernaez L, Mugliaroli SL, von Staszewski M, Jagus RA. 2011.
Sensitization of Listeria innocua to inorganic and organic acids by natural
antimicrobials. LWT-Food Sci.Technol. 44:984-99.
31. De Vuyst L, Leroy F. 2007. Bacteriocins from lactic acid bacteria: production,
purification, and food applications. J. Mol. Microbiol. Biotechnol. 13:194-199.
32. Macwana S, Muriana PM. 2012. Spontaneous bacteriocin resistance in Listeria
monocytogenes as a susceptibility screen for identifying different mechanisms of
resistance and modes of actions by bacteriocins of lactic acid bacteria. J. Microbiol.
Methods 88:7-13.
33. Jacquet T, Cailliez-Grimal C, Francius G, Borges F, Imran M, Duval JFL,
Revol-Junelles, A-M. 2012. Antibacterial activity of class IIa bacteriocin Cbn BMI
depends on the physiological state of the target bacteria. Res. Microbiol. 163:323-
331.
34. Montville TJ, Winkowski K, Ludescher RD. 1995. Models and mechanisms for
bacteriocin action and application. Int. Dairy J. 5:797-814.
Page 163
151
35. Maragkoudakis PA, Mountzouris KC, Psyrras D, Cremonese S, Fischer J,
Cantor MD, Tsakalidou E. 2009. Functional properties of novel protective lactic
acid bacteria and application in raw chicken meat against Listeria monocytogenes and
Salmonella Enteritidis. Int. J. Food Microbiol. 130:219-226.
36. Dembélé T, Obdržálek V, Votava M. 1998. Inhibition of bacterial pathogens by
lactobacilli. Zentralblatt für Bakteriologie. 288:395-401.
37. Messaoudi S, Manai M, Kergourlay G, Prévost H, Connil N, Chobert J-M,
Dousset X. 2013. Lactobacillus salivarius: bacteriocin and probiotic activity. Food
Microbiol. 26:296-304.
38. Stevens KA, Sheldon BW, Klapes NA, Klaenhammer TR. 1991. Nisin treatment
for inactivation of Salmonella species and other Gram negative bacteria. Appl.
Environ. Microbiol. 57(12):3613-3615.
39. Helander IM, von Wright A, Mattila-Sandholm T-M. 1997. Potential of lactic acid
bacteria and novel antimicrobials against gram-negative bacteria. Trends Food
Sci.Technol. 8:146-150.
40. Helander IM, Mattila-Sandholm T. 2000. Permeability barrier of the Gram-
negative bacterial outer membrane with special reference to nisin. Int. J. Food
Microbiol. 60:153-161.
41. Chapman CMC, Gibson GR, Rowland I. 2012. In vitro evaluation of single and
multi-strain probiotics: interspecies inhibition between probiotic strains and inhibition
of pathogens. Anerobe 18:405-413.
Page 164
152
Table 6.1.
Average cell populations of Salmonella enterica and Listeria monocytogenes during
simulated gastrointestinal passage
Means in the same column not followed by the same lowercase letters are significantly different (P < 0.05)
in terms of treatment group
Means in the same row not followed by the same uppercase letters are significantly different (P < 0.05) in
terms of pathogen type
Pathogen population (log CFU)
Listeria monocytogenes Salmonella enterica
Without probiotics 4.95aA 5.05aA
With cultured probiotics 3.33bA 3.33bA
With lyophilized probiotics 4.09abA 3.42bA
Page 165
153
Table 6.2.
Changes in populations of Salmonella during a 24 h simulated gastrointestinal passage
with probiotics Salmonella population (log CFU)
Without
probiotics
With cultured
probiotics
With lyophilized
probiotics
Time (h)
0 5.67cA 5.67abA 5.67aA
2 0.89eA 1.24cdA 1.24bcA
4 0.56eA 0.67dA 0.44cA
6 3.07dA 1.64cdA 1.40bcA
9 5.53cA 4.12abA 3.84abA
12 8.87bA 6.51aA 6.16aA
24 10.79aA 3.46bcB 5.19aB
Means in the same column not followed by the same lowercase letters are significantly different (P < 0.05) in terms of study time
Means in the same row not followed by the same uppercase letters are significantly different (P < 0.05) in terms of treatment group
Page 166
154
Table 6.3.
Changes in populations of Listeria monocytogenes during a 24 h simulated
gastrointestinal passage with probiotics
Means in the same column not followed by the same lowercase letters are significantly different (P < 0.05) in terms of study time
Means in the same row not followed by the same uppercase letters are significantly different (P < 0.05) in terms of treatment group
Listeria monocytogenes population (log CFU)
Without
probiotics
With cultured
probiotics
With lyophilized
probiotics
Time (h)
0 5.57bA 5.57aA 5.57aA
2 4.41bcA 4.28abA 4.45aA
4 3.62cAB 2.97abB 3.78aA
6 3.38cA 3.56bA 3.20aA
9 3.60cA 2.48bA 3.61aA
12 3.39cA 3.02abA 3.92aA
24 10.67aA 2.44bB 4.10aB
Page 167
155
Table 6.4.
Organic acid constituent of broths after incubation
Means in the same column not followed by the same lowercase letters are significantly different (P < 0.05) in terms of type of organic
acid
Means in the same row not followed by the same uppercase letters are significantly different (P < 0.05) in terms of species of probiotic
bacteria
Cell culture supernatant
Lactobacillus
Bifidobacterium
Streptococcus
Organic Acid (ppm)
Lactic Acid 19200aA 17900aB 5010aC
Acetic Acid 3520bA 2640bB 2190bC
Page 168
156
Table 6.5.
Inhibition of Salmonella by the supernatants of probiotic cell cultures with natural or
neutralized pH and fresh broths with their pH lowered by different acids
Means in the same row under Salmonella (left column) or Probiotics (right column) not followed by the same letters (P < 0.05) are
significantly different in terms of treatment
The left column (Salmonella) are zones of inhibition formed by different treatments on different strains of Salmonella
The right column (probiotics) are zones of inhibition formed by different treatments on Salmonella by different species of probiotics
Zone of inhibition (mm)
Salmonella Probiotics
Treatment 4-1 4-2 4-56 Lactobacillus Bifidobacterium Streptococcus/
Lactococcus
Probiotic culture
supernatant with
natural pH
9.17a 8.83a 8.50a 13.17a 13.33a 0.00b
Probiotic culture
supernatant with pH
neutralized to 6.0
0.00a 0.00a 0.00a 0.00a 0.00a 0.00a
Fresh broth with pH
lowered by HCl to
3.80, 3.78 or 5.17
3.17b 6.33a 6.50a 8.17a 7.83a 0.00b
Fresh broth with pH
lowered by acetic
acid to 3.80, 3.78
or 5.17
9.33a 7.67b 7.67b 12.50a 12.17a 0.00b
Fresh broth with pH
lowered by lactic
acid to 3.80, 3.78
or 5.17
6.17a 6.50a 5.83a 9.33a 9.17a 0.00b
Page 169
157
Table 6.6.
Inhibition of Listeria monocytogenes by the supernatants of probiotic cell cultures with
natural or neutralized pH and fresh broths with their pH lowered by different acids
Means in the same row under Listeria (left column) or Probiotics (right column) not followed by the same letters (P < 0.05) are
significantly different in terms of treatment
The left column (Listeria) are zones of inhibition formed by different treatments on different strains of Listeria
The right column (probiotics) are zones of inhibition formed by different treatments on Listeria by different species of probiotics
Zone of inhibition (mm)
Listeria Probiotics
8733 7764 7969 Lactobacillus Bifidobacterium Streptococcus/
Lactococcus
Probiotic
supernatant with
natural pH
14.50b 15.67a 14.50b 22.00a 22.67a 0.00b
Probiotic
supernatant with pH
neutralized to 6.0
0.00a 0.00a 0.00a 0.00a 0.00a 0.00a
Fresh broth with pH
lowered by HCl to
3.80, 3.78 or 5.17
9.00a 0.00a 0.00a 4.33a 4.67a 0.00b
Fresh broth with pH
lowered by acetic
acid to 3.80, 3.78 or
5.17
19.33a 19.33a 19.33a 28.00a 30.00a 0.00b
Fresh broth with pH
lowered by lactic
acid to 3.80, 3.78 or
5.17
10.33a 9.67a 9.00a 13.67a 15.33a 0.00b
Page 170
158
Table 6.7.
Inhibition of Listeria monocytogenes by crude bacteriocin extracts
Means in the same row not followed by the same letters (P < 0.05) are significantly different in terms of
strain
Zone of inhibition (mm)
Lactobacillus Bifidobacterium Streptococcus/
Lactococcus
Strain
8733 10.50a 10.00a 0.00b
7764 11.00a 11.00a 5.50b
7969 6.50a 2.50a 0.00a
Page 171
159
Fig. legends
Fig. 6.1.- Changes in pH and titratable acidity (TA; expressed as % acidity) of samples
inoculated with Salmonella enterica (A) or Listeria monocytogenes (B) during a 24 h
simulated gastrointestinal passage. Designation “pH con” and “TA con” refer to samples
inoculated with Salmonella or Listeria only. Designation “pH cul” and “TA cul” are
samples co-inoculated with Salmonella or Listeria and cultured probiotics; and “pH lyo”
and “TA lyo” are samples co-inoculated with Salmonella or Listeria and lyophilized
probiotics.
Page 172
160
Fig. 6.1. Klu et al.
A
B
Page 173
161
CHAPTER 7
CONCLUSIONS
1. The survival of L. rhamnosus GG was influenced by storage temperature and storage
time. Generally, the viability of L. rhamnosus GG decreased in both product types with
increasing storage temperature and storage time. Higher survivability of L. rhamnosus
GG was observed in reduced fat-peanut butter as compared to full-fat peanut butter only
at 37oC. Products stored at 4 oC for 48 wk and at 25 oC for 23 or 27 wk could maintain
probiotic counts of at least 106 CFU/g. These results suggest that peanut butters could be
used to deliver probiotic organisms. However, if one considers the recommendation of
109 CFU as the minimum daily intake, a higher level of probiotic bacteria will have to be
inoculated into peanut butter at the initial stage of the project. This can be easily
accomplished without significant challenges. Results suggest that probitic peanut butter
has the potential to be used as one of the strategies to control diarrhea and malnutrition in
developing countries.
2. Storage conditions played a key role in maintaining the viability of probiotic cultures,
and cell survival rate decreased with increasing storage temperature and time. Overall,
probiotic mixture U has the greatest survival rate followed by B, N and S.
Bifidobacterium species had the highest survivability followed by Lactobacillus species
and then Streptococcus/Lactococcus. Peanut butter is a suitable food matrix to deliver
probiotics, and the fat content of peanut butter did not significantly influence the
survivability of the probiotic mixtures included in the study.
Page 174
162
3. Full-fat and reduced-fat peanut butter homogenates offered equal protection to
probiotic bacteria from products C, N and U during simulated gastrointestinal passage.
Overall, streptococci and lactococci had the highest survival, followed by bifidobacteria
and lactobacilli. At the end of 6 h gastrointestinal passage, in both peanut butter
homogenates, probiotic bacteria from product N had the highest survival, followed by
probiotic bacteria from products U and C. The study suggests that peanut butter matrices
are capable of protecting probiotic bacteria under simulated gastrointestinal conditions
and are likely vehicles to deliver probiotic to children prone to diarrhea.
4. Selected probiotics in peanut butter are able to inhibit the growth of S. enterica and L.
monocytogenes under simulated gastrointestinal conditions. The production of organic
acids by the probiotics inhibited the growth of both Salmonella and Listeria. However,
bacteriocin production is likely to have further contributed to growth inhibition of
Listeria. Results suggest that peanut butter is a plausible carrier for probiotics and could
be used in the management of ailments caused by foodborne pathogens.