DISCUSSION PAPER SERIES Forschungsinstitut zur Zukunft der Arbeit Institute for the Study of Labor Surviving the Crisis: Foreign Multinationals vs Domestic Firms in Ireland IZA DP No. 5882 July 2011 Olivier Godart Holger Görg Aoife Hanley
Transcript
DI
SC
US
SI
ON
P
AP
ER
S
ER
IE
S
Forschungsinstitut zur Zukunft der ArbeitInstitute for the Study of Labor
Surviving the Crisis:Foreign Multinationals vs Domestic Firms in Ireland
IZA DP No. 5882
July 2011
Olivier GodartHolger GörgAoife Hanley
Surviving the Crisis: Foreign Multinationals vs Domestic Firms in Ireland
Olivier Godart Kiel Institute for the World Economy
Any opinions expressed here are those of the author(s) and not those of IZA. Research published in this series may include views on policy, but the institute itself takes no institutional policy positions. The Institute for the Study of Labor (IZA) in Bonn is a local and virtual international research center and a place of communication between science, politics and business. IZA is an independent nonprofit organization supported by Deutsche Post Foundation. The center is associated with the University of Bonn and offers a stimulating research environment through its international network, workshops and conferences, data service, project support, research visits and doctoral program. IZA engages in (i) original and internationally competitive research in all fields of labor economics, (ii) development of policy concepts, and (iii) dissemination of research results and concepts to the interested public. IZA Discussion Papers often represent preliminary work and are circulated to encourage discussion. Citation of such a paper should account for its provisional character. A revised version may be available directly from the author.
IZA Discussion Paper No. 5882 July 2011
ABSTRACT
Surviving the Crisis: Foreign Multinationals vs Domestic Firms in Ireland *
Starting from the observation that all firms in Ireland (foreign and domestic in manufacturing and services industries) were hit by the crisis, the paper asks whether there is a difference in the behaviour of foreign and domestic firms. One hypothesis is that foreign multinationals are less linked into the Irish economy, so more likely to leave once the economy is hit by a negative shock. The paper discusses background hypotheses before giving empirical evidence from firstly aggregate data, and secondly firm-level observations. The analysis of the latter suggests that foreign firms are not more likely to leave during the crisis than Irish firms. Some policy conclusions are offered in the paper. JEL Classification: F3, J2, L2 Keywords: financial crisis, firm survival, Ireland Corresponding author: Holger Görg Kiel Institute for the World Economy Hindenburgufer 66 D-24105 Kiel Germany E-mail: [email protected]
* We are very grateful to Kevin Phelan of the Central Statistics Office for his unstinting help with the CIP data and to participants at the Lehigh conference and a seminar at the Kiel Institute for very helpful comments. We gratefully acknowledge financial support through the European Commission, as part of the SERVICEGAP Project (Grant Agreement no. 244 552).
1
1 INTRODUCTION
Ireland’s precipitous economic decline has become a bye-word for political and
banking mismanagement. Even at the time of writing, there are new reports of fresh cash
injections to support a foundering banking system. Such injections have severe
implications for Ireland’s international credit rating and borrowing requirements. However,
what market-insiders, and increasingly the media, realise is that the productive sector -
activities of firms in manufacturing and services –show some signs of resilience.
Brian Devine, economist at Davy Stockbrokers is reported in a BBC dispatch as
saying that; "If it weren't for the exporting sector the economy would be in far worse
shape."1 The Irish manufacturing sector is largely driven by exports which according to
Davy Stockbrokers are expected to grow by a further 6 percent in 2011 despite a 1.6 drop in
Irish GDP in the final quarter of 2010.
Among exports, those from the service sector are also burgeoning and generating
revenues close to those of manufacturing sector exports. According to the chief economist
at National Irish Bank, Ronnie O’Toole, the growth in the services sector represents “the
big success story in the economy over the last decade” with services exports in 2009
totalling €70bn compared to a value of €80bn for exports of physical outputs (FDI
Intelligence, 2010). O’Toole ascribes this service sector export growth to a shift from low
value-added manufacturing activities to better quality services jobs.
A large share of productive activity and exports in both manufacturing and services
is generated by foreign multinationals located in Ireland. Indeed, the need to maintain
Ireland as an attractive venue for foreign direct investment (FDI), thereby avoiding a large
drop in exports, is one reason for the increasingly vocal battle to maintain Ireland’s highly
competitive corporation tax rate vis-à-vis other EU member states.
1 See http://www.bbc.co.uk/news/business-12931167, accessed on 16/5/2011
2
In view of the importance of foreign multinationals in any revival of the Irish
economy, this paper aims to document the short-run impacts of the global financial crisis
on the Irish productive sector, distinguishing foreign multinationals and domestic firms,
from its inception in 2008.
A report on the response of foreign-owned firms during the crisis, showed above-
average job shedding of foreign owned firms in Ireland compared to their peers in other
world economies (42 percent job losses between 2008 and 2009 compared with a global
average of 25 percent) (FDI Intelligence, 2010). The same report showed Ireland slipping
two places in the World Investment Index from 21 to 23 in a selection of some of the
world’s largest 30 economies.2 However, this report does not interpret these employment
shocks in the context of other factors. Most importantly, it does not compare the
performance of foreign multinationals with that of domestic firms and neglects the fact that
FDI is especially dominant in high-tech industries.
Accordingly, existing accounts as to how firms have responded to the crisis in
Ireland invariably raise more questions than they solve due to the need for a systematic
study of the crisis when controlling for other firm- and industry-level characteristics. This
is the gap our paper aims to fill. Specifically, we look in detail at the incidence of firm
closures during the crisis. Is there any sign that foreign multinationals are quick to leave
the Irish economy during this time of crisis, thereby introducing more instability into the
economy? Or do they actually act as stabilizers during this economic downturn?
Our analysis asks whether certain types of firms, namely those that are foreign-
owned are better able to withstand the shock of a serious recession. To do this we firstly
describe some manufacturing-wide patterns of firm exit, employment and output changes in
recent years using the latest available aggregate data from the Central Statistics Office. We
2 The Inward Investment Index calculates the attractiveness of a country as a destination for FDI in terms of job creation, the number of investment projects which were successfully awarded and the amount of money invested.
3
then dig deeper and analyse the exit of firms using firm-level data from the Amadeus
database to estimate hazard functions.3 We look at the period 2006 – 2009 to scrutinize the
impact of the crisis for all firms both in the manufacturing and service sectors.
We find a number of important results. Firstly, unsurprisingly, the likelihood of
firm survival decreased unambiguously during the crisis in both the manufacturing and the
services sector. Our estimations suggest that, on average, a manufacturing firm is 40
percent more likely to exit during the crisis than before. This increase is even higher for
services firms at 80 percent. At the heart of our paper is the question whether these exit
probabilities are different for foreign and domestic firms. For the manufacturing sector, the
answer is a simple “no”. In the services sector, however, we do find an intriguing result in
a comparison of firms from EU countries and Irish owned firms. While European firms are
about 40 percent less likely than Irish firms to exit before the crisis, this advantage
evaporates completely during the crisis, when there is no difference between the two groups
of firms. Services firms from the US or other non-European countries are at no time
different in their exit behaviour than Irish firms.
We discuss some background to motivate our empirical analysis in the next section.
Section 3 then presents a first stab at the empirical analysis, presenting an aggregate picture
using industry level data for manufacturing sectors from the Central Statistics Office.
Section 4 then turns to the micro level, analysing firm-level data for the Irish manufacturing
and services sectors. Section 5 presents some policy implications of our empirical analysis.
2 BACKGROUND
This analysis follows on from an earlier pre-crisis analysis looking at differences in
survival for foreign and domestic Irish firms based on plant level data from the Forfás 3 We thus, in that section of the paper, look at the extensive margin of firm adjustment in terms of firm exit. A related question would be to see what happened to the intensive margin, i.e., employment growth in surviving firms. Unfortunately, however, even the data for 2008 and 2009 still contain too many missing values for employment and, hence, a meaningful analysis is not yet possible.
4
Employment Survey from 1973 to 1996 (Görg and Strobl, 2003). This paper finds that,
when looking at the raw data, foreign multinationals appear more likely to exit a market
than domestic firms. However, this can be explained by the fact that multinationals are on
average larger firms, and are concentrated in high tech industries. Once controlling for
these firm and industry characteristics, the study shows that multinationals are actually less
likely to leave, thereby introducing stability into the economy.
Our paper is also related to an early study by McAleese and Counahan (1979).
They analysed whether foreign multinationals in Ireland reduced employment during the
early 1970s recession to a larger extent than indigenous plants, i.e., whether multinationals
were faster to adjust employment levels following an adverse shock than were Irish-owned
plants. Their evidence showed that employment adjustments in multinational corporations
(MNCs) during the recession did not appear to have been different from that of indigenous
plants, while employment recovery after the recession was actually greater in MNCs than in
Irish-owned plants. However, they do not relate this finding to greater survival probability
in multinational than in domestic firms.
There are a number of reasons why we may expect some differences between
foreign affiliates and domestic firms in their exit behaviour during the crisis. One argument
emphasises the notion of multinationals being more footloose, i.e., more likely to leave an
economy than domestic firms if the economy experiences a negative shock (e.g, Görg and
Strobl, 2003). This may be due to multinationals being part of an international production
network in which production can be easily shifted between locations, and where they are
less linked into the local host country economy. This argument is backed by two empirical
observations.
Firstly, multinationals generally do less of their input sourcing in the host country
than domestic firms. This implies that they are less linked into the local input market. For
the Irish case, Görg and Ruane (2000) and Barry and Bradley (1997) both find that
5
multinationals have lower linkages with upstream firms, i.e., their ratio of domestically
sourced to total inputs is lower than for domestic firms. Specifically, Barry and Bradley
(1997) find for the Irish manufacturing sector in 1993 that foreign multinationals source on
average 34 percent of their material inputs in Ireland, while this ratio is 79 percent on
average for domestic firms.4 Görg and Ruane (2000) distinguish the sourcing of materials
and services inputs using data for the Irish electronics industry. They find that in 1995,
multinationals source 23 percent of their materials and 72 percent of their services in
Ireland, compared with 32 and 89 percent, respectively, for domestic firms.
The second observation that relates multinationals to footloose behaviour is the
importance of the local market for firms´ output. Here it appears that multinationals are
generally more export intensive. Hence, they are less linked into the local output market.
For example, Barry and Bradley (1997) show using data for 1993 that the average domestic
firm exports 39 percent of its total output, while this export ratio is 85 percent for foreign
multinationals. This picture becomes even starker when contrasting EU multinationals and
US multinationals: the former have an export ratio of 62, the latter of 96 percent.
While these arguments suggest that multinationals may be more likely to leave the
host country, a contrary reasoning can also be advanced. One may argue that foreign
affiliates are less likely to exit because investing abroad involves substantial unrecoverable
investment costs, also called sunk costs, which are likely to be higher than for setting up a
purely domestic plant in the host country. Hence, they may be reluctant to leave if the
shock is only temporary. If sunk costs are indeed important, then one would expect these
firms to be more productive. The reasoning for this is that only the most productive firms
may be able to bear the additional sunk costs of investing abroad, as suggested by Helpman
et al. (2004). It is well established in the literature that foreign firms are more productive
4 The finding that multinationals have lower linkages than domestic firms is mirrored in studies for other countries, see, for example, Alfaro and Rodriguez-Clare (2004) for Costa Rica, or Driffield and Mohd Noor (1999) for Malaysia.
6
than domestic firms. Ruane and Ugur (2005) illustrate this using Irish firm-level data for
the manufacturing sector. While, as usual, the labour productivity measurement in Ireland
should be taken with a pinch of salt due to the practice of transfer pricing, it is reassuring to
note that a large international literature also finds that foreign multinationals are more
productive than domestic firms (e.g., Girma and Görg, 2007 for the UK, Doms and Jensen,
1998 for the US).
To sum up, the expectation as to the behaviour of foreign firms is ambiguous. One
can plausibly argue that they may be more footloose and more likely to leave the Irish
economy during the crisis, although one may equally sensibly also argue the opposite.
Hence, we need to turn to empirical evidence to investigate this further.
3 THE AGGREGATE PICTURE
We firstly look at some aggregate data to get an idea of the broad picture on firm
exit and related jobs in Ireland. The Census of Industrial Production compiled by the
Central Statistics Office provides unique information on the whole spectrum of firms in
manufacturing industries and includes unique information on domestic and foreign owned
firms for different aggregates. The most recent available years are 2008 and 2009. Table 1
depicts the main information concerning the number of firms, employees and output by
nationality of firms.
Although the number of foreign owned firms appears to have dropped by 16
percent, from 506 to 424 units, in the lead up to the crisis, the number of foreign firms is
less severely affected than the number of Irish-owned firms. The latter experienced a drop
of 13 percent. However, this difference remains marginal. Furthermore, these changes need
7
to be interpreted carefully. The reason is that the surveying techniques employed by the
official statistics have switched from local units to enterprises between 2008 and 2009.5
(Table 1 here: Changes in Irish Manufacturing (2008-2009))
Employment figures (which are not influenced by the survey technique) show a
similar steep decrease in domestic and foreign firms (-11 percent and -10 percent
respectively) which keeps the share of employees in foreign entities stable at a 47 percent
level.6 This shows the importance of foreign multinationals for employment in Ireland. In
contrast, output values show a different short term pattern. While output of domestic firms
has nearly stagnated, output of foreign firms has increased from 2008 to 2009 by 10
percent. As a consequence, higher labour productivity growth is observed when measured
by output per employee. Thus, in the time of the crisis the decline in employment was
accompanied by a productivity surge.7
To get a more accurate picture of the impact of the global financial crisis we now
consider the composition of industry. Unfortunately, this is only possible up to 2007.8 FDI
in Ireland exhibits strong sectoral patterns with foreign-owned activities heavily
concentrated in high tech industries (Ruane and Görg, 1997). Hence, a slump in global
demand may affect foreign-owned firms differently depending on the extent to which the
shock is sector specific.
Table 2 illustrates this strong sectoral bias of foreign-owned firms towards the high-
tech end of the economy with 19, 11 and 29 percent of their activity (measured in terms of
employment) concentrated in the high-tech sectors chemicals including pharamaceuticals,
(NACE 24), computers (NACE 30) and telecommunication equipment (NACE 32-33), 5 An enterprise might include several local units, thus the numbers in the table might over-report the extent of exit 6 This is comparable with the share reported by Görg and Strobl (2003) for 1995, when foreign-owned firms also accounted for about 47 percent of total manufacturing employment. 7 Note however, that output numbers and thus productivity should be interpreted with care for multinationals. As multinationals often rely on international transfer pricing, the output numbers artificially over-estimate the real production of multinationals in Ireland (e.g. Barry, 2005). 8 2007 is the last year when it is possible to make these calculations. The official statistics post-2007 no longer differentiate between foreign-owned and Irish employment on the basis of these classifications.
8
respectively in 2007. The corresponding values for Irish firms are 1 and 3 percent
respectively. By contrast, Irish owned firms tend to be more concentrated in the more
traditional food (NACE 15) and metals (NACE 27-28) sectors.
(Table 2 here: Manufacturing employment by two digit sector, 2000 and 2007)
To sum up, several patterns from the data emerge from our examination of
aggregate statistics. Firm numbers and employment in both foreign and Irish firms in the
manufacturing industry have dropped during the crisis. Sales for both Irish and foreign
firms have been reasonably steady, and are still heavily dominated by foreign firms due to
the prevalence of transfer pricing. Due to the nexus between falling employment in the
context of steady or rising sales, labour productivity has been rising. This rise in labour
productivity especially characterizes foreign owned multinationals. Another well-known
feature of foreign presence in Ireland is the dominance of these firms in high value added
and economically relevant high tech sectors such as computers, pharmaceuticals and
medical instrumentation.
4 THE MICRO LEVEL PICTURE
While looking at aggregate data deserves attention and provides a snapshot of
sectoral responses to the global financial crisis, the data we use thus far focus only on the
manufacturing sector. Furthermore, aggregate changes are unable to reveal which factors
drive firm-level survival. Only recently, some studies have overcome this drawback and
documented how firm-level factors such as the multinational status, employment size at the
firm’s inception, age and the industry classification of activities have a statistical effect on
the probability of failure (e.g., Görg and Strobl, 2003, Agarwal and Audretsch, 2001,
Dunne and Hughes, 1994).
Although the crisis in Ireland triggered by global demand shocks affected all firms
operating in Ireland, theory and empirical evidence tell us that the crisis may have affected
9
firms unequally. The literature on firm survival posits that larger and older, established
firms are less likely to close down (e.g., Dunne and Hughes, 1994). Also, the level of
technology used in a sector plays a role in shaping survival probabilities (Agarwal and
Audretsch, 2001). These stylized facts from existing work may favour the survival
prospects of foreign firms, as these are generally larger than domestic firms, and part of
established, technologically advanced multinationals (Ruane and Görg, 1997). However,
irrespective of these characteristics, there may also be a ‘multinationality effect’ particular
to these firms. As discussed in Section 2, foreign multinationals, by virtue of their
imbeddedness into global production and sales networks and their ability to reallocate their
activities internationally might be expected to behave differently when faced with a demand
shock than their Irish counterparts.
In order to see whether we find support for these hypotheses, we examine the
determinants of survival rates of foreign and domestic firms in Ireland during the crisis,
using very recent firm-level panel data in the next section.
a. Data and descriptive statistics
The firm-level data set we use is the Amadeus database, a commercial dataset
provided by Bureau van Dijk. It contains extensive firm-level information on European
firms. We access the database for Ireland.9 Amadeus provides detailed yearly information
on the activities of each firm, its profit and loss accounts, balance of payment information
and ownership structure. In the case of Ireland it enables us to identify numerous variables
that we use in our study: foreign ownership, legal date of any cessation of activity and some
additional variables such as employment, the age of the firm and the 4-digit (NACE Rev.
1.1) industries. Furthermore, as this dataset includes also services sector firms, it provides a 9 In Ireland, Private (Ltd) limited companies are required to file accounts with the Irish Companies Registry . This information is gathered by Bureau van Dijk. In general, the Amadeus sample includes only firms that have an operating revenue greater than 1 million EUR, or total assets greater than 2 million EUR, or more than 150 employees.
10
richer picture of the Irish economy than a study that would be based solely on the
manufacturing sector.
From the ownership section of the data we are able to construct a foreign ownership
indicator for a firm. A firm is considered to be foreign if it is majority owned, wholly
owned or the main known shareholder is foreign. In a sense, this variable states that a
foreign firm is entitled to control or to manage the Irish located affiliate as it has the largest
ownership share.
Firm exit is defined as the termination of a firm’s activities. Information about this
is provided by a ‘legal status’ variable in the Amadeus dataset. It indicates whether a firm
is active or inactive. Inactive firms are defined as firms that are in liquidation, dissolved or
in receivership. In order to identify with accuracy the timing of any legal cessation of a
firm´s activity, we complement this Amadeus variable with information from the Irish
Company Registration Office (CRO) databank. The CRO databank provides among other
things the precise date of cessation of activity of a firm located in Ireland and allows a
researcher to pinpoint in which year the inactive firm in the Amadeus dataset stopped
trading.10 Hence, these two datasets together allow us to track in detail whether or when a
firm stopped being active and whether or not it was foreign owned.
Our data set comprises information for 22,428 domestic and 1,727 foreign firms in
2005 in the manufacturing and commercial services sector (excluding public services,
NGOs and private households). We analyze these data over the period 2006 to 2009 in
order to focus on the short run impact of the financial crisis.
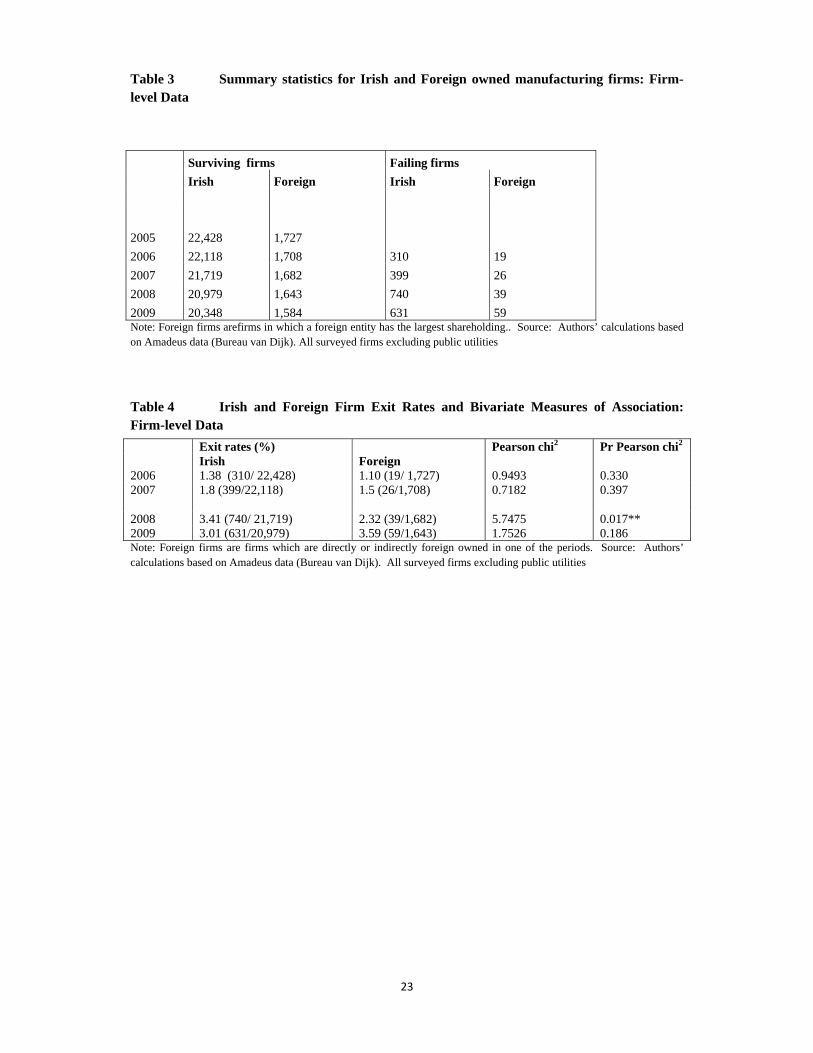
Tables 3 and 4 show the evolution of failure for domestic and multinational firms
from 2006 until 2009.11 The absolute number of exits shown in Table 3 is, of course,
10 To be precise, we use mainly the time series on legal status of firms provided in Amadeus. Nevertheless around 500 firms have been double-checked in the CRO databank. We found that some firms that are classified as inactive in Amadeus are actually active. This was then corrected in our data. 11 Although available, we do not use data for 2010 as there are a large number of missing values in the data and we can therefore not say with any confidence whether a non-response in the data is due to a true exit.
11
higher among Irish owned firms. However, looking at the fractions of failures (exit rates)
in Table 4 shows that these appear reasonably similar, with annual failure rates of between
1 and 4 percent.
(Table 3 here: Summary statistics: Firm-level Data )
(Table 4 here: Irish and Foreign Firm Exit Rates)
It is also apparent from Table 4 that failure rates increase substantially from the start
of the crisis in 2008. This is true for both foreign and Irish owned firms. The year 2008
also shows the only significantly marked difference in failure rates between Irish and
multinational firms. The failure rates of Irish firms peak at 3.4 percent compared to the
lower value of 2.32 for foreign multinationals and the statistical significance of this
difference is attested by the accompanying test statistic (Pearson’s Chi-Square).
Overall however, there seems little evidence to distinguish the exit rates for Irish
and foreign firms. Although the survival rates of foreign firms appear marginally better,
turning our attention to a survival regression framework will help to establish whether what
we can see in the descriptive statistics (marginally higher survival of multinationals in
Ireland) is also observable when controlling for other important features of the firm such as
age, size and sector.
b. Econometric analysis
In our data we can only observe firm exit on a yearly basis. This feature of the data
necessitates the use of discrete-time survival models. A widely used model in this case is
the complementary log-log model, which allows us to model the hazard of firm exit.12 In
proportional hazard models, the hazard rate ( )X,tθ satisfies an important separability
assumption, ( ) ( ) ( )X'exptX,t 0 βθ=θ , thus it is the product of a baseline hazard ( )t0θ ,
12 The complementary log-log model is the discrete time version of the proportional hazard models. See Jenkins (2005) for an excellent overview of complementary log-log and proportional hazard models.
12
which depends only on time at risk, and ( )X'exp β which is independent of t and depends
on the attributes of the firm ( X ), such as ownership, size and age.
The appropriate discrete-time hazard function, ( )X,jh shows the interval hazard for
the thj time interval, i.e. the period between the beginning and the end of the thj year after
the firm first appears in the sample (with left censoring). This hazard rate takes the
following form:
( ) ( )[ ]jX'expexp1X,jh γ+β−−= (1)
where ( )Xth , is the hazard rate, i.e., the probability that the firm exits in period t
given that it had not exited before that period. Our main interest lies in the identification of
the β parameters, which shows the effect of the explanatory variables on the hazard rate.
Positive estimates suggest that larger values of the explanatory variables increase the
hazard of firm exit, or equivalently, decrease the probability of firm survival. A negative
coefficient estimate suggests that the variable is negatively associated with the hazard and,
hence, positively affects survival.13
Our hazard model includes the following variables in the vector X. Firstly, we
include employment size, firm age and two digit industry dummies, as suggested by the
literature on firm survival cited above.14 Secondly, we include an indicator variable that is
equal to one if a firm is foreign-owned, and zero if it is Irish owned. Thirdly, as our time
period includes years before and during the crisis, we have generated a binomial ‘crisis
variable’ that is equal to one for the years during the crisis and zero before the crisis.
Finally, to check whether foreign firms react differently than domestic firms during the
13 The jγ parameters represent the differences in values of the integrated hazard function for different durations. While it is possible to impose some restrictions on these parameters, we see no reason for this. Thus we estimate a full set of jγ s, transforming the model to a type of semi-parametric one in this respect. 14 Employment size is measured as average employment in a firm between 2005 and 2009. Firm age is its age in 2005.
13
crisis, we also include an interaction term of the foreign-ownership variable and the crisis
variable.
We, firstly, estimate our model using data for all firms collectively in order to
establish a benchmark result.15 The results are presented in Table 5 and include two sets of
results, which differ in the timing of the crisis variable only. There is no clear guidance as
to when exactly the global crisis began, when it hit Ireland, or how long the delay was
before affecting different firms in the real economy. Generally speaking, September 2008,
or more specifically the collapse of Lehman Brothers seems to be regarded as the start of
the crisis, while the Irish bank bailout started making headlines from December 2008
onwards. Given this ambiguity about the exact timing of the crisis, and the availability
only of yearly observations, we use two definitions of the crisis variable: one starting in
2008 and the other in 2009.
(Table 5 here: Firm exit, all firms)
The coefficients in Table 5 depict the relationship between the explanatory variables
and the hazard of firm exit. One can see that firm size and firm age are negatively and
statistically significantly correlated with firm exit. This is what one would expect from the
literature: larger and older, more established firms are less likely to exit. While we do not
report the coefficients on the sectoral dummies in the table, their inclusion in the
specification allows us to interpret the coefficients of the other variables abstracting from
sector-specific characteristics.
We find that firm exit becomes more likely during the crisis from the positive
coefficient on the crisis dummy. The foreign ownership dummy returns a negative
coefficient, implying that foreign firms in general are less likely to exit than domestic firms,
irrespective of the effect of the crisis. This mirrors earlier findings by Görg and Strobl
(2003) for Irish manufacturing. The interaction of (foreign * crisis) returns a positive
15 The survival analysis is implemented using the cloglog commands in Stata Version 10.
14
coefficient. A test of the hypothesis that the coefficient on the foreign dummy and the
interaction of (foreign * crisis) add up to zero indicates that we cannot reject this
hypothesis.16 Hence, the advantage of foreign firms in terms of lower exit probabilities
evaporates during the crisis.
In other words: foreign firms per se are more likely to stay in the economy than
comparable domestic firms when the economy is running smoothly. However, during the
crisis, multinationals are no different in terms of their exit probabilities compared to their
domestic counterparts. That is, when the economy turns sour, multinationals are just as
likely to leave as are domestic firms.
Before we attempt to put some actual numbers on the difference in exit hazards
between foreign and domestic firms, we turn to look at some possible sources of
heterogeneity in our sample. We first distinguish firm survival in manufacturing and
services industries, and then also look at differences according to the nationality of foreign
ownership. Since the results in column (2) of Table 5 provide us with more statistically
significant results, we take 2009 as the crisis period and use this definition of the crisis
variable in what follows.
Columns (1) and (2) of Table 6 provide estimates of the hazard model for
manufacturing and services industries separately. As the number of observations show, we
have three times as many observations for the services sector than for manufacturing,
indicating the importance of this sector for the Irish economy.
The estimates for the manufacturing sector show that, once controlling for sectoral
characteristics using two digit industry dummy variables, firm-level characteristics explain
little of the variation in firm exit. The only statistically significant variable is the crisis
dummy, indicating that firm exit increased substantially during the crisis. This is different
in the services sector, however, where we find the same results as those obtained in Table 5.
16 This is done using a simple t-test, the probability value of the test is 0.55.
15
This shows that the pooled results in Table 5 were mainly driven by the exit behaviour of
services firms.
We now look at the size of the coefficients. The betas estimated in the
complementary loglog model can be interpreted as the coefficients from a hazard model.
Hence, a hazard ratio can be calculated as exp(βk) for the kth regressor. For example, in
column (2) the coefficient on foreign ownership is -0.497, equivalent to a hazard ratio of
exp(-0.497) = 0.61. This implies that the hazard of exiting for a foreign firm in the services
sector is only 61 percent that of a domestic firm, or equivalently that the hazard is 39
percent lower for foreign than for domestic services firms. This, however, applies only to
the time before the crisis. During the crisis, the coefficient for foreign firms is -0.497 +
0.483, and we cannot reject the hypothesis that this sum is equal to zero. This indicates that
during the crisis, the hazard of exiting is no different for foreign firms compared to
domestic firms in the services sector.
This represents, of course, the effect of foreign ownership for an ‘average foreign
firm’. However, as expected, foreign multinationals in Ireland stem from a multitude of
different home countries. Chief among these are the US and the EU (including the UK),
but there are also substantial numbers of firms from other countries, including South
Africa, South East Asia and Latin America. In order to check whether there are differences
in behaviour for firms from different home countries, we group firms into those originating
from the EU, North America and the rest of the world (RoW).
Our expectation is to find some differences. Görg, Hanley and Strobl (2011) find
that there are no significant differences in the ratio of locally sourced inputs between these
(roughly similarly defined) nationality groupings, suggesting that they are similarly
shallowly linked into the local economy in terms of input links. This may, firstly, go
against the expectation that there may be differences. However, sunk costs play an
important role for FDI, and one may expect that sunk costs are quite different for different
16
firms. Sunk costs may especially be different due to distance. Compare, for example, the
location decision of a British with that of a US firm. While many framework conditions are
similar (language, legal system, etc.) the distance for the US firm is much larger and
increases set up costs for transport, supervision and communication. This would be even
more severe for, e.g., a Japanese firm in Ireland. Given these higher sunk costs, the US or
Japanese firm may be less willing to leave during a temporary negative shock than a
comparable firm from neighbouring EU countries.17
Distinguishing by nationality in this way unearths some interesting results in
columns (3) and (4) of Table 6. Firstly, the conclusions do not change for the
manufacturing sector: firm characteristics, including nationality of ownership, do not
explain much of the variation in hazard rates. In the services sector, however, this is not the
case.
From column (2) we know that foreign firms are less likely to leave per se. Column
(4), however, shows that this is only the case for multinationals from EU countries. The
point estimate suggests that they are 44 percent less likely to exit than their Irish owned
counterparts before the crisis.18 Foreign firms from other countries, including the US, do
not exhibit differences in exit rates compared to domestic firms. More strikingly, however,
we find that the performance advantage of EU multinationals evaporates during the crisis.
We cannot reject the hypothesis that the coefficients on the EU dummy (-0.575) and the
interaction of the EU dummy * crisis (0.639) add up to zero, i.e., during the crisis, EU
multinationals are not different compared to Irish owned firms in their exit behaviour.
Hence, during the crisis, all firms are equally likely to leave. This increase in the
exit hazard due to the crisis is given by the coefficient on the crisis dummy, which is 0.593
for the services sector, implying an increase in the hazard of exiting for all types of firms in
17 This theoretical argument is based on Dixit’s (1989) model on exit under uncertainty. See also Görg (2005) for related empirical evidence on exit costs and FDI. 18 Calculated as exp(-0.575) = 0.56; 1 – 0.56 = 0.44
17
the services sector by roughly 80 percent (compared to Irish owned firms before the crisis)
during the crisis. In contrast, in the manufacturing sector, the crisis increases the hazard of
exiting by about 40 percent (column (2)).19,20
(Table 6 here: firm exit by sector)
5 CONCLUSIONS AND POLICY IMPLICATIONS
The Irish Government introduced an Enterprise Stability Fund in 2009 which is
administered by the Industrial Development Agency (IDA Ireland). This fund is
particularly targeted at companies that encountered difficulties as a result of the crisis in
order to assist them by means of financial support to survive and continue operations in
Ireland.21 In the light of this government activity, what are the implications of our
analysis?
Firstly, it is evident that firms were hit by the crisis and that their exit probabilities
increased substantially. Firm exit is, however, not by itself necessarily a bad thing. Firm
churning is an integral part of the process of restructuring in a competitive economy and
leads to “creative destruction” (Schumpeter, 1934) introducing new entrepreneurs and ideas
into the economy. While acknowledging this, our finding that the crisis on its own (ceteris
paribus) leads to increases in firm exit, suggests that even firms that would not have exited
under normal conditions have now done so. From this perspective, government intervention
may of useful assistance.
The Irish economy, both in manufacturing and services sectors, is heavily reliant on
foreign multinationals. Our analysis shows that, on average, foreign multinationals do not 19 Calculated as exp(0.593) = 1.81 and exp(0.345) = 1.41 20 One may argue that the effect of the crisis may be different depending on the exposure to export markets of the sector in which the firm operates. We entertain this hypothesis using data from the Census of Industrial Production, which we use to classify sectors as export intensive or not. We then split the sample and run the regression separately for the two groups of firms. Unfortunately, this export data is only available for manufacturing industries. The results, which are reported in the Appendix, show that the probability of exit increases by more in export oriented manufacturing sectors. However, we still fail to find any differences in exit probabilities depending on nationality of ownership. 21 See http://newsweaver.co.uk/ibec/e_article001413785.cfm?x=b11,0,w, accessed on 4/4/2011
18
behave any differently in terms of exit behaviour from comparable Irish firms during the
crisis. They do not introduce additional instability into the economy. Hence, there is no
reason to suggest that government efforts need to be targeted differently to domestic and
foreign-owned firms.
19
References Agarwal, R. and D. Audretsch (2001), “Does Entry Size Matter? The Impact of the Life Cycle and Technology on Firm Survival”, Journal of Industrial Economics, 49, 1-43. Alfaro, L. and A. Rodríguez-Clare (2004), “Multinationals and Linkages: an Empirical Investigation”, Economia, 4, 13-69 Barry, F. (2005), “A Note on Transfer Pricing and the R&D Intensity of Irish Manufacturing”, Research Policy, 34, 673-681. Barry, F. and Bradley, J. (1997), "FDI and Trade: The Irish Host-Country Experience”, Economic Journal, 107, 798-1811. Dixit, A. (1989), “Entry and exit decisions under uncertainty”, Journal of Political Economy, 97, 620–638. Doms, M.E. and J. B. Jensen (1998), “Comparing wages, skills, and productivity between domestically and foreign-owned manufacturing establishments in the United States”, in R. Baldwin, R. Lipsey and J.D. Richardson (eds.), Geography and Ownership as Bases for Economic Accounting, (Chicago: Chicago University Press), 235-255. Driffield, N., and A. Mohd Noor (1999), “Foreign Direct Investment and Local Input Linkages in Malaysia”, Transnational Corporations, 8, 1-23. Dunne, P. and Hughes, A. (1994), “Age, Size, Growth and Survival: UK Companies in the 1980s”, Journal of Industrial Economics, 42, 115-140. FDI Intelligence (2010), “Ireland Suffers Sharp Fall in Inward Investment in 2009 Though Still Punches Above Weight”, available at www.nationalirishbank.ie/PDF/About-the-Bank/Foreign-Direct-Investment/NIB-fDi-Investment-Performance-Monitor-2009-Feb-2010.pdf Girma, S. and H. Görg (2007), “Multinationals’ productivity advantage: Scale or technology?”, Economic Inquiry, 45, 350-362 Görg, H. (2005), “Fancy a Stay at the ‘Hotel California’? The Role of Easy Entry and Exit for FDI”, Kyklos, 58, 519–535 Görg, H., A. Hanley and E. Strobl (2011), “Creating backward linkages from multinationals: Is there a role for financial incentives?”, Review of International Economics, 19, 245-259 Görg, H. and F. Ruane (2000), “An Analysis of Backward Linkages in the Irish Electronics Sector”, Economic and Social Review, 31, 115-235 Görg, H. and Strobl, E. (2003), “‘Footloose’ multinationals?”, The Manchester School, 71, 1-19.
20
Helpman, E., M.J. Melitz and S.R. Yeaple (2004), “Export Versus FDI with Heterogeneous Firms”, American Economic Review, 94, 300-316 Jenkins, S.P. (2005), “Survival Analysis”, mimeo, University of Essex McAleese, D. and Counahan, M. (1979), “’Stickers’ or ‘Snatchers’? Employment in Multinational Corporations during the Recession”, Oxford Bulletin of Economics and Statistics, 41, 345-358. Ruane, F. and H. Görg (1997), “The impact of foreign direct investment on sectoral adjustment in the Irish economy”, National Institute Economic Review, 60, 76-86 Ruane, F. and A. Ugur (2005), “Labour Productivity and Foreign Direct Investment in Irish Manufacturing Industry - A Decomposition Analysis”, Economic and Social Review, 36, 19 – 43 Schumpeter, J. (1934), The Theory of Economic Development, (Cambridge, MA: Harvard University Press)
Appendix
Table A1 Firm exit in manufacturing by export intensity (1) (2) (3) (4) Export intensive Not export
intensive Export intensive Not export
intensive Foreign -0.229 0.298 (0.421) (0.336) Average size 0.001 -0.006 0.001 -0.006 (0.001) (0.002)** (0.001) (0.002)** Age 0.120 0.025 0.127 0.027 (0.117) (0.077) (0.117) (0.077) Crisis 2009 0.599 0.326 0.599 0.326 (0.239)** (0.164)** (0.239)** (0.164)** Foreign * Crisis 0.493 0.656 (0.632) (0.542) EU -0.691 0.301 (0.607) (0.394) North America 0.531 0.592 (0.605) (0.589) EU * Crisis 0.822 0.838 (0.851) (0.608) NA * Crisis -0.230 0.089 (1.179) (1.166) Observations 5595 11683 5595 11618 Standard errors in parentheses * significant at 10%; ** significant at 5%; *** significant at 1% Model includes two digit industry dummies
Notes: Output and wages in Billion Euros. Author calculations from Census of Industrial Production (CIP) annual survey: Central Statistics Office, Ireland 1 Local units in NACE Rev.2 reported for 2008. Enterprises, not local units, surveyed in 2009.
Table 2 Manufacturing employment by two digit sector, 2000 and 2007 2000 2007
Notes: Based on own calculations using the Census of Production raw data and harmonizing sectors across years
23
Table 3 Summary statistics for Irish and Foreign owned manufacturing firms: Firm-level Data
Surviving firms Failing firms Irish Foreign Irish Foreign 2005 22,428 1,727 2006 22,118 1,708 310 19 2007 21,719 1,682 399 26 2008 20,979 1,643 740 39 2009 20,348 1,584 631 59 Note: Foreign firms arefirms in which a foreign entity has the largest shareholding.. Source: Authors’ calculations based on Amadeus data (Bureau van Dijk). All surveyed firms excluding public utilities
2008 3.41 (740/ 21,719) 2.32 (39/1,682) 5.7475 0.017** 2009 3.01 (631/20,979) 3.59 (59/1,643) 1.7526 0.186 Note: Foreign firms are firms which are directly or indirectly foreign owned in one of the periods. Source: Authors’ calculations based on Amadeus data (Bureau van Dijk). All surveyed firms excluding public utilities
24
Table 5 Firm exit, all firms
(1) (2) Crisis from 2008 Crisis from 2009 Foreign -0.274 -0.299 (0.196) (0.141)** Average size -0.001 -0.001 (0.001)* (0.001)* Age -0.091 -0.091 (0.025)*** (0.025)*** Crisis 1.090 0.539 (0.052)*** (0.055)*** Foreign * Crisis 0.160 0.406 (0.234) (0.224)* Observations 82721 82721 Standard errors in parentheses * significant at 10%; ** significant at 5%; *** significant at 1% Model includes two digit industry dummies
Table 6 Firm exit, by sector (1) (2) (3) (4) Manufacturing Services Manufacturing Services Foreign 0.077 -0.497 (0.228) (0.181)*** Average size -0.002 -0.001 -0.002 -0.001 (0.001) (0.001) (0.001) (0.001) Age 0.025 -0.122 0.025 -0.122 (0.056) (0.029)*** (0.056) (0.029)*** Crisis 2009 0.345 0.593 0.345 0.593 (0.122)*** (0.062)*** (0.122)*** (0.062)*** Foreign * Crisis 0.380 0.483 (0.386) (0.279)* EU -0.098 -0.575 (0.292) (0.218)*** North America 0.385 -0.942 (0.390) (0.581) RoW 0.323 0.066 (0.590) (0.358) EU * Crisis 0.630 0.639 (0.466) (0.324)** NA * Crisis -0.117 1.127 (0.811) (0.766) RoW * Crisis -0.009 -1.205 (1.161) (1.063) Observations 20987 61819 20987 61819 Standard errors in parentheses * significant at 10%; ** significant at 5%; *** significant at 1% Model includes two digit industry dummies