SUS DATA QUALITY DASHBOARD USER GUIDE NAVIGATION MENU Select a place to start… Navigating the front screen Navigating the data item validity screens Viewing the time series data If this file does not automatically open as a slideshow, please select the SLIDESHOW tab above, then select FROM BEGINNING
Transcript
SUS DATA QUALITY DASHBOARD USER GUIDE NAVIGATION MENU
Select a place to start…
Navigating the front screen
Navigating the data item validity screens
Viewing the time series data
If this file does not automatically open as a slideshow, please select the SLIDESHOW tab above, then select FROM
BEGINNING
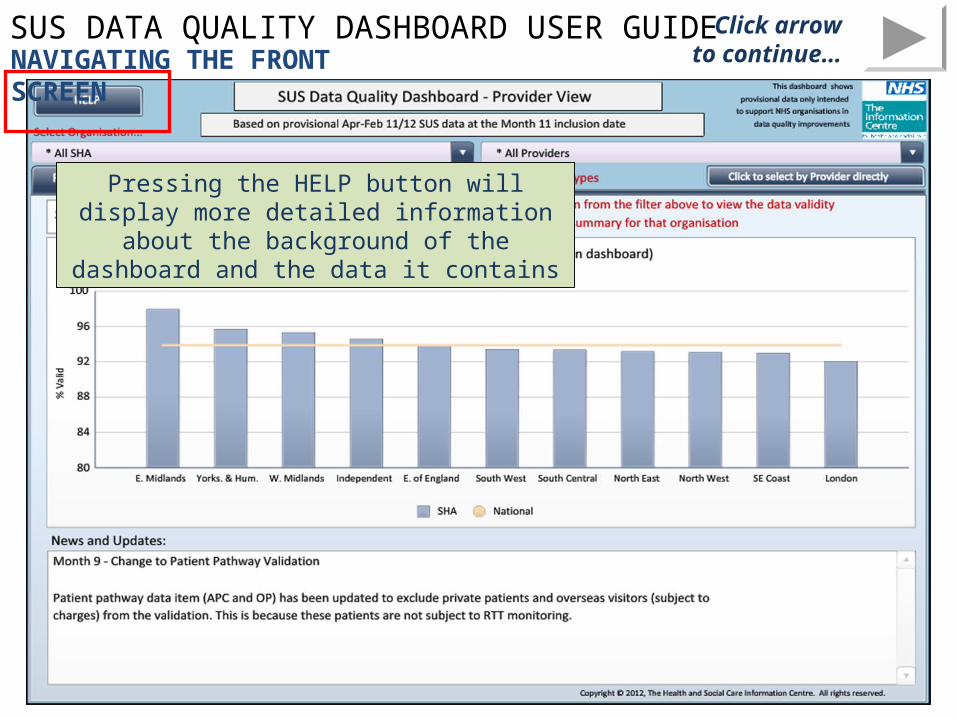
SUS DATA QUALITY DASHBOARD USER GUIDE
Pressing the HELP button will display more detailed information about the background of the
dashboard and the data it contains
NAVIGATING THE FRONT SCREENClick arrow to
continue…
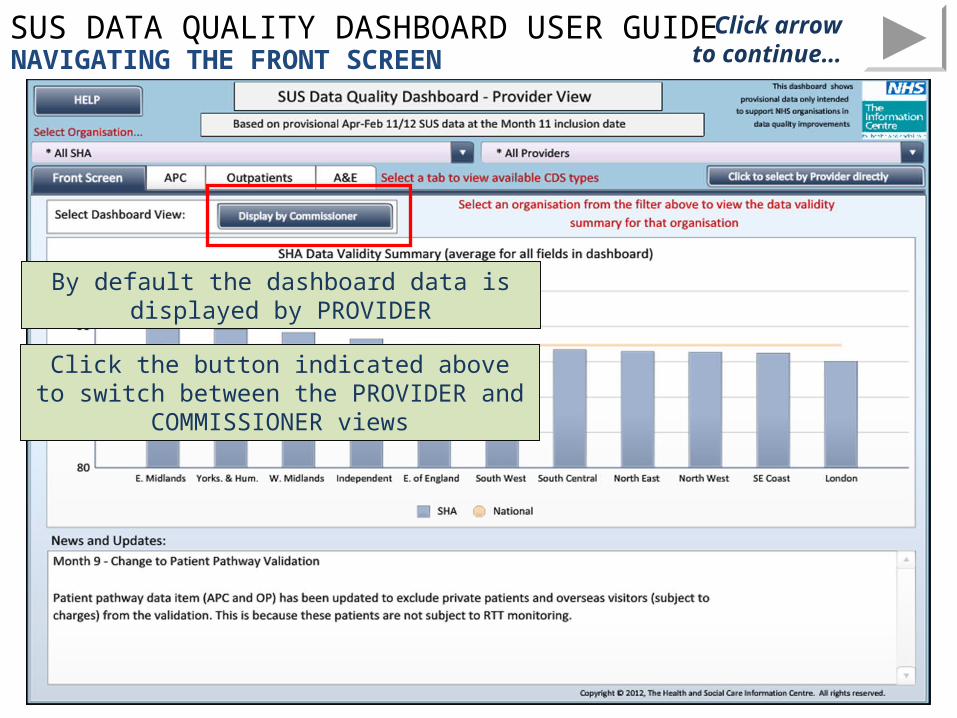
SUS DATA QUALITY DASHBOARD USER GUIDE
By default the dashboard data is displayed by PROVIDER
Click the button indicated above to switch between the PROVIDER and COMMISSIONER views
NAVIGATING THE FRONT SCREENClick arrow to
continue…
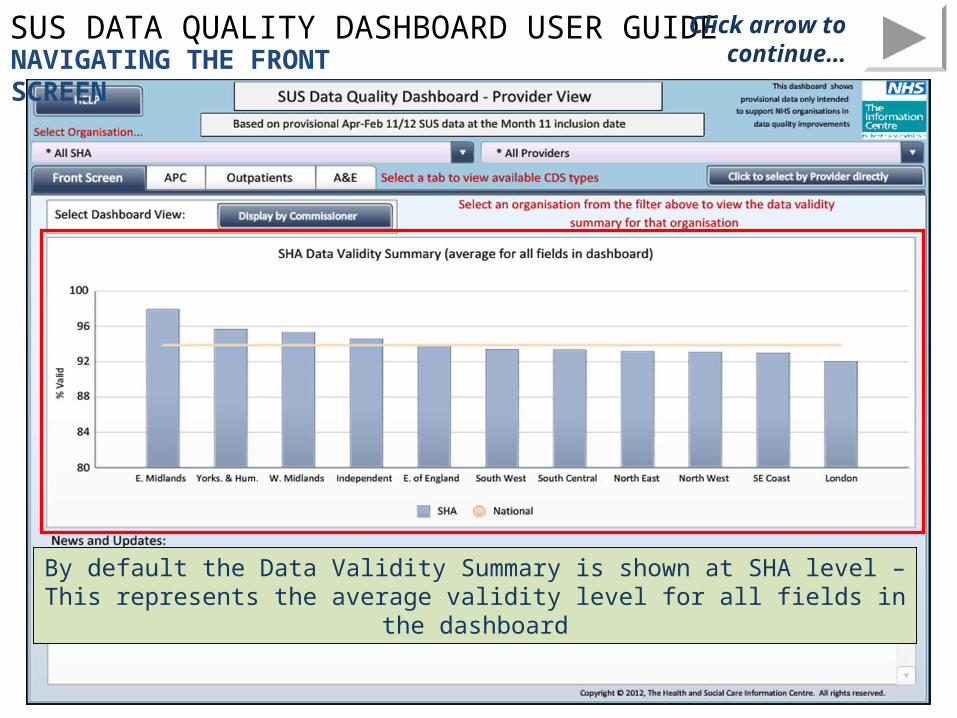
SUS DATA QUALITY DASHBOARD USER GUIDE
By default the Data Validity Summary is shown at SHA level – This represents the average validity level for all fields in the dashboard
NAVIGATING THE FRONT SCREENClick arrow to
continue…
SUS DATA QUALITY DASHBOARD USER GUIDENAVIGATING THE FRONT SCREEN
Click arrow to continue…
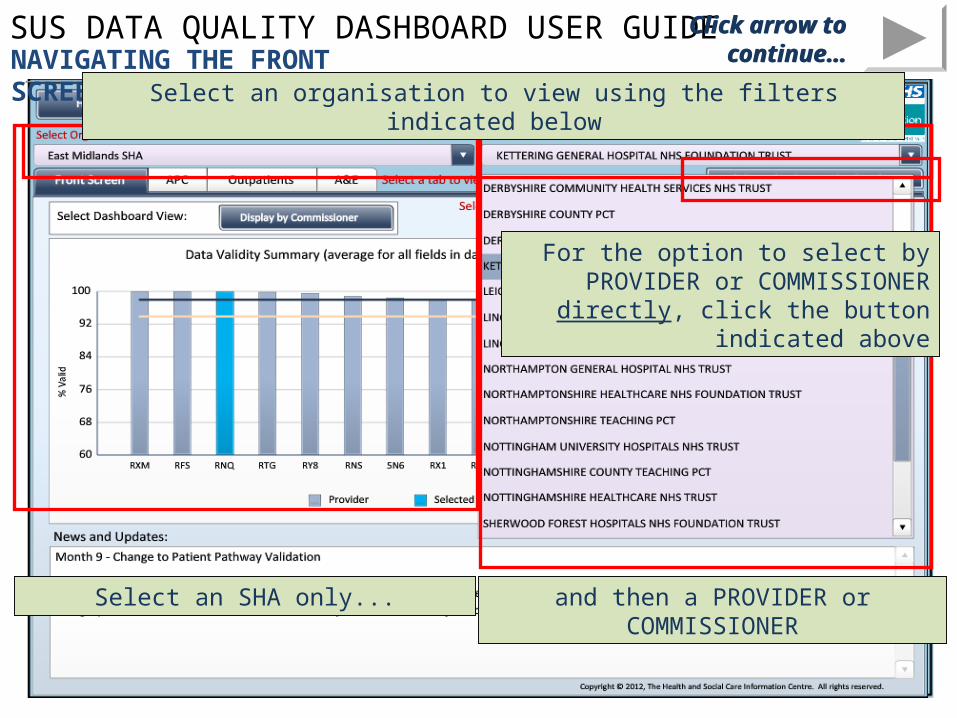
Select an SHA only... and then a PROVIDER or COMMISSIONER
For the option to select by PROVIDER or COMMISSIONER directly, click the button
indicated above
Select an organisation to view using the filters indicated below
Click arrow to continue…
SUS DATA QUALITY DASHBOARD USER GUIDENAVIGATING THE FRONT SCREEN
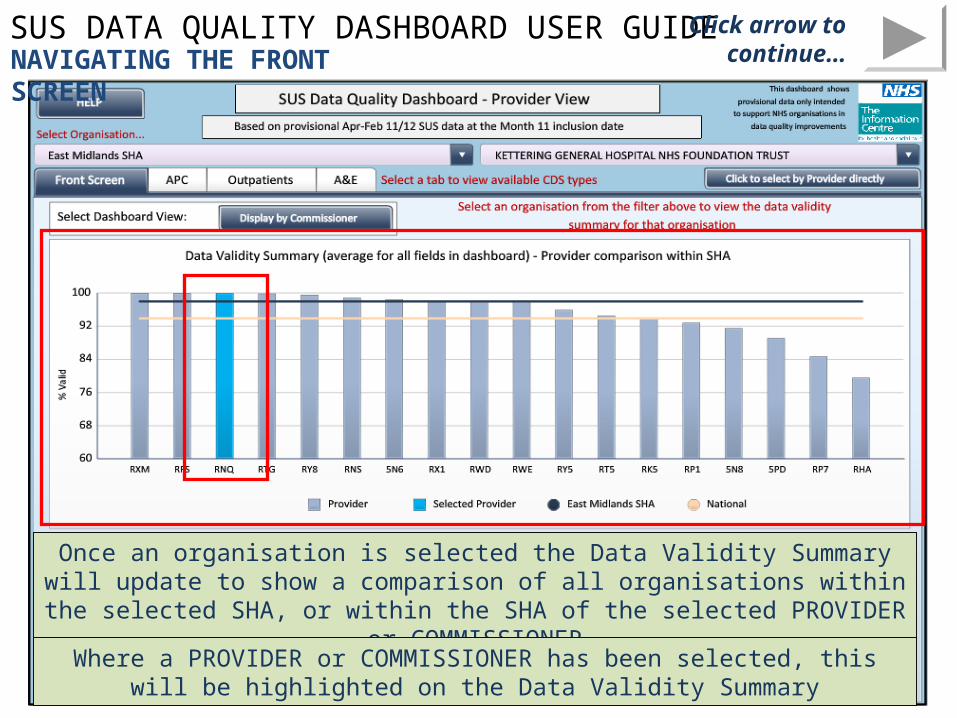
Once an organisation is selected the Data Validity Summary will update to show a comparison of all organisations within the selected SHA, or within the SHA of the
selected PROVIDER or COMMISSIONER
Click arrow to continue…
Where a PROVIDER or COMMISSIONER has been selected, this will be highlighted on the Data Validity Summary
SUS DATA QUALITY DASHBOARD USER GUIDENAVIGATING THE FRONT SCREEN
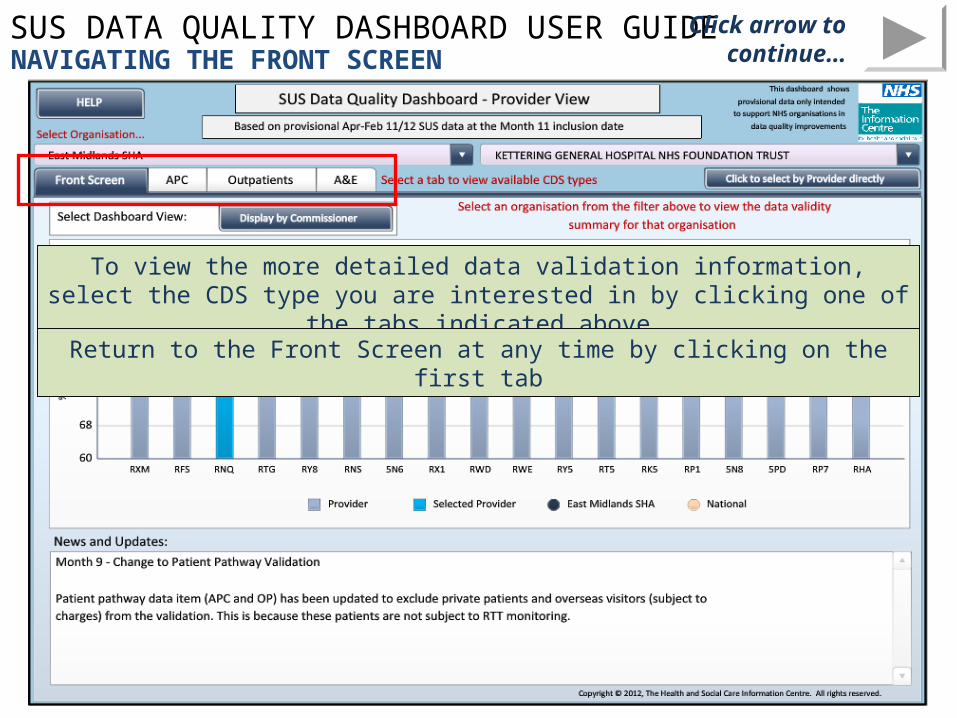
To view the more detailed data validation information, select the CDS type you are interested in by clicking one of the tabs indicated above
Return to the Front Screen at any time by clicking on the first tab
Click arrow to continue…
SUS DATA QUALITY DASHBOARD USER GUIDENAVIGATING THE DATA ITEM VALIDITY SCREENS
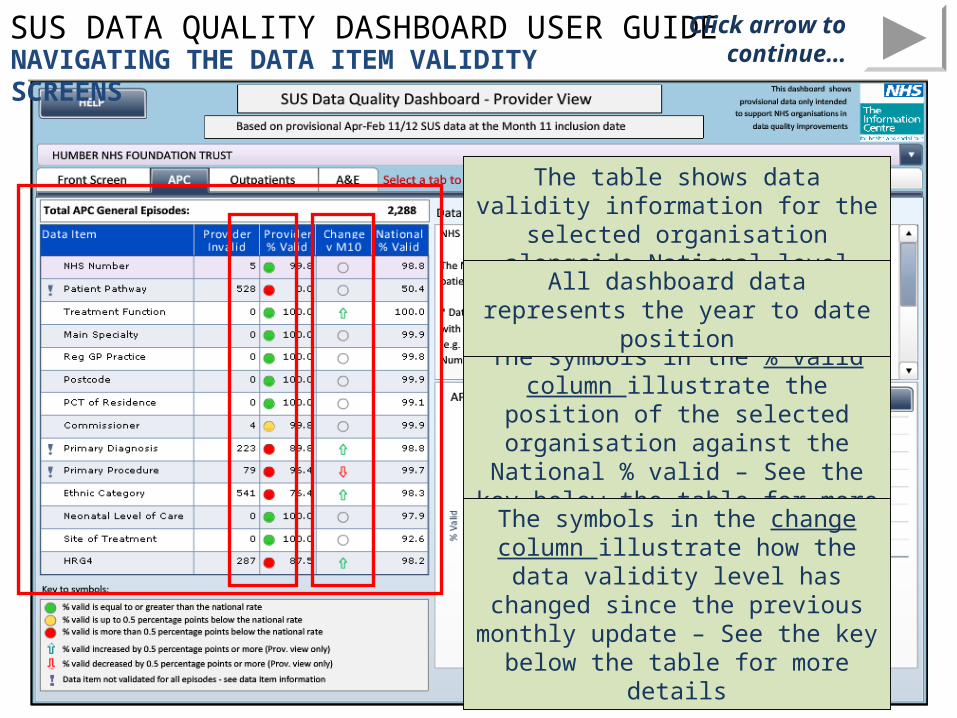
The table shows data validity information for the selected organisation alongside
National level data
Click arrow to continue…
The symbols in the % valid column illustrate the position of the selected
organisation against the National % valid – See the key below the table for more
details
The symbols in the change column illustrate how the data validity level has
changed since the previous monthly update – See the key below the table for
more details
All dashboard data represents the year to date position
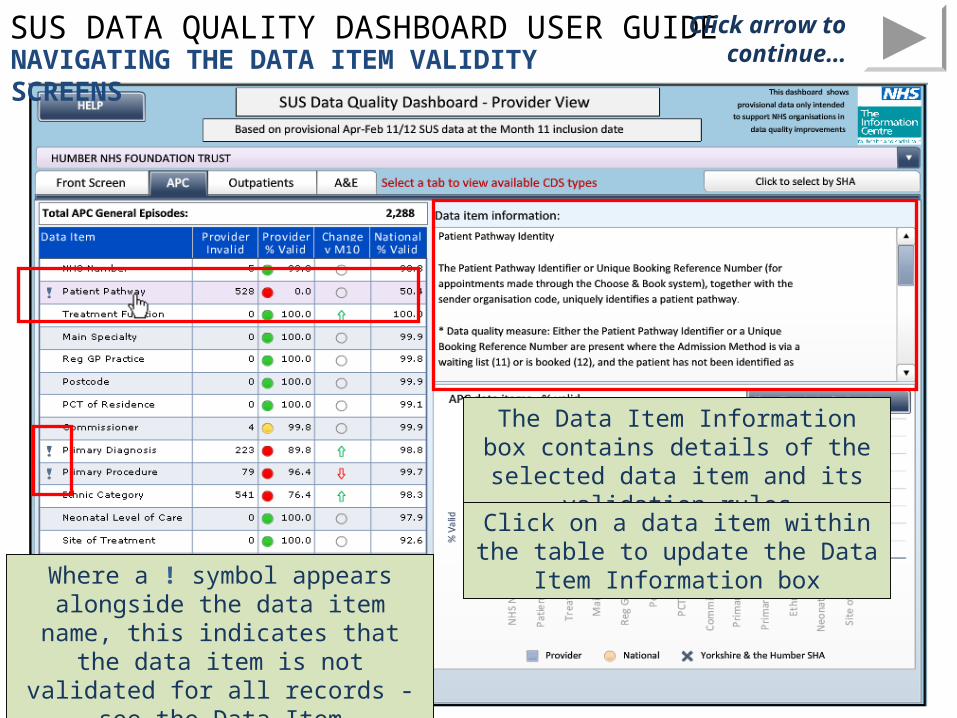
SUS DATA QUALITY DASHBOARD USER GUIDENAVIGATING THE DATA ITEM VALIDITY SCREENS
The Data Item Information box contains details of the selected data item and its
validation rules
Click arrow to continue…
Click on a data item within the table to update the Data Item Information box
Where a ! symbol appears alongside the data item name, this indicates that the
data item is not validated for all records - see the Data Item Information box for
details
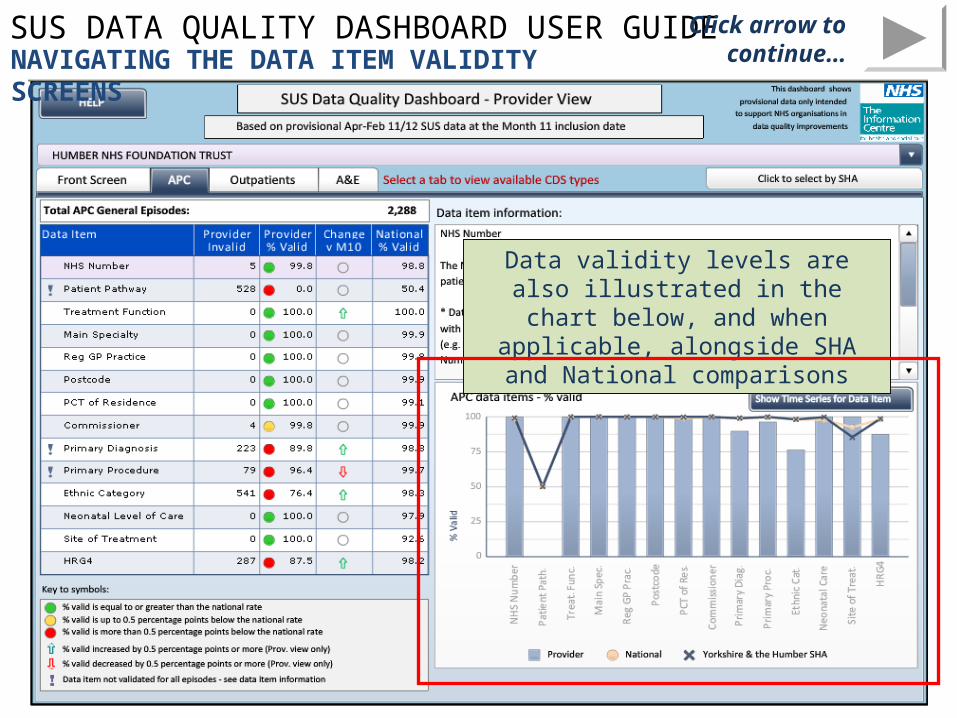
SUS DATA QUALITY DASHBOARD USER GUIDENAVIGATING THE DATA ITEM VALIDITY SCREENS
Data validity levels are also illustrated in the chart below, and when applicable,
alongside SHA and National comparisons
Click arrow to continue…
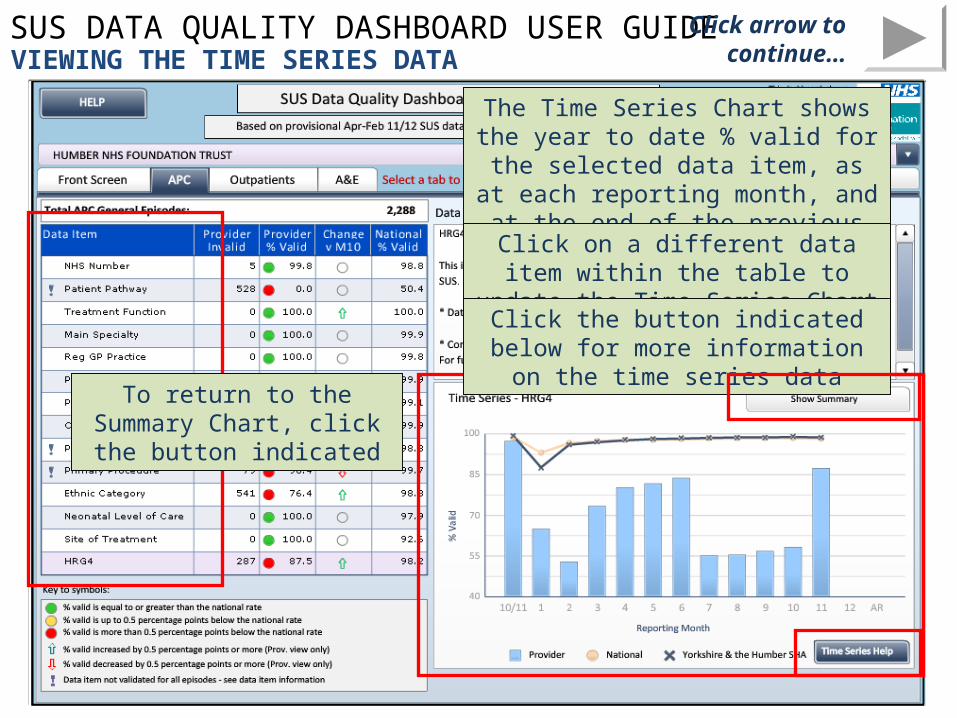
SUS DATA QUALITY DASHBOARD USER GUIDEVIEWING THE TIME SERIES DATA
Click arrow to continue…
To view the Time Series Chart for the data item currently selected in the table,
click the button indicated below
The Time Series Chart shows the year to date % valid for the selected data item, as at each reporting month, and at the end
of the previous financial year
Click on a different data item within the table to update the Time Series Chart
Click the button indicated below for more information on the time series data
To return to the Summary Chart, click the button indicated
SUS DATA QUALITY DASHBOARD USER GUIDE FURTHER INFORMATION
Please contact [email protected] with any queries, or visit the SUS data quality webpage at http://www.ic.nhs.uk/services/secondary-uses-service-sus/data-quality-and-operational-support