Susan Shrestha Proper Mixing of C25 Concrete and Strength Test Metropolia University of Applied Sciences Bachelor of Engineering Sustainable Building Engineering Bachelor’s Thesis 11 March 2019
Transcript
Susan Shrestha
Proper Mixing of C25 Concrete and Strength Test
Metropolia University of Applied Sciences
Bachelor of Engineering
Sustainable Building Engineering
Bachelor’s Thesis
11 March 2019
Abstract
Author Title Number of Pages Date
Susan Shrestha Proper Mixing of C25 Concrete and Strength Test 38 11 March 2019
Degree Bachelor of Engineering
Degree Programme Civil Engineering
Professional Major Sustainable Building Engineering
Instructors
Sunil Suwal, Jorma Säteri, Head of Department
The purpose of this bachelor’s thesis was to highlight the needs of caution during concrete mix to overcome all possible disputes and failures in concrete mixing. The project aimed at delivering important steps necessary to be taken during and after concrete mixing process to achieve quality concrete. To set up the background for the study, a literature review on concrete, cement, aggregates, admixtures, a trial mix was carried out. This review highlighted the importance of proper mix design, concrete element properties, concrete properties, the influence of admixtures on concrete and the importance of compressive strength test. Three different trials mix for C25 concrete grade were carried out in concrete lab. The amount of water in the trials was fixed as well as same aggregates were used for all three trials. The major component of concrete i.e. cement, aggregates were tested before the trials mix. After the concrete mix the speci-mens were tested on 7th and 28th day to find out the compressive strength of concrete mix. Three different strength of C25 concrete were achieved as a result of trials. One trials failed to meet the Mean targeted strength of C25 concrete whereas two trials achieved Mean tar-geted strength. The failure in one trial shows that even following proper caution there might still be some factor that might affect the concrete strength. Therefore it shows the importance of proper concrete mix. From three different results received, the graph was obtained which shows the correlation between compressive strength and water/cement ratio. This graph can be used to predict the strength of C25 concrete in different water/cement ratio. The thesis can be also used as a proper guideline for any concrete mixes as the thesis has summarized the importance of different test and steps to be taken before and after the concrete mix.
Keywords C25, Concrete, Mix trials, Compressive strength test
List of Abbreviations
ASTM American Society for Testing and Materials
BS British Standard
C3S Tricalcium Aluminate
SSD Bulk specific gravity
ACI American Concrete Institute
Contents
1 Introduction 1
1.1 Research Objective 2
2 Concrete Technology 3
2.1 Concrete Curing 3
2.2 Concrete Properties and Their Effect on concrete 5
3 Cement 7
3.1 Cement Properties and Testing 8
4 Fine and coarse aggregates 11
4.1 Combined gradation of aggregates 11
4.2 Specific gravity and water absorption of aggregates 12
5 Admixtures for concrete 13
5.1 Water-reducing admixtures 14
5.2 Air-entraining admixtures 15
6 Mix Design 15
6.1 The Advantage of Mix Design 16
6.2 The Base for Mix Design 16
7 Compressive strength test 21
7.1 Calculation of Compressive Strength 23
7.2 Test reports 24
8 Case study 24
8.1 Description of ingredients 25
8.2 Specific Gravity and Water Absorption Test 27
8.3 Slump test for fresh concrete 28
8.4 Concrete Air Content 29
8.5 Unit weight for fresh concrete 30
8.6 Casting of fresh concrete in mould 31
8.7 The compressive strength of Trial Mixes 31
8.8 Compressive strength VS water/cement ratio 32
9 The Result of the Case Study 33
10 Conclusion 33
References 35
Appendices
Appendix 1. Specific gravity and water absorption of aggregates
Appendix 2. Compressive Test Result
1
1 Introduction
The primary objective of this thesis is to provide information on the proper mixing process
of C25 grade concrete, to be used as a guideline for concrete mixing. Concrete is a
mixture of three components: water, cement and aggregates. The cement paste hardens
through a chemical reaction called hydration, and gains strength. The quality of the ce-
ment paste generally determines the characteristics of the concrete. The hydration be-
tween cement and water makes the concrete harden. The complete hardening of con-
crete takes 28 days after casting. The strength of concrete is calculated in grades which
also refer to the resistance of concrete against a certain compressive force. [1.]
There are different concrete grades, for example, M10, M20, M30, and M40 but there is
also the conventional grading of concrete where the strength of concrete is graded as
C15, C20, and C25. The M and C terms used stand for the mix ratio in concrete which
are either cubic or cylindrical in shapes. Figure 1 below shows the characteristic com-
pressive strength at 28 days and according to the strength class. [2.]
Figure 1. Difference between M and C concrete grade [3.]
2
The C25 grade concrete is concrete that can withstand the compressive strength of
25MPa per square millimeter on the 28th day after casting. The C25 specimen can be
a cube or cylindrical. [4.] The C25 concrete is medium strength concrete. C25 concrete
is used in all construction areas. It is a multipurpose concrete mix, usually used for foun-
dation of infrastructure. [5.]
Several factors affect the strength of concrete. Even with the same water/cement ratio
or aggregate proportioning, the result can vary if the mix design or handling of fresh
concrete is not carried out correctly. [6.] This thesis includes the theoretical research of
some significant and critical components of concrete, which have a considerable impact
on concrete strength and grade. The study is supported by performing a case study of
the concrete mixing. The mixing of C25 concrete is tested by performing strength tests
on the three trial mixes of concrete.
Research Objective
The final year project aimts to show how to perform concrete mixing, and what essential
steps need to be considered during concrete mixing. The strength of the mixture is tested
to achieve quality concrete. The research is based on C25 concrete mixture.
The target is not merely to learn about the mechanics of concrete mixing, but also to
specify some critical tests of concrete like strength, workability, desnisty and air contents.
The research includes the handling and curing of concrete materials such as cement,
aggregates to achieve quality concrete.
Even though there are national codes that already provide the standards, ratios and
proportions of specific concrte grades, there might be lots of factors which can lead to
failure of concrete strength and quality. This study amis to learn about the importance of
a proper concrete mix, concrete elements, and tests. As a result, the study helps to
minimise possible disputes. The primary purpose is to prevent the loss of concrete, time
and money.
3
2 Concrete Technology
Concrete was invented in about 1300 BC. The material used for making it is crude ce-
ment, which was obtained by crushing and burning gypsum or limestone. [7.] The tech-
nology of concrete making improved significantly after 1793 when John Smeaton discov-
ered a modern method of producing hydraulic lime for cement. He used limestone with
clay and fire it until it turned into clinker which was later ground into powder. In 1824,
Joseph Aspdin introduced Portland cement to the world. His technique was to burn finely
ground chalk and clay until the carbon dioxide in them was removed entirely. [8.]
The present-day concrete is a mixture of Portland cement, coarse and fine aggregates,
water and admixtures. The concrete is composed of the aggregates and of water-cement
paste. The paste is made of Portland cement and water which binds the aggregates. The
concrete later changes into of rocklike mass when the concrete paste hardens because
of a chemical reaction. Concrete is one of the critical elements in the construction indus-
try. It is used more than any construction material. It is also the second most used ma-
terials for construction. Although concrete has poor tensile stress resistance it can be
reinforced to overcome the problem. Concrete is widely used in construction industry for
its durability and compatibility. Concrete can easily be moulded into different shapes and
sizes while steel and wood lack this ability. [9.]
The ingredients used in concrete water, cement and aggregates, are cheaper and readily
available, unlike to steel. Concrete, when reinforced, can take bending and tension
forces. Concrete has very high compressive strength which makes it better for structures
and components under compressive loads compare than steels. Concrete can be mas-
sive in size and has better unit weight than steel. Concrete has water tightness which
makes it usable for water retaining structures like bridges, tunnels and dams. [10.] A new
technology is the use of admixtures in concrete to make it workable, durable, economical,
and able to withstand extreme weather conditions. [10.]
2.1 Concrete Curing
Curing is the maintenance of fresh concrete by providing adequate moisture and tem-
perature for a period of time to achieve the desired properties of concrete. Curing should
4
be carried out right after placing and finishing of concrete. The curing process cannot be
overemphasized or be neglected. Curing of concrete is necessary because it has a
strong influence on the hardening of concrete. Curing also affects the durability, water
tightness, strength, abrasion resistance, volume stability and many other properties of
concrete. Furthermore curing prevents the freezing and thawing to concrete. Concrete
slab which is exposed to weather needs proper curing to develop strength and freeze-
thaw resistance. When cement is mixed with water, it is hydrated. Hydration is critical for
the strength and durability of concrete. Freshly mixed concrete contains enough water
for hydration, but concrete itself produces heat. The heat evaporate the water, which can
prevent adequate hydration. The surface of the concrete is susceptible to insufficient
hydration as it is the first to dry up. Therefore concrete structure must be watered to
prevent evaporation and to ensure proper hydration. [11.]
Figure 2. Curing effect on concrete for strength gain. [12.]
With proper curing concrete becomes stronger and more impermeable, resistive to
stress, freezing and thawing. The improvement of concrete is rapid during the first days
and continues slower after some time. Figure 2 shows the strength of concrete in relation
5
to various period of moist curing. The concrete that has been moist-cured entire time has
the best strength compared concrete with shorter moist curing periods. [11.]
2.2 Concrete Properties and Their Effect on concrete
The properties of fresh concrete are its air content, density, and slump, discussed below.
These properties of concrete influence the properties of hardened concrete.
The density of fresh concrete
The first important step after the manufacturing of fresh concrete is to calculate its den-
sity. The density of fresh concrete is useful information that can be used to create a
concrete masonry unit. The density of concrete can affect the physical, aesthetic, engi-
neering and economic characteristics of concrete. [13.]
Slump
The slump test of fresh concrete is one of the most critical tests of trial mix design. The
slump test defines the workability of concrete. Workability refers to the ease with which
the fresh concrete can be placed on site. Good quality concrete should be easy to mix
and transport, should not segregate during placing and consolidation, and should have
good furnishing characteristics. Fresh concrete should be uniform throughout a batch
and able to prevent energy loss. [14.] The workability of concrete can also be defined as
the amount of mechanical energy and high fluidity which can flow and pass without seg-
regation and fill the spaces in the mould with little or no compaction process. [15.]
The slump of concrete may take various shapes when a slump test is performed. Based
on the profile of slumped concrete, it can be classified as one of three forms: a collapse
slump, a shear slump and a true slump. [16.]
6
Figure 3. Types of slumps. [17.]
A collapse slump is concrete that completely collapses when moulded in a slump cone.
When the slump collapses, it generally means that the mix contains too much water and
has high workability, which is not appropriate for a slump test. A slump that makes the
top portion of the concrete shear off and other parts get slips or slide down is called a
shear slump. It may occur due to a lack of cohesion of the mix. A true slump is a slump
that subsides and maintains the shape of the slump cone. [17.]
Air Content
Air content affects the strength of concrete after it has hardened. If the effect of air con-
tent is not considered in trials, it can lead to failure of the concrete specimen and a loss
of time and money. Air content in fresh concrete causes air voids in the concrete which
are not fixable after the concrete is hardened. Air entrainment is an essential component
of concrete mixtures exposed to harsh climatic conditions. It is highly relevant to address
the air content in the design, specification and construction stages. Air content entraining
is essential to reduce the cycle of freezing and thawing of concrete. The air voids form
in concrete once it has set. Air content is easier to control in fresh concrete. The materials
used in the production of concrete - supplementary cementitious materials, admixtures,
aggregates and water - are significant factors that affect the air content in concrete. [18.]
7
Figure 4. Comparison of air content. [19.]
There are different techniques to control the air content of concrete. Some steps to de-
crease the air content can already be taken while selecting the materials for concrete
making. The use of less alkaline cement, the fineness of cement and the usage of an air-
entraining admixture can help to reduce the air content in concrete. The use of fly ash
can decrease air content while increasing the carbon content. The admixture used in
concrete to reduce water can affect the air content as those admixtures are lignin-based
materials. The aggregates need to go through several tests, and their specific gravity
and water absorption capacities should be addressed as they also affect the increase
and decrease in the air content of concrete. [18.] Figure 4 shows concrete with no air
entrainment on the left and air entrained concrete on the right.
3 Cement
Cement, a finely grained compound, is a mixture of clinker and gypsum that have been
ground into a fine powder. Cement is one of the critical materials used in concrete as a
binding agent. It has a significant impact on the strength of the concrete. When making
concrete, the cement is mixed with water. The mixture then hardens after a period called
the setting time of cement. The gypsum in cement is necessary to prevent early setting
and hardening and allows the users to work with the cement for a long time. [20.]
The grade of cement is classified according to its compressive resistance strength. The
compressive resistance strength of cement is established with a compressive strength
test on cement mortar. The cement mortar is made of cement, water and natural sand.
8
The analysis is carried out on the 28th day of the casting of cement mortar. The strength
of cement is measured in megapascals (MPa). [20.]
The use of a higher grade of cement allows the user to achieve a higher strength with
the same water-cement ratio. Another way to choose the correct cement grade for a
targeted strength is the use of cement curves, which are also used to classify the water-
cement ratio. However, the user should not entirely depend on the cement grade, be-
cause the strength of concrete also depends on the way the cement is stored, and on
concrete mixing, curing, casting, hydration and many other factor. In some cases, ce-
ment with a lower grade can be used to make stronger concrete than higher-quality
cement that has been stored for a long time in degradable condition. [21.]
3.1 Cement Properties and Testing
There are several factors which affect the properties of cement. It is essential to know
the properties of cement since then can profoundly affect the setting and hardening of
the cement. Various test can be performed to understand the properties of cement. The
testing of cement is based on its fineness, setting time, bending strength, chemical com-
position, the heat of hydration and soundness. It is essential to know the type and
strength of cement before using it in concrete because it plays a significant role in ob-
taining the strength of concrete. [22.]
Fineness of cement
The fineness of cement directly influences the hydration, strength, setting, and heat hy-
dration and hardening properties of cement. If the cement particles are finer, the total
surface area is larger and the area in contact with water is also larger which speeds up
hydration, the setting and hardening of cement. Fine cement also gives high early
strength. Cement with too small particles reacts quickly with water and carbon dioxide in
the air which react with cement and decline the quality of cement. In general, the grain
size of cement particles is in the range of 7-200 µm. [23.]
The fineness test of cement is carried out by sieving cement on of standard sieve. A
good quality cement contains less than 10% of cement particles which are bigger than
9
90 µm. To carry out of fineness test, 100 gm of cement is sieve with a standard sieve of
size 90µm. The calculation is done with the formula below.
% of cement retained on standard sieve = W2
W1∗ 100 (1)
Where
W1 is the 100 gm of cement used for test
W2 is the residue retained on standard sieve. [23.]
Setting time
It is essential to know the setting properties of cement, also known as the stiffening of
cement paste. It is the state when cement starts to change from fluid into rigid state. The
setting property of cement is tested with Vicat apparatus where the cement paste is pen-
etrated with several needles with the different diameters at in different intervals of time.
[24.]
Soundness of cement
The soundness of cement can be explained as the volume stability of cement. The
soundness is the ability of cement paste to hardened and retain volume without delayed
expansion. Cement expands because of excessive amount of lime and magnesia. [25.]
It is not good for cement to undergo changes in its volume which can lead to catastrophic
failures in a construction process.
The soundness test of cement is carried out with a Le Chatelier test. The apparatus
consists of a small cylinder with two indicators with pointed ends. The cement paste is
allowed to set in the device for 24 hours in water at near to room temperature. An initial
reading is recorded after 24 hours. The mould with cement is then boiled in water, and
checked how much expansion the indicator points at. The increase describes the ex-
pansion property of the cement. [25.]
10
Cement’s composition
The characteristics setting and hardening of cement are affected by several factors. The
cement’s composition such as the minerals of cement and their ratios are directly related
to the characteristics of cement reacting with water. For example, high tricalcium alumi-
nate (C3A) content increases the setting and hardening of cement. Cement with high
C3A content also releases a lot of heat when hydrating. [26.]
Gypsum content
The gypsum amount in cement also influence the regulating the setting time of cement.
Cement condenses quickly and mixes with water and generates heat if gypsum is not
used in cement. The reaction is caused by of tri-calcium aluminate (C3A) in cement
which causes the hydration of calcium sulfoaluminate and affects the regular use if ce-
ment. The content of gypsum in cement should be in right proportion. Too much gypsum
can also accelerate the setting time of cement as it can act like a clotting agent itself,
and destroy the cement uses. [26.]
Water content
The water amount in cement has a huge impact on the strength and setting time of ce-
ment. An increase in the water amount will enhance the number of capillary porosities
and decrease the strength, as well as increase the setting time of cement. [26.]
Admixture in cement paste
The admixture can have a significant impact on cement properties as it can influence the
chemical composition like tricalcium silicates and tricalcium aluminate of cement. The
setting, hydration and hardening of Portland cement are compelled by tricalcium silicate
(C3S) and tricalcium aluminate (C3A). These chemical composition can be slowed down
or accelerated by the use of admixture as a result it affects setting and hardening of
cement. [26.]
Storage of cement
11
The binding capacity of cement is always affected by its storage process. If the cement
is exposed to moisture, it can easily be destroyed. It is estimated that the cement losses
10%-20% of its strength after 3 months, 15%-30% in six months and up to 40% after one
year. That is why cement should be use is within 3 months of its manufacture. [26.]
4 Fine and coarse aggregates
Aggregates are one of the major elements for concrete. The right type and quality of
aggregates cannot be compromised while making concrete. The amount of fine and
coarse aggregates in concrete is up to 60% to 75% of the concrete volume and 70% to
85% by mass. The aggregates have a significant effect on the properties of both freshly
mixed and hardened concrete. Fine aggregates consist of natural sand or crushed stone.
The maximum nominal size of fine aggregates is 5mm. They are made of natural gravel
and sand which are dug or dredged from a pit, river, lake, or seabed. The grading limit
of fine aggregates is carried out by a sieve analysis, which is the percentage of aggregate
particles that pass through a sieve. Coarse aggregates are made of a combination of
gravel or crushed stone. The size of coarse aggregates is larger than 5 mm. The normal,
acceptable range for aggregates is between 5 mm to 40 mm. Coarse aggregates are
made by crushing quarry rock, boulders, cobbles, or large-size gravel. Coarse aggre-
gates increase the strength of concrete. The strength of coarse aggregates is defined by
the crushing strength of rock and the crushing and impact values of aggregates. [27.]
4.1 Combined gradation of aggregates
Combined gradation of fine and coarse aggregates is important to ensure that an amount
of aggregates with a minimum amount of void space is obtained. The proper combine
gradation of concrete saves the amount of cement and water paste in concrete and helps
to improve the dimensional stability and the durability of concrete. Combined gradation
of aggregates:
Increases the workability of concrete.
Lowers the cracking potential of concrete as it helps to reduce thermal and drying shrinkage.
12
Increases the durability of concrete by lowering permeability.
Is economical as it reduces cement paste consumption for concrete mixing.
Supports sustainability as it makes better use of the aggregates and in-creases the durability of the concrete. [28.]
4.2 Specific gravity and water absorption of aggregates
Specific gravity of aggregates can be simplified as the ratio of the volume of aggregates
to the equal volume of water used for making concrete. The specific gravity of the aggre-
gates is vital to know because it explains the strength and quality of the aggregates.
Aggregates with higher specific gravity are stronger compared to ones with low specific
gravity. [29.]
The water absorption capacity of aggregates is the ability of aggregates porosity and
absorption property which influence the bonding between the aggregates and the cement
paste. Aggregates with all pores full are called saturated aggregates and dried surface
aggregates are called saturated-surface-dry. The aggregates in saturated surface dry
conditions evaporate some water from their pores, these are called air dry aggregates.
[29.]
The specific gravity of aggregates is calculated with the formula which is based on ASTM
standards.
Specific gravity (SSD): S / (B+S-C) (2)
Where
S is the weight of dry material. B is the weight of flask and water up to calibration mark
.C stands for weight flask and SSD aggregate and water up to calibration mark. The
water absorption percentage of aggregates is calculated with the formula:
𝐴𝑏𝑠𝑜𝑟𝑝𝑡𝑖𝑜𝑛 % = (S − A)/A ∗ 100) (3)
13
Where A is the weight of oven dried material. Testing the specific gravity and water ab-
sorption of aggregates is necessary to detect any change of material, or possible con-
tamination. It is necessary to know the specific gravity is necessary for calculating the
percentage of voids and the solid volume of aggregates in computations of yield. The
water absorption capacity of aggregates needs to be indicated because if aggregates
are highly absorptive, it can lead to low durability of concrete. High absorption of aggre-
gates gives an increase in weight of material, due to the water in their pores. [30.]
5 Admixtures
Concrete admixtures are important ingredients in concrete. They are used during the
mixing of concrete for several reasons. Different admixtures have a different purpose in
making concrete. The type of admixture that is added to concrete depends on its func-
tions. Some of the known admixtures are air-entraining, water-reducing, plasticisers, ac-
Here, 8.3 MPa is the standard deviation obtained from the table of approximate contents
assumed after concrete design mix. The normal range of assumptions that can be made
for any certain grade is 10 MPa above the characteristic strength. Fcr’ is the targeted
mean strength. The ACI code has predefined deviation for certain grade of concrete can
tolerate. According to the ACI method if the characteristic strength is between 20.7 to
34.5 MPa the standard deviation is 8.3 MPa. [34.]
Strength –based uses of Cement
The strength of cement is determined with either a conventional method or the acceler-
ated curing reference mix method. The cement is picked or classified from the curve
based on the strength of cement. In general, almost all cement types can give the tar-
geted strength, but the proportion of cement to the other ingredients of concrete might
not mix properly, so it is necessary to select the right cement grade for true concrete
strength. [35.]
Table 1. Cement grade curve. [35.]
Curve The strength of cement (N/mm2)
A 31.9 – 36.8 B 36.8 – 41.7 C 41.7 – 46.6 D 46.6 – 51.5 E 51.5 – 56.4 F 56.4 – 61.3
Table 1 i.e. Cement grade curve are used to find out grade of cement should that are
applicable for certain concrete grades to get the characteristic strength of concrete. For
example, C25 concrete can use the cement from curve A. The range of curve A satisfy
the characteristic strength of C25 concrete But it doesn’t mean C25 cannot use the ce-
ment from other curves in fact, it might be better for a user to use cement with higher
strength so that the user can easily achieve their targeted strength for concrete.
19
Figure 6. Cement grade curve. [36.]
The cement can be classified into several curves as shown in table 1. Figure 6 also
shows the same information along with the influence of water cement ratio applied to the
mix design. [35.]
Water / Cement Ratio
The water/cement ratio is the ratio of the weight of water to the weight of cement in
concrete. Water is used in concrete as a bonding agent. The water in concrete also
shapes the workability of concrete. The air voids in concrete depend on the ratio between
water and cement. They increase with an increase in water, which results in a decrease
in concrete strength. Therefore, it can be stated that the relation between the strength of
concrete is inversely proportional to the ratio of water and cement. [37.]
Figure 7. Strength vs W / C ratio. [38.]
20
Figure 7 shows that the mix has the highest strength when the water/cement ratio is at
its lowest and the compressive strength of the mix decreases with increased use of water
for the mix. The curve also depends on the compaction which can be achieved by using
vibrators or manual hand compaction. However, a low water/cement ratio does not guar-
antee the best compressive strength of concrete. For example, using larger aggregates
with a low ratio of water/cement can lead to the development of tensile stresses as a
result of shrinkage and creep. This kind of mixture can result in cracking of the concrete
because of a loss of bond between cement and aggregates. [36.]
As shown in figure 7 under full compaction, compressive strength is inversely proportion
to water cement ratio. The water/cement ratio can be calculated as,
𝑓𝑐 = 𝐾1/(𝐾2^(𝑊/𝐶)) (7)
Where,
Fc is the compressive strength,
K1, K2 are empirical constant,
W/C is the water to cement ratio. [36.]
Another use of water/cement ratio is the workability of concrete, as more water is re-
quired to make concrete workable. Another reason that affects the water demand is the
use of an admixture, such as a water reducing agent which allows the user to reduce the
amount of water and still make the concrete workable. [39.]
Calculation of Cement Content
Once the water content and water-cement ratio is determined, the amount of cement per
volume of the concrete can be calculated. The cement content is determined using fol-
lowing formula:
𝑐𝑒𝑚𝑒𝑛𝑡 𝑐𝑜𝑛𝑡𝑒𝑛𝑡 =free water content
𝑤𝑎𝑡𝑒𝑟−𝑐𝑒𝑚𝑒𝑛𝑡 𝑟𝑎𝑡𝑖𝑜 (8)
The result value is checked against the range specified. Here free water content depend upon the type of maximum size of aggregates used in concrete. [40.]
21
7 Compressive strength test
A compressive strength test is a process of measuring the strength of hardened concrete
specimens using a compression-testing machine shown in figure 8. Concrete mix design
provides wide ranges of mechanical and durability properties in concrete to meet the
requirements of structures. The compressive strength test is most commonly used test
to measure the properties of concrete. The compressive strength of concrete is the load
at which the specimens collapse. The SI unit of this strength is a mega-pascal (MPa).
[41.]
The test results are used to guarantee that the concrete mixture meets the requirements
of the specified strength, F’c. Compressive strength test results are also used for quality
control, acceptance of concrete and assumption of concrete strength in structure. Two
different types of concrete specimens, cubes and cylinders, can be used as concrete
specimens. [18.] Different codes use different concrete specimens. For example, British
standard (BS) code uses cubes because their strength is higher than that of cylinders
because of the platen effect applied to cubes. The strength of a cube is 20% higher than
that of a cylindrical specimen. Cylindrical concrete specimens are used because they
give precise strength of concrete which is almost equal to the true strength of concrete.
The proportion of the shape is same as the stress distribution under axial load. The
American Society for Testing and Materials (ASTM) code used cylindrical concrete spec-
imens. [42.]
The compressive strength test is calculated as a results from the average of 3 concrete
specimens. The test are made on 7th and 28th day after the casting of the concrete spec-
imens. Different codes design the average strength, F’cr, which is higher than the char-
acteristic strength of concrete. The F’cr strength of concrete is generalized as a mean
target strength of concrete. The mean targeted strength are the targeted strength of con-
crete than characteristic strength of concrete its self. The mean targeted strength is nec-
essary to avoid the risk of not complying with strength specifications. [42.]
22
Figure 8. Compressive strength test using a compression machine. [43.]
It is important for concrete to comply with the strength requirements of the specification.
Any strength test should comply with the criteria below:
None of the three tests should break the tested concrete specimen before characteristic strength of concrete is reached, if they do, the mix design is not accepted as following the specification.
The mean targeted strength is calculated as the average of three separate, consecutive tests that are either equal or exceed the characteristic strength, F’c.
The failure in an individual test below the characteristic strength does not mean that the
designed concrete does not meet specifications. Several factors may affecting the re-
quired average strength. The failed result may be the result of a failure in testing, fabri-
cation handling, curing or testing of concrete specimens not conducted by contracted
procedures. [44.]
General instructions for a compressive strength test are:
Either cylindrical or cubical concrete specimens are used for the compres-sive strength test. The specimens’ size can vary, as maybe mentioned in
23
the company specification. Smaller specimens are easier to make and han-dle in the laboratory.
The mass of the specimen is recorded, to avoid of any disputes.
The concrete specimen used must not have dried out before testing. The specimens are kept in mounds for 24 hours and then in water for curing.
The bearing surface of the test machine is cleaned.
The specimen is placed in the machine so that the load can be applied to the opposite sides of the cube cast. The specimen is aligned centrally on the base plate of the testing machine. Cylindrical specimens are placed in the centre of the machine. The ends of cylindrical specimens must not de-part from perpendicularity with the cylinder axis by more than 0.5 degrees.
The maximum load is noted, and any unusual features are also recorded. [44.]
7.1 Calculation of Compressive Strength
A minimum of three specimens should be tested for all ages, i.e. 7 and 28 days. The
strength of the specimens should not vary by more than 15% of the average strength, or
the result is rejected. The crushing strength is always the result of an average of three
specimens. The important measures and reading required for the calculation of the
strength test of concrete before and after the compressive strength test are,
Size of specimens
Area of specimens
Characteristic compressive strength at 7th day
characteristic compressive strength at 28th day
Compressive strength is equal to the load / Area in N/mm2. [44.]
24
7.2 Test reports
A test should include an identification mark of the specimen, the date of the test, the age
of the specimen, curing conditions, and the manufacturing date of the specimen. It can
also include the appearance of a fallen specimen or any unusual characteristics, shown
during the test. [44.]
8 Case study
The case study that deals with the compressive test of C25 mix is based on the technical
test carried out for the Melamchi Water Supply Project. The project is located in Mel-
amchi, Sindhupalchok District of Nepal. The Nepalese government funds this project.
The main project objectives are to reduce the chronic water shortage situation within the
Kathmandu valley. The primary work of this project is to construct a 26.3 km long water
diversion tunnel which will divert 170 million litres of raw water to Kathmandu valley daily.
The trial mix design, compressive strength test, and case study of concrete C25 were
carried out at the laboratatoryof the Melamchi Water Supply Project lab. All the equip-
ment and material used in this process were from the Melamchi Water Supply Project.
This study was also carried out to produce a C25 concrete mix with excellent workability.
It was necessary for concrete to have good slump and workability because the batching
plant of concrete was far away from the actual working site. The concrete should not set
before it was cast at the working site.
The case study provides detailed information and maps the progress of the concrete
mixing. Furthurmore, it offers understanding of the reasons behind possible disputes that
might occur during concrete mixture and strength test. The case study is necessary as it
offers a complete picture of how to perform concrete mixing, test strength of concrete
and what conclusions can be drawn from the research.
25
8.1 Description of ingredients
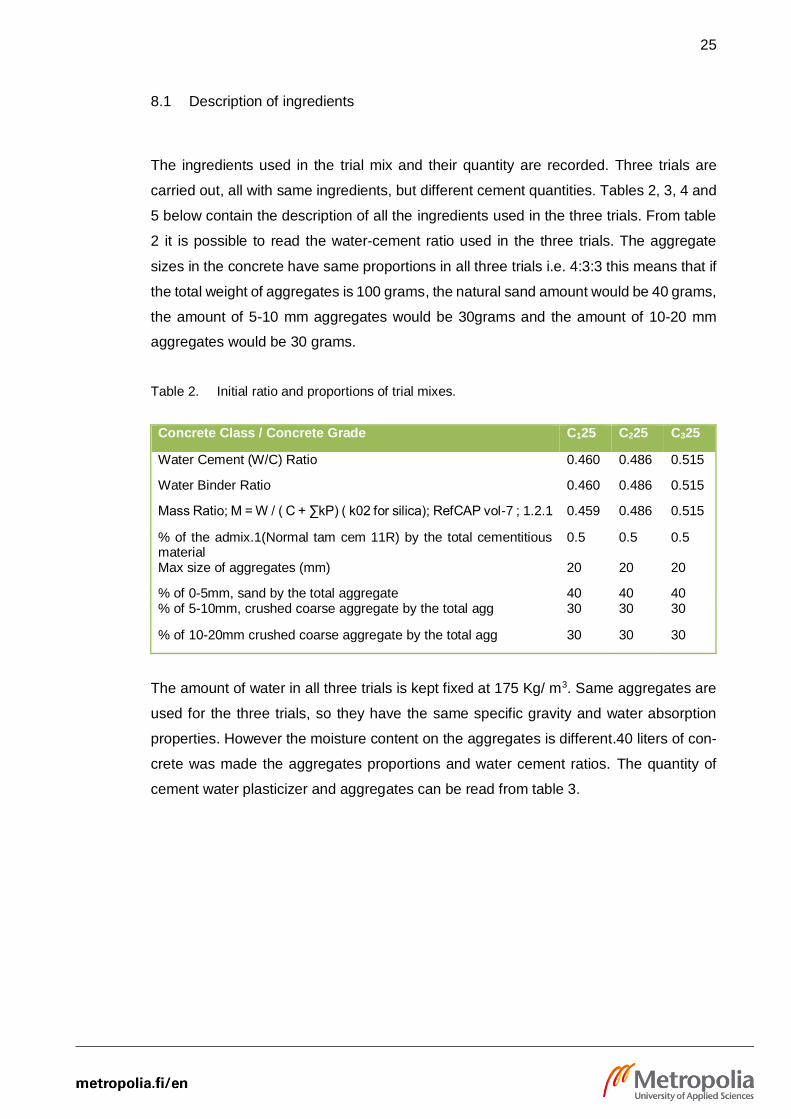
The ingredients used in the trial mix and their quantity are recorded. Three trials are
carried out, all with same ingredients, but different cement quantities. Tables 2, 3, 4 and
5 below contain the description of all the ingredients used in the three trials. From table
2 it is possible to read the water-cement ratio used in the three trials. The aggregate
sizes in the concrete have same proportions in all three trials i.e. 4:3:3 this means that if
the total weight of aggregates is 100 grams, the natural sand amount would be 40 grams,
the amount of 5-10 mm aggregates would be 30grams and the amount of 10-20 mm
aggregates would be 30 grams.
Table 2. Initial ratio and proportions of trial mixes.
Concrete Class / Concrete Grade C125 C225 C325
Water Cement (W/C) Ratio 0.460 0.486 0.515
Water Binder Ratio 0.460 0.486 0.515
Mass Ratio; M = W / ( C + ∑kP) ( k02 for silica); RefCAP vol-7 ; 1.2.1 0.459 0.486 0.515
% of the admix.1(Normal tam cem 11R) by the total cementitious material
0.5 0.5 0.5
Max size of aggregates (mm) 20 20 20
% of 0-5mm, sand by the total aggregate 40 40 40 % of 5-10mm, crushed coarse aggregate by the total agg 30 30 30
% of 10-20mm crushed coarse aggregate by the total agg 30 30 30
The amount of water in all three trials is kept fixed at 175 Kg/ m3. Same aggregates are
used for the three trials, so they have the same specific gravity and water absorption
properties. However the moisture content on the aggregates is different.40 liters of con-
crete was made the aggregates proportions and water cement ratios. The quantity of
cement water plasticizer and aggregates can be read from table 3.
26
Table 3. Quantity list of concrete materials used for making 3 different trials.
Trials Cement kg
Water kg
plasticizer kg
0-5 N.sand kg
5-10mm Agg kg
10–20 mm Agg kg
1 15,217 6,059 0,077 29,021 21,273 21,448
2 14,400 6,715 0,072 28,735 21,446 21,503
3 13,592 5,641 0,072 29,925 21,784 21,850
Table 4 shows the passing percentage of different aggregates through different sieve
sizes. The natural sand, 5-10 mm aggregates and 10-20 aggregate were sieved. The
residue of aggregates was recorded and plotted in a graph to get the combined grading
The unit weight of concrete can be primarily affected by the unit weight of aggregates.
The unit weight also affects the compressive strength of concrete, so it is essential to
know the unit weight of concrete. The allowed standard density of the concrete is from
2400 to 2300 kg/m3. [12.] The results show that the density of fresh concrete from the
three trial mixes satisfy the criteria of the standards.
31
8.6 Casting of fresh concrete in mould
The fresh concrete was cast in 8 moulds. Although the test was carried out in 3 speci-
mens at 7th and 28th days after casting, two other specimens were cast to avoid possible
disputes. The size of mould was 15*15*15 cm3. The cube specimens were cast. After
casting of the cube, the curing of specimens was necessary. The cube was allowed to
set for 24 hours and demould without damaging the cube. The numbers were given to
each cube and kept immediately in the curing tank at room temperature. The curing of
concrete was done up to the time of testing.
8.7 The compressive strength of Trial Mixes
The compressive strength test of the trial mixes was carried out in Bahuni pati Central
laboratory. The strength test was carried out using a compressive strength tester on the
7th and 28th day after the manufacturing of the concrete cube specimens. Before per-
forming the compressive strength test, the weight, volume and density of all cubes were
measured. Three different concrete specimens were used on the 7th and 28th day to test
the compressive resistance of the concrete. The test results of the three specimens for
the trials are summarised in the tables below.
Tables 13, 14 and 15 in appendix 2 show the compressive strength of the three different
concrete specimens on the 7th and 28th day after casting. It is necessary to perform
strength test on the 7th day even though the concrete only gets, its near to final strength
on the 28th day after casting because the user can already estimate if the concrete will
be able to achieve the targeted strength on the 28th day. The readings also show that
trial 3 was unable to achieve the target strength, but was still valid as it had the charac-
teristic strength of C25 concrete. This is also the reason why of trial can be acceptable
for use, but not the best option for construction purposes because the work site might
have different conditions than the lab where trial mix is carried out.
32
8.8 Compressive strength VS water/cement ratio
The result of the three trial mixes was plotted in a graph. Figure 11, the graph shows the
relationship between the compressive strength of the concrete compared to the water-
cement ratio on the 7th and 28th day. From the three trials three different W/C ratios and
their compressive strength on the 7th and 28th days were established.
Table 8. Water-Cement Ratio vs compressive Strength of Concrete.
SN W/C Seven days comp. strength(MPa)
28th days comp. strength(MPa)
1 0.461 24.7 38
2 0.486 21.1 35.7
3 0.515 19.8 33.2
The graph in figure 11 can be used to find out the correlation between the compressive
strength of concrete and its water-cement ratio. For example, if the water/cement ratio
of 0.5 is used for preparing concrete mix then its corresponding compressive strength
ratio on the 28th day can be predicted as 34.5 MPa for C25 concrete.
Figure 11. Compressive strength vs Water – Cement ratio.
33
9 The Result of the Case Study
The principal aim of a trial mix is to establish, per cubic meter of concrete, an optimum
amount of each concrete ingredient. The result has well satisfied the strength criteria as
well as workability of the concrete. Three different trials were carried out by taking a fixed
amount of water, i.e. 175 kg/m3 with different water-cement ratios. A water reducing
agent at 0.5% by the weight of cement was used to make concrete compatible with the
suitable concrete pump. In the three trials, the slump after 30 minutes was in the range
of 130-170 mm, an acceptable limit for the concrete pump. It was necessary as the re-
sults show the concrete has excellent workability and can give the user enough time for
the placing and casting of concrete.
Table 9. C25 concrete at 0.5 water-cement ratio.
W/C
Weight of ingredients in kg for cubic meter of concrete
Water kg/m3
Cement kg/m3
Natural sand kg/m3
5-10MM aggrega-tes kg/m3
10-20mm aggregates kg/m3
Admixture kg/m3
0.5
175 350 715 540 540 1.75
Table 15 shows the amounts of the ingredients that are used when 0.5 water cement
ratio is used for concrete mix to achieve 34.5MPa strength on 28th day. The ingredient
amounts for 0.5 water-cement ratio are calculated from the trial mix sheet and shown in
table 15 above.
10 Conclusion
Concrete is an essential material for infrastructure because of its versatility and economic
efficiency. Identifying the critical issues and factors that affect concrete and its strength
is necessary. The study has pointed the most important aspects of concrete ingredients
and their use when making concrete. The thesis shows the importance of common pro-
cedure that is essential in order to achieve quality concrete with the least possible num-
ber of trial mixes to allow the consumer to save time and money.
34
The research and laboratory mix also show that the admixtures are critical ingredients
for proper concrete mixing. The study has also shown how the use of an admixture en-
hances the workability of fresh concrete. The use of a water reducing admixture for a
fixed water quantity can increase the workability of concrete.
The graph in figure 9 in chapter 8.1 was obtained from three different trials of compres-
sive strength versus water/cement ratio. The graph shows that at constant water amount,
one can use the graph to select a water/cement ratio for the trial mix of C25 concrete
and achieve strengths.The recommendations of the thesis address the importance of
proper concrete mixing, the test of cement, aggregates, and concrete itself to minimize
the failure in making quality concrete. The thesis also recommends the most important
factor that affects the strength of concrete when performing the concrete mix, because it
can already map the progress on the mixing of concrete. The 7th day test can already
give a glimpse if the concrete composition is in the correct order or whether it will achieve
the targeted strength in 28th days of time. This prevents the time loss in case of failure.
The thesis can be used as possible guideline for proper concrete mixes of C25 concrete.
35
References
1 Daily Civil. 2017. Grades of Concrete - Daily Civil. Online. < Http: //www.dai-lycivil.com/grades-of-concrete/.> Accessed 8 Jan 2019.
2 Silica Fume for Sale, Microsilica Supplier in China. 2019. Conventional grade C20, C25 and C30 concrete mix ratio - Silica Fume for Sale, Microsilica Supplier in China. Online <http: //www.microsilica-fume.com/conventional-grade-c20-c25-c30-concrete-mix-ratio.html.>. Accessed 8 Jan 2019.
3 Construction technology. Online. <https://www.youtube.com/watch?v=cSN8B16lqOQ>. Accessed 8 Jan 2019.
4 Adewole; K; Olabanji Ajagbe; W. & Ademola Arasi. 2015.82. Online. <Http: //lejpt.academicdirect.org/A26/079_088.pdf.>. Accessed 8 Jan 2019.
5 Concrete, B. 2019. Different Types of Concrete Grades and their uses | Base Concrete. Online. Baseconcrete.co.uk. <https://www.baseconcrete.co.uk/differ-ent-types-of-concrete-grades-and-their-uses> Accessed 8 Jan 2019.
6 Aguado a; C.galvez J; Fernadez D; De la Fuente A. Online. Core.ac.uk. 2018. <https://core.ac.uk/download/pdf/46111757.pdf>. Accessed 15 Jan 2019.
7 The History of Concrete - InterNACHI. Online. Nachi.org. 2018. <https://www.na-chi.org/history-of-concrete.htm> Accessed 8 Jan 2019.
8 Pepin R. The History of Concrete. Giatec Scientific Inc. Online. Giatec Scientific Inc. 2018.<https://www.giatecscientific.com/education/the-history-of-concrete/>
9 Steel Structures Vs Concrete Structures | Complete Comparison of Steel & Con-crete. Online. < https://civildigital.com/steel-structures-vs-concrete-structures-complete-comparison-of-steel-concrete/> Accessed 8 Jan 2019.
10 Kozul R, Darwin D. Effects of Aggregate Type, Size and Content on Concrete Strength and Fracture Energy. Online. Lawrence, Kansas: http://www2.ku.edu; 1997. <http://www2.ku.edu/~iri/publications/sm43.pdf>. Accessed 8 Jan 2019.
11 Concrete in Practice. Nrmca.org. Online. <https: //www.nrmca.org/aboutcon-crete/cips/11p.pdf.> Accessed 8 Jan 2019.
12 Jerzy Z; Zemajtis. Role of Concrete Curing. Online. < https://www.ce-ment.org/learn/concrete-technology/concrete-construction/curing-in-construction> Accessed 8 Jan 2019.
36
13 Density- Related Properties of Concrete Masonry. Online. 1st ed. Building Con-struction and Design Viewpoint; < https://masonryadvisorycouncil.org/wp-con-tent/uploads/2015/11/Density-of-Concrete-Masonry.pdf. > Accessed 23 Novem-ber 2018.
14 Soundness test of cement. Online <http: //civilsutra.in/soundness-test-of-ce-ment/.> Accessed 8 Jan 2019.
15 Wihardi Tjarong M; Djamaluddin R; Sampebulu V. Compressive Strength and Slump flow of Self Compacting Concrete Uses Fresh Water and Sea Water. Online. Arpnjournals.com. 2018. <http://www.arpnjournals.com/jeas/research_pa-pers/rp_2015/jeas_0415_1770.pdf>. Accessed 10 Jan 2019.
16 Concrete Slump Test Procedure, Applications & Types of Slump. Online. <https://www.aboutcivil.org/concrete-slump-test.html> Accessed 11 Jan 2019.
17 What are the difference between shear slump and collapse slump in slump test?
Online. <https://www.engineeringcivil.com/what-are-the-differences-between-shear-slump-and-collapse-slump-in-slump-test.html> Accessed 12 Jan 2019.
19 Control of Air Content in Concrete. Volume19/Number 1. April 1998.<https://www.cement.org/docs/default-source/fc_concrete_technol-ogy/pl981.pdf>
20 What are the different grades of Cement? - General Knowledge Today Gktoday.in. 2018. Online. <https://www.gktoday.in/gk/cement/>. Accessed 15 Jan 2019.
21 Akhtar N. Strength of Concrete vs Grades of Cement. Online. Nbmcw.com. 2018. <https://www.nbmcw.com/tech-articles/concrete/25796-strength-of-concrete-vs-grades-of-cement.html>. Accessed 16 Jan 2019.
22 S.Patil C. Lab Manual of 1 Concrete Technology. Lecture presented at Sanjay Ghodawat Group of institutions. <http://www.sginstitute.in/Down-loads/Civil_Downloads/Manual_ConcreteTech.pdf>.
23 Pranav; K; and kushwaha; P. 2019. Fineness test of Cement and its Significance | Tests on Cement. Online. <https://civilread.com/fineness-test-cement>. Ac-cessed 8 Jan. 2019.>. Accessed 20 Jan 2019.
24 Cement Consistency Test - Standard Consistency of Cement by Vicat Apparatus. Online <http://www.civilology.com/consistency-test-of-cement/ Accessed 8 Jan 2019.
25 Soundness test of cement. Online. <http: //civilsutra.in/soundness-test-of-ce-ment/.>. Accessed 8 Jan 2019.
27 Design and Control of Concrete Mixtures. 16th ed. 5420 Old Orchard Road: Port-land Cement Association; <http://www.ce.memphis.edu/1101/notes/con-crete/PCA_manual/Chap05.pdf>
28 Gradation of Aggregates and its Effects on Properties of Concrete. 2019. Volume 3(2). Online <https: //www.researchgate.net/publication/301957055_Grada-tion_of_Aggregates_and_its_Effects_on_Properties_of_Concrete.>. Accessed 8 Jan. 2019.
29 Aggregates. 2019. Online. <http://civil.emu.edu.tr/courses/civl284/4%20Aggre-gates.pdf>. Accessed 8 Jan 2019.
30 Exp 3 & 4 specific gravity & water absorption – Civil Engineers PK. Online. <https://civilengineerspk.com/transportation-engineering-experiments/exp-3-4-specific-gravity-water-absorption/#comment-91105>. Accessed 8 Jan 2019.
31 Design and Control of Concrete Mixtures. 16th ed. 5420 Old Orchard Road: Port-land cement Association.
32 Materials Selection Guide: Water Reducing Admixtures. Concreteconstruc-tion.net. 2006. Online. <https://www.concreteconstruction.net/how-to/materi-als/materials-selection-guide-water-reducing-admixtures_o>. Accessed 15 Jan .2019.
34 Concrete for Sustainable Construction. 2018. Online. <https: //www.re-searchgate.net/publication/280864905_Concrete_for_sustainable_construction.>. Accessed 8 Jan 2019.
35 Comparison of IS, BS AND ACI Methods Of Concrete Mix Design and Proposing Function Equation Based Design. Online <https://www.researchgate.net/publica-
38 Afsar J. Water to Cement Ratio | Relation | Graph | Engineering Intro. Online. En-gineering Intro. 2018. <http://www.engineeringintro.com/concrete/concrete-strength/water-to-cement-ratio/>
39 What is workability of concrete? Tyes, Mechanism. Online < https://civilto-day.com/civil-engineering-materials/concrete/93-workability-of-concrete-defini-tion-types-details>. Accessed 15 Jan. 2019.
40 Guthrie, W. and Sebesta, S. n.d. Selecting Optimum Cement Contents for Stabi-lizing Aggregate Base Materials. The Texas A&M University System. Pp.1-49. <https: //static.tti.tamu.edu/tti.tamu.edu/documents/7-4920-2.pdf.>
41 Pavement Interactive. n.d. ACI Mix Design Example - Pavement Interactive. Online. <https://www.pavementinteractive.org/reference-desk/design/mix-de-sign/aci-mix-design-example/>. Accessed 20 Jan .2019.
42 Indian Standard Methods of Tests for Strength of Concrete 2018. 18th Ed. New Delhi. <http://www.iitk.ac.in/ce/test/IS-codes/is.516.1959.pdf>
43 Dennis Vandegrift, Jr. Anton K. Schindler.The Effect of Test Cylinder Size on the Compressive Strength of Sulfur Capped Concrete Specimens. Eng.auburn.edu. n.d. Online. <http://www.eng.auburn.edu/files/file806.pdf>. Accessed 20 Jan. 2019.
44 Concrete in Practice. Online. <https://www.nrmca.org/aboutcon-crete/cips/35p.pdf>. Accessed 8 Jan 2019.