j j or> *\ p y APR | 1 1995 Bureau of Reclamation Reclamation Service Center Susceptibility of ABS, FEP, FRE, FRP, PTFE, and PVC Well Casings to Degradation by Chemicals Thomas A. Ranney and Louise V. Parker January 1995
Transcript
j j or> *\ p y
APR | 1 1995
Bu reau o f R ec lam ation R ec lam ation S e rv ic e Cente r
Susceptibility of ABS, FEP, FRE, FRP, PTFE, and PVC Well Casings to Degradation by Chem icalsThomas A. Ranney and Louise V. Parker January 1995
AbstractThis study compares the chemical resistance of four less commonly used materials for casing groundwater monitoring wells: acrylonitrile butadiene styrene (ABS), fluorinated ethylene propylene (FEP), fiberglass-reinforced epoxy (FRE), and fiberglass-reinforced plastic (FRP), with two more commonly used casing materials: polyvinyl chloride (PVC) and polyfetrafluoroethylene (PTFE). The six materials were exposed to 28 neat organic compounds (including one acid) and to extremely acidic and alkaline conditions for up to 112 days. This was done to simulate some of the most aggressive environments that monitoring well casings may be exposed to. The casings were observed for changes in weight and signs of physical degradation (swelling, softening, decrease in strength, deterioration, or dissolution). As expected, the two fluorinated polymers (FEP and PTFE) were the most inert materials tested. They were not degraded by any of the test chemicals, although samples exposed to a few organic chemicals did show a slight weight gain (~1% ). Among the nonfluorinated products tested, FRE was the most inert. Three organic chemicals caused particles to flake from the FRE surface, followed by separation of the glass fibers, and Iwo organic chemicals caused weight gains exceeding 10%. Also, highly acidic conditions (pH < 1) degraded this material, and this may lim it the use of this material in acidic environments. ABS was the most readily degraded material. By the end of the study, only the acid and alkaline solutions had little effect on ABS. FRP was more severely degraded by the organic chemicals than FRE was, butwas less affected than PVC. Like FRE, FRPwasalso degraded under highly acidic conditions.
For conversion of SI metric units to U.S./British customary units of measurement consult ASTM Standard E380-89a, Standard Practice for Use o f the International System o f Units•, published by the American Society for Testing and Materials, 1916 Race St., Philadelphia, Pa. 19103.
This report is printed on paper that contains a minimum of 50% recycled material.
o / .
Cé> f
BUREAU OF RECLAMATION DENVER UBRARY
Special Report 95-1&V
V US Army Corps of EngineersCold Regions Research & Engineering Laboratory
Susceptibility of ABS, FEP, FRE, FRP,^ PTFE, and PVC Well Casings to M Degradation by Chemicals
Thomas A. Ranney and Louise V. Parker January 1995
DATE DUE
GAYLORDP R IN TE D IN U .S.A .
Prepared forU.S. ARMY ENVIRONMENTAL CENTER SFIM-AEC-ET-CR-94071
Approved for public release; distribution is unlimited.
92049726
PREFACE
This report was prepared by Thomas A. Ranney, Staff Scientist, Science and Technology Corporation, Hanover, New Hampshire, and Louise V. Parker, Research Physical Scientist, Applied Research Branch, Experimental Engineering Division, U.S. Army Cold Regions Research and Engineering Laboratory (CRREL), Hanover, New Hampshire. Funding for this work was provided by the U.S. Army Environmental Center (AEC), Aberdeen Proving Ground, Maryland, Martin H. Stutz, Project Monitor.
The authors thank Martin Stutz and AEC for their support of this work; Robert Forest, CRREL, for carefully cutting the well casing pieces; and Dr. Thomas Jenkins and Daniel Leggett, CRREL, for their technical reviews of this manuscript.
This publication reflects the personal views of the authors and does not suggest or reflect the policy, practices, programs, or doctrine of the U.S. Army or Government of the United States. The contents of this report are not to be used for advertising or promotion purposes. Citation of company and brand names does not constitute an official endorsement or approval of the use of such commercial products.
u
CONTENTSPage
Preface........................................................................................................................... iiIntroduction....................................................................................... 1Literature review................................. 2Materials and methods................................................................................................ 3Results and discussion................................................................................................. 4Conclusions and recommendations............................................................................ 8Literature cited.............................................................................................................. 10Abstract.............. 20
TABLES
Table
1. Chemicals used in testing polymeric materials for weight gainand degradation........................................................................................... 2
2. Percentage weight gain of PTFE exposed to chemical treatment.................... 33. Percentage weight gain of FEP exposed to chemical treatment...................... 44. Percentage weight gain of FRE exposed to chemical treatment...................... 55. Percentage weight gain of FRP exposed to chemical treatment...................... 66. Percentage weight gain of PVC exposed to chemical treatment..................... 77. Percentage weight gain of ABS exposed to chemical treatment...................... 88. Comparison of CRREL chemical resistance ratings with those given in
Cole-Parmer and Nalge catalogs................................................................ 9
iii
Susceptibility of ABS, FEP, FRE, FRP, PTFE, and PVC Well Casings to Degradation by Chemicals
THOMAS A. RANNEY AND LOUISE V. PARKER
INTRODUCTION
Ideally, any material used as either a well casing or a screen in a groundwater monitoring well should retain sufficient strength once installed in the well, should resist degradation by the environment, and should not affect contaminant concentrations in samples by leaching or sorbing organics or metals. Recent guidance by the U.S. Environmental Protection Agency (U.S. EPA 1992) acknowledges that none of the most commonly used well casing materials in groundwater monitoring (polytetrafluoroethylene [PTFE], polyvinyl chloride [PVC], or stainless steel) can be used for all monitoring applications. Strength considerations limit the depth to which PTFE, and to a lesser extent PVC, can be used. The maximum depth PTFE can be used is 225 to 375 ft (69 to 114 m), while the maximum depth PVC can be used is 1200 to 2000 ft (366 to 610 m). While PTFE is very inert to degradation by chemicals (App. A, B), PVC is degraded by several neat organic solvents, including low molecular weight ketones, aldehydes, amines, and chlorinated alkanes and alkenes (Barcelona et al. 1984). (See App. A and B for specific chemicals.) PVC can also be degraded by high concentrations (near solubility) of these organic chemicals in aqueous solution (Berens 1985, Vonk 1985, 1986). Stainless steel will rust if corrosive conditions exist. These include a pH <7.0, a dissolved oxygen content >2 ppm, H2S levels >1 ppm, total dissolved solids content >1000 ppm, C 02 levels >50 ppm, and Cl- concentrations >500 ppm (Aller et al. 1989, modified from Driscoll 1986). (Additional information on the susceptibility of stainless steel 304 and 316 to a wide range of chemicals can be found in the Cole-Parmer catalog [Cole-Parmer 1992] or in our
previous report [Ranney and Parker 1994]). Also, previous studies by this laboratory (Hewitt 1989, 1992,1993, Parker et al. 1990, Ranney and Parker 1994) and others (Reynolds and Gillham 1985, Gillham and O'Hannesin 1990, Reynolds et al. 1990) have shown that none of these materials are chemically inert with respect to sorption and leaching of analytes of interest. In these studies, PVC and PTFE sorbed organics, and PVC and SS sorbed and leached metals.
Recently we started a series of laboratory studies to determine the overall suitability of four other pipe and casing materials (acrylonitrile butadiene styrene [ABS], fluorinated ethylene propylene [FEP], fiberglass-reinforced epoxy [FRE], and fiberglass-reinforced plastic [FRP]) for groundwater monitoring applications. In the first study we (Ranney and Parker 1994) compared sorption of a suite of dilute organic solutes by these four materials, along with PVC and PTFE. We found that ABS sorbed organic contaminants much more rapidly and to a greater extent than the other five materials; losses ranged from 19 to 74% after only eight hours. On the other hand, FRE and PVC were relatively nonsorptive, and by the end of the study (six weeks) losses were no greater than 25%. FEP, FRP, and PTFE were intermediate in their performance, and none of these materials performed consistently better than the other.
We also found that ABS, FRP, and FRE leached contaminants into the test solution. These contaminants were observed as spurious peaks in the HPLC analyses. FRE leached one contaminant while FRP and ABS leached several contaminants (five and eleven, respectively). Several of these peaks were identified by purge and trap GC/MS analyses. With respect to leaching, our results
1
and Barcelona et al. (1985) and Curran and Tomson (1983) for PTFE. Presumably FEP would perform similarly to PTFE.
We concluded that FRE looked like the most promising material for monitoring organics and that ABS should not be used when monitoring organics. However, any material that is going to be used for monitoring organic contaminants should also be relatively resistant to degradation by a wide range of organic compounds and should ideally be able to withstand acidic and alkaline environments. This study compares the susceptibility of ABS, FEP, FRE, FRP, PVC, and PTFE to degradation by organic solvents and extremely acidic and alkaline conditions.
LITERATURE REVIEW
Information on the ability of these materials to resist chemical degradation is sketchy. Most of the information we found was either provided by the manufacturer or taken from the Cole-Parmer catalog (1992) or the Nalge catalog (1994). FEP is a copolymer of tetrafluoroethylene and hexafluoro- propylene, and like other fluoropolymers, such
as PTFE, it has excellent resistance to chemical attack by corrosive reagents and dissolution by solvents (Nalge 1994) (App. B). FRE is composed of 75% silica glass and 25% closed molecular epoxy, and according to its manufacturer is impervious to gasoline, hydrocarbon products, and most solvents and additives. The Cole-Parmer catalog (1992) appears to support this claim for hydrocarbons but not for all solvents. They report that "epoxy" has good resistance to fuel oils, gasoline, jet fuel, and kerosene. However, they also report that epoxy is moderately affected by several ketones and is severely degraded by dichloroeth- ane, dimethyl formamide, benzaldehyde, and others. (See App. A for a more extensive listing.) ABS is a terpolymer of acrylonitrile, butadiene, and styrene. According to the Cole-Parmer catalog (1992), it is severely degraded by a number of organic chemicals, including several ketones, chlorinated alkanes and alkenes, and several hydrocarbons such as fuel oils, gasoline, and kerosene. (See App. A for a more extensive listing.) However, it is important to note that the Cole- Parmer catalog does not give any detail on the type of epoxy or ABS materials that were tested.
FRP is composed of 70% fiberglass and 30%
Table 1. Chemicals used in testing polymeric materials for weight gain and degradation (swelling/softening, dissolution).
Hydrocarbons (aliphatic & aromatic) BenzeneG asoline (93 octane, u nleaded) H exan e (85% N -h exane)
K erosene (K -l)Tolueneo-xylene
Chlorinated solvents (aliphatic & aromatic) Brom och lorom ethan e C arb on tetrach lorid e C hlorobenzene C h loroform 1,2-dichlorob enzen e
1,2-dichloroethan e trans- 1 ,2-dichloroethylene M ethylene chloride Tetrachloroethylene Trichloroethylene
O xygen-containing compounds (either a ketone, alcohol, aldehyde, or ether)
A ceton e B en zaldeh yde Benzyl alcohol C ycloh exan on e
M ethyl alcohol M ethyl ethyl ketone Tetrah ydrofu ran
Nitrogen-containing compounds N -b utylam in e D iethylam ine
D im eth ylform am id eN itrobenzene
Acids and basesA cetic acid (glacial) H yd roch loric acid (25% w /v )
Sodium h yd roxid e (25% w /v )
2
polyester resin. Its manufacturer claims that this product is resistant to corrosion but makes no claims about its resistance to organic solvents. Since the manufacturer did not specify which particular polyester was used in its product, we cannot discuss its chemical resistance except in generic terms. According to Sax and Lewis (1987), polyesters are resistant to corrosive chemicals and solvents. However, Fuchs (1989) listed at least one organic compound that was a good solvent for each of the polyesters he listed.
Thus, among ABS, FEP and FRE, FEP appears to be the most resistant polymer to degradation while ABS is the least resistant.
MATERIALS A N D METHODSSix types of 5-cm- (2-in.-) diameter well casing
or pipe were used in this study: PVC, PTFE, FEP, ABS, FRE, and FRP. For PVC, PTFE, FRP, and FRE, we used well casings manufactured specifically for groundwater monitoring. We were un
able to find a manufacturer that made FEP well casings but did find one that made "pipe for sampling groundwater." When we tried to purchase the ABS well casing, we found that these manufacturers had gone out of business so we purchased waste and vent pipe. Test specimens measuring approximately 1 cm2 were cut from each pipe material. Special care was taken to eliminate contamination from grease or oil during the cutting process. We noted that the cutting process fractured some of the specimen edges of the two fiberglass materials and were careful not to use any specimens with fractured edges. All the test pieces were placed in 2% solutions of detergent (Liquinox) and deionized water and stirred for five minutes, then rinsed repeatedly with deionized water until there was no evidence of sudsing. The pieces were drained and rinsed with several additional volumes of deionized water, drained, and then left on paper towels to air dry.
Each test specimen was weighed to ±0.0001 and placed in a 22-mL borosilicate glass vial.
Table 2. Percentage weight gain of PTFE exposed to chemical treatment.Contact time (days)
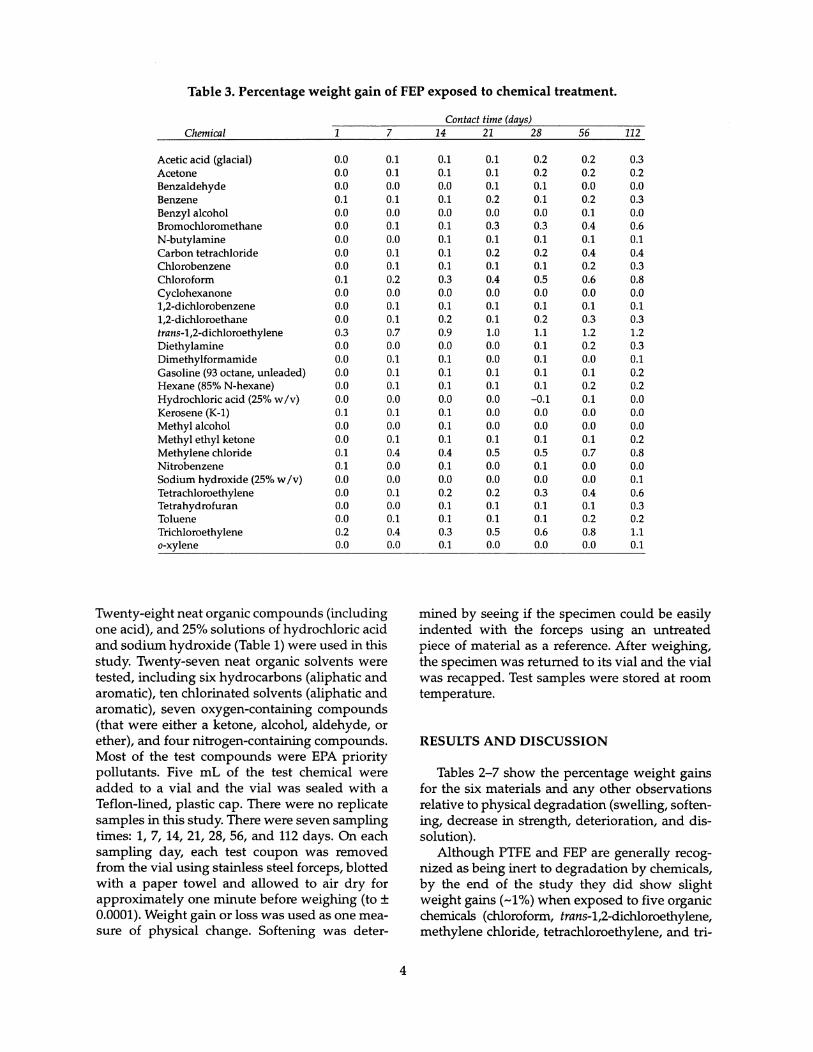
Twenty-eight neat organic compounds (including one acid), and 25% solutions of hydrochloric acid and sodium hydroxide (Table 1) were used in this study. Twenty-seven neat organic solvents were tested, including six hydrocarbons (aliphatic and aromatic), ten chlorinated solvents (aliphatic and aromatic), seven oxygen-containing compounds (that were either a ketone, alcohol, aldehyde, or ether), and four nitrogen-containing compounds. Most of the test compounds were EPA priority pollutants. Five mL of the test chemical were added to a vial and the vial was sealed with a Teflon-lined, plastic cap. There were no replicate samples in this study. There were seven sampling times: 1, 7, 14, 21, 28, 56, and 112 days. On each sampling day, each test coupon was removed from the vial using stainless steel forceps, blotted with a paper towel and allowed to air dry for approximately one minute before weighing (to ± 0.0001). Weight gain or loss was used as one measure of physical change. Softening was deter
mined by seeing if the specimen could be easily indented with the forceps using an untreated piece of material as a reference. After weighing, the specimen was returned to its vial and the vial was recapped. Test samples were stored at room temperature.
RESULTS AND DISCUSSIONTables 2-7 show the percentage weight gains
for the six materials and any other observations relative to physical degradation (swelling, softening, decrease in strength, deterioration, and dissolution).
Although PTFE and FEP are generally recognized as being inert to degradation by chemicals, by the end of the study they did show slight weight gains (~1%) when exposed to five organic chemicals (chloroform, trans-1,2-dichloroethylene, methylene chloride, tetrachloroethylene, and tri-
4
Table 4. Percentage weight gain of FRE exposed to chemical treatment.
* particles began to flake off coupon F fibers separated
chloroethylene) (Tables 2, 3). The weight gains were slightly less for FEP than PTFE. We did not observe any softening, swelling, or decrease in strength in any of these samples when compared with unexposed test pieces. For reference, the final pH of the 25% HC1 solution containing the PTFE samples was -0.75 and the final pH of the 25% NaOH solution containing the PTFE samples was 13.4.
The FRE well casing material used in this study had a glossy external surface and a dull (frosted) internal surface. Three organic chemicals (acetic acid, N-butylamine, and dimethyl- formamide) caused some flaking of the external surface within the first week and separation of the glass fibers after one to eight weeks. N-butyl- amine delaminated FRE after five weeks. The particles that flaked off the test pieces did not appear to dissolve with time. No further weight
measurements were made on these samples. Eight other samples had weight gains of 1 to 10%, and samples exposed to bromochloromethane (26.2%) and methylene chloride (15.6%) had the largest weight gains (Table 4). The sample exposed to the hydrochloric acid solution lost weight (-5%), most likely a result of loss of the epoxy resin. The alkaline solution had no effect on this material. None of the FRE specimens appeared to swell or soften, not even the samples with the largest weight gain. Some fraying of the edges was observed on some specimens, but it is not clear whether this was due to chemical exposure, cutting, or handling. In general, FRE did not appear to be affected by the hydrocarbons or aromatic solvents.
FRP was more severely degraded than the previous materials.” Eight organic solvents (bromochloromethane, N-butylamine, chloroform, 1,2-
5
Table 5. Percentage weight gain of FRP exposed to chemical treatment.Contact time (days)
dichloroethane, trans- 1,2-dichloroethylene, methylene chloride, tetrahydrofuran, and trichloroethylene) delaminated it, i.e., the fiberglass sheets separated. This occurred within the first 24 hours for methylene chloride and within the first one to four weeks for the other solvents. The samples that were delaminated more slowly had weight gains of ~1 to 16% and showed signs of swelling (i.e., liquid could be squeezed out of the material) prior to the sheets separating. Eleven other chemicals (including the glacial acetic acid and the sodium hydroxide solution) caused weight gains of 1 to 10% (Table 5). None of these chemicals caused any noticeable swelling or softening. Again, some of the specimens showed frayed edges, although this may have resulted from cutting or handling and not chemical exposure. As with FRE, the hydrochloric acid solution caused a slight loss in weight (5%). FRP appeared to be unaffected by hydrocarbons and the nonpolar chlorinated solvents.
PVC appeared to be much more readily degraded than the previous materials. By the end of the study, ten chemicals dissolved or so softened PVC that the test piece could not be weighed because it disintegrated (Table 6). Four chemicals had this effect within the first day. Ten other chemicals appeared to soften PVC and four of those chemicals caused weight gains that exceeded 100%. Squeezing the swollen specimens forced out some of the liquid. Only nine of the thirty chemicals used in this study had little or no effect on PVC. These chemicals were the neat acid, the acid and hydroxide solutions, the two alcohols, three hydrocarbons (gasoline, hexane, and kerosene) and carbon tetrachloride. In general, PVC is especially susceptible to degradation by polar, non-hydrogen-bonded solvents.*
* Personal communication, Daniel C. Leggett, Research Chemist, CRREL, 1994.
6
Table 6. Percentage weight gain of PVC exposed to chemical treatment.
D dissolved or disintegrated upon handling s first observation of swelling and/or softening
ABS was by far the most readily degraded polymer. After only one day, nineteen of the thirty chemicals tested either dissolved ABS or softened it to the point where it fell apart (Table 7). Four other chemicals caused either softening or swelling of the test coupon on the first day By the end of the study, only the acid and alkali solutions had little effect (-1% weight gain). While ABS is susceptible to organic solvents in general, it is especially susceptible to polar solvents.* Clearly, ABS is a poor choice where exposure to neat organic solvents may be involved.
Table 8 compares the chemical resistance ratings from the Cole-Parmer catalog and the Nalge catalog with our (CRREL) findings. In order to compare our results with the chemical resistance
* Personal communication, Daniel C. Leggett, Research Chemist, CRREL, 1994.
ratings given by Cole-Parmer and Nalge companies, we developed the following classification scheme for our data:
A. Excellent. Any chemical that had little or no effect on the material, i.e., where the change in weight was 1% or less.
B. Good. Any chemical that had only a minor effect, i.e., there was no observable effect except for a slight change in weight (from 1 to 5%).
C. Moderate effect. Those chemicals that caused more than a 5% change in weight with no other observable changes.
D. Unacceptable. Any chemical that caused the material to swell, soften, dissolve, delaminate, or that caused particles to fall off.
While we realize that our rating system was totally arbitrary, we generally had good agreement between our results and those given in the Cole-Parmer catalog. This was especially true for PTFE and ABS. For these materials there were
7
Table 7. Percentage weight gain of ABS exposed to chemical treatment.Contact time (days)
only five or six chemicals (respectively) where the ratings did not agree (given in bold print in Table 8). (There were no listings for FEP or FRP.) The largest disparity is between their ratings for "epoxy" and our findings for FRE. For FRE, we would change the ratings for 17 of the 30 chemicals tested, although there is no trend in either direction. The differences between "epoxy" and FRE most likely account for these differences. Differences in contact time may also explain some of these differences. For PVC we would change the ratings for seven chemicals, raising it for six of them.
Generally, our results agreed with those of the Nalge Company for PTFE, FEP, and rigid PVC. There were exceptions for two chemicals (TCE and chloroform) for PTFE and one exception for FEP (TCE). For rigid PVC there were six chemicals where our results did not agree; we would raise the rating for four of those chemicals.
CONCLUSIONS AND RECOMMENDATIONS
Based on our findings, we would rank the resistance of these materials to organic solvents, from greatest to least resistance, as: FEP=PTFE> FRE> FRP> PVC> ABS. This ranking should be used only as a general guide, not as a rule. FRE, FRP, ABS, and PVC casing materials should be tested with any chemical they are going to be exposed to, if they haven't been already. It appears that all the materials have excellent resistance to alkaline conditions except FRP, which was only slightly affected. With respect to exposure to acidic conditions, FEP, PTFE, and PVC all have excellent resistance, ABS was slightly affected, and FRE and FRP were affected the most, although weight losses were only 5% by the end of the study.
8
Table 8. Comparison of CRREL chemical resistance ratings with those given in Cole-Parmer and Nalge catalogs.
Acetic acid (glacial) A A A C D D A D DAcetone A A E A E B1 B D D N N D DBenzaldehyde A1 A E A E D A D D N N B DBenzene A A E A E Cl A C l D N N D DBenzyl alcohol A A E A E C A D A G F D DBromochloromethane A A A C D DN-butylamine A2 A A B2 D D D DCarbon tetrachloride A A E A E A1 A D A G N D DChlorobenzene B A E A E Cl A D D N N D DChloroform A1 B E A E Cl C D D N N D DCyclohexanone A A E A E c A D D N N D D1,2-dichlorobenzene A A E A E A A D D N N D D1,2-dichloroethane A1 A E A E D B D D F N D Dtrans-1,2-dichloroethylene B B C D DDiethylamine D A E A E A B D D N N D DDimethylformamide D A E A E D D D D F N D DGasoline (93 octane, unleaded) A A E A E A2 A C2 A G N D DHexane A A E A E A A B2 A G N D CHydrochloric acid (25% w/v) A A E A E A1 B A2 A E E A BKerosene (K-l) A A E A E A A A2 A E N D CMethyl alcohol A A E A E B1 C A1 A E F D CMethyl ethyl ketone A A E A E Cl B D D N N D DMethylene chloride A A E A E A C D D N N D DNitrobenzene A A E A E C l A D D N N D DSodium hydroxide (25% w/v) A A A A A A A B ATetrachloroethylene A A A A D B DTetrahydrofuran A A E A E A B D D N N DToluene A A E A E B1 A D D N N D DTrichloroethylene A B E B E Cl A D D N N D Do-xylene A A E A E A A D D N N D D
* Cole-Parmer chemical resistance ratings + Nalge chemical resistance ratings (20°C) CRREL chemical resistance ratings from experimental observations
A no effect-excellent
B minor effect-good
C moderate effect-fair
D severe effect-not recommended1 satisfactory to 22°C2 satisfactory to 48°C
E no damage after 30 days
G little or no damage after 30 days
F some effect after 7 days
N not recommended for continuous use
A Excellent. Any chemical with little or no effect, i.e., the change in weight was 1% or less.
B Good. Any chemical that had only a minor effect, i.e., there was no observable effect except for a slight change in weight (from 1 to 5%).
C Moderate effect. Those chemicals that caused more than a 5% change in weight with no other observable changes.
D Unacceptable. Any chemical that caused the material to swell, soften, dissolve, delaminate, or lose particles.
Based on our findings and those in other studies (Cowgill 1988, Ranney and Parker 1994), we feel that FRE appears to make an excellent candidate material for monitoring organics. It is relatively nonsorptive of dissolved organic solutes (Ranney and Parker 1994) and is more resistant to degradation by solvents than the more commonly used PVC. Also, our previous study (Ranney and Parker 1994) and that of Cowgill (1988) show that FRE does not leach many organic contaminants that would interfere with analyses. However, because we found that strongly acidic conditions (pH <1) degraded this polymer, its use in acidic environments may be limited. Further tests are needed to resolve this issue.
In this study and our previous study (Ranney and Parker 1994), FEP performed similarly to PTFE. These polymers are very resistant to degradation by chemicals, do not appear to leach organic contaminants, but are quite sorptive of some organic solutes. FEP does not appear to offer any clear advantage or disadvantage over PTFE.
The chemical resistance of FRP is similar to that of PVC except that, unlike PVC, it is degraded by very acidic conditions. FRP is much more sorptive of dilute organic solutes than PVC and has been found to leach organic contaminants (Ranney and Parker 1994). Therefore, we feel that PTFE, FEP, FRE and PVC would be generally better for monitoring organics than FRP.
Our previous study (Ranney and Parker 1994) has shown that PVC is relatively nonsorptive of dilute organic solutes and does not leach organic contaminants. However, PVC cannot be used when neat PVC solvents are present or high concentrations of these solvents are present. (This issue has been addressed by our laboratory in several papers [Parker 1992, Parker et al. 1992, Parker and Ranney 1994a,b].) However, it should be noted that neat organic (PVC) solvents are not normally encountered in most groundwater monitoring situations. High concentrations of organic (PVC) solvents (approaching their aqueous solubility) are also relatively uncommon. Thus PVC can be used in most groundwater monitoring applications.
Of the six casing materials we have tested, we feel that ABS would be the worst material for monitoring organic contaminants. It was affected or degraded by all of the organic solvents we tested. It also leached many organic contaminants and was extremely sorptive of dilute organic solutes (Ranney and Parker 1994).
We are currently testing FRE, FEP, and FRP to determine whether they sorb or leach metals. This will help us determine the overall suitability of these materials for use in groundwater monitoring wells.
LITERATURE CITED
Aller, L., T.W. Bennett, G. Hackett, R.J. Petty, J.H. Lehr, H. Sedoris, D.M. Nielsen, and J.E. Denne (1989) Handbook of Suggested Practices for the Design and Installation of Ground-water Monitoring Wells. Dublin, Ohio: National Water Well Association.Barcelona, M.J., J.P. Gibb, and R.A. Miller (1984) A guide to the selection of materials for monitoring well construction and ground water sampling. U.S. Environmental Protection Agency Report No. EPA-600/2-84-024, U.S. Government Printing Office, Washington, D.C.Barcelona, M.J., J.A. Helfrich, and E.E. Garske (1985) Sampling tubing effects on ground water samples. Analytical Chemistry, 57: 460-464.Berens, A.R. (1985) Prediction of organic chemical permeation through PVC pipe. Journal of the American Water Works Association, 77(11): 57-64. Cole-Parmer Instrument Company (1992) Cole- Parmer Instrument Company 1993-1994 Catalog, p. 1463-1471. Niles, Illinois: Cole-Parmer Instrument Company.Cowgill, U.M. (1988) The chemical composition of leachate from a two-week dwell-time study of PVC casing and a three-week dwell time study of fiberglass reinforced epoxy well casing. In Ground-Water Contamination: Field Methods, ASTM STP 963 (A.G. Collins and A.I. Johnson, Eds.), p. 172-184. Philadelphia, Pennsylvania: American Society for Testing and Materials.Curran, C.M. and M.B. Tomson (1983) Leaching of trace organics into water from five common plastics. Ground Water Monitoring Review, 3:68-71. Driscoll, F.G. (1986) Ground Water and Wells. St. Paul, Minnesota: Johnson Division.Fuchs, O. (1989) Solvents and non-solvents for polymers. In Polymer Handbook, Third Edition (J. Brandrup and E.H. Immergut, Eds.). New York: John Wiley and Sons, Inc.Gillham, R.W, and S.F. O'Hannesin (1990) Sorption of aromatic hydrocarbons by materials used in construction of ground-water monitoring sampling wells. In Ground Water and Vadose Zone Monitoring, ASTM STP 1053 (D.M. Nielsen and A.I. Johnson, Eds.), p. 108-122. Philadelphia, Penn-
10
sylvania: American Society for Testing and Materials.Hewitt, A.D. (1989) Leaching of metal pollutants from four well casings used for ground-water monitoring. USA Cold Regions Research and Engineering Laboratory, Special Report 89-32. Hewitt, A.D. (1992) Potential of common well casing materials to influence aqueous metal concentrations. Ground Water Monitoring Review, 12(2): 131-135.Hewitt, A.D. (1993) Dynamic study of common well screen materials. Ground Water Monitoring and Remediation, 13(1): 87-94.Nalge Company (1994) Nalge Labware 1994, p. 202-207. Rochester, New York: Nalge Company. Parker, L.V. (1992) Suggested guidelines for the use of PTFE, PVC, and stainless steel in samplers and well casings. In Current Practices in Ground Water and Vadose Zone Investigations, ASTM STP 1118 (D.M. Nielsen and M.N. Sara, Eds.), p. 217- 229. Philadelphia, Pennsylvania: American Society for Testing and Materials.Parker, L.V. and T.A. Ranney (1994a) Softening of rigid PVC by aqueous solutions of organic solvents. USA Cold Regions Research and Engineering Laboratory, Special Report 94-15.Parker, L.V. and T.A. Ranney (1994b) Effect of concentration on sorption of dissolved organics by well casings. Ground Water Monitoring and Remediation, 14(3): 139-149.Parker, L.V., A.D. Hewitt, and T.F. Jenkins (1990) Influence of casing materials on trace-level chemicals in well water. Ground Water Monitoring Review, 10(2): 146-156.Parker, L.V., T.A. Ranney, and S. Taylor (1992) Softening of rigid polyvinyl chloride by high concentrations of aqueous solutions of methylene
chloride. USA Cold Regions Research and Engineering Laboratory, Special Report 92-12.Ranney, T.A. and L.V. Parker (1994) Sorption of trace-level organics by ABS, FEP, FRE, and FRP well casings. USA Cold Regions Research and Engineering Laboratory, Special Report 94-15. Reynolds, G.W. and R.W. Gillham (1985) Adsorption of halogenated organic compounds by polymer materials commonly used in groundwater monitors. In Proceedings of Second Canadian/ American Conference on Hydrogeology, Hazardous Wastes in Ground Water: A Soluble Dilemma. National Water Well Association, Dublin, Ohio, p. 125- 132.Reynolds, G.W., J.T. Hoff, and R.W. Gillham(1990) Sampling bias caused by materials used to monitor halocarbons in groundwater. Environmental Science and Technology, 24(1): 135-142.Sax, N.I. and R.J. Lewis, Sr. (1987) Hawley's Condensed Chemical Dictionary, Eleventh Edition. New York: Van Nostrand Reinhold Company.U.S. EPA (1992) EPA RCRA Ground-Water Monitoring: Draft Technical Guidance. EPA/530-R-93- 001, Office of Solid Waste, U.S. Environmental Protection Agency, Washington, D.C. 20460. NTIS #PB 93-139-350, National Technical Information Service, Springfield, Virginia 22161 (703-487-4650). Vonk, M.W. (1985) Permeatie en Drinkwater- leidingen. KIWA, N.V., Nieuwegein, The Netherlands, KIWA Report 85 (In Dutch with English summary).Vonk, M.W. (1986) Permeation of organic soil contaminants through polyethylene, polyvinyl- choride, asbestos cement and concrete water pipes. In Proceedings, American Water Works Association Water Quality Technical Conference, 1985, voi. 13, p. 701-714.
11
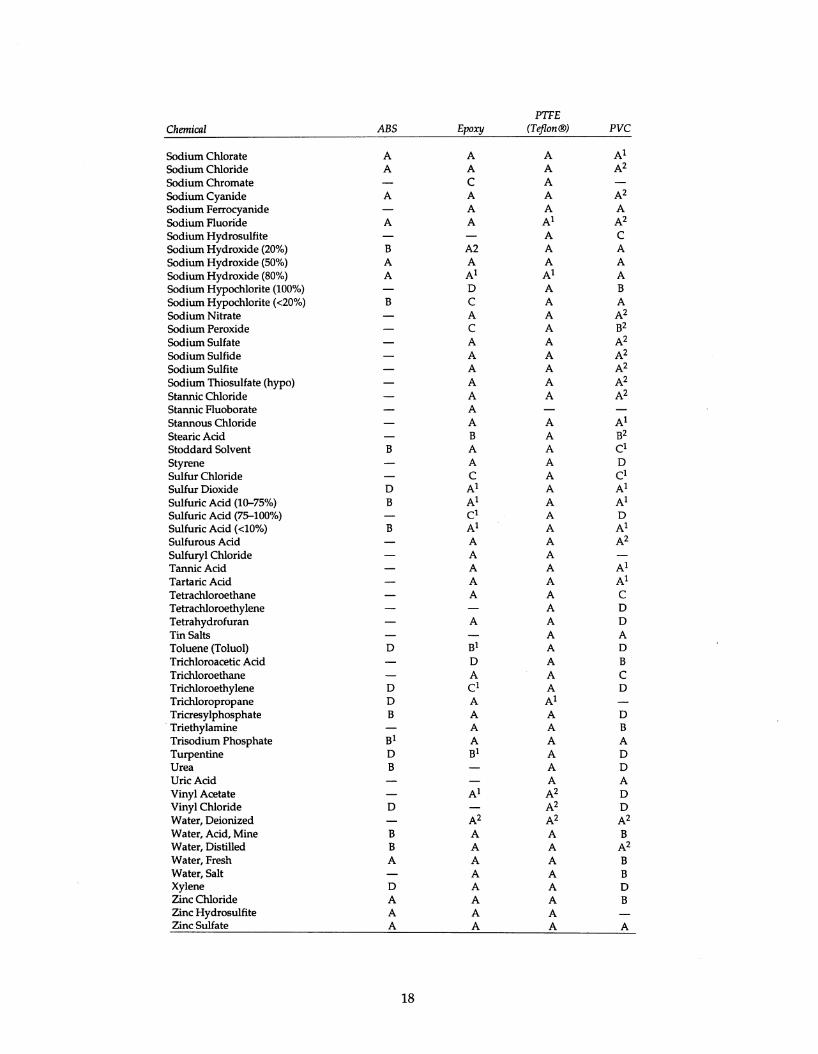
APPENDIX A. CHEMICAL RESISTANCE OF VARIOUS MATERIALS TO SELECTED CHEMICALS (COURTESY OF COLE-PARMER COMPANY, 1992).
The Cole-Parmer Catalog includes the following disclaimer: "These chemical resistance charts rate the effect of corrosive chemicals on various materials. Use these charts as a general guide, not an unqualified guarantee of chemical compatibility. Cole-Parmer® can assume no responsibility for the use of this information in specific applications. Test only under specified conditions of your application to ensure safe use of a chemical. Immersion testing methods are preferred for more accurate test results."
Ratings - Chemical EffectA - No effect—Excellent B - Minor effect—Good C - Moderate effect—Fair D - Severe effect—Not Recommended1 - Satisfactory to 22°C2 - Satisfactory to 48°C* - Two different values given
PTFEChemical ABS Epoxy (Teflon®) PVC
Acetaldehyde D A A DAcetamide — A A DAcetic Acid D C A DAcetic Acid 20% C A1 A DAcetic Acid 80% D B1 A CAcetic Acid, Glacial D B1 A DAcetic Anhydride C1 C A DAcetone D B1 A DAcrylonitrile D A A B1Adipic Acid — A A A2Alcohols: Amyl A1 B2 A A2
Benzyl D C A DButyl A1 A/D* A /A 2* A2/C uDiacetone — A A b V d *Ethyl B1 A2 A cHexyl — A A A2Isobutyl B A A2 A1Isopropyl — A A2 A1Methyl D B1 A A1Octyl A1 A — —Propyl B1 A A A1
Aluminum Chloride A A1 A A2Aluminum Fluoride A B1 A A2Aluminum Hydroxide B B1 A A2Aluminum Nitrate — A2 A B2Aluminum Potassium Sulfate 10% — A1 A A2Aluminum Potassium Sulfate 100% — A1 A A2Aluminum Sulfate A2 A2 A A2Ammonia Nitrate — A A BAmmonium Chloride A2 A1 A A2Ammonium Hydroxide B A1 A AAmmonium Nitrate — A2 A A2Ammonium Sulfate A2 A2 A A2Ammonium Thiosulfate — A — —
Amyl Acetate D A2 A DAniline D D A C1Antimony Trichloride A2 D A A2Arochlor 1248 — A2 A —
Arsenic Add A2 A2 A A1Arsenic Salts — — — AAsphalt — A A1 A2
13
PTFEChemical ABS Epoxy (Teflon®) PVC
Barium Chloride A2 A2 A A 1Barium Cyanide — A A 1 DBarium Hydroxide A 2 A2 A A 2
Barium Nitrate — A1 A 1 ABarium Sulfate A 2 A2 A B1
Barium Sulfide A 2 B2 A A2Benzaldehyde B D A 1 DBenzene D C1 A C 1Benzene Sulfonic Acid — B A ABenzoic Acid — A1 A 2 ABenzonitrile — — A 2 —Benzyl Chloride D — — —Boric Acid — A1 A A 2Bromine D D A C 1Butadiene — A1 A 2 C 1Butyl Amine — B2 A 2 DButyl Ether — A1 A 1 A2Butyl Phthalate — B2 A 2 —Butylacetate — B1 A DButyric Acid D A A 2 B1Calcium Bisulfate — A — —Calcium Bisulfide — A A A2Calcium Bisulfite — A1 A BCalcium Chlorate — — A B2Calcium Chloride B A1 A CCalcium Hydroxide — A1 A BCalcium Hypochlorite — A1 A B1Calcium Nitrate A A2 A 2 A2Calcium Oxide D A A BCalcium Sulfate C A2 A B2Carbon Disulfide — C1 A DCarbon Tetrachloride D A1 A DCarbonic Acid — A2 A A 2Chloric Acid — — A A2Chloroacetic Acid — C1 A B1Chlorobenzene (Mono) D C1 B DChlorobrom omethane — — A DChloroform D c 1 A 1 DChlorosulfonic Acid — c 1 A DChrom ic Acid 5% B D A A 2Chrom ic Acid 50% D D A DChromium Salts — — — ACitric Acid D A1 A B2Copper Chloride A A A A 1Copper Cyanide — B 1 A A 2Copper Fluoborate — A — ACopper Nitrate — A 1 A A 2Copper Sulfate >5% — A A A 2Cresols D A1 — DCresylic Acid — D A DCupric Acid — A2 A A 2Cyanic Acid — A1 A —Cyclohexane — A2 A DCyclohexanone D C A DDichlorobenzene D A A DDichloroethane D D A 1 DDiesel Fuel — A A A 1Diethyl Ether D D A DDiethylamine D A D DDiethylene glycol B C A 2 C 1Dimethyl Aniline D A1 A DDimethyl Formamide D D D D
14
PTFEChemical ABS Epoxy (Teflon®) PVC
Diphenyl _ _ ADiphenyl Oxide — A A 1 DEthanolamine — A 1 A 1 DEthyl Acetate D A A DEthyl Benzoate D — A DEthyl Chloride D D A DEthyl Ether D A2 A DEthyl Sulfate — A 1 A —
Ethylene Bromide D — A DEthylene Chloride D D A DEthylene Chlorohydrin D D A DEthylene Diamine D A 1 A DEthylene Dichloride D D A DEthylene Glycol A A A AEthylene Oxide D D A DFerric Chloride A A A AFerric Nitrate A 2 A A AFerric Sulfate A 2 A A AFerrous Chloride A 2 A A AFerrous Sulfate A 1 A A AFluoboric Acid A 2 D A AFluosilicic Acid A 2 C A DForm aldehyde 40% A 2 A 2 A AForm aldehyde 100% B A A AFormic Acid D C1 A A 1Freon ® 11 D A A A2Freon 12 A 1 A 2 A A2Freon 22 — A A AFreon 113 — A A BFreon TF — A A BFuel Oils D A 1 B A2Furfural D A 1 A DGallic Acid — — B BGasoline (high-aromatic) D A B AGasoline, leaded, ref. D A 2 A BGasoline, unleaded D A2 A C2Heptane D A A C1Hexane D A A B 1Hydrazine — A C —H ydrobrom ic Acid 20% — B1 — B2Hydrobrom ic Acid 100% B D A A 1H ydrochloric Acid 20% A A 1 A A2H ydrochloric Acid 37% A A A BH ydrochloric Acid 100% A — A DH ydrocyanic Acid B A A BHydrofluoric Acid 20% C A A BH ydrofluoric Acid 50% C C2 A B 1Hydrofluoric Acid 75% C B1 A CHydrofluoric Acid 100% D — A CHydrofluosilicic Acid 20% — C 1 A A2Hydrofluosilicic Acid 100% — C1 A B1H ydrogen Peroxide 10% A c 1 A A 1H ydrogen Peroxide 50% — — A A1H ydrogen Peroxide 100% A A A AH ydrogen Sulfide (aqua) B A A B 1H ydrogen Sulfide (dry) — A A A2Hydroquinone D — A BHydroxyacetic Acid 70% — A A DIodine D C A AIsooctane — A 2 A A 1Isopropyl Acetate — A A DIsopropyl Ether — D A1 B
15
PTFEChemical ABS Epoxy (Teflon®) PVC
Jet Fuel (JP 3 ,JP 4 ,JP 5) _ A A C
Kerosene D A A A 2
Ketones A C A D
Lactic A dd D B 1 A B1
Lead Acetate B A A B
Lead Nitrate B — A 1 A 2
Lead Sulfamate — A B BLigroin — A A —Lime — A A 1 B
Lithium Chloride — — A DLithium Hydroxide — — A —Lye: Potassium Hydroxide A A A BLye: Sodium Hydroxide C A A ALye: Calcium Hydroxide — A1 A B2M agnesium Bisulfate — — A A 2M agnesium Chloride B A A BM agnesium Hydroxide B A A A 2M agnesium Nitrate B A A A2
M anganese Sulfate B2 — A CM ercuric Chloride (dilute) B A A A
M ercuric Cyanide B A B AM ercurous Nitrate C2 — A AM ercury B A A A
M ethyl Acetate D D A DM ethyl Acetone — C A DM ethyl Acrylate — A — —M ethyl Bromide D B A DM ethyl Butyl Ketone — C — AM ethyl Cellosolve — C A DM ethyl Chloride D A A DM ethyl Dichloride — A — AM ethyl Ethyl Ketone D C1 A DM ethyl Isobutyl Ketone D c A D
M ethyl Isopropyl Ketone — A A DM ethyl Methacrylate — A — AM ethylamine D A A DM ethylene Chloride D A A DM onochloroacetic acid — — A2 —M onoethanolamine — A A DM orpholine C — A2 —M otor Oil C — A BNaphtha D A B A 1Naphthalene D A A DN ickel Chloride A A A ANickel Nitrate A A 1 A 2 ANickel Sulfate B A A AN itrating Acids (<1% Acid) — — A DNitrating Acids (<15% H 2S04) — — A DN itrating Acids (>15% H 2S04)) — D A DNitrating Acid (<15% H N 03) — — A DNitric Acid (5-10% ) B A1 A A 1Nitric Acid (20%) B B 1 A A 1Nitric Acid (50%) C D A B1Nitric Acid (Concentrated) D D A B1Nitrobenzene D C1 A DNitrom ethane D — A B2N itrous Acid D D A AN itrous Oxide — — A AOils: Aniline D A A D
Bone — A A —Castor A A A ACreosote — A A C
16
PTFEChemical ABS Epoxy (Teflon®) PVC
Diesel Fuel (2 0 ,3 0 ,4 0 ,5 0 ) A1 A BFuel ( 1 ,2 ,3 ,5A, 5B, 6) D A1 A A 2H ydraulic Oil (Petro) — A A AHydraulic Oil (Synthetic) — A A AM ineral A A A BPine D A A DRosin — A A C 1Silicone A A A ATransform er — B A BTurbine — A A A 1
Oleic Acid D A A C 2Oxalic Acid (cold) A A A 1 BPalm itic Acid A A A 2 B1Paraffin A A A BPentane — A A APerchloric Acid — — A CPerchloroethylene D D A c 1Petroleum B A2 A 2 —
Phenol (10%) D C A c 1Phenol (Carbolic Acid) D C A DPhosphoric Acid (<40%) B A A BPhosphoric Acid (>40% ) C B A BPhthalic Acid B — A 2 —
Phthalic Anhydride B — A DPicric Acid A A A DPotash (Potassium Carbonate) A A — APotassium Bicarbonate A A A APotassium Bromide A 1 A A APotassium Chlorate A A A APotassium Chloride A A A APotassium Chromate — C A 1 APotassium Cyanide Solutions A A A APotassium Dichromate B1 C A APotassium Ferricyanide B A 1 A 2 APotassium Ferrocyanide — A A APotassium Hydroxide (Caustic Potash) A A A A 1Potassium Hypochlorite — — A 2 B1Potassium Nitrate B A A APotassium Oxalate — — • A 2 —
Potassium Permanganate B1 A A A 1Potassium Sulfate B A A A 2Potassium Sulfide B — A A 2Propylene Glycol B B A C 1Pyridine — A A DPyrogallic Acid — A A AResorcinal A — A 2 CSalicylic Acid A — A2 B1Salt Brine (NaCl saturated) — A A2 ASea W ater — A A A 2Silicone D A A ASilver Bromide — A A —
Silver Nitrate B A A A 1Soda Ash (see Sodium Carbonate) B C A ASodium Acetate B A A B1Sodium Aluminate — A A —
Sodium Benzoate A A2 A 2 B1Sodium Bicarbonate A A A A 2Sodium Bisulfate A A A A 2Sodium Bisulfite A A A A 2Sodium Borate A A A A 2Sodium Bromide B A A 2 B2Sodium Carbonate B C1 A A 2
17
PTFEChemical ABS Epoxy (Teflon®) PVC
Sodium Chlorate A A A A 1Sodium Chloride A A A A 2Sodium Chromate — C A —Sodium Cyanide A A A A2Sodium Ferrocyanide — A A ASodium Fluoride A A A 1 A2Sodium Hydrosulfite — — A CSodium Hydroxide (20%) B A2 A ASodium Hydroxide (50%) A A A ASodium H ydroxide (80%) A A 1 A 1 ASodium Hypochlorite (100%) — D A BSodium Hypochlorite (<20%) B C A ASodium Nitrate — A A A 2Sodium Peroxide — C A B2Sodium Sulfate — A A A2Sodium Sulfide — A A A 2Sodium Sulfite — A A A 2Sodium Thiosulfate (hypo) — A A A 2Stannic Chloride — A A A2Stannic Fluoborate — A — —Stannous Chloride — A A A 1Stearic Acid — B A B2Stoddard Solvent B A A C1Styrene — A A DSulfur Chloride — C A C1Sulfur Dioxide D A 1 A A 1Sulfuric Acid (10-75% ) B A 1 A A 1Sulfuric Acid (75-100% ) — C 1 A DSulfuric Acid (<10%) B A 1 A A 1Sulfurous Acid — A A A 2Sulfuryl Chloride — A A —Tannic Acid — A A A 1Tartaric Acid — A A A 1Tetrachloroethane — A A CTetrachloroethylene — — A DTetrahydrofuran — A A DTin Salts — — A AToluene (Toluol) D B1 A DTrichloroacetic Acid — D A BTrichloroethane — A A CT richloroethy lene D C 1 A DTrichloropropane D A A 1 —T ricresy lphosphate B A A DTriethylamine — A A BTrisodium Phosphate B 1 A A ATurpentine D B1 A DUrea B — A DUric A dd — — A AVinyl Acetate — A 1 A 2 DVinyl Chloride D — A 2 DW ater, Deionized — A 2 A 2 A 2W ater, Acid, Mine B A A BW ater, Distilled B A A A 2W ater, Fresh A A A BW ater, Salt — A A BXylene D A A DZinc Chloride A A A BZinc H ydrosulfite A A A —Zinc Sulfate A A A A
18
APPENDIX B. SUMMARY OF CHEMICAL RESISTANCE (AFTER NALGE COMPANY, 1994).
PTFC Rigid1 Flexible2Classes o f substance (20 °C) FEP PVC PVC
Adds, dilute or weak E E EAdds, strong and concentrated* E E F
Alcohols, aliphatic E E GAldehyde E N NBases E E GEsters E N NHydrocarbons, aliphatic E E FHydrocrbons, aromatic E N NHydrocarbons, halogenated E N NKetones E N NOxidizing agents, strong E G F
* Except for oxidizing acids, see "oxidizing agents, strong"1 Bottles2 Flexible tubing
Chemical Resistance Classification:
E Thirty days of constant exposure causes no damage.G Little or no damage after 30 days constant exposure.F Some effect after seven days of constant exposure. Effects may be crazing,
cracking, loss of strength, or discoloration.N Not recommended for continuous exposure. Immediate damage may occur.
The effect may be more severe crazing, cracking, loss of strength, discoloration, deformation, dissolution, or permeation loss.
19
REPORT DOCUMENTATION PAGE Form Approved OM B No. 0704-0188
Public reporting burden for this collection of information is estimated to average 1 hour per response, including the time for reviewing instructions, searching existing data sources, gathering and maintaining the data needed, and completing and reviewing the collection of information. Send comments regarding this burden estimate or any other aspect of this collection of information, including suggestion for reducing this burden, to Washington Headquarters Services, Directorate for Information Operations and Reports, 1215 Jefferson Davis Highway, Suite 1204, Arlington, VA 22202-4302, and to the Office of Management and Budget, Paperwork Reduction Project (0704-0188), Washington, DC 20503.
1. AGENCY USE ONLY (Leave blank) 2. REPORT DATE 3. REPORT TYPE AND DATES COVEREDJanuary 1995
4. TITLE AND SUBTITLESusceptibility of ABS, FEP, FRE, FRP, PTFE, and PVC Well Casings to Degradation by Chemicals
5. FUNDING NUMBERS
6. AUTHORS
Thomas A. Ranney and Louise V. Parker
7. PERFORMING ORGANIZATION NAME(S) AND ADDRESS(ES)
U.S. Army Cold Regions Research and Engineering Laboratory 72 Lyme RoadHanover, New Hampshire 03755-1290
8. PERFORMING ORGANIZATION REPORT NUMBER
Special Report 95-1
9. SPONSORING/MONlTORING AGENCY NAME(S) AND ADDRESS(ES)
U.S. Army Environmental Center Aberdeen Proving Ground, Maryland
10. SPONSORING/MONITORING AGENCY REPORT NUMBER
SFIM-AEC-ET-CR-94071
11. SUPPLEMENTARY NOTES
12a. DISTRIBUTION/AVAILABILITY STATEMENT
Approved for public release; distribution is unlimited.
Available from NTIS, Springfield, Virginia 22161
12b. DISTRIBUTION CODE
13. ABSTRACT (Maximum 200 words)
This study compares the chemical resistance of four less commonly used materials for casing groundwater monitoring wells: acrylonitrile butadiene styrene (ABS), fluorinated ethylene propylene (FEP), fiberglass-rein- forced epoxy (FRE), and fiberglass-reinforced plastic (FRP), with two more commonly used casing materials: polyvinyl chloride (PVC) and polytetrafluoroethylene (PTFE). The six materials were exposed to 28 neat organic com pounds (including one acid) and to extremely acidic and alkaline conditions for up to 112 days. This w as done to simulate some of the most aggressive environments that monitoring well casings m ay be exposed to. The casings were observed for changes in weight and signs of physical degradation (swelling, softening, decrease in strength, deterioration, or dissolution). As expected, the two fluorinated polym ers (FEP and PTFE) were the most inert materials tested. They were not degraded by any of the test chemicals, although sam ples exposed to a few organic chemicals did show a slight weight gain (-1%). Among the nonfluorinated products tested, FRE w as the most inert. Three organic chemicals caused particles to flake from the FRE surf ace, followed by separation of the glass fibers, and two organic chemicals caused weight gains exceeding 10%. Also, highly acidic conditions (pH <1) degraded this material, and this may limit the use of this material in acidic environments. ABS w as the most readily degraded material. By the end of the study, only the acid and alkaline solutions had little effect on ABS. FRP was more severely degraded by the organic chemicals than FRE was, but w as less affected than PVC. Like FRE, FRP w as also degraded under highly acidic conditions.