NOAA Technical Report ERL 417-PMEL 35 Suspended Particulate Matter in Elliott Bay Edward T. Baker Pacific Marine Environmental Laboratory Seattle, Washington March 1982 U.S. Department of Commerce Malcolm Baldrige, Secretary National Oceanic and Atmospheric Administration John V. Byrne, Administrator Environmental Research Laboratories Boulder, Colorado George H. Ludwig, Director
Transcript
NOAA Technical Report ERL 417-PMEL 35
Suspended Particulate Matterin Elliott Bay
Edward T. Baker
Pacific Marine Environmental LaboratorySeattle, Washington
March 1982
U.S. Department of CommerceMalcolm Baldrige, Secretary
National Oceanic and Atmospheric AdministrationJohn V. Byrne, Administrator
Environmental Research LaboratoriesBoulder, ColoradoGeorge H. Ludwig, Director
NOTICE
Mention of a commercial company or product does not constitutean endorsement by NOAA Environmental Research Laboratories.Use for publicity or advertising purposes of information fromthis publication concerning proprietary products or the testsof such products is not authorized.
ii
CONTENTS
Page
ABSTRACT ............................................................•..... iv
ABSTRACT. The distribution and transport of suspended particulate matter (SPM) in Elliott Bay, an embayment of Puget Sound,Washington, was compared for dry (August) and wet (February)seasons of 1979-1980. During both survey times, the SPM distribution throughout the bay consisted of 1) a thin «5 m) surfacelayer of variable SPM concentration dominated by phytoplanktongrowth in summer and Duwamish River runoff in winter, 2) a uniformmid-depth minimum-SPM zone, and 3) a bottom nepheloid layer ofconcentrations and thickness highly variable in space and time.The total mass of SPM in Elliott Bay was about 20% higher inFebruary (15.7 x 10 8 g) than in August (13.0 x 10 8 g). Scatterplots of salinity vs. SPM for both seasons indicate a strong negative correlation (r - -.95) in the surface water and a weakerpositive correlation (r - .52) in the bottom waters. Vertical andhorizontal transport of SPM was measured with sediment traps andcurrent meter/transmissometers deployed at two stations. Accumulation of settled SPM 5 m above the bottom was 16%-30% higher insummer (-34.5 g/m2/day) than in winter (26.8 g/m 2/day). Organicmatter made up 6.9%-12.3% of the trapped sediment. Cross-spectralanalysis between near-bottom velocity and SPM concentration showedsignificant coherency at tidal frequencies. Transport of the SPMwas dominated by the mean flow; diffusion components had littleinfluence. The high positive correlations between SPM and salinity concentrations and low negative correlations between SPM concentrations and current speed imply that advection plays a largerrole than resuspension in maintaining the bottom nepheloid layerin Elliott Bay.
iv
Suspended Particulate Matterin Elliott Bay
Edward T. Baker
1. INTRODUCTION
The research presented in this report concerns distribution and transportof suspended particulate matter (SPM) in Elliott Bay. This work is part of ageneral MESA task to characterize the physical transport processes and thephysical fate of contaminants in various embayments around the margin of PugetSound. The research program was undertaken in close cooperation with otherinvestigators responsible for defining the hydrographic and current fields inElliott Bay.
The research has four objectives:
(1) Describe the SPM distribution in Elliott Bay during typical summer(dry) and winter (wet) sampling periods.
(2) Estimate the total SPM loading in Elliott Bay at each sampling time.
(3) Characterize the SPM in Elliott Bay in terms of organic matter content t clay mineralogYt and particle size distribution.
(4) Measure the vertical and horizontal flux of SPM at specific mooringlocations.
Elliott Bay, the study area, is a small embayment on the east side ofPuget Sound (fig. 1) surrounded by residential and industrial sections of thecity of Seattle. It has a surface area of ~20 km 2 (east of 122°25'W) withdepths ranging to >185 m. The volume of water in the bay is ~2.05 x 10 12 1.The bathymetry is dominated by a submarine canyon in the center of the baywhich originates in two tributaries trending N-S and NW-SE and debouches ontothe floor of the central basin of Puget Sound.
The principal source of freshwater is the Duwamish River t a lowlandstream whose runoff is controlled by direct precipitation rather than snowmelt.
36'
28'
• CTO STATIONS
• CURRENT METERMOORINGS
20'
36'
Figure 1.--Map of Elliott Bay showing bathymetry, station locations,mooring locations, and the mouth of the Duwamish River (West Waterway). Contour interval is 50 m.
2. METHODS
2.1 Field Methods
Sampling strategy consisted of 3-day areal surveys conducted once duringthe dry season (August 8-10, 1979) and once during the wet season (February20-22, 1980) in order to gauge the effect of seasonal variations in freshwaterrunoff on the SPM distribution in Elliott Bay. The surveys were conducted asfollows.
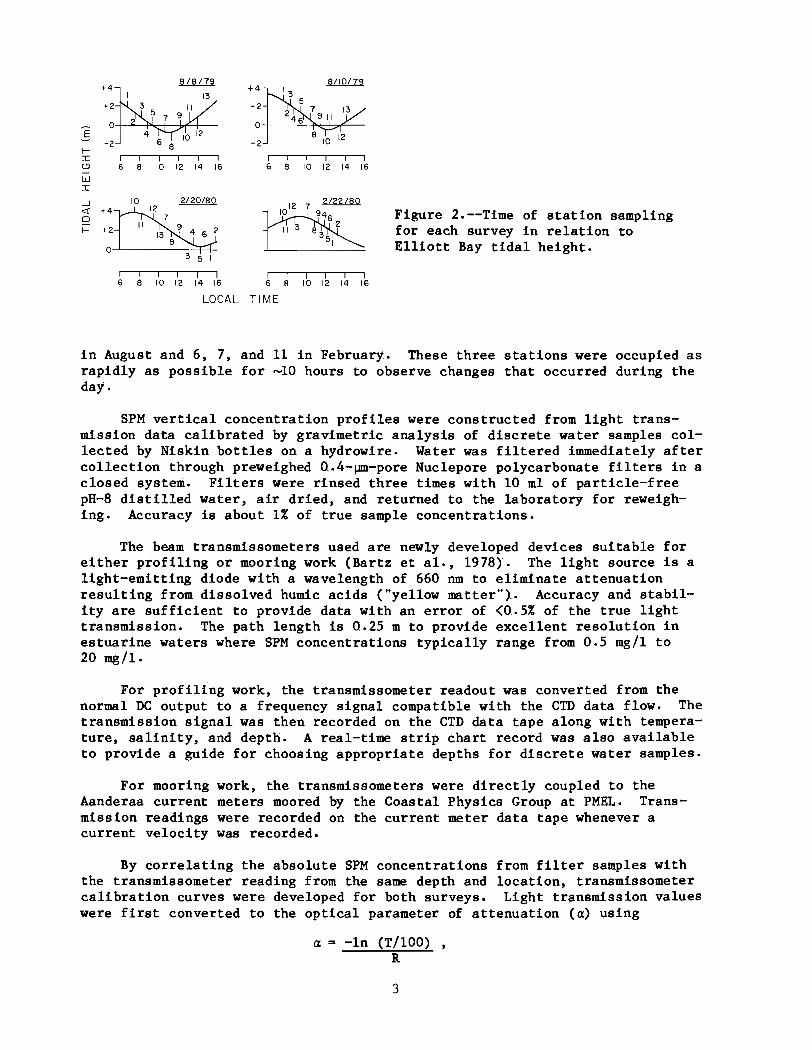
On the first and third day, stations 1-13 (fig. 1) were occupied sequentially in order to obtain a composite picture of the SPM distributions andhydrography throughout Elliott Bay. Occupation of these stations usually took~10 hours and necessarily occurred across a broad segment of the tidal cycle.In August, these areal surveys covered the last half of the ebb tide and thebeginning of the flood each day. In February, the surveys were started at the.tail end of the flood tide and conducted mostly during the ebb. Figure 2 records the height of the tide at the time each station was occupied. In orderto assess the effect of this tidal smearing on the data, the second day duringeach survey was devoted to a time series study of three stations--6, 7, and 12
2
+48/8/79
+48/10/79
13+2 +2
0 0E
-2 -2 10\-I I I I i I I I I I I I I(,C) 6 8 10 12 14 16 6 8 10 12 14 16-WI
....J 10 2/20/80
1012 7
2/22/80<! +4 946 Figure 2.--Time of station sampling0
II 13 2 for each in relation\- +2 8 3 survey to51 Elliott Bay tidal height.0
I I I I I I I I i I I I6 8 10 12 14 16 6 8 10 12 14 16
LOCAL TIME
in August and 6, 7, and 11 in February. These three stations were occupied asrapidly as possible for ~10 hours to observe changes that occurred during theday.
SPM vertical concentration profiles were constructed from light transmission data calibrated by gravimetric analysis of discrete water samples collected by Niskin bottles on a hydrowire. Water was filtered immediately aftercollection through preweighed Q.4-~-pore Nuclepore polycarbonate filters in aclosed system. Filters were rinsed three times with 10 ml of particle-freepH-8 distilled water, air dried, and returned to the laboratory for reweighing. Accuracy is about 1% of true sample concentrations.
The beam transmissometers used are newly developed devices suitable foreither profiling or mooring work (Bartz et al., 1978). The light source is alight-emitting diode with a wavelength of 660 nm to eliminate attenuationresulting from dissolved humic acids ("yellow matter"). Accuracy and stability are sufficient to provide data with an error of <0.5% of the true lighttransmission. The path length is 0.25 m to provide excellent resolution inestuarine waters where SPM concentrations typically range from 0.5 mg/l to20 mg/l.
For profiling work, the transmissometer readout was converted from thenormal DC output to a frequency signal compatible with the CTD data flow. Thetransmission signal was then recorded on the CTD data tape along with temperature, salinity, and depth. A real-time strip chart record was also availableto provide a guide for choosing appropriate depths for discrete water samples.
For mooring work, the transmissometers were directly coupled to theAanderaa current meters moored by the Coastal Physics Group at PMEL. Transmission readings were recorded on the current meter data tape whenever acurrent velocity was recorded.
By correlating the absolute SPM concentrations from filter samples withthe transmissometer reading from the same depth and location, transmissometercalibration curves were developed for both surveys. Light transmission valueswere first converted to the optical parameter of attenuation (a) using
a ~ -In (T/100) ,R
3
2.e
1.8
1.6,...,...
1.04I<e
1.2z0 1.0....~
a:.8::l
zW~ .6~a:
.04
.2
0.ee.e .2 .04 .6 .8
...
1.0 1.2 1.04 1.6 1.8 2.e
CONCENTRATION (mg/I)
2.e
1.8
1.6
I 1.04<e
1.2z0 1.0....~
a:.8::lz
W~ .6~
a:.04
.2
e.eB.e .2 .04 .6 .8
)(
I.e 1.2 1.6 1.8 2.e
CONCENTRATION (mg/l)
Figure 3.--Transmissometer calibration curves for (above) August 1979and (below) February 1980 in Elliott Bay. The least-squares regressioncoefficients are listed in table 1.
where T = percent transmission and R = path length of the instrument (0.25 m).Plots of SPM concentration versus light attenuation are shown in fig. 3;statistical parameters of the least-squares regression are given in table 1.It is clear from the statistical data that the two curves are not significantly different at the 95% confidence level.
Scatter in the data can be attributed to two principal causes: samplingvariability and inhomogeneity of the particle populations. Since the fieldequipment available required that transmissometer profiles and water samplesbe taken on successive casts rather than simultaneously, comparison of the two
4
Table 1.--Regression coefficients for scatter plots of attenuation (a)vs. suspended particulate matter (C)
No. of samples
Least-squares regression
Correlation (r)
Standard error of estimate
95% confidence interval
Slope
Intercept
August 1979
37
a = 0.56 (C) + 0.52
0.82
0.18
0.43-0.70
0.40-0.64
February 1980
18
a = 0.62 (C) + 0.42
0.86
0.11
0.23-0.60
0.43-0.82
measurements could be affected by ship drift, local SPM changes resulting fromadvection or diffusion, and wire angle, since the hydrocast had no in situdepth sensor. We attempted to minimize these problems by sampling depthhorizons where no steep vertical SPM gradients were present.
Attenuation cannot be precisely explained by a single parameter such asmass concentration unless all other parameters--such as size, shape, number,and composition--are held constant. This assumption of particle populationhomogeneity is poorest in the surface layer where there is a pronounced dichotomy between organic and inorganic particles. Furthermore, organic particles are difficult to sample accurately on sievelike membrane filters becausesome of the protoplasm may be sucked through the filter pores.
A useful measure of the effectiveness of the transmissometer is a comparison of the value of a at the zero SPM intercept with that found in particlefree water. Tyler et al. (1974) present laboratory data showing that at 660nm a lies between 0.34 and 0.43 m- 1 • Both the February and August data arewithin or slightly above this range, indicating that the variation in particleconcentration is indeed the primary influence affecting the transmissometerreadings.
By using the calibration curves, the light attenuation profiles at eachstation were converted to SPM concentration profiles for areal and crosssection plotting purposes. The SPM loading at each station was also calculated by progressive summing of the SPM concentration at 1-m intervals fromsurface to bottom.
In addition to the survey work, transmissometers and sediment traps weredeployed at two mooring locations (fig. 1) in Elliott Bay (EB2 and EB4). Thesediment traps used were of standard cylindrical design with a butterfly clos-.ing lid to prevent sample washout (Larrance et al., 1979). Traps were pairedat all depths to provide replicate samples.
5
•
The first deployment began on August 3. 1979. and was recovered on September 12. 1979. For this deployment. transmissometers were attached to thebottom current meters on EB2 (at 92 m. in water 112 m deep) and EB4 (at 132 m.in water 140 m deep). For the second deployment. February 6. 1980. to March7. 1980. transmissometers were attached to two current meters on EB2 (at 30 mand 90 m. in water 104 m deep) and one on EB4 (at 130 m. in water 137 m deep).Sediment traps were deployed in conjunction with all transmissometers. and anadditional pair of traps was moored at 30 m on EB4 during August 1979.
2.2 Laboratory Methods
2.2.1 Size analysis
The material collected in the sediment traps was analyzed for particlesize distribution by sieving and pipette analysis. Material that was greaterthan 62-~ diameter (equal to 4$ according to the Wentworth graded size scalewhere $ = -10g2 [diameter in mm]) was separated from the rest of the materialby pouring the sample through a 62-~ Nytex net sieve. Since much of thematerial larger than 4$ appeared to be associated with aggregates. the sampleswere sonicated for 5 minutes and then poured through the 62-~ Nytex again.The material remaining on the sieve was washed onto a preweighed 47-mm. 0.4-~
polycarbonate filter and weighed. The material previously associated withaggregates was collected on a preweighed 0.45-~ cellulose filter and weighed.A separate blank filter was used along with each cellulose filter.
Size distribution of the particles smaller than 62 ~ (from the initialseparation) was determined by pipette analysis which utilizes settling velocities of particles of various diameters (Krumbein and Pettijohn. 1938).Samples were diluted to 1 liter in glass settling cylinders with filteredPuget Sound seawater. Samples that represented a size range of whole phiunits were obtained by removing 20-ml aliquots from the cylinders at appropriate time intervals after thorough shaking. The times for sampling werecalculated according to Wadell's (1934) velocity formula. which differs fromStoke's equation by taking into account that natural particles are not perfectly spherical. The material was filtered onto 47-mm 0.4-~ polycarbonatefilters. rinsed with particle-free distilled water. air dried. and weighed.Statistical parameters were calculated by summing the amounts of material ineach size fraction and extrapolating for the whole sample.
Since no Coulter Counter system for SPM sizing was available during theElliott Bay surveys. Coulter Counter size analyses were performed later onparticles removed ultrasonically from sample filters. Although fragile particles such as aggregates are perturbed by this method. the majority of discreteparticles are generally unaffected.
2.2.2 Organic content
Estimates of the percent organic matter associated with particles inElliott Bay were determined by hydrogen peroxide treatment of material collected on polycarbonate filters. SPM filters collected during each of thecruises and filters representing the 4-. 6-. 8-. and 11-$ size ranges from theparticle size analysis of sediment trap material were analyzed to determinehow organic matter is distributed in Elliott Bay and the relationship betweenorganic content and particle size in the settled material.
6
The filters were placed, unfolded, in small glass vials (20-ml capacity),and about 15 ml of 10% hydrogen peroxide was added. This amount was enough tocover the filters when the vials were placed on their sides. The filters wereleft in the H20 2 for 30 to 45 minutes, then sonicated for 1 minute in aBranson 50/60-Hz ultrasonic cleaner to remove all particles from the filter.The weights of some filters were checked to determine that most of the material was removed by this method. For typical filters with amounts of materialin the 1- to 2-mg range, all but 3%-7% of the material was removed. Aftersonication, the filters were removed from the vials and rinsed with particlefree distilled water so that the rinse water was collected in the vials. Thefilters were replaced in their individual petri dishes, and the vials wereplaced in a 60°C oven for 24 hours. The contents of the vials were thenpoured back through the original filter, rinsed, air dried, and weighed. Thedifference of weights before and after treatment with hydrogen peroxide givesan estimate of the amount of organic matter in the sample.
3. RESULTS
3.1 Distributions of Suspended ParticulateMatter-August 1979
3.1.1 SPM transects
The three-dimensional distribution of SPM in Elliott Bay will be described with reference to four N-S vertical cross sections contoured in unitsof mg/l. The cross sections are designated 1-2, 3-6, 6-9, and 10-13 (fig. 1).A separate set of cross sections is drawn up for each survey day. Slightvariations in station location result in slight bathymetric differences between days.
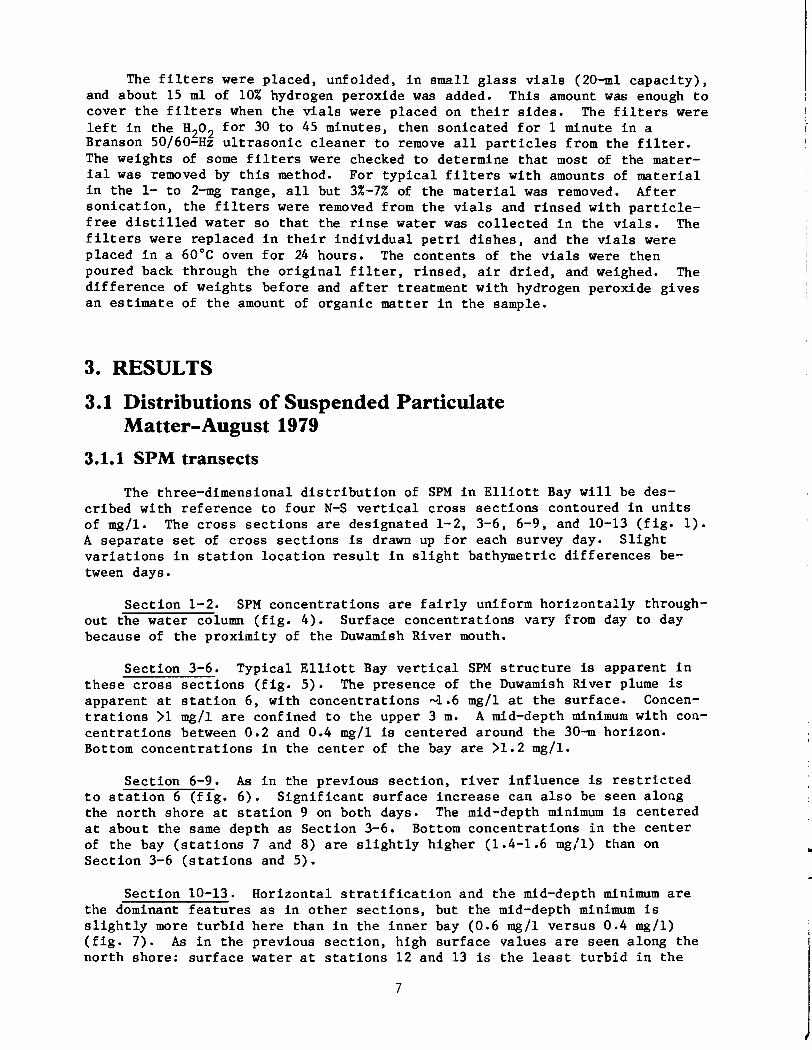
Section 1-2. SPM concentrations are fairly uniform horizontally throughout the water column (fig. 4). Surface concentrations vary from day to daybecause of the proximity of the Duwamish River mouth.
Section 3-6. Typical Elliott Bay vertical SPM structure is apparent inthese cross sections (fig. 5). The presence of the Duwamish River plume isapparent at station 6, with concentrations ~1.6 mg/l at the surface. Concentrations >1 mg/l are confined to the upper 3 m. A mid-depth minimum with concentrations between 0.2 and 0.4 mg/l is centered around the 30-m horizon.Bottom concentrations in the center of the bay are >1.2 mg/l.
Section 6-9. As in the previous section, river influence is restrictedto station 6 (fig. 6). Significant surface increase can also be seen alongthe north shore at station 9 on both days. The mid-depth minimum is centeredat about the same depth as Section 3-6. Bottom concentrations in the centerof the bay (stations 7 and 8) are slightly higher (1.4-1.6 mg/l) than onSection 3-6 (stations and 5).
Section 10-13. Horizontal stratification and the mid-depth minimum arethe dominant features as in other sections, but the mid-depth minimum isslightly more turbid here than in the inner bay (0.6 mg/l versus 0.4 mg/l)(fig. 7). As in the previous section, high surface values are seen along thenorth shore: surface water at stations 12 and 13 is the least turbid in the
7
•
N N
40
00
35
00
33
30
00
-1
0
02
4 4
25
00
04
10 08
0.4 L
L 10
-_- 0
80
6
---I
0.4
125
15
00
20
00
DIS
TA
NC
E(m
)
.466
18.1
6.l4
125
50
0
50
0
o o
EL
LIO
TT
BA
Y10
AUG
80
SP
MC
ON
TOU
RIN
TE
RV
AL
02
mg
/IV
ER
TIC
AL
EX
AG
GE
RA
TIO
N2
5x
EL
LIO
TT
BA
Y8
AUG
80
SP
MC
ON
TOU
RIN
TE
RV
AL
02
mg
/IV
ER
TIC
AL
EX
AG
GE
RA
TIO
N2
5x
100
so 20
120
120
10
0
s
2:1 40
56
0I f- ~
80
o
40
]:6
0I ti::
80
w o
25
00
N N
20
00
20
00
2
04
L
04
1,2
,19
.0,8
,06
'-
0.8
I0
6
2
EL
LIO
TT
BA
Y8
AU
G8
0S
PM
CO
NTO
UR
INT
ER
VA
L0
2m
g/I
VE
RT
ICA
LE
XA
GG
ER
AT
ION
25x
iI
o5
00
1000
/50
0
DIS
TA
NC
E(m
)
EL
LIO
TT
BA
Y10
AU
G8
0S
PM
CO
NTO
UR
INT
ER
VA
L0
2m
g/I
VE
RT
ICA
LE
XA
GG
ER
AT
ION
25x
iI
o5
00
10
00
1500
DIS
TA
NC
E(m
)
so
so
80
80
100
Ii
20
]4
0:r I- ~
60
o
20
E ~4
0:r I- ~
60
o
00
Fig
ure
4.--
SP
Mcr
oss
secti
on
sfo
rst
ati
on
s1
-2,
Au
gust
19
79
.F
igu
re5.
--S
PM
cro
ssse
cti
on
sfo
rst
ati
on
s3
-6,
Au
gust
1979
.
N N 55
00
1010
II !
35
00
40
00
45
00
50
00
55
00
10 12L
--0
6
L
12
20
00
25
00
30
00
DIS
TAN
CE
1m)
l==
::-
T=
1
1500
L
12II
0608~
~IO~
H0
8_g
~
06
-
1000
13 13
50
0
oo Fig
ure
7.~-SPM
cro
ssse
cti
on
sfo
rst
ati
on
s1
0-1
3,
Au
gust
19
79
.
ELL
IOT
T8A
Y8
AUG
80
SPM
CO
NTO
UR
INTE
RV
AL
02
mg
/lV
ER
TIC
AL
EXAG
GER
ATIO
N2
5.
S0 20
40
60
~o
]10
0r f- a.
120
L.J
0
140
160
180
20
0
22
0
S0 20
40
60
801
~----
----I
06
08
I10
0r f- ~
120
0
\40
160
18
0j
ELL
IOT
TB
AY
10AU
G8
0
20
0S
PM
CO
NTO
UR
INTE
RV
AL
02
mg
/lV
ER
TIC
AL
EXAG
GER
ATIO
N2
5.
S6
78
9N
o~"."
..oE
20
0<1~
L
]6
0
~8
0C
l UJ o
100
EL
LIO
TT
BA
Y12
08
AUG
80
SP
MC
ON
TOU
RIN
TE
RV
AL
02
mg
/l1
40
VE
RT
ICA
LE
XA
GG
ER
ATI
ON
25
.
16
0o
50
01
00
01
50
02
00
02
50
03
00
03
50
04
00
04
50
0
\0D
ISTA
NC
E1m
)
S6
16
14
127
89
No
---
00
80
.
20
L0
40
4 (4
0
E6
08%
-1
0-
'f:.8
012
~C
l UJ o
100
120
~OL~~~T~OBAY
SP
MC
ON
TOU
RIN
TER
VA
L0
2m
g/l
14
0V
ER
TIC
AL
EX
AG
GE
RA
TIO
N2
5.
160
"o
50
01
00
01
50
02
00
02
50
03
00
03
50
04
00
04
50
0
DIS
TAN
CE
1m)
Fig
ure
6.--
SP
Mcr
oss
secti
on
sfo
rst
ati
on
s6
-9,
Au
gust
19
79
.
study area. Variability below 100 m is highest from day to day of any section, decreasing from )1.8 mg/l on August 8 to )1.0 mg/l on August 10.
The distribution of SPM in Elliott Bay during August 8-10, 1979, can bebroadly described by three distinct features: 1) a thin «5 m) surface layerof relatively high concentrations resulting from the Duwamish River plume.This layer is prominent near the river mouth and is found in steadily decreasing concentrations along the north shore; 2) a bay-wide, mid-depth minimumwith concentrations in the range of 0.4-0.6 mg/l. This region thickens anddeepens with increasing water depth; and 3) a bottom nephe10id layer (BNL) ofconcentrations highly variable in both space and time. Highest BNL concentrations were always found on the deepest stations of any transect.
3.1.2 Areal plots
It is clear from the foregoing discussion that the bulk of SPM in ElliottBay is contained in the surface and bottom turbid layers. The geographicpattern of the SPM distribution, and its relation to the hydrographic field,can best be illustrated through the use of areal plots of SPM concentrationand salinity.
Surface concentration maps from August 8 and 10 (fig. 8A) show high concentrations (1..6-1.8 mg/l) off the west waterway, rapidly decreasing to thenorth and west. Concentrations remained )1.2 mg/l along the northern shore asfar as station 9 on August 10 but were patchier on August 9. Clearest waterwas always found in the southwest quadrant of the study area. Winds on bothAugust 8 and 10 were typically from the west or northwest averaging about 10km/h. This wind pattern and the weak discharge rate of the Duwamish Riverduring the survey (7.8 m3/s) combined to keep the plume against the easternand northern shore of the bay.
Surface salinity maps (fig. 8B) follow a similar pattern. The salinityat station 6 was 27.04 0/00 and 28.02 0/00 on August 8 and 10, respectively,and showed a steep gradient to the west and a much gentler gradient around theeast and north shore. Saltiest water both days was found at station 13through 11, corresponding to the least turbid water.
Maps of SPM concentrations and salinity 5 m above bottom (figs. 9A and9B) are substantially different than the surface distributions. There was astrong positive correlation between depth and concentration on both samplingdays, but details of the distribution changed markedly between the two days.On August 8, the highest concentrations were found at the s~ations at themouth of the submarine canyon and near the head of the western tributary.Concentrations decreased uniformly away from these stations. On August 10,however, the highest concentrations were found in the center of Elliott Bay;concentrations at the mouth of the submarine canyon had decreased by almostone half and concentrations in the eastern tributary canyon had risen about 30percent. The distributions strongly suggest that either a discrete bolus ofturbid water had been advected into the center of the bay via the submarinecanyon, or that tidal current variations had produced differing patterns ofresuspension each day. Since station 11 was occupied at roughly the samestage of the tide on both August 8 and 10 (fig. 2), however, tidal variationsbetween the two sampling days were probably minimal.
10
II
I
r
l
20'22'
WESTWATER
WAY
122°24 '
ALKI PT.
A122°24' 22' 20' 122°24' 22' 20'
I 0 I 2 0 I 2I I I
I I oJ (KILOMETERS KILOMETERS
SPM CONCENTRATION (mg/I SPM CONCENTRATION (mg/I)\
SURFACE SURFACECo ~
cor<') " " 8/10/79 r<')
SEATTLE .8
.6
io io io ior0 -~ r0 r<')
° ° °I'-- I'-- I'-- I'--
<:t <:t <:t <:t
I........I
ALKI
122°24' 22' 122°24 ' 20'
B122°24' 22' 20' 122°24' 22' 20'
0 I 2I I I I ..J
KILOMETERS KILOMETERS
SALINITY (%0) SALINITY (%0)SURFACE
CoSURFACE
Co" 8/8/79 ~ " 8/10/79r<')
1r0
•SEATTLE • SEATTLE
"• • ••
io -0.0 io ior0 r0 r0 r0. ° ~
.,- I'-- I'--<:t <:t '1' <:t
II ......
I
Figure 8.--Areal maps of surface (A) SPM concentration and (B) salinityat 1 m during the August surveys. Contour interval is 0.2 mg/l for SPM.0.5%0 for salinity. Dotted line is' the 100-m isobath.
11
012I I I
KILOMETEnS
A
B
122°24' 22' 20'
122°24' 22' 20' 122°24' 22' 20'
30.5
I 0 I 2 1I I I
KILOMETEns
SALINITY (%015 m A BOVE BOTTOM
8/8/79
122°24' 20'
o I 2I I I
KILOMETERS
SALINITY (%0)~ 5 m ABOVE BOTTOM
~ ,,30.1~ 8/10/793().~
30.3\30.4 '
30.4
30.3r
, ' -.ALKI PT.
122°24' 20'
Figure 9.--Areal maps of bOttom (A) SPM concentration and (B) salinityduring the August surveys. Contour interval is 0.2 mg/l for SPM,0.1%0 for salinity. Dotted line is the 100-m isobath.
12
I
l
Maps of near-bottom salinity (fig. 9B) for August 8 and 10 show onlyslight variations. Higher salinity water intrudes farther up the east tributary canyon on August 8 than on August 10. Effects of this intrusion can alsobe seen at station 13, where the salinity reached 30.5 %0 on August 8. However, no evidence of an anomalous water mass in the center of the bay can beseen in the salinity data for August 10. Temperature data indicate that ageneral warming of 0.2°-0.4°c took place in the bottom water of most of thebay stations between August 8 and 10.
3.1.3 Time series data
Time series data were collected at three stations (6, 7, and 12) toassess the variability of the SPM distributions on an hourly scale. Knowledgeof the short-term variability is necessary to interpret the integrated dailymaps which span over half a tidal cycle. The stations chosen for the timeseries work were selected for their representativeness of the bay as a whole:station 6 monitored the river input, station 12 monitored the less variableouter bay (and was located adjacent to one of the transmissometer/sedimenttrap moorings), and station 7 was representative of the transition regionbetween the inner and outer bay.
Station 6. Concentrations in the surface layer varied by more than afactor of 2 (1.0 to 2.2 mg/l) from about mid-ebb to low water (fig. 10). Thehighest concentration occurred at the time of low water. Concentrations inthe mid-depth minimum (between 15 and 40 m) were relatively unchanged duringthe 8-h observation period, although the thickness of the minimum zone wasdiminished just before and after low water. This diminution resulted from theappearance of a strong BNL at approximately low tide (~1100 hours). The factthat the maximum BNL occurs just before low tide and the minimum during therising tide suggests advection of turbid water in the canyon rather than localerosion and resuspension (see also sec. 4.3).
The salinity distribution (fig. 10) shows good agreement with the SPMdistribution. Surface salinities vary by more than 2%0. The appearance of
1420 1533295
30
12581137
30,1
302
SALINITY (%0)STATION 6 8/9/79
o 0737_29
0900 8 1019
] 20If-
~ 40o6~+- ----,
wS IQf- 0f- I -I+--~-~-""==;:::=:::::::::;:=:"'-'--~-.,..--J
0800 0900 1000 1100 1200 1300 1400 1500LQ.CAL TIME
15336 1420
1300 1400 1500
0406
o 0737 '2, 49-900, 181019 _ 1137 1258,
8~ 08] 20If-
~ 40o
60~--===;J:=====~0~8=~=~==~~:32I
o-I-l-~-~----=;=::::::::;:::=:;::::==::;::~~~~
0700 0800 0900 1000 1100 1200LOCAL TIME
SPM CONCENTRATION (mg/IlSTATION 6 8/9/79
Figure 10.--Time series data for station 6. Station times are given inlocal time along the top of the profile. A time plot of the tide heightis given at the bottom of each profile. Contour intervals are 0.2 mg/lfor SPM; for salinity, contours vary from 1%0 to 0.1 % 0, depending oncontour density.
13
SPM CONCENTRATION Img/I)STATION 7 8/9/79
SALINITY (%0)STATION 7 8/9/79
303
304
301-r--_-.l
302
0956 gpl2 96 1230 29 135529 1510
0700 0800 0900 1000 1100 1200 1300 1400 1500LOCAL TIME
Figure 11.--Time series data for station 7. Station times are given inlocal time along the top of the profile. Contour intervals for SPM are0.2 mg/l; for salinity, contours vary from 0.1%0 for salinities<30.4%0 to 0.02%0 for salinities >30.4%0.
the BNL is closely associated with the appearance of 30.2%0 water. Thebottom of the mid-depth minimum follows a trend similar to that of the30.1%0 salinity contour.
Station 7. At station 7, the surface concentration maximum was less discrete and delayed from the time of low water (fig. 11). High concentrationswere found both at 1112 and 1355 hours. This pattern is consistent withstation 7's location in the central bay, especially since the areal mapssuggest that most of the river plume hugs the north and east shore. Thethickness and position of the mid-depth minimum was constant during the entireperiod, although slight changes were noted in the intensity of the layer.Changes in the bottom layer were difficult to quantify because ship drift anda steeply sloping bottom made accurate reoccupation of the position difficult. Concentrations at the bottom were generally between 1.4 and 1.6 mg/l;three shallow occupations showed lower concentrations, and one deeper occupation exceeded 1.6 mg/l.
The surface salinity pattern (fig. 11) showed a clear minimum about 2hours after low tide. Near-bottom salinities also showed a strong cyclicalpattern with a high value of 30.48%0 at 0956 hours decreasing to ""'30.27 %
0
at 1510 hours. Variations in near-bottom salinities followed the SPM pattern,with the deeper casts showing higher values and the shallower casts lowervalues, suggesting that these variations were caused more by positioning thanby actual changes in the bottom water conditions.
I
I
lStation 12. Surface SPM concentrations show highs occurring between the
times of high and low water (fig. 12), although the distance of station 12from the river mouth and the shortness of the time series record make tidalinferences speculative. Surface variations are substantial, however, decreasing from a high of ""'1.2 mg/l at 0630 hours to a low of ~.5 mg/l at 0805 to0924 hours. The mid-depth minimum was always present, but its intensity andthickness were significantly reduced by a thick BNL present when the survey
0600 0700 0800 0900 1000 1100 1200 1300 1400LOCAL TIME
1200 1300 1400
1044
08
0924 1200-I----:---t:::-:--==+=_ 0 6
40
o
20
120
_ 60E
iI: 800-w0
100
Figure 12.--Time series data for station 12. See legend of fig. 11.
began at 0630 hours. By 0924 hours the depth of the 0.8 mgtl contour hadfallen from 55 m to 130 m and near-bottom concentrations had decreased from1.7 to 1.3 mg/l. After 1044 hours, the BNL increased in both thickness andintensity.
As with the other stations, low surface salinity values were found withtimes of high SPM concentration (fig. 11). In the bottom waters, the positionof the 30.42%0 contour roughly followed the top of the BNL as defined by the0.8 mg/l contour. The appearance of the saltiest water (>30.5%0), however,tended to coincide with times of the lowest bottom concentrations (0924 to1200 hours). Analysis of the mooring data from this station (sec. 4.3),however, shows excellent agreement between peaks of salinity and turbidityover tidal-cycle time scales.
Results from the time series investigations can be summarized as follows:1) the characteristic three-layer SPM stratification (surface high, mid-depthminimum, and BNL) was stable over the observational period, although thevertical gradients varied sharply over short time scales; 2) the surface SPMconcentrations are strongly dependent on tide stage and distance from theriver mouth; and 3) variations in the thickness and intensity of the BNL areat least broadly correlated with the salinity distribution in the bottomwater.
3.1.4 SPM loading
After the SPM loading (expressed as mg/cm2) was calculated for eachstation, the individual station results were extended to the entire study areaby the following procedure. Elliott Bay was subdivided into 13 separate subareas (each sub-area centered around a station location) such that the boundaries between each sub-area primarily followed isobaths. The perimeter of thebay (depths (20 m) was not included. Depths below 20 m were divided into thefollowing intervals: 20-50 m, 50-70 m, 70-90 m, 90-120 m, 150-180 m, and>180 m. The projected areal surface of each depth interval in each sub-area
15
Table 2.--SPM loading calculations by sub-area and depthinterval for August 8, 1979
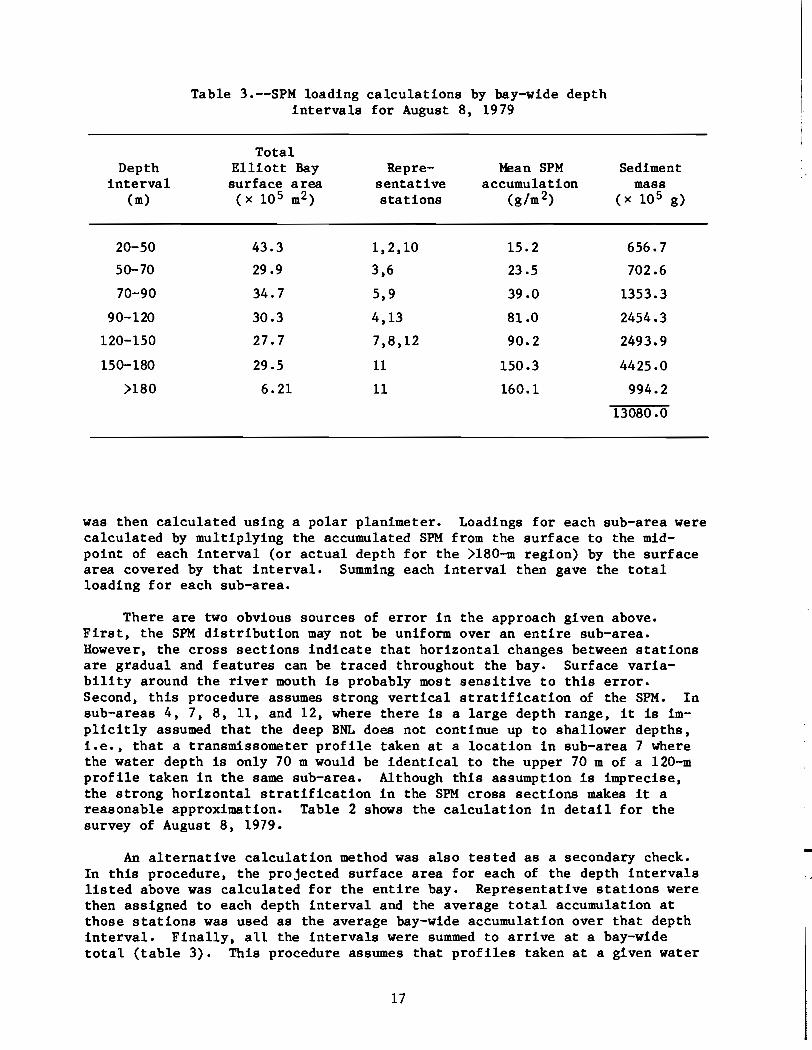
Table 3.--SPM loading calculations by bay-wide depthintervals for August 8 t 1979
Depthinterval
(m)
20-50
50-70
70-90
90-120
120-150
150-180
>180
TotalElliott Bay Repre- Mean SPM Sedimentsurface area sentative accumulation mass(x 10 5 m2) stations (g/m 2) (x 10 5 g)
43.3 1,2,10 15.2 656.7
29.9 3,6 23.5 702.6
34.7 5,9 39.0 1353.3
30.3 4,13 81.0 2454.3
27.7 7,8 t 12 90.2 2493.9
29.5 11 150.3 4425.0
6.21 11 160.1 994.2
13080.0
was then calculated using a polar planimeter. Loadings for each sub-area werecalculated by multiplying the accumulated SPM from the surface to the midpoint of each interval (or actual depth for the >180-m region) by the surfacearea covered by that interval. Summing each interval then gave the totalloading for each sub-area.
There are two obvious sources of error in the approach given above.First, the SPM distribution may not be uniform over an entire sub-area.However, the cross sections indicate that horizontal changes between stationsare gradual and features can be traced throughout the bay. Surface variability around the river mouth is probably most sensitive to this error.Second, this procedure assumes strong vertical stratification of the SPM. Insub-areas 4 t 7, 8 t 11, and 12, where there is a large depth range, it is implicitly assumed that the deep BNL does not continue up to shallower depths,i.e., that a transmissometer profile taken at a location in sub-area 7 wherethe water depth is only 70 m would be identical to the upper 70 m of a l20-mprofile taken in the same sub-area. Although this assumption is imprecise,the strong horizontal stratification in the SPM cross sections makes it areasonable approximation. Table 2 shows the calculation in detail for thesurvey of August 8, 1979.
An alternative calculation method was also tested as a secondary check.In this procedure, the projected surface area for each of the depth intervalslisted above was calculated for the entire bay. Representative stations werethen assigned to each depth interval and the average total accumulation atthose stations was used as the average bay-wide accumulation over that depthinterval. Finally, all the intervals were summed to arrive at a bay-widetotal (table 3). This procedure assumes that profiles taken at a given water
17
Table 4.--SPM loadings for Elliott Bay
Date
Augus t 8, 1979
August 10, 1979
February 20, 1980
February 22, 1980
Mass i. Inner bay i. Outer bay(x 108 g) (Stations 1-9) (Stations 10-13)
13.2 41 59
12.7 44 56
15.3 40 60
16.1 40 60
depth anywhere in Elliott Bay will be similar. It also allows a BNL to beconsidered at every depth, although it must be uniform throughout the bay fora given depth interval. It can be seen from tables 2 and 3 that the twomethods yield results less than 1% apart, implying that either method willyield a reasonably good estimate of the mass of SPM in the study area duringthe survey periods.
Table 4 details the results from the August 8 and 10 surveys. Total SPMin the study area on August 8 was approximately 13.2 x 10⁸ gj 7.8 x 10⁸ g wasin the outer bay (stations 10 through 13) and 5.4 x 10 8 was in the innerbay. Loading on August 10 was about 12.7 x 10 8 g or 10% less than 2 daysearlier•. The outer stations lost about 10% of their load, and the innerstations increased their load by about 5%. At least part of this trend is dueto the movement of near-bottom turbid water from the outer to the inner stations as seen in fig. 9A.
3.2 Distributions of Suspended ParticulateMatter-February 1980
3.2.1 SPM transects
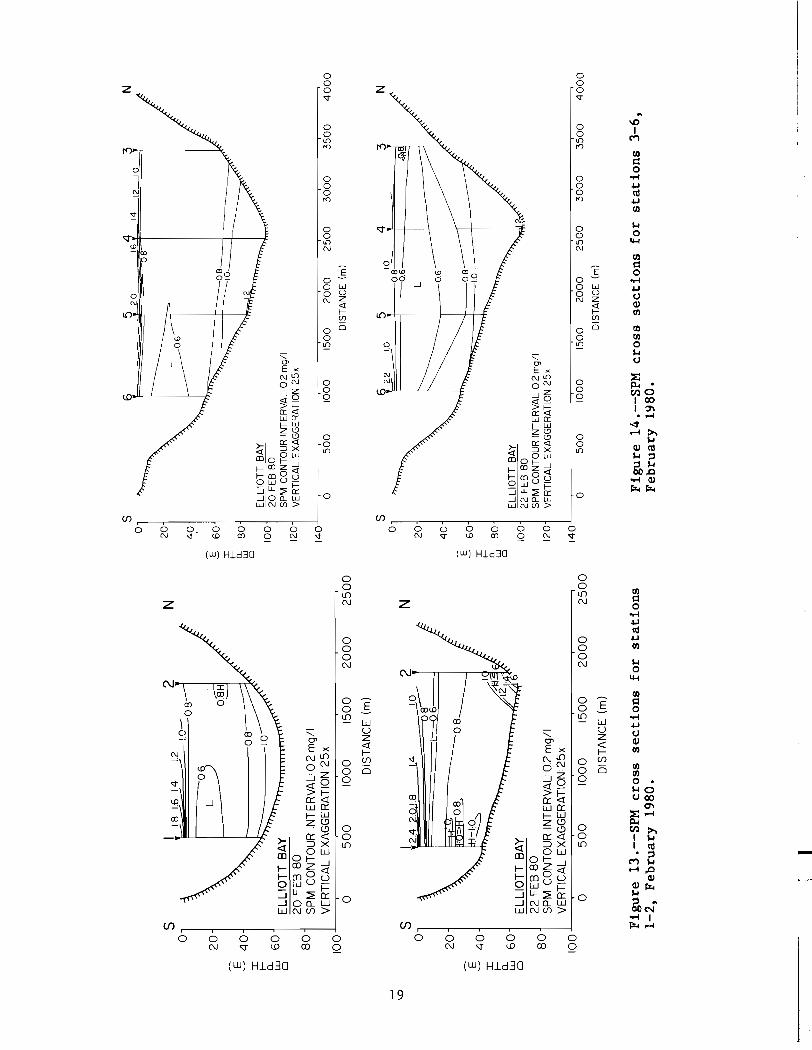
Section 1-2. The effects of the rainy season can be seen immediately inthe February cross section of Section 1-2 (fig. 13) compared with that ofAugust (fig. 4). Strong north-south surface plume gradients were seen on bothsurvey days. A BNL was present at both stations each day, but an assortmentof SPM maxima and minima were present in the BNL on February 22. The middepth minimum was again found, but the minimum value had increased 50% sinceAugust, from 0.4 to 0.6 mg/l.
Section 3-6. A strong influence from the Duwamish River was seen atstations 6 and 5 in this cross section also (fig. 14). The thickness of thisriverine influence layer was no greater than in August. As in Section 1-2,SPM concentrations in the mid-depth minimum were significantly greater than in
120ELLIOTT BAY22 FEB 80SPM CONTOUR INTERVAL 02 mg/l
140 VERTICAL EXAGGERATION 25x
1600 500 1000 1500 2000 2500 3000 3500 4000 4500
DISTANCE (m)
Figure 15.--SPM cross sections for stations 6-9» February 1980.
August. Compared with the August BNL» the February BNL was much weaker andsomewhat thinner» with concentrations generally <1.2 mg/l.
Section 6-9. Surface concentrations varied significantly along thistransect between the two surveys (fig. 15). A high concentration was foundalong the north shore at station 9 on February 20 but not on February 22. Aswith the other sections» concentrations in the mid-depth minimum were elevatedabove August levels. The highest concentrations found in the BNL (1.4 and1.6 mg/l) were the same as in August» but the volume of this most turbid waterwas much less than in August; turbidity levels >1.4 mg/l occurred only at thedeepest station and not more than 5 m above bottom.
.~
LSection 10-13. Surface values were relatively uniform all across the
transect on both days (fig. 16). Values in the mid-depth minimum were thesame as in the outer transects. Variability in the BNL in the submarinecanyon (station 11)>> however» was extreme. On February 20 only a very weakBNL was present. Two days later» near-bottom values had more than doubled and
Figure 16.--SPM cross sections for stations 10-13 , February 1980.
three major SPM maxima could be identified in the bottom 60 m.was similar to but more pronounced than the one that took placestation in August.
This changeat the same
The overall distribution of SPM was generally similar to that foundthroughout the bay in August. River input of particulate matter was morepronounced, owing to the factor-of-5 increase in Duwamish River runoff betweenAugust (7.8 m3/s) and February (42.5 m3/s). The mid-depth minimum was againpresent but with concentrations increased by about 50% over August. Finally.the BNL was less well developed in the inner bay in February. but showed largevariability in the outer bay. The transience of the BNL makes seasonal comparisons difficult if only the survey data are used. Moored transmissometerdata. discussed in sec. 3.4. show there was little difference in the aver~ge
near-bottom intensity of the BNL near station 7 between August and February.
21
3.2.2 Areal plots
Surface concentration maps from February 20 and 22 (fig. 17A) clearlyshow the Duwamish River plume spreading to the north and west. As in August,there was no indication of surface transport to the west along the southernshore. The difference in the shape of the plumes may be due to a markeddifference in the wind pattern between February 20 and 22. The net winddirection and average speed for February 20 (SeaTac Airport) was 190 0 at18.3 km/h; the wind was southerly, blowing the plume against the northshore. On February 22 the net wind was from 350 0 at 12.2 km/h; the wind wasnortherly and evidently opposed the discharge momentum and forced the plumeinto a narrow band in the center of the bay. It is interesting to note thatthe wind had been blowing fairly steadily out of the north since about midnight on February 20, and there was still no sign of the plume moving westpast station 7 along the southern shoreline.
Salinity maps show an almost identical pattern (fig. 17B), implying thatthe particulate matter moves coherently with the freshwater river plume undervarying meteorological conditigns. The agreement between SPM and salinitypatterns was much better than in August.
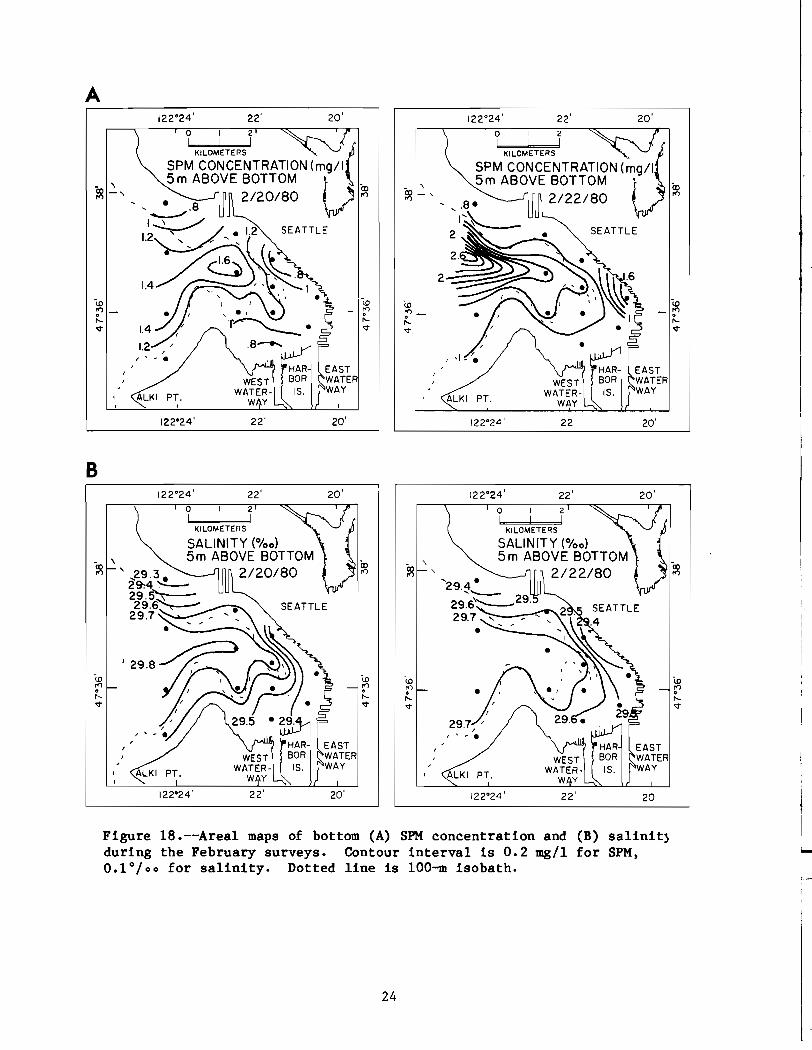
Maps of the SPM concentrations 5 m above bottom (fig. 18A) illustrate thedramatic daily variation found in the submarine canyon. Perimeter stations(except for station 2) varied only slightly from February 20 to 22. Thisepisodic pattern agrees with that observed during August.
The only significant change in bottom-water salinities between the twosurveys was the presence of water saltier than 29.8 0/00 at stations 12 and 8on February 20 (fig. 18B). On February 22, no water saltier than 29.78 0/00
was found in the bay. No evidence of anomalous water related to the highturbidity at station 11 was seen in the temperature distribution either.
3.2.3 Time series data
Time series data were collected on February 21 at stations 6, 7, and11. The outer station was changed from 12 in August to 11 in February becauseof its position in the submarine canyon and the presence of highly turbidwater at that location. Unfortunately, the February time series study wasseverely curtailed by the thick fog in the morning, preventing boat operationsuntil afternoon.
Station 6. The station taken at low tide (1454 hours) appears to haveanomalously low SPM concentrations (fig. 19A), which may be a result of apositioning error by the ship. Concentrations in the BNL fell sharply fromthe beginning to the end of the survey.
Station 7. As in August, highest surface concentrations were seen sometime after low tide (fig. 19B). Concentrations in the BNL decreased withtime.
Station 11. Surface concentrations Were uniform throughout the survey(fig. 19C). BNL concentrations increased sharply with time, from about 1.4mg/l at 1245 hours to >3.0 mg/l at 1640. Both temperature and salinity remained unchanged in the bottom water betweem 1410 hours and 1640 hours.
22
•,I
ij
I-
A122°24' 22' 20' 122°24' 22' 20'
SEATTLE
KILOMETERS
o II I oJ
••
•
122°24 '
JSPM CONCENTRATION (mg/I)SURFACE r ~ Co
• 2/22/80 ~ r<'l
.8---
-\0...,or-<t
20'
I I (KILOMETEns _ IJ
SPM CONCENTRATION (mg/I)SURFACE Vii
B122°24' 22' 20' 122 0 24' 22' 20'
SEATTLE•
012I I oJ
KILOMETERS
SALINITY (%0)SURFACE
2/22/80
•
•Cor<'l
SEATTLE
•
KILOMETEns
SALINITY (%0)SURFACE
2/20/80
012I I I
•
•~--~28
-\0I
\D-\0 \D d:;:..., ..., ..., r<'l
t- • 0 0 0
r-- !'- r--<t <t <t
/ <t
/ // '\ .... I '\ ....
HAR EAST
WEST BaR WATERWATER- IS. WAY
ALKI PT. WAY ALKI PT.
122°24' 22' 1220 24' 20'
-~ \ ,
Figure 17.--Areal maps of surface (A) SPM concentration and (B) salinityat 1 m during the February surveys. Contour interval is 0.2 mg/l forSPM, 1%0 for salinity. Dotted line is 100-m isobath.
23
A122°24' 22' 20' 122°24' 22' 20'
(0:;'1-,...v 1.4
1.2
B
122°24 ' 22' 20' 122°24 ' 22' 20'
122°24' 22' 20' 122°24' 22' 20'
Figure 18.--Areal maps of bottom (A) SPM concentration and (B) salinit}during the February surveys. Contour interval is 0.2 mg/l for SPM,0.1%0 for salinity. Dotted line is 100-m isobath.
012I ! I
KILOMETEns
SALINITY (%0)\ 5m ABOVE BOTTOM
~ ' ...29.3. 2/20/802~4'-
29.5~ _29.6
29.7 " ......._,~~
-(j)
I"l°t-V
122°24'
EASTWATERWAY
20'
o I 2I I ..J
KILOMETERS
SALI N[T Y (%0)5m ABOVE BOTTOM
2/22/80
ALKI PT.
122°24' 20'
l
24
164015231245 1410
oB' 400E6::::r::::±::::.
C SPM CONCENTRATION (mg/I)STATION II 2/21/80
o
60
20
40
120
140
160
E 80If-
~IQOo
1550 10 121707OB06
06
14370
'317
BSPM CONCENTRATION (mg/I)STATION 7 2/21/80
20
100
_ 40E
i= 600-W0
80
_ 120+- _wE 2Q f- I I _--=;::::::::::::;:=:::;::=-~f-I O+-
1300 1400 1500 1600 1700LOCAL TIME
1700
14,12
06
OB10
10
o 1340 1454 1610 172310
08r----4--06
A SPM CONCENTRATION (mg/I)STATION 6 2/21/80
- 20E
i= 400Wo
60
- 80+- ----,wE 2Q f- I I ----=;:::::::::;:=:::::;::=-...,..Jf-I O+-
1300 1400 1500 1600LOCAL TIME
EI8~-t------------
~ ;: I I -~----=;::==:::;:::=::::;=:Jf- I O+-1200 1300 1400 1500 1600
LOCAL TIME
Figure 19.--Time series data for (A) station 6, (B) station 7, and (C)station 11. Station times are given in local time across the top of theprofile. Contour interval is 0.2 mg/l. A time plot of the tide heightis given at the bottom of the profile.
3.2.4 SPM loading
The amount of SPM in Elliott Bay was almost 20% higher in February thanin August (table 4). Partitioning between the inner and outer regions of thebay was very similar to the August data, with 40% of the total in the innerbay on both February 20 and 22. The largest increases were seen in the innerbay near the Duwamish River--stations 1, 5, and 6 averaged a 58% increase fromAugust to February. Increases elsewhere in the bay were more moderate, butall stations showed some increase, reflecting the bay-wide increase in SPMconcentrations in the thick mid-depth minimum zone.
3.3 Characteristics of Suspended ParticulateMatter
3.3.1 Organic content
The organic content of SPM in Elliott Bay was generally greater in Augustthan in February. The surface values for August were about twice as great asthose for February at all stations (averages of 41% and 18% organic matter forAugust and February, respectively); bottom values were about half again ashigh in August as in February. During both cruises, surface samples generallycontained greater amounts of organic material than did deep samples. Stations1 and 6, however, showed greater values at the bottom than at the surfaceduring February and on one of the days in August (August 10).
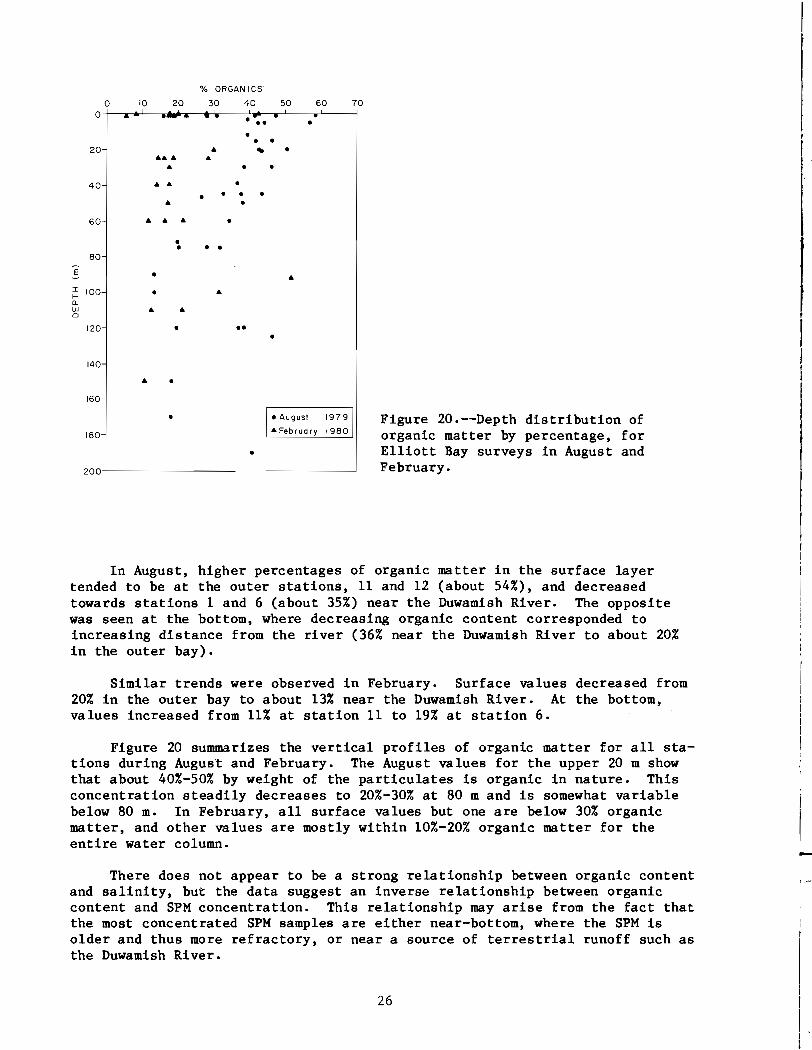
Figure 20.--Depth distribution oforganic matter by percentage, forElliott Bay surveys in August andFebruary.
•
..
I
·August 19791.. Feb rue ry 1980
•
•
•
•
..
• •
........ ...... ..
•
••
••
.. ..
.. .. ..
.. .
20
40
60
80
E
I 100t-a.W0
120
140
160
180
200
In August, higher percentages of organic matter in the surface layertended to be at the outer stations, 11 and 12 (about 54%), and decreasedtowards stations 1 and 6 (about 35%) near the Duwamish River. The oppositewas seen at the bottom, where decreasing organic content corresponded toincreasing distance from the river (36% near the Duwamish River to about 20%in the outer bay).
Similar trends were observed in February. Surface values decreased from20% in the outer bay to about 13% near the Duwamish River. At the bottom,values increased from 11% at station 11 to 19% at station 6.
Figure 20 summarizes the vertical profiles of organic matter for all stations during August and February. The August values for the upper 20 m showthat about 40%-50% by weight of the particulates is organic in nature. Thisconcentration steadily decreases to 20%-30% at 80 m and is somewhat variablebelow 80 m. In February, all surface values but one are below 30% organicmatter, and other values are mostly within 10%-20% organic matter for theentire water column.
i
LThere does not appear to be a strong relationship between organic content
and salinity, but the data suggest an inverse relationship between organiccontent and SPM concentration. This relationship may arise from the fact thatthe most concentrated SPM samples are either near-bottom, where the SPM isolder and thus more refractory, or near a source of terrestrial runoff such asthe Duwamish River.
Figure 21.--Particle size distributions during the August survey.Solid line, surface; dashed line,S m above bottom; dotted line, middepth minimum. Spectra are fromstation 6 (top), station 7 (middle)and station 11 (bottom).
3.3.2 Particle size distribution
Figure 22.--Particle size distributions during the February survey.Solid line, surface; dashed line,S m above bottom; dotted line, middepth minimum. Spectra are fromstation 6 (top), station 7 (middle)and station 11 (bottom).
Particle size distributions from surface, bottom, and mid-depth of threestations on the axis of Elliott Bay (6, 7, and 11) are presented as representative of the bay as a whole (figs. 21 and 22). Station 6 samples from bothAugust and February were collected within an hour of low tide; SPM concentrations were ~O.8 mg/l during both surveys, but surface concentrations werehigher in August (1.8 mg/l) than in February (1.2 mg/l). Station 7 sampleswere collected at low tide in August and at high tide in February; both surface and bottom SPM concentrations were higher in August than in February.Station 11 samples were collected on a rising tide in August and at high tidein February; the bottom concentration in August was higher (1.6 mg/l) than inFebruary (1.2 mg/l).
Size distributions on a volume basis are similar for all August surfacesamples (fig. 21) for diameters less than -6 ~, showing a broad, nonpeaked
27
spectrum of miscellaneous particles (Kranck, 1980). The volume concentrationsin the <6-~ region decreases with increasing distance from the DuwamishRiver. In addition to this fine-grained region, significant volume concentrations occur in the 25-to 70-~ range only at station 6, closest to theDuwamish River.
Near-bottom spectra show an entirely different pattern. For station 6,the near-bottom spectrum has a similar shape but only about half the totalvolume of the surface sample. Distribution at the coarse end of the spectrumis similar to that at the surface. Near-bottom samples from stations 7 and 11show marked peaks and a substantial increase in volume concentration over thesurface samples. The mode at the fine end of the spectrum is slightly coarser(~4.5 ~ vs. 3.5 ~) at station 7 than at station 11. Both stations show ahigh percentage of total volume in the coarse-fraction part of the spectra.The mid-depth spectrum at station 11 (75 m) is almost identical to the surfacespectrum.
Samples from these same stations and depths during February were dramatically different (fig. 22). The fine-particle population spectra at stations7 and 11 in the surface were similar to, although of higher concentrationthan, the summer spectra. The increased outflow of the Duwamish during thewinter resulted in a very high particle volume concentration at diameters)10 ~ at station 6 even though the bulk concentration was lower than .inAugust. These large particles were still abundant at station 7 but hadsettled out of the surface water between station 7 and station 11.
This energy gradient is reversed in the bottom waters, where station 11shows very large volume concentrations at all particle sizes. In contrast tothe summer data, the fine-particle mode was coarser at station 11 (-4.5 ~)
than at station 7 (-4 ~). Large numbers of particles with diameters )50 ~
were also found in the near-bottom water at station 11. Note that thesesamples were collected on February 20 and that the maximum BNL concentrationsat station 11 were found on February 22 (fig. 18). Large particles are rareat station 6, which had less volume than during the summer. The particledistribution at mid-depth at station 11 changed very little between summer andwinter.
3.4 Transport of Suspended Particulate Matter
3.4.1 Current meter/transmissometer time series records
Outer Elliott Bay - mooring EB4
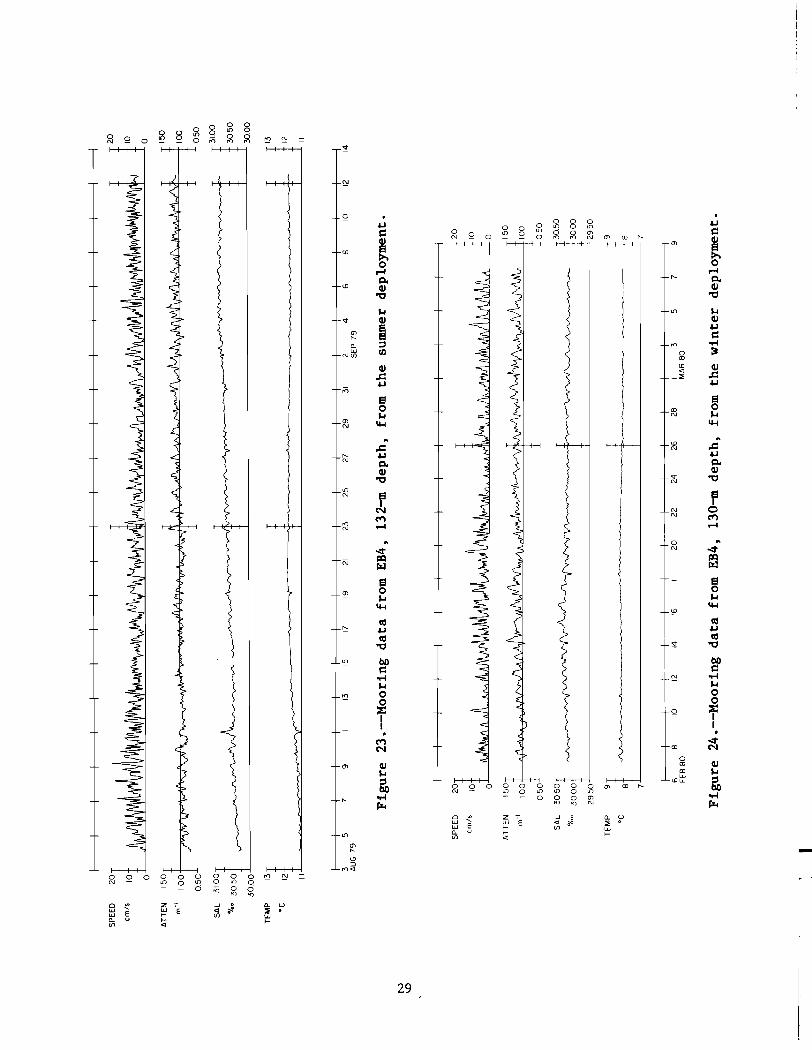
Edited data plots of current speed, temperature, attenuation, and salinity approximately 5 m above bottom at site EB4 were obtained for 38 days inAugust/September 1979 (fig. 23) and 29 days in February/March, 1980 (fig.24). Bottom conditions in the summer were warmer, saltier, and slightly lessturbid than in the winter (mean attenuation of 1.04 ± 0.028 in August/September vs. 1.16 ± 0.032 in February/March). Mean speed of the bottomcurrents was almost twice as high in the summer (5.37 cm/s vs. 2.89 cm/s). Asimilar difference was also found in the maximum speeds achieved during eachperiod (26.35 cm/s in August/September vs. 14.4 cm/s in February/March).
Progressive vector diagrams (35-h filter data) for each deployment periodare similar--dominant flow was to the north or northeast, suggesting bottom
ELL BAY 425BB 132 47 36N 122 24" 2.9 AX I S-356.ELL BAY 42SBB 132 47 36N 122 24" 2.9 SPH
OS> 39 DAYS STAATING 79216B2BB 2B DDF
OJ
OS>
oWoOa: .=:::JoVl
W...u.zos>Wa:W:I:
~OS>
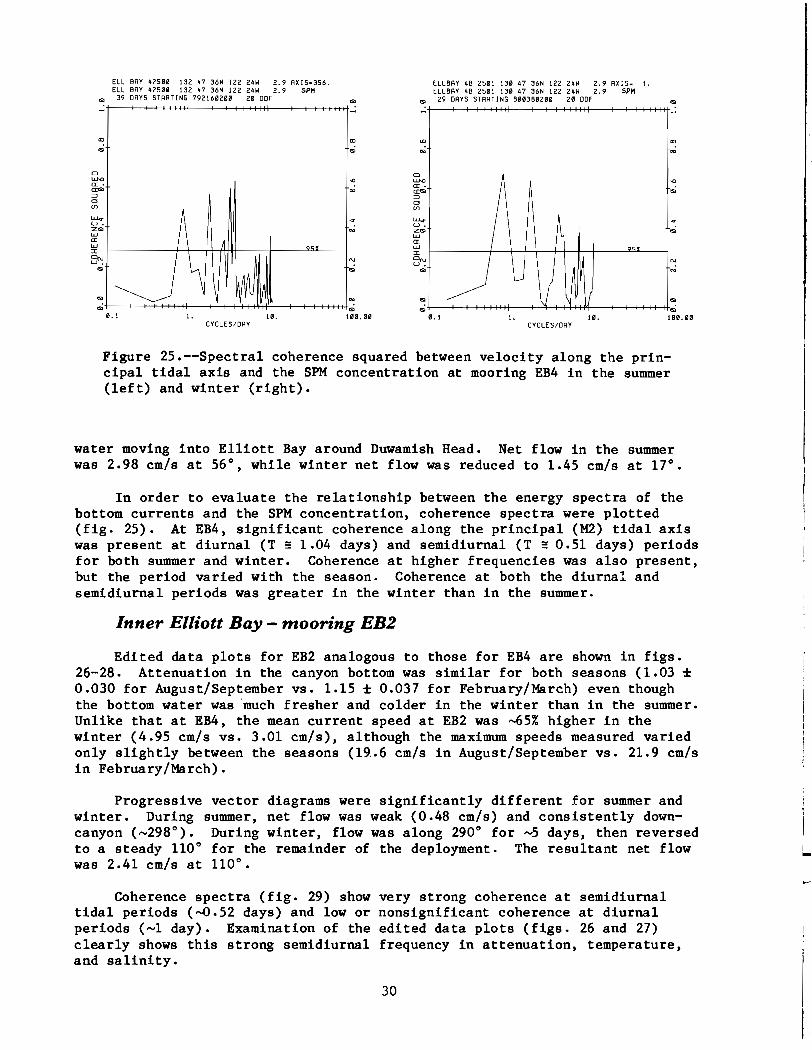
Figure 25.--Spectra1 coherence squared between velocity along the principal tidal axis and the SPM concentration at mooring EB4 in the summer(left) and winter (right).
water moving into Elliott Bay around Duwamish Head. Net flow in the summerwas 2.98 cm/s at 56°, while winter net flow was reduced to 1.45 cm/s at 17°.
In order to evaluate the relationship between the energy spectra of thebottom currents and the SPM concentration, coherence spectra were plotted(fig. 25). At EB4, significant coherence along the principal (M2) tidal axiswas present at diurnal (T = 1.04 days) and semidiurna1 (T =0.51 days) periodsfor both summer and winter. Coherence at higher frequencies was also present,but the period varied with the season. Coherence at both the diurnal andsemidiurna1 periods was greater in the winter than in the summer.
Inner Elliott Bay - mooring EB2
Edited data plots for EB2 analogous to those for EB4 are shown in figs.26-28. Attenuation in the canyon bottom was similar for both seasons (1.03 ±0.030 for August/September vs. 1.15 ± 0.037 for February/March) even thoughthe bottom water was much fresher and colder in the winter than in the summer.Unlike that at EB4, the mean current speed at EB2 was ~5% higher in thewinter (4.95 cm/s vs. 3.01 cm/s), although the maximum speeds measured variedonly slightly between the seasons (19.6 cm/s in August/September vs. 21.9 cm/sin February/March).
Progressive vector diagrams were significantly different for summer andwinter. During summer, net flow was weak (0.48 cm/s) and consistently downcanyon (~298°). During winter, flow was along 290° for ~5 days, then reversedto a steady 110° for the remainder of the deployment. The resultant net flowwas 2.41 cm/s at 110°.
I~
Coherence spectra (fig. 29) show very strong coherence at semidiurna1tidal periods (-0.52 days) and low or nonsignificant coherence at diurnalperiods (~1 day). Examination of the edited data plots (figs. 26 and 27)clearly shows this strong semidiurna1 frequency in attenuation, temperature,and salinity.
...+--+-+-+-+++++t---+-+-+--#+H+"---+-+-+-+++H1-,,,,0.1 I. 10. 100.00
Figure 29.--Spectral coherencesquared between velocity along theprincipal tidal axis and the SPMconcentration at mooring EB2 in thesummer at 92-m depth (a), in thewinter at 90-m depth (b), and in thewinter at 30-m depth (c).
I
l
CYCLES/DAY
32
The 30-m record at EB4 (fig. 28) was substantially different in allrespects from the near-bottom record. The attenuation values were low andvery stable (0.96 ± 0.018) on a tidal scale, showing a gradual decrease withtime. These characteristics can be considered typical of conditions in themid-depth minimum zone of Elliott Bay. Coherence spectra (fig. 29) showedonly weak coherence near semidiurnal and quarter-diurnal frequencies. Netflow was 1.63 cm/s at 347°.
3.4.2 Horizontal transport of SPM and salt in Elliott Bay
Magnitude and direction of net transport of suspended matter and saltwere calculated for each current meter/transmissometer deployment. Transportfluxes were obtained by vector addition of the mean and variable portions ofthe flow along two component axes:
Flux = [(u s) +! L u's,)2 + (v sn
where u, u' and V, v' = the mean and fluctuating components of the flow alongthe east-west and north-south axes, respectively, and sand s' = the mean andfluctuating components of the SPM or salt concentrations. Transport directionis given by
us+!Iu's'-1 n )e = tan --------;-1--- •
vs+-Iv's'n
SPM and salt were compared to see if the characteristics of transport forparticulate and dissolved phases in the water column were significantly different. A summary of the transport results is given in table 5.
Table 5.--Flux measurements of suspended particulate matter and salt
Depth SPM flux Salt flux Dir. Mean speedMooring (m) ( ~/cm2/s) (mg/cm 2/s) ( 0) (cm/s)
2A 92 0.35 11.60 347 3.01
2B 30 1.58 48.5 346 3.32
2B 90 2.85 71.5 113 4.95
4A 132 3.02 75.9 56 5.37
4B 130 1.61 43.8 17 2.89
33
At mooring EB4 in outer Elliott Bay the transport of both salt and SPMwas -45% larger in the summer than in the winter, the same as the increase inmean current speed between seasons. Transport of both salt and SPM was to thenortheast at EB4, suggesting that dissolved and particulate phases are beingtransported into Elliott Bay from the main basin at this depth. A corresponding net flow out of Elliott Bay was found at a mooring just north of station11 (Sillcox et al., 1981).
Mooring EB2, in the southern canyon of Elliott Bay, was more seasonallyvariable than EB4. During the summer deployment, transport was to the northwest, or downcanyon, at the bottom. In the winter, although mean speed increased by a factor of only ~1.7, net transport of both salt and SPM increasedby factors of 6.0 and 7.8, respectively. These transport increases correspondto the increase in net speed at this location from 0.48 cm/s downcanyon in thesummer to 2.41 cm/s upcanyon in the winter (Sillcox et al., 1981). Transportat 30 m at EB2 in the winter was out of Elliott Bay to the northeast at abouthalf the rate of the bottom flux. The full vertical profile of flux is, ofcourse, unknown. Nevertheless, the canyon bottom flow reversal from summer towinter does suggest an estuarine-type flow regime driven by increased outflowof the Duwamish River during the winter (5-10 times higher in February 1980than August 1979). Unfortunately, the lack of instrumentation above 30-mdepth prohibits an accurate assessment of near-surface flow since the riverplume is restricted to the upper 5-10 m.
3.4.3 Vertical transport of SPM in Elliott Bay
A summary of the vertical flux measurements made in Elliott Bay is givenin table 6. Each trap location had dual traps for replicate observations. AtEB4, measured flux at the bottom decreased by about 17% from the summer deployment to the winter. A similar decrease was seen in both the organic matter content (22% less) and in the >4~ fraction (19% less) of the trappedmaterial, suggesting that at least a portion of the decrease was a result oflowering of zooplankton activity (i.e., fewer fecal pellets from summer towinter). Mean size of the material increased slightly in the winter, althoughthe modal size was unchanged at 7~.
The trap at 30 m at EB4 during summer sampled considerably differentconditions than the bottom traps. Flux was only about 2% of that found nearthe bottom and the percentage of organic matter was about double. There wasalso a striking increase in the >4~ fraction, and, for an unknown reason, asubstantial difference in this fraction between the replicate traps. Thelarge difference between surface and bottom fluxes implies substantial nearbottom addition of material from either lateral advection or local resuspension, in agreement with observations of a persistent BNL in Elliott Bay, or alarge contribution of fecal material from zooplankton migrating below 30 mdepth.
Conditions at EB2 were generally similar to EB4 (table 6). Near-bottomflux in summer averaged 31.6 g/m2/day and decreased by 29% in the winter,identical to the decrease in organic matter concentration. Unlike EB4, however, the percentage of >4~ fraction increased in the winter, and the percentage of aggregates in this fraction dropped by more than 20%, implying thatmore large, discrete grains were entering the bottom trap in winter than insummer. This finding agrees with information from the bottom current meter/
34
I
rL
Table 6.-- Characteristics of the trapped material in Elliott Bay
Size DistributionFlux Organic matter Mean Modal >4<jl Aggregate in
transmissometer unit which showed more energetic flow during the winter. Themean size was almost a whole $-size coarser in the winter, also reflecting ahigher energy environment.
Flux at the 30-m level at EB2 in winter was an order of magnitude higherthan at EB4 in summer, presumably because of increased fallout from theDuwamish River plume. The percentage of large aggregates at EB2, however, wassignificantly less than at EB4, implying that much of this increased falloutwas not from "biological packing" (fecal matter), or that the fecal matter wasso loosely bound as to be unmeasurable.
Detailed examinations of the organic matter content of various sizeclasses showed similar results for all traps--an increase in percentage oforganic matter with decreasing particle size (fig. 30). The percentage oforganic matter associated with the 11$ material (0.25-0.5 ~) was ·twice thatassociated with the 4$ (31-62 ~) material collected in the summer. The trendfor the winter is similar, although the inc~ase was only about 20%. Theseresults coincide with the view that less than -62 ~ organic matter existslargely as surface coatings and is thus proportional to the surface area/massratio.
35
SUMMER WIN TER
20
I I 4>0.5fLm
-
84
• EB2 Top• EB2 BottomOEB4 Bottom
4 662 16
DIAMETER
O...l...---,---------r---,---------,--
10
30
84
616
462
• EB4 Top• EB2 Bottomo EB4 Bottom
IO~o '--...,------r------,--------,,-
II 4>0.5fLm
PARTICLE
u 20z~(!)a::o
Figure 30.--Scatter plots of particle size vs. percentage of organicmatter for sediment trap deployments.
4. DISCUSSION
4.1 Relationship Between SPM and Salinity inElliott Bay
Since the features of the salinity distribution in an estuarine systemare generally better known than that of the particulate matter. it is usefulto examine the interrelationships between these two phases. Their relationships can be described by the use of a sa1inity-vs.-concentration (attenuation) scatter plot analogous to the mixing diagrams used to trace the loss oraddition of dissolved constituents in an estuary (Liss. 1976).
4.1.1 Surface waters
Attenuation-salinity plots for the surface layer of Elliott Bay hadapproximately the same slope for both summer and winter data (fig. 31). Thissimilarity suggests that during both seasons the SPM distribution is controlled by the Duwamish River plume, either as a particle source or as aregulator of primary productivity. That summer SPM levels are increasedrelative to salinity suggests that the loss of SPM input from a lowering ofriver input in the summer is closely balanced by an increase resulting fromphytoplankton growth. Also. the character of the Duwamish River particulatesmay change in the summer to particles capable of a longer residence time inthe surface waters. •
I
i..Inclusion of the data from the Duwamish River itself (salinity. <20 ppt)
shows seasonal differences (fig. 32). In winter. the river data were on the
36
2.2
+2.0 + + +
+
'" 1.8-I0E 1;6
z0H 1.4I-eI::)z 1.2wl-I-eI: 1.0
.8
.620 21 22 23 24 25 26 27 28 29 30 31
SALINITY
Figure 31.--Scatter plots of salinity vs. attenuation for Elliott Baysamples in August (0) and February (+). Correlation coefficient (r)and standard error of estimate for August were -0.86 and 0.15, respectively. In February, these statistics improved to -0.95 and 0.12.
9
8 '*+7 +
'"-I S ++E ++
z 50 ++HI- 4eI::)Zw 3 0l-I- o 0eI:
~ 02 + + +#+ 0 0
++~oo
00 5 10 15 20 25 30
•SALINITY
Figure 32.--Scatter plots of salinity vs. attenuation for combinedElliott Bay and Duwamish River samples for August (0) and February(+). Note summer-vs.-winter difference in the river samples (salinityvalues <20 ppt).
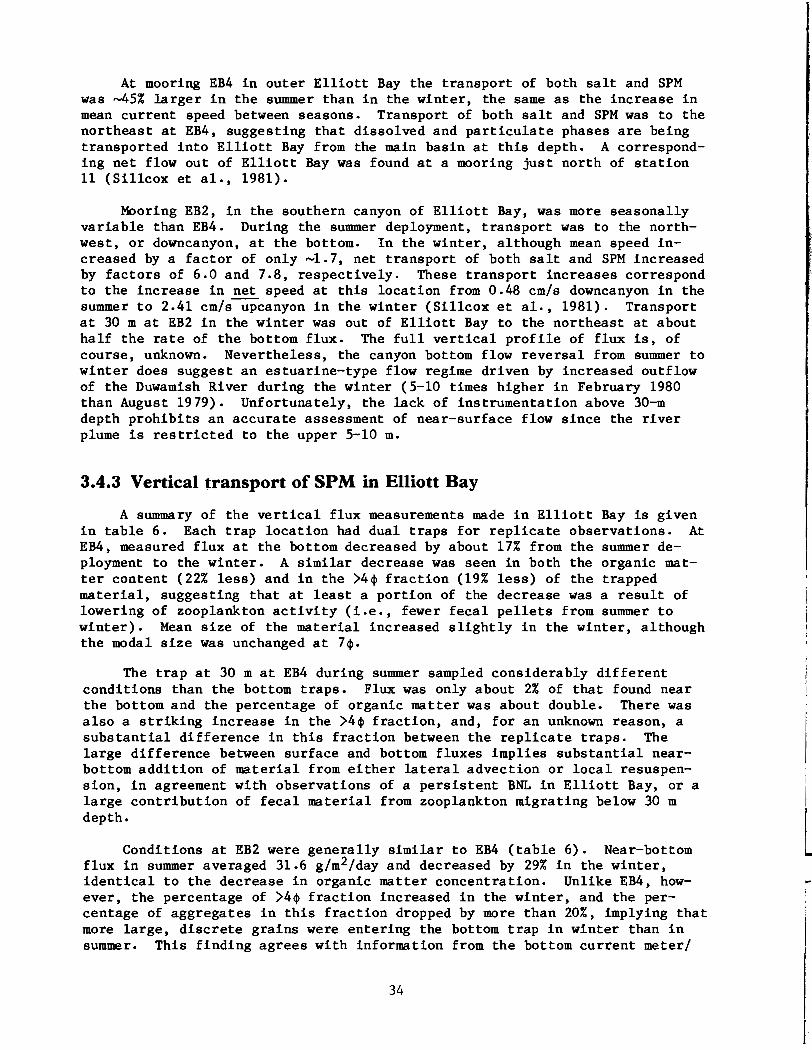
Figure 33.--Scatter plots of salinity vs. attenuation for bottom watersamples in August (0) and February (+). Note the similar slopes forboth seasons.
same regression line as the Elliott Bay data, indicating the dominance ofplume water in the Bay and conservative mixing of the SPM. In summer, theriver samples fell substantially below the Elliott Bay line, showing theexpected river situation of lower SPM concentration per unit volume of freshwater resulting from the lower energy of the river (low flow and lower hydraulic competency) and a lessened supply of SPM as a result of lower rainfall.
4.1.2 Bottom waters
SPM-salinity relationships within the BNL were the inverse of the surfacewater relationship (fig. 33). SPM-salinity bottom-water regression lines havecorrelation values lower than those for the surface water data. Both seasonsshowed the same direct relationship between SPM and salinity: the slope wasthe same for each season, and the mean attenuation was slightly higher inFebruary (1.17 m- 1) than in August (1.04 m- 1). All salinity values werehigher in August than in February, however, because the densest bottom wateris found in Puget Sound during the summer (Cannon et al., 1979).
These relationships strongly imply a source of SPM into Elliott Bay fromthe deep waters of the main basin of Puget Sound via the central submarinecanyon. Other concurrent studies by the author have identified a thick(>50 m) BNL in the main basin which could be contiguous with the BNL observedin ~he deepest portions of Elliott Bay. Future mooring work in Elliott Bayshould include instrumentation of the canyon mouth to examine SPM and watertransport from the main basin into Elliott Bay.
38
4.2 Characteristics of the Duwamish RiverPlume in Elliott Bay
The Duwamish River plume, as expressed in bothSPM and salinity, wasalways found on the north and east sides of Elliott Bay during the four surveys of this study (figs. 8 and 17). On the basis of dye studies with thePuget Sound hydraulic model, Winter (1977) postulated that for all combinations of tide and river flow, material entering Elliott Bay from the WestWaterway would be swept past Duwamish Head. Under spring tides and low riverflow (the August survey conditions) water from the East Waterway and theSeattle waterfront also moved clockwise around the bay's perimeter in themodel. Although our data are severely limited in time, none of the surveysfound evidence of SPM transport past Duwamish Head. Stations 7, 12, and 13had generally the lowest SPM surface concentrations in the Bay. NationalWeather Service data show that winds during the August survey (measured atSeaTac Airport) were from the north or northwest. Winds were from the southon February 20, and from the north on February 22, when the plume moved awayfrom the northern shore and into the center of the bay. During both daysmaximum concentrations were found in the east central portion of the bay.
Duwamish River flow and SPM concentration, along with the surface plumeconcentration, can be used to make some very rough estimates of the contribution of river SPM to the surface layer of inner (east of 1220 23'W) ElliottBay during the summer and winter. On the basis of the SPM loading data, themass of SPM in the upper 5 m of inner Elliott Bay in mid-August was - 573 x10 5 g. Subtracting the average mass of a 5-m layer in the SPM minimum zoneyields a net SPM excess in the upper 5 m of - 298 x 10 5 g resulting fromphytoplankton production and river input. Phytoplankton contribution to thistotal can be roughly estimated at - 84 x 10 5 g on the basis of a typicalsurface standing crop of 2 mg chlorophyll a/m 3 in August for Elliott Bay(Ebbesmeyer and Helseth, 1977), a factor olf 30 for the ratio of carbon tochlorophyll a (Strickland, 1960), and a factor of 2.3 for the ratio of dryplankton to carbon (Sverdrup et al., 1942).
Sampling in the Duwamish River about 2 km upstream of the mouth gave anSPM concentration value of -2.5 mg/l; the variability of this figure is unknown but is probably less than a factor of 2 (1.2-5 mg/l). Stream gages onthe Duwamish gave an average flow of 8.24 m3/s for the two weeks preceding thesampling, yielding an average SPM input of 20.6 g/s. At this rate~ it wouldtake approximately 12 days for the Duwamish to supply the 214 x 10 g ofestimated river-derived SPM in the upper 5 m of inner Elliott Bay. Otherrunoff sources were not considered in this analysis.
Similar calculations for the February conditions reveal a substantiallydifferent situation. Net SPM in the upper 5 m was actually lower (110 x10 5 g) because of lower concentrations outside the river plume and a higheraverage concentration in the SPM minimum zone. Standing crops of phytoplankton for March are typically <25% of the August value in Elliott Bay (Ebbesmeyer and Helseth, 1977) and February values are estimated to be similar.Phytoplankton contribution to surface SPM loadings is probably 20 x 10 5 g,leaving a net river contribution of - 90 x 10 5 g for inner Elliott Bay.
River concentrations of SPM at the same location in the summer were muchhigher (7.4 mg/l), and river flow for the 2 weeks preceding sampling was
39
44 m3/s, yielding an input rate of 325.4 g/s. At this rate, the river couldsupply the excess surface SPM in only 0.32 days, about 36 times quicker thanin the summer.
Conclusions from this kind of sketchy data are tenuous, but it seemsclear that the Duwamish River plume is the controlling factor of surface SPMdistributions during the winter months. In situ biological production, whichis 10 times higher in August than March in Elliott Bay (Ebbesmeyer, and Helseth, 1977), is much more influential during the summer. This conclusion issupported qualitatively by the areal plots (figs. 8 and 17) which show onlyminimal plume definition in August and a well-defined plume with steep arealgradients in February.
4.3 SPM Transport
Data from both moorings and station work suggest that there is significant exchange of SPM between the bottom waters of the Main Basin and ElliottBay. The highest BNL concentrations in the bottom water were found at themouth of the submarine canyon in Elliott Bay. SPM was added to the deepwaters of Elliott Bay during both seasons by the net northeastward flow recorded at EB4, although an absence of SPM measurements at the north end of thebay make it impossible to determine whether there was a net gain or loss ofSPM within Elliott Bay from this mechanism. The close association of SPM andsalt flux at all mooring locations, however, strongly suggests SPM transportout of Elliott Bay at the northwest mooring site.
Transport in the inner bay varied dramatically between seasons. Insummer, net transport at EB2 was downcanyon so addition of particulate material from the lower to the upper levels of the bay was probably minimal at thistime. In winter, however, the pronounced upcanyon SPM transport suggests anactive recycling of deep SPM, perhaps supplied from the Main Basin, to theupper levels of Elliott Bay via the axial submarine canyon. This transportmay be a partial explanation of the increased SPM concentrations in the middepth minimum zone during the winter.
An important question bearing on the cycling of SPM within Elliott Bay isthe balance between advective input and local resuspension as a source ofparticulate matter for the BNL. Although more sophisticated instrumentationwould be required to answer this question conclusively, the available dataseriously undermine support for local resuspension as a dominant contributorto the BNL.
The time series plots (figs. 23, 24, 25, and 27) indicate that salinityand attenuation variations are positively correlated in the bottom waters. Onthe other hand, little or no coherence can be seen between speed and attenuation variations in any of the records. Increases in salinity are nearlyalways associated with increases in attenuation, the same correspondence asthat found in the CTD records (fig. 33). A section of the EB2 winter mooringrecord has been expanded to illustrate the coherence of the salinity andattenuation profiles (fig. 34). The record extends from February 9 throughFebruary 16 and encompasses the point in the record where the subtidal flow(35-h filter) changed from steady downcanyon (~298°) to steady upcanyon(~1100) on February 12. During the downcanyon flow, salinity values showed
40
29.80j29.60
--' 0-0: 0
(f) ii' 29.40
zWf-_f-'-0:::;:
OlO" w00
'AOj1.20
1.00
I I7 8FEB 80
9 10 11 12 13 14 15 16 17
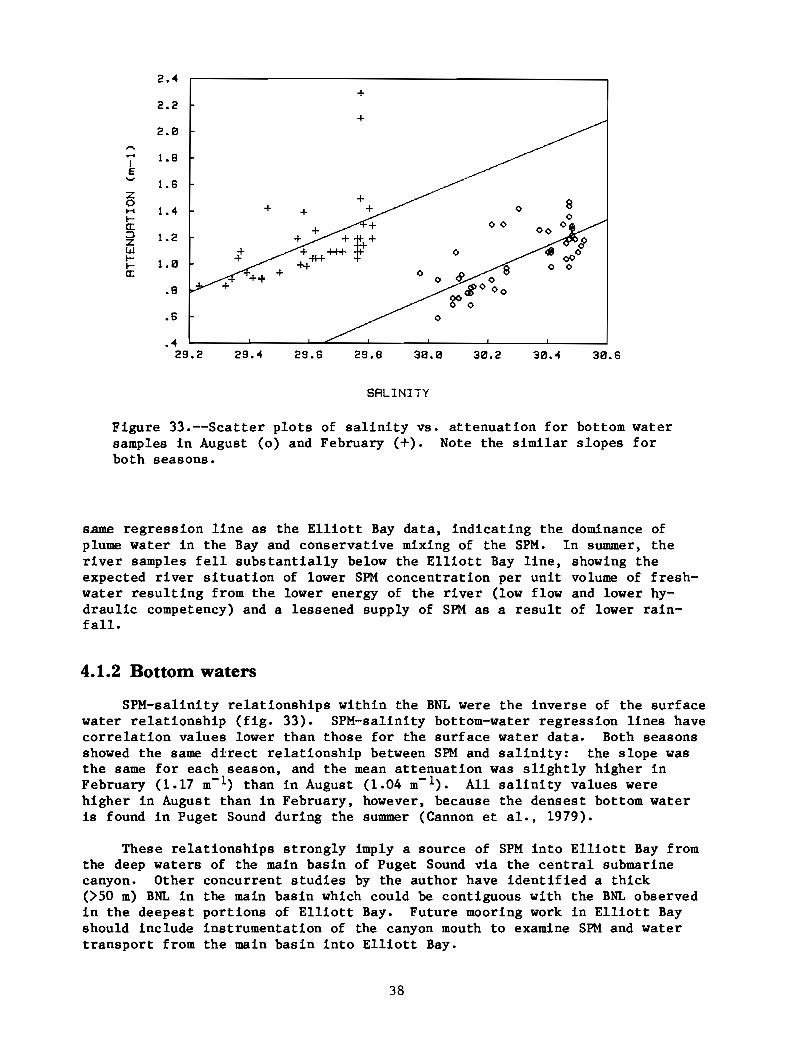
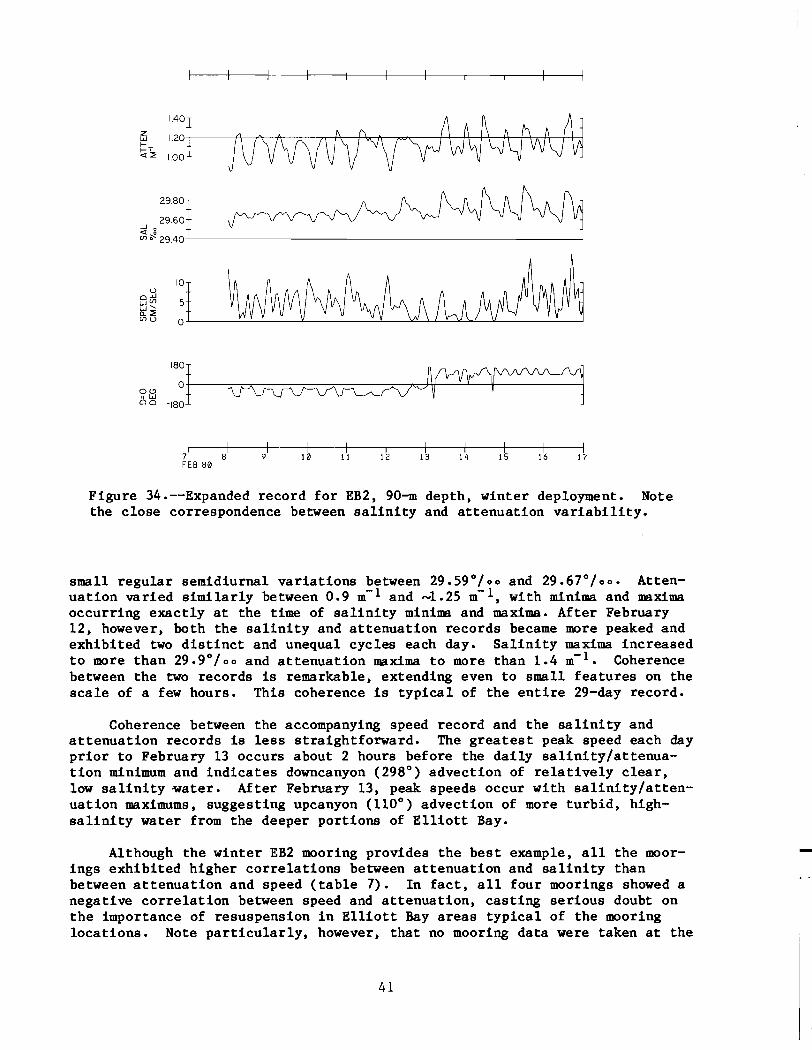
Figure 34.--Expanded record for EB2 t 90-m depth t winter deployment. Notethe close correspondence between salinity and attenuation variability.
small regular semidiurnal variations between 29.59%0 and 29.67%0. Attenuation varied similarly between 0.9 m- 1 and ....1.25 m- 1 t with minima and maximaoccurring exactly at the time of salinity minima and maxima. After February12 t however t both the salinity and attenuation records became more peaked andexhibited two distinct and unequal cycles each day. Salinity maxima increasedto more than 29.9%0 and attenuation maxima to more than 1.4 m- 1 • Coherencebetween the two records is remarkable t extending even to small features on thescale of a few hours. This coherence is typical of the entire 29-day record.
Coherence between the accompanying speed record and the salinity andattenuation records is less straightforward. The greatest peak speed each dayprior to February 13 occurs about 2 hours before the daily salinity/attenuation minimum and indicates downcanyon (298°) advection of relatively clear tlow salinity water. After February 13 t peak speeds occur with salinity/attenuation maximums t suggesting upcanyon (110°) advection of more turbid t highsalinity water from the deeper portions of Elliott Bay.
Although the winter EB2 mooring provides the best example t all the moorings exhibited higher correlations between attenuation and salinity thanbetween attenuation and speed (table 7). In fact t all four moorings showed anegative correlation between speed and attenuationt casting serious doubt onthe importance of resuspension in Elliott Bay areas typical of the mooringlocations. Note particularlYt however t that no mooring data were taken at the
41
Table 7.--Comparison of salinity-vs.-attenuation andspeed-vs.-attenuation correlation coefficients
Coefficient of Coefficient ofMooring/Season salinity vs. attenuation speed vs. attenuation
(r) (r)
EB2, 92-m depth/summer 0.638 -0.073
EB2, 90-m depth/summer 0.633 -0.122
EB4, 132-m depth/summer 0.687 -0.115
EB2, 130-m depth/winter 0.217 -0.131
mouth of the Elliott Bay Canyon (approximately station 11) where both the mostturbid and most variable bottom water were found.
The lack of significant positive correlation between current speed andturbidity is not surprising when the range of observed speeds is considered.Speeds greater than 23.5 cm/s were never recorded at either EB2 or EB4, andtypical daily peak speeds were generally ~15 cm/s (figs. 23, 24, 25, and27). Lonsdale and Southard (1974), for example, found that even for Pacificred-clay material with a water content of 84% and the bed roughened withmanganese nodules, a speed of ~12 cm/s, 1 m above the bed, was required toinitiate erosion. All measurements in Elliott Bay were )10 m above the bed,implying that observed current speeds at the mooring sites were only rarelycapable of significant erosion.
Vertical flux rates measured by near-bottom sediment traps averaged31 g/m2/day. Assuming an average sediment density of 0.6 g/cm 3, this massflux translates to ~18.8 mm/yr deposition rate, similar to the values of 10.3and 8.1 mm/yr calculated by Schell et al. (1977) from 210pb measurements ontwo cores from outer Elliott Bay. If these samples are typical of the yearlycycle, it implies that only minimal recycling of the bottom sediment takesplace through resuspension, since repeated resuspension would result in theapparent sedimentation rate observed by the sediment traps being several timesgreater than the net accumulation rate measured in the bottom sediments. Thusthe BNL must be a reasonably persistant feature throughout Elliott Bay, andvariations must stem more from lateral water movements than from local resuspension. These conclusions are in agreement with the long-term picture fromthe moored transmissometers, which almost never showed variations of more thana factor of 2 in near-bottom attenuation values.
Flux rates at 30 m were only 2% to 21% of those observed at depth. Thesefigures indicate that the majority of the vertical flux originated below 30 m,particularly in the outer bay in the summer. Typical Elliott Bay Augustproductivity is ~1 g C/m2/day (Ebbesmeyer and Helseth, 1977), which amounts to~2.3 g dry weight/m2/day. The August 30 flux at EB4 was -D.7 g/m2/day and isapparently a good estimate of the amount of material that escapes the surface
42
layer in the outer bay during summer. Most of the bottom sedimentationoccurring at EB2 and EB4, and by extension in most of Elliott Bay, must thusbe a result of steady fallout from within the BNL. The BNL may have manysediment sources, but this study suggests that a dominant one is the deepwater of the Main Basin, where bottom resuspension is active (Baker, 1982).
5. ACKNOWLEDGMENTS
This study was funded primarily by the MESA Puget Sound Project. TheNOAA/OMPA Section 202 Research Program provided supplemental funds. DavidTennant, Sharon Walker, Susan Hennig, and Thomas Jackson provided field andlaboratory assistance; their support is gratefully acknowledged.
6. REFERENCES
Baker, E. T., 1982. Temporal variability in the magnitudinal composition ofvertically settling particles in a marine fjord. EOS (in press).
Bartz, R., J. R. V. Zaneveld, and H. Pak, 1978. A transmissometer for profiling and moored observations in water. SPIE Ocean Optics, 160:102-108.
Biscaye, P. E., 1965. Mineralogy and sedimentation of recent deep-sea clay inthe Atlantic Ocean and adjacent seas and oceans. Geol. Soc. Am. _Bull.76:803-832.
Cannon, G., N. P. Laird, and T. L. Keefer, 1979. Puget Sound circulation:Final report for FY77-78. NOAA Tech. Memo. ERL MESA-40, NOAA Environmental Research Laboratories, Boulder, Colo., 55 pp.
Ebbesmeyer, C. C., and J. M. Helseth, 1977. An analysis of primary productionobserved during 1966-1975 in central Puget Sound, Washington. FinalReport to the Municipality of Metropolitan Seattle, 68 pp.
Kranck, K., 1980. Variability of particulate matter in a small coastal inlet.Can . ..:!....:.- Fish. Aquat. ScL 37: 1209-1215.
Krumbein, W. C., and F. J. Pettijohn, 1938. Manual of Sedimentary Petrography. Appleton Century Co., New York.
Larrance, J. D., A. J. Chester, and H. B. Milburn, 1979. A new sediment trapand particulate flux measurements in lower Cook Inlet, Alaska. Mar. Sci.Com. 5: 269-282.
Liss, P. S., 1976. Conservative and non-conservative behavior of dissolvedconstituents during estuarine mixing. In Estuarine Chemistry, J. D.Burton and P. S. Liss (eds.), Academic Press, London, 93-130.
Lonsdale, P., and J. B. Southard, 1974. Experimental erosion of North Pacificred clay. Mar. Geol. 17:M51-M60.
43
Schell, W. R., A. Nevissi, D. Piper, G. Christian, J. Murray, D. Spyradakis,S. Olsen, D. Huntamer, E. Knudsen, and D. Zafiropoulos, 1977. Heavymetals near the West Point outfall and in the central basin of PugetSound. Final Report for the Municipality of Metropolitan Seattle,93 pp.
Sillcox, R. L., W. R., Geyer, and G. A. Cannon, 1981. Physical transportprocesses and circulation in Elliott Bay. NOAA Tech. Memo. OMPA-8, NOAAEnvironmental Research Laboratories, Boulder, Colo., 45 pp.
Strickland, J. D. H., 1960. Measuring the production of marine phytoplankton. Fish. Res. Bd. Canada Bull. 122:172.
Sverdrup, H. U., M. W. Johnson, and R. W. Fleming, 1942. The Oceans, TheirPhysics, Chemistry, and General Biology. Prentice-Hall. New York.1087 pp.
Tyler. J. E•• R. W. Austin. and T. J. Petzold. 1974. Beam transmissometersfor oceanographic measurements. In Suspended Solids in Water. R. J.Gibbs (ed.). Plenum, New York. 51-60.
Wadell. H., 1934. Some new sedimentation formulas. Physics 5:281-291.
Winter. D. F., 1977. Studies of circulation and primary production in deepinlet environments. EPA-600!3-77-049.
44* u.s GOVERNMENT PRINTING OFFICE' '982-0-576-001/1229