68


Sustainability Action Plan
Greensboro, North Carolina
2
November 2010
Dear Council Members,
On behalf of the entire Community Sustainability Council (CSC), we are pleased to present to you the City of Greensboro’s first ever Sustainability Action Plan.
The practice of sustainability seeks to balance the environmental, economic and human needs of our current generation with the need to proactively safeguard our community’s environmental and economic future. This Action Plan recommends a number of policies and strategies the City can adopt to do so.
The Action Plan is the culmination of a two-year process of collecting public input, working with City staff and developing CSC recommendations around a number of key topic areas. It includes several recommended policies and strategies the City and community can support to reduce greenhouse gas (GHG) emissions, improve energy efficiency, provide for economic development opportunities, promote an improved quality of life and save taxpayer money. Among the many anticipated co-benefits of these policies and strategies are reduced energy and fuel costs, more green jobs, improved air quality, improved public health and greater educational opportunities.
This Action Plan has been developed in the context of difficult economic times, significant City budgetary constraints and unpredictable future energy costs. This plan is only a beginning, starting with measures that have little or no cost to implement, yet provide significant benefits to the City and community in terms of increased energy and resource efficiency. In addition to the significant federal Energy Efficiency and Conservation Block Grant (EECBG) funds the City recently received, having a completed Action Plan also positions the City well to pursue similar future funding opportunities.
Essential to our overall recommended strategies is the establishment of a Cash Flow Sustainability Account, which would divert 50 percent of operating cost savings from City energy efficiency and conservation projects to fund additional such projects, with the remaining 50 percent allocated to the City’s general budget. Such an account will provide funding for the next round of measures that may require more upfront money, but will be crucial to making meaningful reductions in GHG emissions and safeguarding our economy.
We believe the time to act is now. While the strategies in the Action Plan only begin to stabilize the City’s GHG emissions, they provide critical momentum to move the City in the right direction and become more energy and resource efficient while saving money. And, with additional support for outreach and education efforts, it sets the stage for the City’s long-term progress and benefits, both environmentally and economically.
We thank you for your consideration and look forward to discussing the Action Plan’s many benefits with you in more detail.
Sincerely,
Joel Landau, CSC Co-Chair Bob Powell, CSC Co-Chair

Sustainability Action Plan
Greensboro, North Carolina
3
Acknowledgements
Community Sustainability Council and Advisors
Bob Powell, Co-Chair
Joel Landau, Co-Chair
Art Davis, District 1
Bob Skenes, District 1
Derrick Giles, District 2
Debbie Leiner, District 2
Eric Hoekstra, District 3
Carolyn Allen, District 3
Tom Clary, District 4
Valerie Vickers, District 4
Tom Duckwall, District 5
Bob Kollar, District 5
Marlene Sanford, Triad Real Estate and Building
Industry Coalition
Terri Hancock, Greensboro Chamber of Commerce
Davis Montgomery, Duke Energy
Phillip Morgan, Piedmont Natural Gas
City Council
Mayor William H. Knight
Mayor Pro Tem Nancy Vaughan, At Large
Robbie Perkins, At Large
Danny Thompson, At Large
T. Dianne Bellamy-Small, District 1
Jim Kee, District 2
Zack Matheny, District 3
Mary C. Rakestraw, District 4
Trudy Wade, District 5
City of Greensboro
Dan Curry, Manager of Community Sustainability, Executive Department
Sue Schwartz, Acting Director, Housing and Community Development
Steve Randall, Energy and Sustainability Manager, Engineering and Inspections
Jeryl Covington, Director, Department of Environmental Services
Russ Clegg, Housing and Community Development
Josh Mullins, Housing and Community Development
Additional Thanks
Yvonne Johnson, Former Mayor of Greensboro
Steve McCollum, Environmental Stewardship
Greensboro
Keith Holliday, Former Mayor of Greensboro
Kim Yarbray
Jared Weston
Consultant Team
Brendle Group, Inc.
Clarion Associates
Thanks to the many other individuals who contributed to this process through input to the CSC sub-
committees or participation in public meetings.
Sustainability Action Plan
Greensboro, North Carolina
4
Table of Contents
Acknowledgements............................................................................................................................3
Executive Summary ............................................................................................................................5
1.0 Introduction ...........................................................................................................................7
2.0 History of Resource Efficiency and Sustainability ................................................................... 10
3.0 Greenhouse Gas Inventory and Projections ........................................................................... 12
4.0 Sustainability Action Plan Development Process .................................................................... 14
5.0 Sustainability Action Plan Policies and Strategies ................................................................... 18
6.0 Plan Implementation ............................................................................................................ 48
Glossary of Terms and Acronyms ...................................................................................................... 51
APPENDIX A: GREENHOUSE GAS INVENTORY METHODOLOGY .......................................................... 54
APPENDIX B: FULL TEXT OF COMMUNITY SUSTAINABILITY COUNCIL REPORTS (VIRTUAL APPENDIX) .. 61
APPENDIX C: DEVELOPMENT OF COST ESTIMATES FOR POLICIES ....................................................... 62
Note: The Glossary of Terms and Acronyms in the back of the document will provide the reader with
helpful explanations and definitions of many of the terms and acronyms used throughout the Plan.
Sustainability Action Plan
Greensboro, North Carolina
5
Executive Summary
A Sustainability Action Plan (Action Plan) has been developed to document Greensboro’s progress
toward sustainability and advise City Council on actions the City can take to effectively manage energy,
resource use and waste production internally and promote these and other actions throughout the
community. Its goals are to reduce greenhouse gas (GHG) emissions, improve energy efficiency, provide
for economic development opportunities, promote an improved quality of life and save taxpayer
money. Among the many anticipated co-benefits are reduced energy and fuel costs, more green jobs,
improved air quality, improved public health and greater educational opportunities.
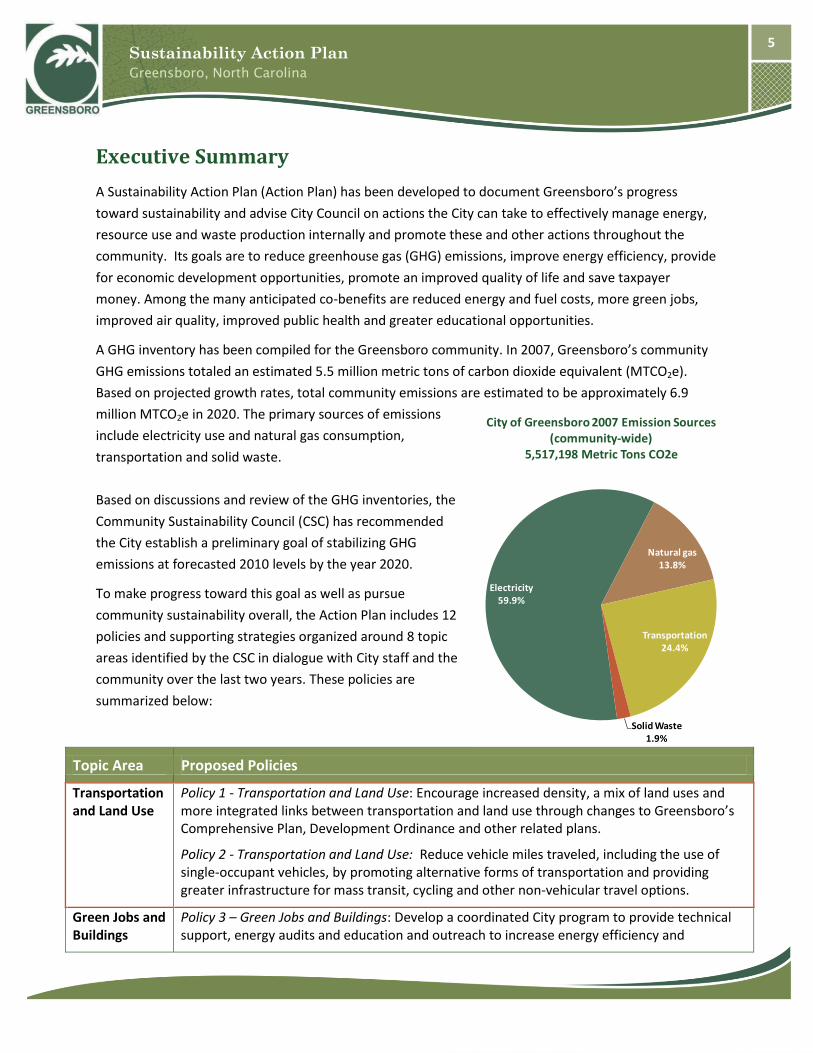
A GHG inventory has been compiled for the Greensboro community. In 2007, Greensboro’s community
GHG emissions totaled an estimated 5.5 million metric tons of carbon dioxide equivalent (MTCO2e).
Based on projected growth rates, total community emissions are estimated to be approximately 6.9
million MTCO2e in 2020. The primary sources of emissions
include electricity use and natural gas consumption,
transportation and solid waste.
Based on discussions and review of the GHG inventories, the
Community Sustainability Council (CSC) has recommended
the City establish a preliminary goal of stabilizing GHG
emissions at forecasted 2010 levels by the year 2020.
To make progress toward this goal as well as pursue
community sustainability overall, the Action Plan includes 12
policies and supporting strategies organized around 8 topic
areas identified by the CSC in dialogue with City staff and the
community over the last two years. These policies are
summarized below:
Topic Area Proposed Policies
Transportation and Land Use
Policy 1 - Transportation and Land Use: Encourage increased density, a mix of land uses and more integrated links between transportation and land use through changes to Greensboro’s Comprehensive Plan, Development Ordinance and other related plans.
Policy 2 - Transportation and Land Use: Reduce vehicle miles traveled, including the use of single-occupant vehicles, by promoting alternative forms of transportation and providing greater infrastructure for mass transit, cycling and other non-vehicular travel options.
Green Jobs and Buildings
Policy 3 – Green Jobs and Buildings: Develop a coordinated City program to provide technical support, energy audits and education and outreach to increase energy efficiency and
Electricity59.9%
Natural gas13.8%
Transportation24.4%
Solid Waste1.9%
City of Greensboro 2007 Emission Sources(community-wide)
5,517,198 Metric Tons CO2e

Sustainability Action Plan
Greensboro, North Carolina
6
Topic Area Proposed Policies
conservation in commercial and residential buildings.
Policy 4 – Green Jobs and Buildings: Use a combination of code changes, incentives, partnerships and education to promote green building in Greensboro.
Policy 5 – Green Jobs and Buildings: Work with community partners to encourage green job creation, training and placement.
Policy 6 – Green Jobs and Buildings: Promote more efficient use of water through education, partnerships and pilot projects.
Waste Reduction and Recycling
Policy 7- Waste Reduction and Recycling: Employ a combination of expanded recycling infrastructure, regulations and incentives to reduce waste generation and increase Greensboro’s solid waste diversion and recycling rates.
City Operations
Policy 8 – City Operations: Develop standards, infrastructure, practices and projects to make City operations more energy, resource and cost efficient.
Nature in the City
Policy 9 - Nature in the City: Establish and enhance green corridors, parks and other City spaces for community gardens, green technologies, recreation, habitat and other community benefits.
Education and Outreach
Policy 10 – Education and Outreach: Support development of community leadership and volunteer programs to further community energy and sustainability efforts.
Policy 11 – Education and Outreach: Provide technical support, awards and recognition to individuals and organizations furthering Greensboro’s energy and sustainability efforts.
Green Technologies
As the Action Plan is implemented and updated in the future, it is recommended that the City continue to explore local green technologies and resources such as biofuels/landfill gas, active solar hot water, solar photovoltaics (PV), industrial scale waste heat recovery and smart grid.
Adaptation Policy 12 – Adaptation: The City should develop a framework for adapting to a changing climate and integrating adaptation into its plans, ordinances and programs.
Collectively, these policies, along with strategies already funded as part of the City’s recently completed
Energy Efficiency and Conservation Strategy (EECS), are anticipated to reduce GHG emissions by 276,000
MTCO2e annually in 2020 and result in a cumulative cost savings to the City and community of
approximately $29 million between 2010 and 2020. The estimated cumulative minimum cost to
implement all polices and strategies is approximately $9.3 million in addition to funding already secured
under the Department of Energy’s Energy Efficiency and Conservation Block Grant Program.
This Action Plan is considered the first version of what will be a “living document,” subject to further
review and revision as strategies are implemented, progress is monitored, new strategies developed and
goals revisited.

Sustainability Action Plan
Chapter 1
7
1.0 Introduction
The City of Greensboro finds itself in a time of rapid change – and challenge – not only in the capacity of
the City’s own resources, but also in the changing world around it. Recent economic challenges have
pushed the City and the community to seek ways to be more resourceful, while rising energy prices and
a changing climate paint an uncertain future.
Yet in these challenges and uncertainties lie great opportunities for Greensboro. They can prompt the
City and community to become more energy and resource efficient and cut operating costs while doing
so. The City can seek new ways to partner and collaborate with the community to educate and engage
residents in energy, water and resource saving opportunities. Greensboro can explore new ways to
configure land uses and transportation systems that give its citizens more choices and opportunities,
and make community buildings and transportation systems more efficient. Finally, the City and
community can look for ways to train the next generation work force to benefit from the emerging new
energy economy, providing jobs for Greensboro residents and new opportunities for local business. All
of these strategies can not only help reduce the impact of a changing climate on Greensboro or the
impact of possible changes in energy supply and costs, they provide many co-benefits to the community,
from cost savings to creating healthier and more livable neighborhoods.
The purpose of this Sustainability Action Plan (Action Plan) is to advise City Council on actions the City
can take to effectively manage energy, resource use and waste production internally and promote these
and other actions throughout the community. Its goals are to reduce greenhouse gas (GHG) emissions,
improve energy efficiency, provide for economic development opportunities, promote an improved
quality of life and save taxpayer money.
The recommended policies and strategies in this Action Plan intersect with many other City planning
efforts, such as the Comprehensive Plan, the Housing and Community Development Consolidated Plan,
the Transportation Improvements Plan and the Land Development Ordinance. To the extent feasible,
the City should seek out opportunities to coordinate and create synergies between implementation of
this Action Plan and these other planning efforts.
The policies and strategies identified in Section 5.0 of this Action Plan have been developed around
several topic areas identified by the Community Sustainability Council (CSC) in dialogue with City staff
and the community over the last two years. The topic areas addressed by the Plan include the following:
Land Use and Transportation
Green Jobs and Buildings
Recycling and Waste Reduction
City Operations
Nature in the City
Education and Outreach
Green Technologies
Adaptation

Sustainability Action Plan
Chapter 1
8
1.1 The Case for Reducing GHG Emissions
Many local governments, institutions, regional organizations and companies have embarked on efforts
to reduce their GHG emissions associated with energy use, transportation, solid waste and other topic
areas. While a driving force for many of these efforts has been to reduce contributions of GHGs to the
atmosphere, there are many other benefits to Greensboro from reducing its GHG emissions. Several
studies demonstrate that the implementation of GHG reduction strategies, such as improving building
energy efficiency and public transit, have a positive impact on local and regional economies. Many of the
policies and strategies contained in this Action Plan focus on reducing Greensboro’s dependence on
non-renewable fossil fuels and the amount of waste produced by the community, as well as reaping the
benefits of a rapidly growing clean energy and green technology economy that can bring more jobs to
the community. If implemented, these strategies will not only reduce Greensboro’s GHG emissions, but
over time they will enhance its economic vitality, as well as its viability as a sustainable, livable city.
A recent study by Appalachian State University reinforces the
benefits that GHG reductions can have for North Carolina’s
economy. On the whole, the study showed the
implementation of bundles of GHG emission reduction
strategies identified by the North Carolina Climate Action Plan
Advisory Group (CAPAG) would result in a mildly positive
economic impact on North Carolina’s economy. By 2020, the
options analyzed would result in the creation of more than
15,000 jobs, $565 million in employee and proprietor income
and $302 million in gross state product. For the study period,
2007 to 2020, the options analyzed would generate more than
$2.2 billion net present value (NPV) in net additional employee
and proprietor income, and more than $1.2 million NPV in net gross state product. In short, the CAPAG’s
recommendations document the opportunities for the state to reduce its GHG emissions while
continuing its strong economic growth by being more energy efficient; using more renewable energy
sources; and increasing the use of cleaner transportation modes, technologies and fuelsi.
Across the country, more and more local governments are committing to reduce GHG emissions and
developing plans to achieve their goals - as of March 2010, over 1,000 cities across the country had
signed the U.S. Conference of Mayors Climate Protection Agreement, making a pledge to reduce their
GHG emissions. Along with reducing emissions and costs in their own operations, these cities are
leading by example, helping to engage businesses, residents and organizations in their communities to
realize the benefits of reducing their own emissions.
Clearing Greensboro’s Air
Poor air quality has been and
continues to be a significant public
health problem for Greensboro
and the Triad. Many actions
Greensboro can take to reduce
GHG emissions will also improve
air quality, benefitting the entire
community.

Sustainability Action Plan
Chapter 1
9
Some GHG Reduction Co-Benefits
Support local businesses and stimulate economic development
Reduce government, home and business energy and operational costs
Reduce dependence on foreign fuel sources
Reduce vulnerability to energy price increases and supply volatility
Diversify energy supply and reduce loads on transmission system
Reduce air pollution emissions, including ozone precursors and fine particles
Improve public health through increased exercise and nutritious foods
Reduce waste and increase landfill diversion rates
Reduce vehicle miles traveled and traffic congestion
Reduce water consumption in the community and impacts on water bodies and riparian habitats
Provide opportunities for regional, state and national leadership and recognition
Improve quality of life through preservation of urban forest, reduced commuting times and increased access to nature and open space
Improve educational opportunities
Sustainability Action Plan
Chapter 2
10
2.0 History of Resource Efficiency and Sustainability
2.1 Community Sustainability Council
Within the Greensboro community there have been many efforts and projects taking place over the
years to address the City’s progress on energy and resource efficiency, GHG emissions reductions and
sustainability. However, prior to 2008 there had not been an organizing body to pull these sustainability
efforts together and effectively guide public policy. Greensboro’s CSC was created by the City Council in
April 2008 to fill such a role. The CSC has provided a venue to comprehensively evaluate and discuss the
City’s progress toward sustainability and has played the primary role in developing the policies and
strategies in this Action Plan.
2.2 U.S. Conference of Mayors Climate Protection Agreement
In August 2007 the Greensboro City Council pledged to reduce GHG emissions when it voted to support
the U.S. Conference of Mayors Climate Protection Agreement through actions ranging from anti-sprawl
land-use policies to urban forest restoration projects to public information campaignsii. Specifically, the
resolution passed by the City Council expressed:
“That the City of Greensboro will support the U.S. Mayors Climate Protection Agreement as endorsed by
the 73rd Annual U.S. Conference of Mayors.”
Mayor Holliday signed the U.S. Mayors Climate Protection Agreement as endorsed by the 73rd Annual
U.S. Conference of Mayors.
2.3 Greensboro’s Progress Prior to the 2007 Greenhouse Gas
Inventory
Inventories of GHG emissions associated with
both City operations and the community have
been completed to establish a “baseline” year of
2007 from which to measure progress. The City
and community, however, made progress on
projects prior to 2007 that have already
contributed to reducing GHG emissions associated
with City operations and the community. For
example, the City purchased its first hybrid vehicle
for its fleet in 2003 and has adopted a policy to
purchase the smallest, most fuel efficient vehicle
practical for the job to be performed. A number
of improvements have also been made to City
What are Greenhouse Gases?
A greenhouse gas (GHG) is any gas that absorbs
radiation in the atmosphere, contributing to
climate change. Greenhouse gases include
carbon dioxide, methane, nitrous oxide,
perfluorocarbons, hydrofluorocarbons and
sulfur hexafluoride. Carbon dioxide equivalent
(CO2e) is a unit that represents the global
warming impacts of all these gases. For
example, 1 metric ton of methane (CH4) has a
global warming potential of 21 and is therefore
equivalent to 21 metric tons CO2e (MTCO2e).

Sustainability Action Plan
Chapter 2
11
buildings to make them more energy and resource efficient. These and other actions cumulatively
contributed to GHG emissions reductions that are already reflected in the 2007 inventories.
Progress was also made on a community level in Greensboro prior to 2007. For example, the University
of North Carolina at Greensboro first completed its Strategic Energy Plan in 2003, identifying strategies
and actions to make the campus more energy efficient. Guilford College has installed the largest array
of solar thermal panels of its kind on any college campus in the nation to provide hot water to its
residence halls, dining hall and other buildings. Greensboro is also home to the Proximity Hotel, the
nation’s first hotel certified as “Platinum,” the highest level of certification under the U.S. Green Building
Council’s Leadership in Energy and Environmental Design (LEED) program, and Bull Ridge, the first
commercial spec warehouse in the country to achieve LEED certification. The community’s traffic lights
have been converted to low-energy light-emitting diodes (LEDs) and a user-friendly recycling program is
in place.
In December 2009, the City completed and submitted to the U.S. Department of Energy an Energy
Efficiency and Conservation Strategy (EECS) to serve as a road map for spending approximately $2.55
million in federal Energy Efficiency and Conservation Block Grant (EECBG) funds allocated to the City.
The EECS, developed with input from the CSC, the community and City staff, identifies nine distinct
strategies for promoting energy efficiency and conservation in City operations and the community,
including the following projects:
Improving City Facility, Multi-family and Construction Waste Recycling
Energy Efficiency Retrofits and Building Automation System Improvements for City Buildings
A Hydroelectric Turbine at the City’s Water Treatment Plant
Solar LED Street Lights for Phase 1A of the Downtown Greenway
Green Jobs Development Infrastructure
An Energy Outreach and Education Program
A Residential Energy Audit, Implementation Support and Retrofit Demonstration Program
A Revolving Loan Fund Program
Comprehensive Plan Sustainability Recommendations
Collectively, these 9 projects are estimated to reduce GHG emissions in Greensboro by over 5,000
metric tons of carbon dioxide equivalent (MTCO2e) annually during the term of the grant.
The City and community partners have also applied for other grants that would support and
complement the policies and strategies in this Action Plan. This past spring the City was awarded a $5
million BetterBuildings grant from the Department of Energy to be used for residential and non-
residential energy retrofits on existing buildings.

Sustainability Action Plan
Chapter 3
12
3.0 Greenhouse Gas Inventory and Projections
In 2009 the Center for Energy Research and Technology at North Carolina A&T State University
produced a Greenhouse Gas & Criteria Air Pollutant Emissions Inventory for the Greensboro community.
The data, methodologies and outcomes of the Inventory were reviewed, confirmed and expanded on for
inclusion in this Action Plan. The inventory used accepted methodologies and emission factors from the
organization Local Governments for Sustainability (ICLEI) and their associated Clean Air and Climate
Protection (CACP) software.
In the baseline year for the inventory, calendar year 2007, community GHG emissions totaled an
estimated 5.5 million MTCO2e (Figure 1). The GHG inventory includes emissions from most source
activities in the community including energy consumption in buildings and processes (e.g. lighting,
heating, cooling, fans, equipment, cooking), transportation (e.g. vehicle transportation on roads - cars,
trucks and buses) and solid waste disposal. The emissions from these sources include residential,
commercial, industrial, institutional and municipal activities. The data from which these emissions are
calculated were provided by local utilities, planning organizations and the City of Greensboro. More
details on the data sources and inventory methodology are provided in Appendix A.
Figure 1. Greensboro’s 2007 Community-wide GHG Emission Sources
In addition to the community-wide inventory for Greensboro, an inventory of GHG emissions associated
with City operations has also been completed. In 2007, GHG emissions from the City’s operations,
Electricity59.9%
Natural gas13.8%
Transportation24.4%
Solid Waste1.9%
City of Greensboro 2007 Emission Sources(community-wide)
5,517,198 Metric Tons CO2e

Sustainability Action Plan
Chapter 3
13
primarily from building energy use, provision of services (including water treatment and distribution),
and vehicle and equipment fleets, were estimated to be 122,458 MTCO2e, or about 2 percent of
community-wide emissions.
Figure 2. Greensboro’s 2007 City Operations GHG Emission Sources
To enable planning toward a future GHG reduction goal, a forecast of Greensboro’s community
emissions has also been prepared. For the purpose of this forecast, it was assumed that emissions
would grow at the rates presented in Table 1.
Based on these projected growth rates, total community emissions are estimated to be 6,889,423
MTCO2e in 2020.
Table 1. GHG Emission Growth Rate Factors
Emission Source Growth Rate
(year-over-year)
Source
Electricity and natural
gas consumption
1.5 percent North Carolina Climate Action Plan Advisory Group (CAPAG)
Transportation 2.4 percent CAPAG
Solid Waste 1.2 percent County of Guilford Solid Waste Management Plan Update, 2009
Electricity76.1%
Natural gas3.6%
Vehicle fleet18.9%
Solid waste1.3%
City of Greensboro 2007 Emission Sources(city operations)
122,458 Metric Tons CO2e
Sustainability Action Plan
Chapter 4
14
4.0 Sustainability Action Plan Development Process
This Action Plan is the outcome of efforts dating back to 2008 and reflects collaboration among the CSC,
City staff and Greensboro community. This process included gathering input, taking stock of
Greensboro’s progress to date, researching opportunities and ideas from other communities and setting
goals. This process is outlined in more detail below.
4.1 Collaboration Process
Collaboration for developing this Plan has included not only the extensive work of the CSC committee
members in monthly meetings, but also input from City staff and the Greensboro community at large.
The CSC took the first major step to engage the broader community in preparation for this effort in
November 2008, when it held its first community-wide Environmental Gathering. Over 140 people
attended the meeting, representing more than 60 community neighborhoods, organizations, faith
communities and businesses. The purpose of the gathering was to brainstorm project ideas and to
gauge the community’s interest to engage in change and be proactive in various environmental
sustainability areas.
In July 2009, the City invited residents to again provide input during two public meetings on ways to
make Greensboro more 'green' by suggesting strategies for the EECS. Feedback from the meetings and
a subsequent online survey were used to inform both the EECS and this Action Plan.
In fall 2009, the City, funded by federal EECBG funds, engaged a consultant team to develop the EECS,
and to collect input on additional strategies for this Action Plan. In October 2009, the City hosted two
more public open houses to invite the public’s input for both the EECS and the Plan. Comments were
collected to generate additional ideas, establish priorities and further refine ideas contributing to the
policies and strategies in this Action Plan.
4.2 Mission and Goal Development
A foundation of this Action Plan is the following mission statement and a long-term GHG reduction goal
to guide the development of policies and strategies, as well as future updates to the Action Plan. The
mission statement is a reflection of the priorities and mission of the CSC, while the Action Plan’s goal is
the outcome of discussions among City staff and CSC members, with support from community input.
This goal reflects not only Greensboro’s unique conditions and priorities, it has also been developed in
the context of creating a goal that is realistic and feasible for Greensboro to achieve. As progress is
made on implementing this Action Plan, there will be opportunities to revisit interim and long-term
goals and make adjustments as appropriate.
Mission Statement
The mission of this Action Plan is embodied in the overall mission established for the CSC. Specifically,
the mission of the CSC is to research, advocate, coordinate and provide outreach for local measures to:

Sustainability Action Plan
Chapter 4
15
Reduce energy use and CO2 emissions
Identify costs of implementation and possible funding strategies
Monitor the progress and effectiveness of measures adopted by the Greensboro City Council
The completion of this Action Plan is another step in the CSC’s efforts to serve City Council by
formulating and suggesting strategies to reduce pollutants, reduce energy costs, conserve resources,
protect and strengthen the local economy and save City and taxpayer money. It advises City Council on
actions the City government can take to effectively manage energy use and waste production internally,
and promote these actions throughout the community. The Action Plan’s policies and strategies are
quantified for their GHG reduction potential as well as the costs and benefits of implementation. The
CSC will continue to support the development, implementation and monitoring of the policies and
strategies adopted by City Council.
Goal Development
The CSC has proposed a GHG reduction goal and intends to monitor progress made in being more
resource efficient, sustainable and better prepared for the future. . As a result, Greensboro will have an
effective and comprehensive measure of its progress in working toward greater sustainability by
measuring its progress towards a GHG reduction goal.
While the State of North Carolina does not have a stated GHG reduction goal, the North Carolina
General Assembly created a Legislative Commission on Global Climate Change (LCGCC) in fall 2005 to
address climate-related issues. These issues included whether North Carolina should set a goal for
reduction of GHGs, and if so, what that goal should be. Subsequently, the NC Climate Action Plan
Advisory Group CAPAG was established with the aim of developing proposals for dealing with global
climate change in North Carolina. In its final report and recommendations released in October 2007, the
CAPAG recommended that the state of North Carolina set an overall voluntary goal to bring statewide
emissions back to a baseline, such as year 2000.
To set a goal that is appropriate for Greensboro, the CSC evaluated a number of other GHG reduction
goals for local governments and discussed their applicability to Greensboro. The discussion of goal
setting was built “bottom up”- that is, the CSC took stock of the City’s current GHG emissions and
forecasts for future emissions as discussed in Section 3, above, and evaluated what it would take to
reach various future GHG reduction targets. This is in contrast to many other communities that have
committed to goals before evaluating the level of effort needed to achieve them. As a result,
Greensboro’s goal has been grounded in what is feasible for the community, reflecting a balance
between making significant progress and identifying a goal that is pragmatic and achievable.
Selected Goal
Based on discussions and review of the GHG inventories, the CSC has recommended the City establish a
preliminary goal of stabilizing GHG emissions at forecasted 2010 levels by the year 2020. This goal

Sustainability Action Plan
Chapter 4
16
represents a 17 percent reduction of projected emissions in 2020 based on expected population growth
and historic increases in per capita emissions. The policies and strategies in this Action Plan will not
meet this goal but will establish a foundation for measuring achievement of this target and making initial
progress. Additional measures -- either new policies and strategies or scaling up of strategies already
contained in this Action Plan – would be necessary to meet the “Fully Implemented Reduction” level or
the more ambitious “Goal Scenario: Stabilization at 2010 levels by 2020” level (Figure 3).
Figure 3. Business-As-Usual Forecast and Sustainability Action Plan GHG Reductions
4.3 Benefits from Planned and Ongoing Actions
This Action Plan has been developed in the context of an established 2007 baseline year; that is, success
of this Action Plan’s policies and strategies in reducing GHG emissions, reducing energy and resource use
and making progress toward sustainability will be measured against this 2007 baseline year, which is the
most recent year for which GHG inventories for City operations and the community have been
completed.
It is important to note, however, that in addition to the new policies and strategies in this Action Plan,
there are several ongoing actions in Greensboro that will contribute to GHG reductions in the future, as
3,000,000
3,500,000
4,000,000
4,500,000
5,000,000
5,500,000
6,000,000
6,500,000
7,000,000
7,500,000
2005 2007 2009 2011 2013 2015 2017 2019
Me
tric
To
ns
Car
bo
n D
ioxi
de
Eq
uiv
ale
nt
(MTC
O2e
)
Business-As-Usual Forecast and Sustainability Action Plan Reduction
Business-As-Usual Forecast for Greensboro
Sustainability Action Plan Reduction
"Fully Implemented" Reduction
Goal scenario: Stabilization at 2010 levels in 2020

Sustainability Action Plan
Chapter 4
17
well as other actions that have been initiated and/or completed since 2007 that will also reduce GHG
emissions from this baseline. For example, discussed in Section 2.3, above, the City’s recently completed
EECS identified 9 distinct strategies that cumulatively are projected to reduce over 5,000 MTCO2e
annually during the term of the grant. These reductions are in addition to the projected GHG reductions
from policies and strategies in Section 5.0.
Because of the distributed nature of these actions across the community, it is difficult to quantify
benefits from other community energy efficiency and GHG reduction efforts. As this Action Plan is
implemented and the City collaborates with community partners, it would be beneficial to track these
efforts to develop a more complete picture of the cumulative benefits of GHG community-wide
reduction measures.

Sustainability Action Plan
Chapter 5
18
5.0 Sustainability Action Plan Policies and Strategies
The following sections identify a number of recommended policies and strategies for fulfilling the Action
Plan’s mission and making progress toward its stated goal of stabilizing community GHG emissions at
2010 levels by 2020. These policies and strategies are the reflection of significant work by the CSC over
the past two years, as well as City staff and community input, to identify the priorities of Greensboro
residents and the policies and strategies that can provide the most significant economic, social and
environmental benefits to the community.
The CSC identified 12 policies during community wide meetings and in working subgroups, each with
associated implementation strategies. These policies and strategies were organized under seven topic
areas. An eighth topic area, “Adaptation” has been added during the creation of this plan to help the
City plan for potential impacts from climate change.
These eight topic areas are:
Transportation and Land Use
Nature in the City
Green Jobs and Buildings
Education and Outreach
Recycling and Waste Reduction
Green Technologies
City Operations
Adaptation
Policies and strategies for each topic area have been developed based on reports from each of the
working CSC sub-groups; these full reports are provided in Appendix B.
Each section below places the topic area in the context of GHG reductions and sustainability, provides
recommended policies for the City to adopt and a number of recommended strategies to support each
policy. Finally, for each topic area, projections of GHG emission reductions and costs are provided, both
for policies and strategies as proposed, as well as hypothetical “full implementation” across the Cityiii.
Table 2 provides a summary of estimated GHG reductions, cost and cost savings for each of the topic
areas for which quantifications can be made. Emission reductions, costs and cost savings associated
with individual policies under each topic area are presented in the following sections.

Sustainability Action Plan
Chapter 5
19
In Table 2, the “As Proposed” GHG emission reductions in 2020 represent a reasonable estimate of the
performance of the strategies described under each of the following policies based on current
technologies, performance of similar strategies in other communities and achievable rates of
participation for the assumed level of funding. The “Fully Implemented” case assumes that these
strategies are implemented with a level of effort and funding that will allow them to achieve higher
rates of participation. Even the “Fully Implemented” case, however, does not represent an absolute
upper bound; more aggressive implementation of these strategies could be envisioned, and there are
certainly more strategies that could be considered under each of these policy areas. The assumptions
behind the projected performance of these strategies are included in the following sections.
Costs and savings estimated in Table 2 include those incurred by both private and public entities in the
community (e.g. individual citizens, local businesses and the City of Greensboro). As a result, the entity
paying for the implementation costs may not be the same entity realizing the cost savings.
Furthermore, the costs and cost savings could not be estimated for all the proposed strategies so there
are some GHG reductions portrayed below for which cost savings and costs are not included.
Table 2. Summary of Policies and Strategies
Policy Topic Minimum Cumulative Cost to Implement by 2020
(as proposed case only)
Minimum Cumulative Cost Savings by 2020
(as proposed case only)
GHG Reductions in 2020
[MTCO2e]
(as proposed, fully implemented)
Percentage Reduction of Business-as-usual GHG Emissions in 2020
(as proposed, fully implemented)
Transportation and Land Use $3,600,000 $17,600,000 181,000 - 403,000 2.6% - 5.9%
Green Jobs and Buildings $2,900,000 $4,000,000 67,000 - 204,000 1.0% - 3.0%
Waste Reduction and Recycling
$2,300,000 $2,300,000 6,000 - 12,000 0.1% - 0.2%
City Operations $500,000 $600,000 13,000 - 22,000 0.2% - 0.3%
SUBTOTAL $9,300,000 $24,500,000 267,000 - 641,000 3.9% - 9.3%
Funded EECS Strategies $3,100,000 $4,570,000 9,000 - 9,000 0.1% - 0.1%
TOTAL $12,400,000 $29,070,000 276,000 - 650,000 4.0% - 9.4%
**Notes: Numbers in the above table may not sum exactly due to rounding. No direct GHG reduction benefits from Nature and
the City were quantified. The benefits of Education and Outreach are included under the Funded EECS Strategies. See
Sections 5.5 and 5.6 of the Action Plan for further discussion. Only a portion of Funded EECS Strategies are assumed to still be
in effect in 2020. Further documentation on how these costs and cost savings were arrived at are located in Appendix C..
Sustainability Action Plan
Chapter 5
20
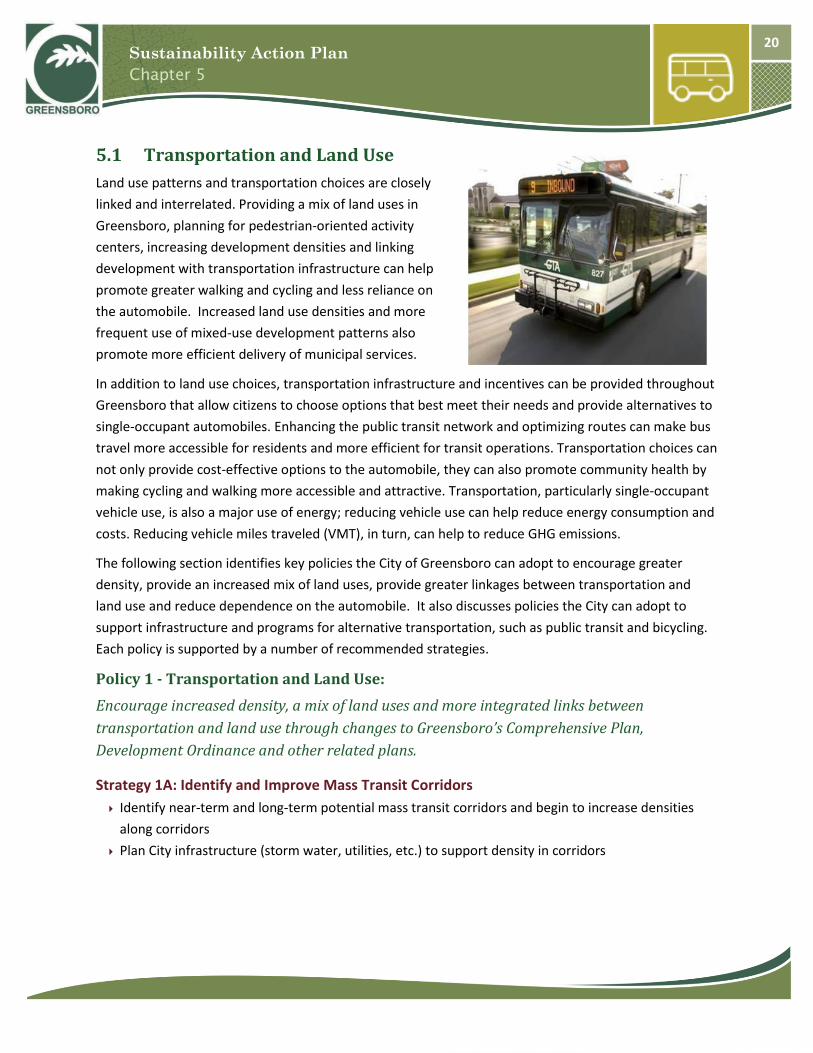
5.1 Transportation and Land Use
Land use patterns and transportation choices are closely
linked and interrelated. Providing a mix of land uses in
Greensboro, planning for pedestrian-oriented activity
centers, increasing development densities and linking
development with transportation infrastructure can help
promote greater walking and cycling and less reliance on
the automobile. Increased land use densities and more
frequent use of mixed-use development patterns also
promote more efficient delivery of municipal services.
In addition to land use choices, transportation infrastructure and incentives can be provided throughout
Greensboro that allow citizens to choose options that best meet their needs and provide alternatives to
single-occupant automobiles. Enhancing the public transit network and optimizing routes can make bus
travel more accessible for residents and more efficient for transit operations. Transportation choices can
not only provide cost-effective options to the automobile, they can also promote community health by
making cycling and walking more accessible and attractive. Transportation, particularly single-occupant
vehicle use, is also a major use of energy; reducing vehicle use can help reduce energy consumption and
costs. Reducing vehicle miles traveled (VMT), in turn, can help to reduce GHG emissions.
The following section identifies key policies the City of Greensboro can adopt to encourage greater
density, provide an increased mix of land uses, provide greater linkages between transportation and
land use and reduce dependence on the automobile. It also discusses policies the City can adopt to
support infrastructure and programs for alternative transportation, such as public transit and bicycling.
Each policy is supported by a number of recommended strategies.
Policy 1 - Transportation and Land Use:
Encourage increased density, a mix of land uses and more integrated links between
transportation and land use through changes to Greensboro’s Comprehensive Plan,
Development Ordinance and other related plans.
Strategy 1A: Identify and Improve Mass Transit Corridors
Identify near-term and long-term potential mass transit corridors and begin to increase densities
along corridors
Plan City infrastructure (storm water, utilities, etc.) to support density in corridors

Sustainability Action Plan
Chapter 5
21
Progressively increase transit system
usage, especially for discretionary
ridership
Strategy 1B: Increase Development Densities and Mix of Uses for Transit Corridors and Activity Centers
Develop policies for minimum
densities, minimum floor area ratios
and density by right
Revise site design requirements such as setbacks, parking standards, landscaping and buffers to
allow for more site flexibility in achieving higher densities and mix of uses
Provide incentives for shared parking to reduce parking requirements in areas of higher density
development
Strategy 1C: Improve Housing Diversity and Property Utilization
Promote intentional communities and mixed occupancies
Explore alternatives to the limitation of occupancy of dwelling units
Promote development of accessory dwelling units
Policy 2 - Transportation and Land Use:
Reduce vehicle miles traveled, including the use of single-occupant vehicles, by promoting
alternative forms of transportation and providing greater infrastructure for transit, cycling
and other non-vehicular travel options.
Strategy 2A: Increase Transit System Use
Encourage higher discretionary use of the Greensboro Transit Authority system
Investigate the feasibility of Park & Ride lots near route terminus points, preferably at commercial
centers to support retail uses
Accelerate plans for cross-town connectors, additional transfer points outside of downtown and
other upgrades
Explore options for increased express bus service to downtown and van services during shift
changes
Increase publicity, demonstration projects and employer participation to promote transit ridership
Promote transit usage by displaying bus maps and adding bike racks at City libraries and other public
facilities
Strategy 2B: Increase Bicycling Infrastructure
Consider a “Complete Streets” policy that incorporates multi-modal capabilities where appropriate
Reducing Bus Idling Impacts
The environmental issues and problems associated with bus
idling include diesel fuel use, air quality and climate impacts.
Eliminating bus idling at the local level (schools, Greensboro
Transit Authority, etc.) and determining barriers to large
scale implementation can help reduce idling.

Sustainability Action Plan
Chapter 5
22
Provide more bicycle infrastructure, bike lanes and paths on all major thoroughfares
Implement the City’s Greenway Master Plan to increase off-road cycling opportunities and
connections.
Provide bike-sharing infrastructure along public greenways as they are completed and linked
together
Facilitate bike-sharing programs at local
universities and colleges, other high
employment locations, downtown and
other larger business districts
Formally include bicyclists in
transportation planning processes
Establish bike rental stations at strategic
locations
Strategy 2C: Develop Green Bike Program
Enhance bicycle use and safety across the
City, particularly within the urbanized core
Increase public safety announcements regarding
cycling safety and rules of the road to improve
knowledge and awareness
Make more streets crossable for bicyclists and
pedestrians
Install sensors in pavement to change lights at
intersections for bikes
Other Land Use Incentive Examples:
Water Resources
Alternative storm water retention models can remove
barriers to higher density development. These can include
best management practices (BMPs) that maximize
infiltration on site, particularly in higher density areas and
neighborhoods. The City could also offer incentives (rebates
on stormwater fees, reduced permit and inspection fees,
etc.) for water conservation measures (e.g. cisterns,
conservation fixtures and rain gardens).

Sustainability Action Plan
Chapter 5
23
Quantification of Policy Outcomes
Cumulative minimum cost to implement proposed strategies by 2020: $3,600,000
Cumulative minimum cost savings from proposed strategies by 2020: $17,600,000
Estimated costs and savings include those incurred by public and private entities in community (e.g.
individual citizens, businesses, City of Greensboro).
Assumptions
Policy 1: Strategies 1A, 1B, and 1C.
A review of modeling studies found that similar strategies resulted in VMT reductions of 10 percent or
more as a lower boundiv. The “As Proposed” case applies these reductions only to the projected growth
in VMT and emissions between 2010 and 2020. The “Fully Implemented” case considers community-
wide adoption of these strategies. The costs of implementing the policies suggested are likely negligible
with respect to baseline planning costs. However, the indirect costs of these strategies in terms of
infrastructure and development are not easily quantified. Therefore, neither costs nor cost savings for
these strategies are included.
Policy 2: Strategy 2A.
The same review of modeling studies found that simply expanding transit infrastructure only resulted in
a 1 percent reduction in VMT. However, individualized marketing of transit services was found to result
in an average VMT reduction of about 7 percent, with Durham, North Carolina realizing an 11 percent
reductionv. The “As Proposed” case reaches 120,000 households over 5 years at a 6.75% reduction in
VMT, while the “Fully Implemented” reaches all households in Greensboro and achieves an 11%
reduction in VMT. Costs for individualized marketing are $30 per householdvi. Cost savings are based on
reduced VMT a $0.03/mile savings for avoided single occupancy vehicle trips.
5.9%
2.6%
0% 1% 2% 3% 4% 5% 6% 7% 8% 9% 10%
Strategies Fully Implemented
Strategies as Proposed
Transportation & Land Use StrategiesEstimated Reduction in Community GHG Emissions
Over Business-as-usual in 2020
Sustainability Action Plan
Chapter 5
24
Assumptions, continued
Policy 2: Strategy 2B and 2C.
Nationally, about 1 percent of trips are made by bicycle. Rates 5 to 10 times higher are achieved in
communities with strong bicycle infrastructure and programs. The “As Proposed” and “Fully
Implemented” cases both apply the same 1 percent reduction. The costs of developing cycling
infrastructure to facilitate this rate of cycling are not easily quantified. Therefore, neither costs nor cost
savings for these strategies are included.

Sustainability Action Plan
Chapter 5
25
5.2 Green Jobs and Buildings
Buildings are major users of energy in Greensboro
and nationwide. According to the U.S. Green
Building Council, in the U.S. today buildings
consume approximately 70 percent of electricity
and account for nearly 40 percent of CO2
emissionsvii. There are significant opportunities in
Greensboro to increase energy efficiency and
conserve energy in residential, commercial and
institutional buildings. Increasing efficiency not
only lowers energy bills for the City and
Greensboro citizens, it also helps to reduce
community GHG emissions.
Energy efficiency, water conservation and other elements of green design can also be promoted and
encouraged in new buildings and renovations. New development can be energy and resource efficient,
use renewable and recycled building materials, provide for healthy working and living environments,
reduce building operating costs and help reduce GHG emissions.
Finally, to support energy efficiency, green building and economic development in Greensboro, the City
can support and promote the expansion of its skilled green workforce. Partnerships with higher
education institutions and other community organizations can be used to develop training programs so
that the City’s workforce can meet the growing demand for these skills and services and create jobs.
Sustainability Action Plan
Chapter 5
26
The following section identifies key policies the City of
Greensboro can adopt to encourage energy and water
efficiency, green building and green job development. Each
policy is supported by a number of recommended strategies.
Policy 3 – Green Jobs and Buildings:
Develop a coordinated City program to provide
technical support, energy audits and education and
outreach to increase energy efficiency and
conservation in commercial and residential buildings.
Strategy 3A: Promote Existing Energy Conservation Opportunities
Utilize the City’s communication systems, such as
Channel 13 and the City’s website, to educate and
promote available energy conservation opportunities
Develop energy conservation and green building
programming to highlight City leadership in energy
conservation activities and results
Strategy 3B: Increase Availability of Energy Assessments for Property Owners
Make energy assessments and energy upgrade
programs available to more commercial and residential
property owners
Conduct personal home visits to perform basic upgrades
like replacing incandescent light bulbs with compact fluorescent lamps (CFLs) and installing
programmable thermostats
Make property owners and residents aware of weatherization assistance opportunities
Utilize the revolving loan fund program in the City’s EECS for funding energy assessments and
upgrades
Strategy 3C: Coordinate with Local Utilities
Engage Duke Energy and Piedmont Natural Gas in continuous discussions about local energy use and
energy conservation programs for residential and commercial buildings
Supporting Energy Efficiency in the
Home: More Ideas
Other ideas for promoting energy
efficient homes in Greensboro include:
Training home energy assessment
teams
Preparing a catalogue of available home
improvement resources, including
government, private, philanthropic and
faith community resources
Outreach to priority areas based on
analysis of City-wide levels of inefficient
housing stock
Pre- and post-energy assessments and
evaluation
Still another opportunity is to work with
active older adults on community-based
energy-efficient housing and lifestyle
modification projects, encouraging all
participants to share their expertise,
knowledge, passion and years of
experience.

Sustainability Action Plan
Chapter 5
27
Align weatherization and energy efficiency
programs with other community initiatives
Formalize energy use information sharing between
the City and energy supplier companies
Strategy 3D: Expand Energy Education Programs
Create mobile exhibits with local colleges and
universities that demonstrate simple energy
conservation techniques for community functions
Provide educational programming on energy
conservation and cost savings potential of lower
energy use
Pair neighborhood associations with trained
community organizers to spread the word to
neighbors about the health and money saving
benefits of repairing substandard homes and making better energy choices
Work with preservation interests to promote energy efficient practices and energy tax credits for
older and historic buildings
Publicize demonstration projects for energy efficient upgrades on historic buildings
Strategy 3E: Promote Energy Conservation in Rental Units
Work with the Rental Unit Certificate of Occupancy (RUCO) Board to promote energy conservation
in policy and the inspection process
Policy 4 – Green Jobs and Buildings:
Use a combination of code changes, incentives, partnerships and education to promote green
building in Greensboro.
Strategy 4A: Promote Green Building in the Land Development Ordinance (LDO)
Conduct a sustainability audit of the LDO to identify impediments to green building
Develop a permit fee rebate program and other development incentives, such as rebates on the
stormwater fees and permit and inspection fee modifications, for certified green construction and
substantial renovation
Expedite permit processing for construction pursuing green building certification
Strategy 4B: Evaluate Housing Code Updates
Review the Minimum Housing Code to identify current provisions for energy efficiency standards
and revisions to match current building code and standard practices
Green Building Certification Systems
Certification systems such as the U.S.
Green Building Council’s Leadership in
Energy and Environmental Design (LEED),
National Association of Home Builders
Green Building Program (NAHBGreen) and
the federal ENERGY STAR designation for
buildings can also be used to promote
green building, including energy and
resource efficiency, choices in building
materials and the design of healthy indoor
environments.

Sustainability Action Plan
Chapter 5
28
Develop cost/benefit analyses to minimize impacts on housing affordability and provide financial
incentives where necessary
Strategy 4C: Form Green Building Partnerships
Form partnerships with local green building organizations to share educational information through
web links, discussions about legislative and policy actions and co-sponsored educational sessions
and awards programs
Provide links to directories of certified green building and service firms to make information readily
available to the community
Develop partnerships to integrate home energy measures into the Healthy Homes Initiative focused
on elderly, poor and marginalized populations
Seek additional grant resources for healthy-green repairs such as weatherization-ventilation-indoor
air quality, lead-safe work practices, integrated pest management, moisture intrusion and energy
efficiency
Strategy 4D: Develop and Implement Green Building Advocacy Initiatives
Work with state and federal legislative delegations to ensure consistent and permanent tax credits
for energy conservation upgrades to residential and business properties
Support efforts to increase energy efficiency and resource conservation standards in state building
codes
Support state statutes allowing grey water re-use for non-potable uses and enabling legislation
allowing communities to provide a full range of green building incentives
Strategy 4E: Promote Green Building Success Stories
Promote work the City of Greensboro has accomplished to achieve energy savings and
environmental benefits
Promote local green building successes through award programs with community partners, lunch
and learn sessions with local colleges and universities and support of green building design
competitions
Provide links to project registries of certified green building renovation and construction, including
residential, commercial, industrial and institutional projects
Promote green building programs through community partnerships and local economic
development agencies
Work with local and state green building organizations to hold educational sessions for local code
inspectors and contractors to share issues about green building standards and challenges

Sustainability Action Plan
Chapter 5
29
Publicize information over local television, radio and
newspaper media and through presentations to civic
organizations
Develop an Integrated Design Roundtable Program
where design, development and operations teams
from successful projects share the “how and why” of
projects for students and young professionals
Policy 5 – Green Jobs and Buildings:
Work with community partners to encourage green
job creation, training and placement.
Strategy 5A: Facilitate Green Jobs Creation
Leverage the City’s EECS green jobs strategy to create
an ongoing organizational structure to facilitate green
jobs creation, training and placement
Partner with higher education, community colleges,
workforce development, K-12 schools, other
community organizations, City and county human
resources and others
Coordinate and partner with local schools, colleges and universities to develop a green industries
certificate program
Expand green jobs resource materials at all public libraries
Policy 6 – Green Jobs and Buildings:
Promote more efficient use of water through education, partnerships and pilot projects.
Strategy 6A: Develop a Water Conservation Demonstration Project
Obtain funding and implement a demonstration neighborhood water conservation program in at
least two model neighborhoods
Provide education about water-wise lawn and planting systems
Work with community partners to model projects that promote conservation of outdoor water use,
including reducing the amount of high maintenance lawn plantings, use of native and low-water-use
plants and water-saving lawn and gardening management processes
Subsidize the cost of water saving equipment (rain barrels, bio-swales, low flow fixtures and
appliances) and replacement of paving and plant materials
Monitor the impact on water use in demonstration neighborhoods
Develop a report on annual water use savings compared with typical neighborhoods
Other Potential Ideas and Best
Practices
Other potential ideas and practices
that have been developed by other
cities for green jobs and buildings
include:
Develop a new near-net-zero-energy-
use community demonstration
housing project
Provide training for building operators
Research the ability to link business
license fees to energy use and energy
audits
Work with the Water Resources
Department to report on high water
use locations through water billing

Sustainability Action Plan
Chapter 5
30
Strategy 6B: Promote Water Conservation through Billing System
Provide past water usage information on monthly City Services billing statements.
Quantification of Policy Outcomes
Cumulative minimum cost to implement proposed strategies by 2020: $2,900,000
Cumulative minimum cost savings from proposed strategies by 2020: $4,000,000
Estimated costs and savings include those incurred by public and private entities in community (e.g.
individual citizens, businesses, City of Greensboro).
Assumptions
Policy 3: Strategy 3A.
Research indicates that education alone can result in 5 to 30 percent energy savingsviii. Based on
programs in other communities, the “As Proposed” case assumes an adoption rate of 2.5 percent for the
efforts to promote existing energy conservation programs and an energy savings of 5 percent. The
“Fully Implemented” case assumes penetration of 5 percent and energy savings of 20 percent. These
savings are for residential electricity and natural gas consumption as projected in 2020. Cost savings are
based on typical energy rates, while the cost to implement is an annual cost based on maintaining an
outreach program as developed under the EECBG grant program. The outreach program would likely
need to be funded consistently for a number of years to attain “Fully Implemented” performance.
3.0%
1.0%
0% 1% 2% 3% 4% 5% 6% 7% 8% 9% 10%
Strategies Fully Implemented
Strategies as Proposed
Green Jobs and BuildingsEstimated Reduction in Community GHG Emissions
Over Business-as-usual in 2020
Sustainability Action Plan
Chapter 5
31
Assumptions, continued
Policy 3: Strategy 3B.
The “As Proposed” case assumes continued implementation of a residential energy assessment program
as developed under the EECBG grant that reaches approximately 250 households per year and achieves
conservative savings of 5 percent in electricity and natural gas consumption per household. In addition,
through the assessments and general outreach, compact fluorescent lamp (CFL) and efficient heating,
ventilation and air conditioning (HVAC) system upgrades are estimated to achieve penetrations of 0.8
and 0.2 percent, respectively, community-wide. The CFLs are projected to result in consumption savings
of 2.5 percent of electricity, while HVAC upgrades are projected to result in savings of 10 percent of
natural gas for affected households. The “Fully Implemented” case assumes the audit program reaches
all Greensboro households, while the penetration of CFL and HVAC upgrades reach 25 percent and 5
percent, respectively. Cost savings are based on typical energy rates, while the cost to implement is an
annual cost based on maintaining the audit program developed under the EECBG grant program. The
audit program would need to be active continuously from the end of EECBG funding through 2020 to
attain “As Proposed” performance.
Policy 3: Strategy 3C, 3D and 3E.
These strategies support the performance of the above strategies but will not have direct GHG
reductions in addition to Strategies 3A and 3B.
Policy 4: Strategy 4A.
This strategy supports the performance of the other strategies but will not result in direct GHG
reductions that are quantifiable at this time.
Policy 4: Strategy 4B.
Building energy codes are adopted at the state level and North Carolina is currently using an amended
version of the International Energy Conservation Code (IECC) 2006ix. Building energy modeling for
residential buildings indicates that updating the code to IECC 2009 could result in energy cost savings of
15 percent for Greensboro’s climate zone. The “As Proposed” case assumes adoption of the IECC 2009
residential energy code, and perhaps additional code updates before 2020. The “Fully Implemented”
case adds the adoption of Standard 90.1-2007 for commercial buildings, which results in a modeled
energy savings of 3.9 percent for non-residential buildings in Greensboro’s climate zonex. The
incremental costs of building under these updated codes are not known; therefore, costs and cost
savings are not included for this strategy.
Sustainability Action Plan
Chapter 5
32
Policy 4: Strategy 4C.
The “As Proposed” case assumes that 20 percent of new buildings constructed in Greensboro between
2010 and 2020 will implement a minimal level of green building that results in 10 percent energy
savings. The “Fully Implemented” case assumes a 30 percent penetration and 15 percent energy
savings. The cost of this strategy to promote partnerships to facilitate green building is presumed to be
negligible. The incremental building costs and associated cost savings are not included since they are
not the direct result of promoting partnerships, although it has been shown that the incremental costs
of green building can be minimalxi.
Policy 4: Strategies 4D and 4E.
These strategies support the performance of the above strategies but will not result in direct GHG
reductions in addition to Strategies 4A, 4B and 4C.
Assumptions, continued
Policy 5: Strategy 5A.
This strategy supports the performance of the above strategies by providing the necessary skilled
workforce but will not result in direct GHG reductions exclusive of the other strategies.
Policy 6: Strategies 6A and 6B.
These strategies support a holistic approach to green building by supporting water conservation but will
not result in a significant GHG reduction.

Sustainability Action Plan
Chapter 5
33
5.3 Waste Reduction and Recycling
By world standards, waste in the U.S. is a large and growing problem. Major facilities and tracts of land
are required to accommodate generated waste, and monitoring and mitigation are needed long after
disposal. In addition, landfills produce methane (CH4), a potent GHG, from the decomposition of waste.
While landfills can also sequester carbon such as yard waste (wood, food, leaves, etc.), these types of
products can sit for years and be unproductive in distributing various nutrients back into the soil. Actions
that promote diversion of solid waste from landfills, such as recycling, can reduce GHG emissions,
prolong the life of landfills and potentially reduce collection and disposal costs.
Recent data from the U.S. Environmental Protection Agency indicates that almost 30 percent of carbon
emissions associated with purchased goods can be attributed to the “life cycle” of these goodsxii. These
emissions occur at multiple stages of a product’s life cycle, from extraction and processing of raw
materials to manufacture, distribution, storage and disposal. As a result, reducing the use and amount of
purchased goods from the start can not only save the City and community money, it can also help
reduce energy and water consumption and GHG emissions associated with products.
The following section identifies key policies the City of Greensboro can adopt to encourage waste
reduction and recycling. Each policy is supported by a number of recommended strategies.
Policy 7- Waste Reduction and Recycling:
Employ a combination of expanded recycling infrastructure, regulations and incentives to
increase Greensboro’s solid waste diversion and recycling rates.
Strategy 7A. Expand Multifamily Recycling
Continue and expand current programs to bring city solid waste services to multifamily housing
communities.
Currently six multifamily communities that receive private garbage service will start
receiving City Solid Waste Services, including recycling.
The city will continue to work with the Greensboro Housing Authority to begin a recycling
pilot for public housing units.
Currently the city has a grant to provide recycling services to Multi-family communities who
currently receive City fee-based garbage services. Over 30 communities have signed up for
the pilot with a goal of 60 complexes – 12 in each of the 5 City Council districts.
Continue to recruit condo/townhome/multifamily complexes for the program as more
funding sources become available.
Continue to create new recycling drop sites. For example, each new fire station/recreation center
would become a drop site.

Sustainability Action Plan
Chapter 5
35
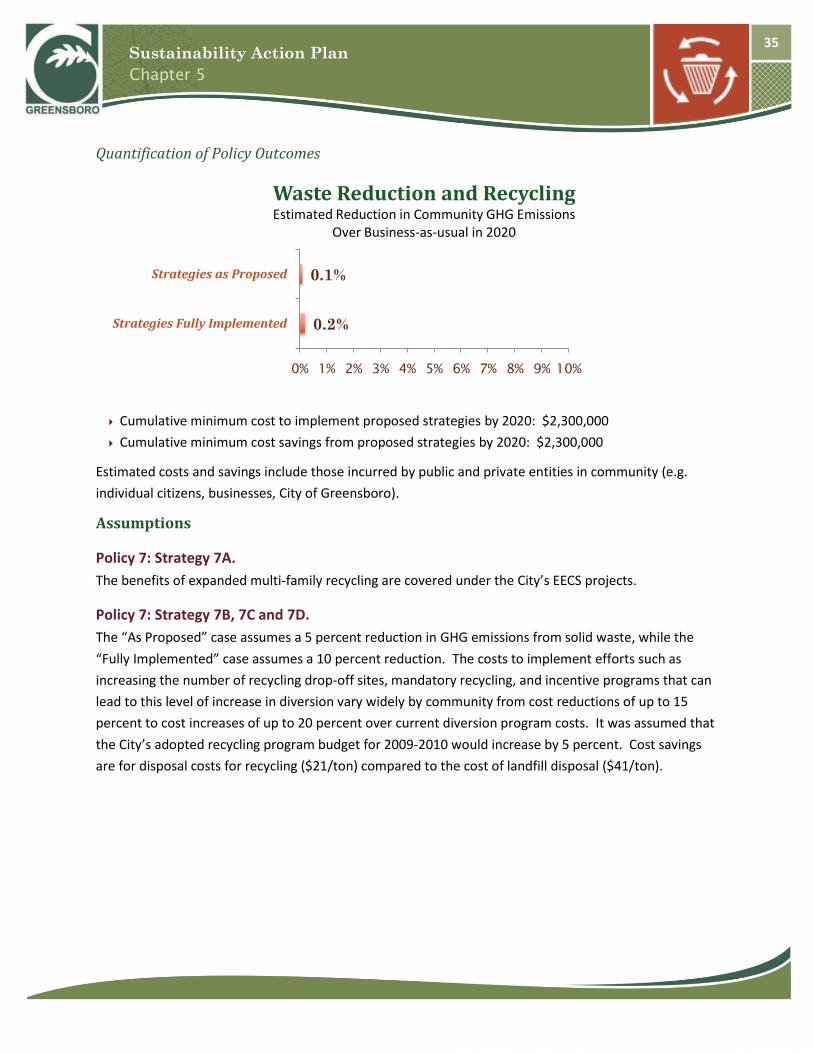
Quantification of Policy Outcomes
Cumulative minimum cost to implement proposed strategies by 2020: $2,300,000
Cumulative minimum cost savings from proposed strategies by 2020: $2,300,000
Estimated costs and savings include those incurred by public and private entities in community (e.g.
individual citizens, businesses, City of Greensboro).
Assumptions
Policy 7: Strategy 7A.
The benefits of expanded multi-family recycling are covered under the City’s EECS projects.
Policy 7: Strategy 7B, 7C and 7D.
The “As Proposed” case assumes a 5 percent reduction in GHG emissions from solid waste, while the
“Fully Implemented” case assumes a 10 percent reduction. The costs to implement efforts such as
increasing the number of recycling drop-off sites, mandatory recycling, and incentive programs that can
lead to this level of increase in diversion vary widely by community from cost reductions of up to 15
percent to cost increases of up to 20 percent over current diversion program costs. It was assumed that
the City’s adopted recycling program budget for 2009-2010 would increase by 5 percent. Cost savings
are for disposal costs for recycling ($21/ton) compared to the cost of landfill disposal ($41/ton).
0.2%
0.1%
0% 1% 2% 3% 4% 5% 6% 7% 8% 9% 10%
Strategies Fully Implemented
Strategies as Proposed
Waste Reduction and RecyclingEstimated Reduction in Community GHG Emissions
Over Business-as-usual in 2020

Sustainability Action Plan
Chapter 5
36
5.4 City Operations
Greenhouse gas emissions from municipal operations account for about 2 percent of Greensboro’s total
emissions. While this may present a small opportunity to directly reduce GHG emissions, the City is in a
position to leverage community-wide sustainability and GHG reduction measures through leading by
example. Opportunities include standards for resource efficient, well designed new buildings and
renovations, greater energy efficiency in existing City facilities and more efficient City operations to
reduce solid waste.
The following section identifies a key policy the City of Greensboro can adopt to integrate sustainability,
resource efficiency and cost savings into its own operations while leading the community by example.
The policy is supported by a number of recommended strategies.
Policy 8 – City Operations:
Develop standards, infrastructure, practices and projects to make City operations more
energy, resource and cost efficient.
Strategy 8A. Establish a Cash Flow Sustainability Account to Fund Future Projects
Establish a Cash Flow Sustainability Account that diverts 50 percent of savings from new energy
efficiency and conservation measures in City operations to help fund future sustainability
initiatives that require some upfront moneyxiii(cash flow from already established energy savings
contracts is already budgeted and will not be part of this fund)
Strategy 8B. Develop Green Building Standards for New or Renovated City Facilities
Adopt a green building certification standard and/or sustainable building standard for new
construction and substantial renovations of City facilities
Strategy 8C. Develop Infrastructure for the Energy Management Program
Purchase software, hardware and associated equipment to implement an Energy Management
Program for the 25 City facilities with the highest energy use to leverage savings from new and
existing building automation systems, monitor energy use and costs, identify issues and
prioritize savings opportunities
Strategy 8D. Re-commission City Buildings
Over the next three years, re-commission (return building equipment to original performance)
10 of the City’s facilities with the highest energy use in addition to the six buildings already
scheduled to be re-commissioned

Sustainability Action Plan
Chapter 5
37
Strategy 8E. Further Develop Energy Management Team
Implement a “City Green Team” to share best practices across the organization.
Establish a long range plan to seek additional resources to expand the Energy Management
Team to include a dedicated HVAC specialist to identify savings opportunities in mechanical
systems equipment and operations
Strategy 8F. Reduce Solid Waste in City Operations
Make waste reduction a priority goal and facilitate and
encourage recycling at all City buildings and facilities,
particularly parks and recreation facilities and sites where
high amounts of plastic drink bottles are generated
Provide recycling infrastructure at all City run facilities,
such as under desk recycling canisters at each work
station, in cubicles, etc.
Establish policies and minimum standards to target source
reduction, including:
Recycled content for paper and double-sided copying
Routine recycling of paper after City meetings (City
Council, Boards and Commissions)
Paperless meetings
Avoiding single-use plastic water bottles
Replacing plastic drink cups with recycled paper cups
Establishing an ink cartridge return service
Providing adequate resources for education
Other Potential Ideas and Best
Practices
Other ideas and practices that
have been developed by other
cities to reduce GHG emissions
in municipal operations
include:
Reduce fossil fuel
consumption by City fleet
vehicles
Engage employees in
“green teams” and building
energy challenges
Adopt computer and other
information technology
power management
practices
Increase efficiency in
irrigation of City grounds
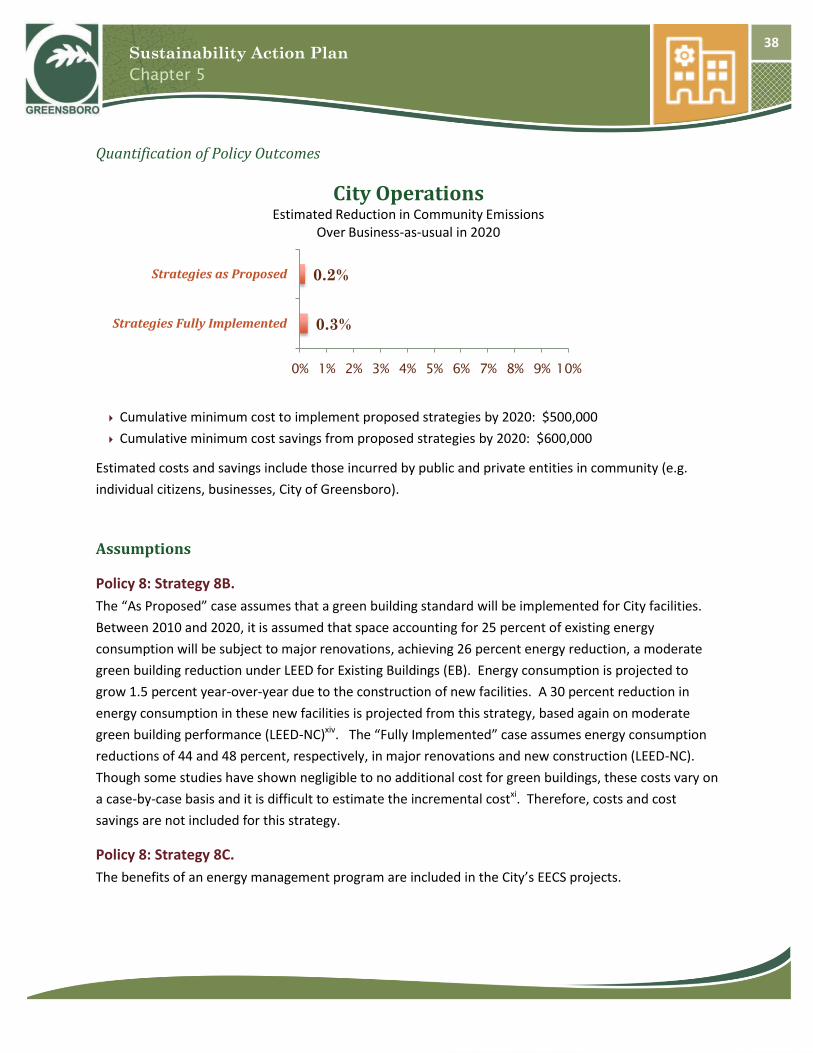
Sustainability Action Plan
Chapter 5
38
Quantification of Policy Outcomes
Cumulative minimum cost to implement proposed strategies by 2020: $500,000
Cumulative minimum cost savings from proposed strategies by 2020: $600,000
Estimated costs and savings include those incurred by public and private entities in community (e.g.
individual citizens, businesses, City of Greensboro).
Assumptions
Policy 8: Strategy 8B.
The “As Proposed” case assumes that a green building standard will be implemented for City facilities.
Between 2010 and 2020, it is assumed that space accounting for 25 percent of existing energy
consumption will be subject to major renovations, achieving 26 percent energy reduction, a moderate
green building reduction under LEED for Existing Buildings (EB). Energy consumption is projected to
grow 1.5 percent year-over-year due to the construction of new facilities. A 30 percent reduction in
energy consumption in these new facilities is projected from this strategy, based again on moderate
green building performance (LEED-NC)xiv. The “Fully Implemented” case assumes energy consumption
reductions of 44 and 48 percent, respectively, in major renovations and new construction (LEED-NC).
Though some studies have shown negligible to no additional cost for green buildings, these costs vary on
a case-by-case basis and it is difficult to estimate the incremental costxi. Therefore, costs and cost
savings are not included for this strategy.
Policy 8: Strategy 8C.
The benefits of an energy management program are included in the City’s EECS projects.
0.3%
0.2%
0% 1% 2% 3% 4% 5% 6% 7% 8% 9% 10%
Strategies Fully Implemented
Strategies as Proposed
City OperationsEstimated Reduction in Community Emissions
Over Business-as-usual in 2020

Sustainability Action Plan
Chapter 5
39
Policy 8: Strategy 8D.
The benefits of re-commissioning have been generally estimated to be between 5 and 30 percent
energy savings by a number of sources, such as the federal Environmental Protection Agency’s ENERGY
STAR programxv. The “As Proposed” and “Fully Implemented” cases assume that 40 and 70 percent,
respectively, of electricity and natural gas consumption in City buildings are consumed for heating and
cooling uses and that 7 percent of this consumption will be saved through re-commissioning. Costs are
based on projected time to complete re-commissioning of the City’s major energy using facilities that
have not recently received re-commissioning. Cost savings are based on average utility rates.
Policy 8: Strategy 8E.
The benefits of this strategy are largely covered under Strategy 8D.
Policy 8: Strategy 8F.
The benefits of reducing solid waste in City operations are included in the City’s EECS projects.

Sustainability Action Plan
Chapter 5
40
5.5 Nature in the City
Providing for and enhancing Greensboro’s green infrastructure –
its parks, greenways, stream corridors and other natural areas –
offer many community benefits. In addition to providing habitat
and serving as a visual amenity, urban forests and green spaces
can increase sequestration of CO2 and protect buildings from sun
and wind, helping to use energy more efficiently. Trees and other
vegetation also help maintain water quality and manage
stormwater runoff, and they can benefit neighborhoods by
increasing property values and lowering crime.
Aside from their recreational value, parks, natural spaces and
other open or under-utilized spaces in Greensboro offer many
other potential benefits to citizens. Research shows that quality
of life, health and educational benefits occur when children and
adults have access to the natural world. Such areas can also be
used to produce local food, providing both health and economic
benefits and reducing fuel consumption and GHG emissions
associated with transporting food long distances. Finally, they
can serve to showcase green technologies and practices, such as
renewable energy, urban gardening and low-water use
landscaping techniques (grasses, other landscaping, irrigation
practices, etc.).
The following section identifies a key policy the City of Greensboro can adopt to promote “Nature in the
City.” The policy is supported by a number of recommended strategies.
Policy 9 - Nature in the City:
Establish and enhance green corridors, parks
and other City spaces to be used for community
gardens, green technologies, recreation, habitat
and other community benefits.
Strategy 9A. Promote Urban Agriculture
Identify parcels of City-owned land that could be
used for community gardens and training citizens
in community gardening
Remembering Thomas Berry (1914-2009)
Thomas Berry was a Catholic priest,
cultural historian and eco-theologian,
widely published author and recipient of
numerous honors and awards.
A native of Greensboro, Berry contributed
significant scholarship and writing to
inspiring thought around humankind’s
place on the earth and in the broader
universe. His contributions have become
a foundation for sustainability and
inspired some of the ideas put forth in
this Action Plan.
Berry believed that, "All human
professions, institutions and activities
must be integral with the Earth as the
primary self-nourishing, self-governing
and self-fulfilling community. To integrate
our human activities within this context is
our way into the future."
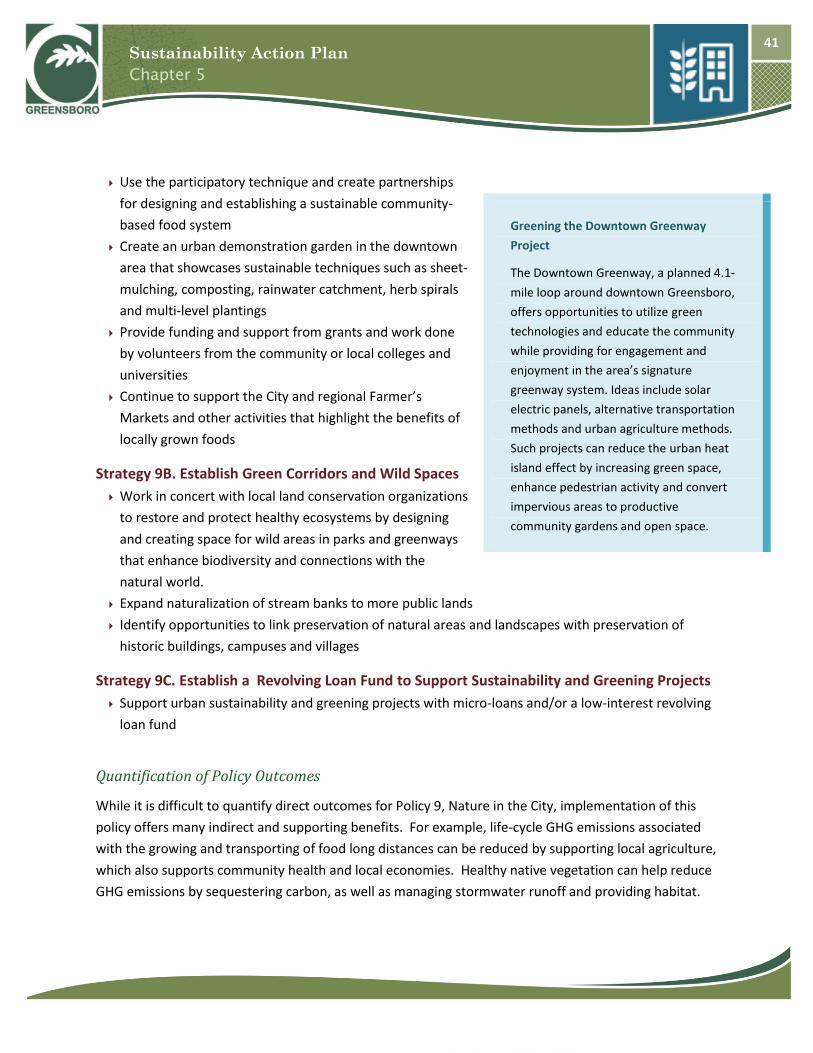
Sustainability Action Plan
Chapter 5
41
Use the participatory technique and create partnerships
for designing and establishing a sustainable community-
based food system
Create an urban demonstration garden in the downtown
area that showcases sustainable techniques such as sheet-
mulching, composting, rainwater catchment, herb spirals
and multi-level plantings
Provide funding and support from grants and work done
by volunteers from the community or local colleges and
universities
Continue to support the City and regional Farmer’s
Markets and other activities that highlight the benefits of
locally grown foods
Strategy 9B. Establish Green Corridors and Wild Spaces
Work in concert with local land conservation organizations
to restore and protect healthy ecosystems by designing
and creating space for wild areas in parks and greenways
that enhance biodiversity and connections with the
natural world.
Expand naturalization of stream banks to more public lands
Identify opportunities to link preservation of natural areas and landscapes with preservation of
historic buildings, campuses and villages
Strategy 9C. Establish a Revolving Loan Fund to Support Sustainability and Greening Projects
Support urban sustainability and greening projects with micro-loans and/or a low-interest revolving
loan fund
Quantification of Policy Outcomes
While it is difficult to quantify direct outcomes for Policy 9, Nature in the City, implementation of this
policy offers many indirect and supporting benefits. For example, life-cycle GHG emissions associated
with the growing and transporting of food long distances can be reduced by supporting local agriculture,
which also supports community health and local economies. Healthy native vegetation can help reduce
GHG emissions by sequestering carbon, as well as managing stormwater runoff and providing habitat.
Greening the Downtown Greenway
Project
The Downtown Greenway, a planned 4.1-
mile loop around downtown Greensboro,
offers opportunities to utilize green
technologies and educate the community
while providing for engagement and
enjoyment in the area’s signature
greenway system. Ideas include solar
electric panels, alternative transportation
methods and urban agriculture methods.
Such projects can reduce the urban heat
island effect by increasing green space,
enhance pedestrian activity and convert
impervious areas to productive
community gardens and open space.

Sustainability Action Plan
Chapter 5
42
5.6 Education and Outreach
While this Action Plan identifies many potential policies and strategies addressing specific topic areas
such as transportation and green buildings, successful implementation will ultimately hinge on the
community’s awareness and willingness to take action. Education and outreach efforts should integrate
with and build on existing outreach efforts through networks and partnerships, focus on building long-
term leadership and capacity in the community and provide incentives and recognition for outstanding
efforts.
The City can greatly advance the residents’ awareness of what is happening in the community and
opportunities for them to contribute by helping to identify existing local efforts and initiatives, publicize
the efforts and contributions of local individuals and organizational award recipients, and through the
City and the CSC’s own efforts.
The following section identifies key policies the City of Greensboro can adopt to encourage and support
education and outreach efforts. Each policy is supported by a number of recommended strategies.
Policy 10 – Education and Outreach:
Support development of community leadership and volunteer programs to further community
energy and sustainability efforts.
Strategy 10A. Develop Youth Energy Leadership Project
Identify youth between ages of 12 to 21 (middle school to college) through schools and community
organizations to participate in leadership development on energy and sustainability
Establish resources to train at-risk youth in practical skills for jobs such as weatherization and energy
auditing
Strategy 10B. Develop Neighborhood Leadership Program
Encourage neighborhood leaders and organizations to promote and advance green initiatives
Offer workshops and seminars to provide detailed instruction regarding energy audits and
weatherization
Support efforts with potential grants from community organizations for selected programs and
projects
Strategy 10C. Develop Environmental Educators Network for Community Education
Encourage neighborhoods and community organizations to identify volunteers to participate as
trained environmental educators in Greensboro schools, organizations and neighborhoods and as
community organizers
Sustainability Action Plan
Chapter 5
43
Involve local university and college students with interest and
skills in community assessment and organization in training and
supporting volunteers
Policy 11 – Education and Outreach:
Provide technical support, awards and recognition to
individuals and organizations furthering Greensboro’s
energy and sustainability efforts.
Strategy 11A. Provide Residential and Commercial Energy Audit Templates and Support
Include on the CSC web site a section with residential and
commercial energy audit templates (or a link to sites)
Establish residential awareness programs at City libraries and
recreation centers and pursue acquiring home energy
awareness tools, such as “kill-a-watt” type meters, for each of
the branch libraries that residents can sign out
Strategy 11B. Link with and Improve Communications with Community Non-profit Resources
Include on the CSC web site links to local non-profits that have made a sustained and compelling
contribution to the environmental health and well being of the community, as well as a calendar of
upcoming events
Have the CSC participate in the local Earth Day and similar events to help publicize organizations and
their award recipients
Encourage a local non-profit to create a web site highlighting select local environmental success
stories, awards and award recipients
Strategy 11C. Incentivize Action with Green Stars and Other Programs
Develop and issue Greensboro Green Star Certificates of Appreciation by nomination to support
local awareness of outstanding contributions
Develop and issue annual Greensboro Green Star Awards for energy/sustainability leadership for
small business, education, nonprofits, neighborhood or community action and youth projects
Communicate awards to local media and the community
Strategy 11D. Support Energy and Sustainability Outreach Coordination
Support energy outreach and coordination by City staff, including the coordination strategy
identified in the City’s EECS
Green Star Awards: Proposed Criteria
A Greensboro Green Star Awards
program would recognize recipients for:
Energy use or carbon footprint
reduction, energy efficiency, innovative
design or planning for energy efficiency
(restoration, preservation, advocacy)
Education for changing behavior related
to energy use
Sustainability into the future
Partnership development, collaboration
and inclusiveness of different groups in
the community or within a community
A youth component

Sustainability Action Plan
Chapter 5
44
Communicate best practices, support CSC efforts, provide
"Green Moments" on Channel 13, maintain a web site,
provide a speakers' bureau on energy and sustainability
topics and coordinate events and awards
Strategy 11E. Develop Education on Carbon Footprint Reduction
Create teaching “moments” focusing on practices that reduce
GHG footprints as individuals and as a community in
vegetation management, such as reducing water and energy
use associated with lawns and maintaining best tree and
plant choices for GHG reductions
Expand public-private partnerships with other organizations
and institutions to foster ecologically sustainable practices,
enhance beauty and reduce the community GHG footprint
Refer to Strategy 4E for other education and outreach
strategies
Quantification of Policy Outcomes
These education policies and their supporting strategies will, in
turn, be supported by the education measures included in the
City’s EECS. The GHG reduction benefits of education and outreach, particularly as they relate to
energy, were quantified as part of the EECS. Refer to the assumptions for Policy 3, Strategy 3A in this
Plan for an additional discussion of the benefits of education for reducing energy use and associated
GHG emissions.
Other Potential Ideas and
Best Practices
Practices that have been
developed by other cities to
reduce GHG emissions through
education and outreach
include:
Social marketing campaigns
for specific
energy/sustainability
initiatives
Energy challenge websites to
engage citizens in learning
about their own energy usage
patterns
Block parties to learn about
energy efficiency upgrade
programs

Sustainability Action Plan
Chapter 5
45
5.7 Green Technologies
The City of Greensboro has available a number of additional local green technology resources to support
the policies and strategies in this Action Plan. As this Action Plan is implemented and updated in the
future, it is recommended that the City continue to explore the following local green technologies and
resources:
Biofuels/landfill gas
Active solar hot water
Solar photovoltaics (PV)
Industrial scale waste heat recovery
Smart grid

Sustainability Action Plan
Chapter 5
46
5.8 Adaptation
In addition to taking action to reduce Greensboro’s GHG emissions and become more resource efficient
and sustainable, the City can begin to consider and plan for future scenarios under a changing climate.
While the original process of developing policies and strategies for this Action Plan did not include
adaptation as a topic area, it is becoming increasingly recognized as an important best practice to
include in community climate action and sustainability plans. Communities will likely begin to experience
the effects of climate change, if they have not already, before GHG reduction strategies are fully
implemented and begin to have their desired effect. Thus, adaptation is included here as an
introductory concept, and as an important complementary piece to the GHG reduction strategies
developed in this Action Plan.
The term “adaptation” is commonly used and generally refers to efforts that respond to the impacts of
climate change – adjustments in natural or human systems to actual or expected climate changes to
minimize harm or take advantage of beneficial opportunities. This includes identifying potential
vulnerabilities and risks, as well as developing a framework to adapt to conditions as they change over
time. In fact, with or without climate change, adapting to future trends and changes, from demographic
shifts to energy volatility, can benefit both Greensboro’s citizens and its economy in many ways
including protecting public health and benefitting from trends, such as training the work force for the
emerging clean energy economy.
Outcomes resulting from changes in Greensboro’s climate are difficult to predict, but such changes may
impact Greensboro’s infrastructure, result in changes to native vegetation and species composition such
as introduction of invasive species, impact air quality due to hotter summers and stress the regional and
state water supply. Providing a way to track and respond to such trends will benefit the community as a
whole.
The CAPAG adopted a recommendation to create a state-sanctioned Blue Ribbon Commission on
Adaptation to Climate Change to develop a comprehensive state Climate Change Adaptation Plan
identifying opportunities to address adaptation issues and risks. The City can monitor the progress of
future efforts to ensure Greensboro is part of such a state-wide coordination effort.
The following policy articulates how Greensboro can establish a framework for adapting to a changing
climate.
Policy 12 – Adaptation:
The City should develop a framework for adapting to a changing climate and integrating
adaptation into its plans, ordinances and programs.

Sustainability Action Plan
Chapter 5
47
Strategy 12A. Develop Beneficial Adaptation Strategies and Partnerships
Give priority to adaptation strategies that initiate, foster, and enhance existing efforts that
improve economic and social well-being for Greensboro’s citizens, public safety and security and
public health.
Establish and retain strong partnerships with federal, state and local governments, private
business and landowners, and non-governmental organizations to develop and implement
collaborative adaptation strategies over time.

Sustainability Action Plan
Chapter 6
48
Long-Term Goals
Sustainability Action Plan
Implement Strategies
Monitor and Share Progress
Revisit and Revise Plan
6.0 Plan
Implementation
The development of this first
Sustainability Action Plan for
Greensboro is a major step toward
reducing the community’s GHG
emissions as well as furthering
community sustainability. This Action
Plan is considered the first version of
what will be a “living document,”
subject to further review and revision as
strategies are implemented, progress is
monitored, new strategies developed
and goals revisited. The implementation
framework outlined below is intended to guide this process.
6.1 Collaborating to Support Implementation
Implementing the Action Plan will benefit from collaboration among City staff, the CSC and the
community. A next step in implementing the strategies in this Action Plan is to identify who will be
responsible for implementing them, and who can play a supporting role. The diverse nature of the
strategies in this Action Plan provides an opportunity for broad collaboration across the community in
this effort.
As discussed under many of the strategies, partnerships are a particularly important component of
implementation. Greensboro is fortunate to have many community partners with an interest in
sustainability in general, as well as specific strategies in the Action Plan. Valued partners can include
Greensboro’s many colleges, universities and other higher education institutions; non-profit and
community organizations; the business community; the building industry and professional organizations;
communities of faith; and others. Such partnerships can not only be leveraged to share resources and
expertise, they can also ensure that sustainability becomes part of the fabric of the community, and not
an effort dependent on a small handful of champions.
6.2 Developing Interim Milestones for Progress
While this Action Plan sets a GHG reduction goal for 2020, establishing interim milestones for
implementing policies and their supporting strategies will help make tangible progress toward this goal
over time. Certain strategies contained in the Action Plan could be implemented in a fairly short period
of time, while others will need to be phased over time, such as land-use planning strategies, green
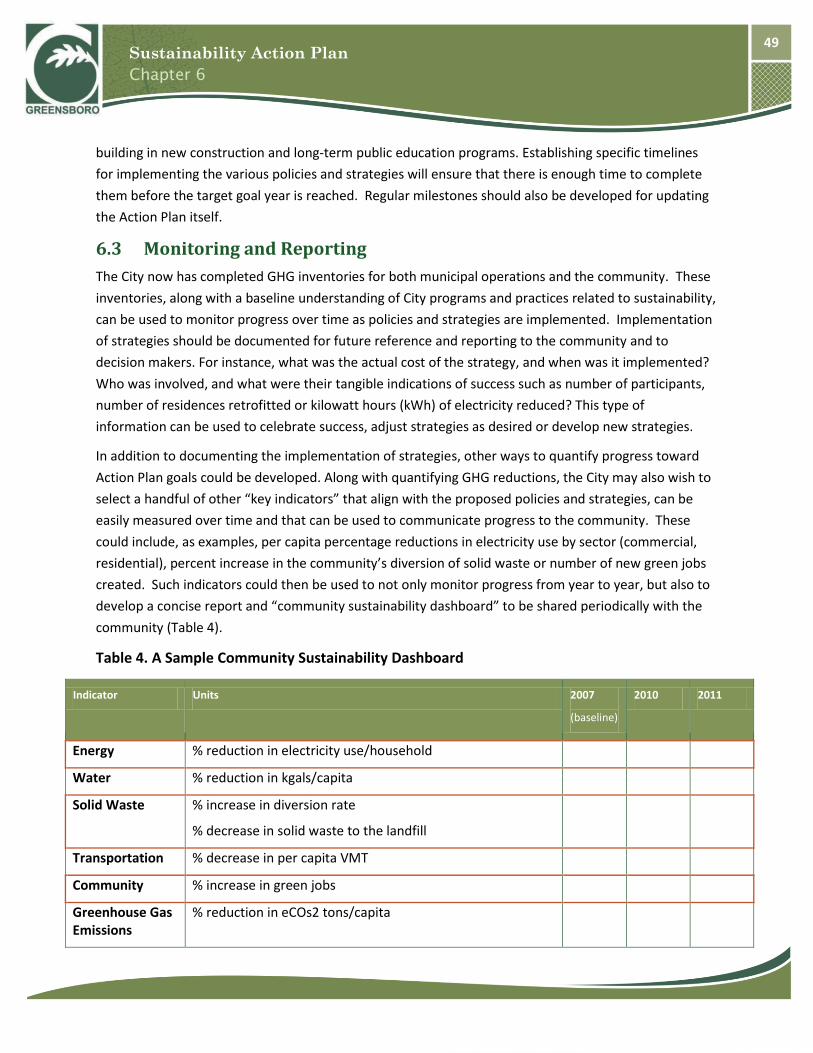
Sustainability Action Plan
Chapter 6
49
building in new construction and long-term public education programs. Establishing specific timelines
for implementing the various policies and strategies will ensure that there is enough time to complete
them before the target goal year is reached. Regular milestones should also be developed for updating
the Action Plan itself.
6.3 Monitoring and Reporting
The City now has completed GHG inventories for both municipal operations and the community. These
inventories, along with a baseline understanding of City programs and practices related to sustainability,
can be used to monitor progress over time as policies and strategies are implemented. Implementation
of strategies should be documented for future reference and reporting to the community and to
decision makers. For instance, what was the actual cost of the strategy, and when was it implemented?
Who was involved, and what were their tangible indications of success such as number of participants,
number of residences retrofitted or kilowatt hours (kWh) of electricity reduced? This type of
information can be used to celebrate success, adjust strategies as desired or develop new strategies.
In addition to documenting the implementation of strategies, other ways to quantify progress toward
Action Plan goals could be developed. Along with quantifying GHG reductions, the City may also wish to
select a handful of other “key indicators” that align with the proposed policies and strategies, can be
easily measured over time and that can be used to communicate progress to the community. These
could include, as examples, per capita percentage reductions in electricity use by sector (commercial,
residential), percent increase in the community’s diversion of solid waste or number of new green jobs
created. Such indicators could then be used to not only monitor progress from year to year, but also to
develop a concise report and “community sustainability dashboard” to be shared periodically with the
community (Table 4).
Table 4. A Sample Community Sustainability Dashboard
Indicator Units 2007
(baseline)
2010 2011
Energy % reduction in electricity use/household
Water % reduction in kgals/capita
Solid Waste % increase in diversion rate
% decrease in solid waste to the landfill
Transportation % decrease in per capita VMT
Community % increase in green jobs
Greenhouse Gas Emissions
% reduction in eCOs2 tons/capita
Sustainability Action Plan
Chapter 6
50
6.4 Funding for Ongoing Efforts
With limited funds available from City budgets, Greensboro has various other creative financing options
available for GHG emission reductions and other sustainability strategies identified in this Action Plan.
This Action Plan itself has already identified one strategy, a Cash Flow Sustainability Account, whereby
the City starts by implementing energy saving measures that have no or minimal upfront costs and then
uses money savings from these measures to establish the account. This fund can then be used, in turn,
to help fund future sustainability initiatives that require some upfront money.
Some other popular and successful financing mechanisms for local governments include grants and
performance contracts, because neither of these options rely on capital funding. While the City has
already engaged in a performance contract for its own facilities, the City should continue to pursue state
and federal grants, as well as private funding opportunities to fund implementation of Action Plan
policies and strategies. This is yet another area where partnerships can be used to leverage resources,
such as collaborating with the higher education community on grant proposals; exploring joint public-
private partnerships; and seeking out “in-kind” assistance for implementation, such as academic
research projects or volunteer programs.

Sustainability Action Plan
Glossary
51
Glossary of Terms and Acronyms
Accessory Dwelling Unit: An extra living unit on a property located either inside, attached to, or
detached from the primary home on the property.
Biomass: When referring to fuel, means plant-derived fuel including clean and untreated wood such as
brush, stumps, lumber ends and trimmings, wood pallets, bark, wood chips or pellets, shavings, sawdust
and slash, agricultural crops, biogas, or liquid biofuels, but shall exclude any materials derived in whole
or in part from construction and demolition debris.
Business-as-usual forecast: A forecast of future conditions assuming no changes to current practices.
Carbon Dioxide (CO2): The major heat-trapping gas whose concentration is being increased by human
activities. It also serves as the yardstick for all other greenhouse gases. The major source of CO2
emissions is fossil fuel combustion. Carbon dioxide emissions also result from clearing forests and
burning biomass. Atmospheric concentrations of CO2 have been increasing at a rate of about 0.5
percent a year, and are now more than 30 percent above pre-industrial levels.
Carbon Sequestration: The uptake and storage of carbon. Trees and other plants, for example, absorb
CO2 then release the oxygen while storing the carbon.
Carbon Sinks: The processes or ecological systems that take in and store more carbon than they release.
This process is called carbon sequestration. Forests and oceans are large carbon sinks.
Climate Change: A significant change from one climatic condition to another, often used in reference to
climate changes caused by increase in heat-trapping gases since the end of the 19th century.
CO2e: Carbon dioxide equivalent, a measure that is used to express the concentration of all heat-
trapping gases in terms of CO2.
CSC: Community Sustainability Council.
Density by Right: The allowable density on a parcel of land allowed under applicable land use code.
DSM: Demand-side management includes end-use measures that conserve electricity. They include
energy efficient products and design, and load management strategies.
EECBG: Energy Efficiency Community Block Grant, a federal grant program to promote energy efficiency
and conservation.
EECS: Energy efficiency and conservation strategy. Refers to a strategy required by the federal
government for allocation of a local government’s EECBG funds.

Sustainability Action Plan
Glossary
52
Embodied Energy: The total expenditure of energy involved in the creation of the buildings and
materials. In terms of a full lifecycle of a product, it can also refer to the energy that is required to
extract, process, package, transport, install, and recycle or dispose of materials and products.
Emissions: Refers to all air emissions other than GHG emissions, such as particulate matter, nitrous
oxides, etc.
EPA: United States Environmental Protection Agency.
Floor: Area Ratio: The ratio of the total floor area of buildings on a certain location to the size of the
land of that location, or the limit imposed on such a ratio. The Floor Area Ratio is the total building
square footage (building area) divided by the site size square footage (site area).
Fossil Fuel: A general term for combustible geologic deposits of carbon in reduced (organic) form. Fossil
fuels are of biological origin, and include coal, oil, natural gas, oil shales and tar sands. A major concern
is that they emit CO2 when burned, significantly contributing to the enhanced greenhouse effect.
Generation: The process of making electricity. The term may also refer to energy supply.
Greenhouse Gas (GHG): Any gas that absorbs infrared radiation (traps heat) in the atmosphere.
Greenhouse gases include water vapor, carbon dioxide (CO2), methane (CH4), nitrous oxide, (N2O),
halogenated fluorocarbons (HCFCs), ozone (O3), perfluorocarbons (PFCs), and hydrofluorocarbons
(HFCs).
HVAC: Heating, ventilation, and air conditioning.
Intentional Community: A planned residential community composed of a group of people who have
chosen to live together with a common purpose, working cooperatively to create a lifestyle that reflects
their shared core values.
KWh: Kilowatt-hour, a unit of energy typically used for electricity consumption. One kWh equals 3,412
BTU’s of energy.
LEED (-NC): The Leadership in Energy and Environmental Design program of the United States Green
Building Council. LEED-NC is a green building standard for new construction and major renovations.
MMBtu: A million British Thermal Units, a standard unit of measurement to denote heat energy in fuels.
MTCO2e: A metric ton of CO2 equivalent, a metric ton is equivalent to 1.102 short tons or 2,204 pounds.
MW, Megawatt: A measure of electricity capacity. One MW is generally sufficient to provide power to
700 to 1,000 homes.
MWh: Megawatt-hour, a unit of energy typically used for electricity consumption (1 thousand kilowatt-
hours).
PPM: Parts per million.

Sustainability Action Plan
Glossary
53
PV: Photovoltaic; a treated semiconductor material that converts sunlight to electricity.
Re-commissioning: The act of testing and adjusting existing building systems and equipment so that
they perform once again as originally designed.
Source: Any process or activity that releases into the atmosphere a greenhouse gas, an aerosol or a
precursor to a greenhouse gas.
VMT: Vehicle-miles traveled.
Weatherization: The practice of protecting a building and its interior from the elements, particularly
from sunlight, precipitation, and wind, and of modifying a building to reduce energy consumption and
optimize energy efficiency.

Sustainability Action Plan
Appendices
54
APPENDIX A: GREENHOUSE GAS INVENTORY METHODOLOGY
The first greenhouse gas (GHG) inventory for the community, Greenhouse Gas & Criteria Air Pollutant
Emissions Inventory, Greensboro, NC, was prepared by the Center for Energy Resource and Technology
at North Carolina A&T State University (hereafter referred to as CERT Inventory) and completed March
31st, 2009. This CERT Inventory was reviewed during the course of the CSC’s work and found to be a
sound foundation for benchmarking, forecasting, and goal setting. The following section outlines the
methodology of that inventory and associated results. Benchmarking conducted as an aspect of the
CSC’s work is also included.
The GHG inventory was conducted for a baseline year of 2007 using the community-oriented
methodology and software, Clear Air and Climate Protection (CACP), provided by Local Governments for
Sustainability (ICLEI). The CACP software has been used widely by cities and counties nationwide.
Deviations from this software and methodology are noted below.
The City of Greensboro’s community-wide GHG emissions in 2007 are estimated to have been 5,517,198
metric tons of carbon dioxide equivalent (MTCO2e). These emissions are the result of residential,
commercial, industrial, and institutional activities including energy consumption in buildings and
processes (e.g. lighting, heating, cooling, fans, equipment, cooking), transportation (e.g. vehicle
transportation on roads - cars, trucks and buses) and solid waste disposal.
Electricity59.9%
Natural gas13.8%
Transportation24.4%
Solid Waste1.9%
City of Greensboro 2007 Emission Sources(community-wide)
5,517,198 Metric Tons CO2e

Sustainability Action Plan
Appendices
55
Electricity and Stationary Fuel Combustion
Data Source(s): Consumption data from Duke Energy (electricity) and Piedmont Natural Gas (via CERT
Inventory)
Methodology: CACP
Comments: Electricity emission factors in ICLEI are out-of-date with respect to newer data available
from the Environmental Protection Agency’s eGRID that may be more relevant to 2007 year inventories.
Using ICLEI factors will be consistent with other ICLEI communities, and appropriate for benchmarking,
but may underestimate emissions with respect to newer emission factors. Kerosene and fuel oil
consumption would represent less than 1/10 of 1 percent of Greensboro’s emissions, assuming
consumption is uniform state-wide on a per capita basis, and are therefore excluded from the inventory.
Emissions Summary
Sector Fuel Total Energy
(MMBtu)
GHG Emissions
(MTCO2e)
Residential Electricity 5,456,746 1,054,325
Residential Natural gas 5,764,050 323,068
Commercial Electricity 8,096,659 1,564,396
Commercial Natural gas 4,455,000 249,698
Industrial Electricity 3,537,277 683,636
Industrial Natural gas 3,383,589 189,647
TOTAL 30,693,321 4,064,770
*Most municipal and institutional uses are included under the Commercial sector.
Possible Benchmarking Metrics
Sector Greensboro Metric Comparison (s)
Residential Square footage of residential buildings not
available.
33.9 MMBtu/square foot (region)
38.8 MMBtu/square foot (climate zone)
101.2 MMBtu/household 76.1 MMBtu/household (region)
76.4 MMBtu/household (climate zone)
Commercial Square footage of commercial buildings
not available.
89.0 MMBtu/square foot, all buildings in
this climate zone and region
Industrial Normalized benchmarks for the industrial sector tend to be less meaningful because of
the broad range of processes and energy intensities found in this sector.
Benchmarks are from the Energy Information Administration’s Residential and Commercial Building
Energy Consumption Survey

Sustainability Action Plan
Appendices
56
Transportation
Data Source(s): Vehicle miles travelled (VMT) and vehicle type distribution from North Carolina
Department of Natural Resources (NCDR) for Guilford County
Methodology: CACP
Comments: The CERT Inventory apportions VMT in Guilford County to Greensboro on the basis of
population (53.1 %). This probably yields a reasonable estimate of emissions when combined with the
methodology in CACP and will be easily replicable and comparable to other communities using CACP.
Furthermore, it is the best approach available with current modeling data. Two considerations for
future inventories, when improved modeling data and tools are available, are other approaches to
apportioning VMT in Guildford County to Greensboro and the appropriateness of the vehicle mix
fraction in the ICLEI model.
Another approach to apportioning VMT would be to consider the transportation model’s fraction of
urban VMT (85%) and then apportion that fraction of the total County VMT to urban areas based on
their populations. Using this approach the VMT per capita in Greensboro increases to about 10,070
which is more consistent with national average.
The vehicle type distribution provided by NCDR does not readily map into the vehicle type categories in
CACP. CACP’s default distribution may overestimate emissions because it has a higher percentage of
VMT in the light gasoline truck class than is suggested by the NCDR distribution of vehicles.
Emissions Summary
Fuel Total Energy
(MMBtu)
GHG Emissions
(MTCO2e)
Gasoline 14,336,617 1,111,739
Diesel 2,991,549 235,559
TOTAL 17,328,166 1,347,298
Possible Benchmarking Metrics
Greensboro Metric Comparison (s)
9,255 VMT/capita (this study)
~10,070 VMT/capita (apportion VMT by
urban/rural first, then by Greensboro’s
fraction of the urban population)
11,433 VMT/capita for North Carolina
(Bureau of Transportation Statistics)
10,045 VMT/capita for United States
(Bureau of Transportation Statistics)
10,083 VMT/capita for United States
(Brookings Institution)

Sustainability Action Plan
Appendices
57
Greensboro Metric Comparison (s)
10,198 VMT/capita (Brookings Institution
for Greensboro-High Point, NC)
Greensboro-High Point ranks 54 out of the
top 100 metropolitan areas (by
employment) for VMT/capita
Solid Waste
Data Source(s): City of Greensboro Environment Services Department (CGESD)
Methodology: CACP
Emissions Summary
Total MSW Disposed in
Landfill
(tons)
GHG Emissions
(MTCO2e)
199,400 105,094
Possible Benchmarking Metrics
Greensboro Metric Comparison (s)
3.11 lbs/person/day discards to landfill
after recovery
3.08 lb/person/day discards to landfill
after recovery or combustion for energy,
national average from EPA
4.95 lb/person/day MSW generation
before recovery, from data in 2004-05 Key
Trends and Indicators
4.62 lb/person/day MSW generation
before recovery, national average from
EPA
27% diversion rate in 2004-05 33% diversion rate, national average from
EPA
1.45 tons/year/capita 1.35 tons/year/capita Guilford County
targeted per capita disposal rate
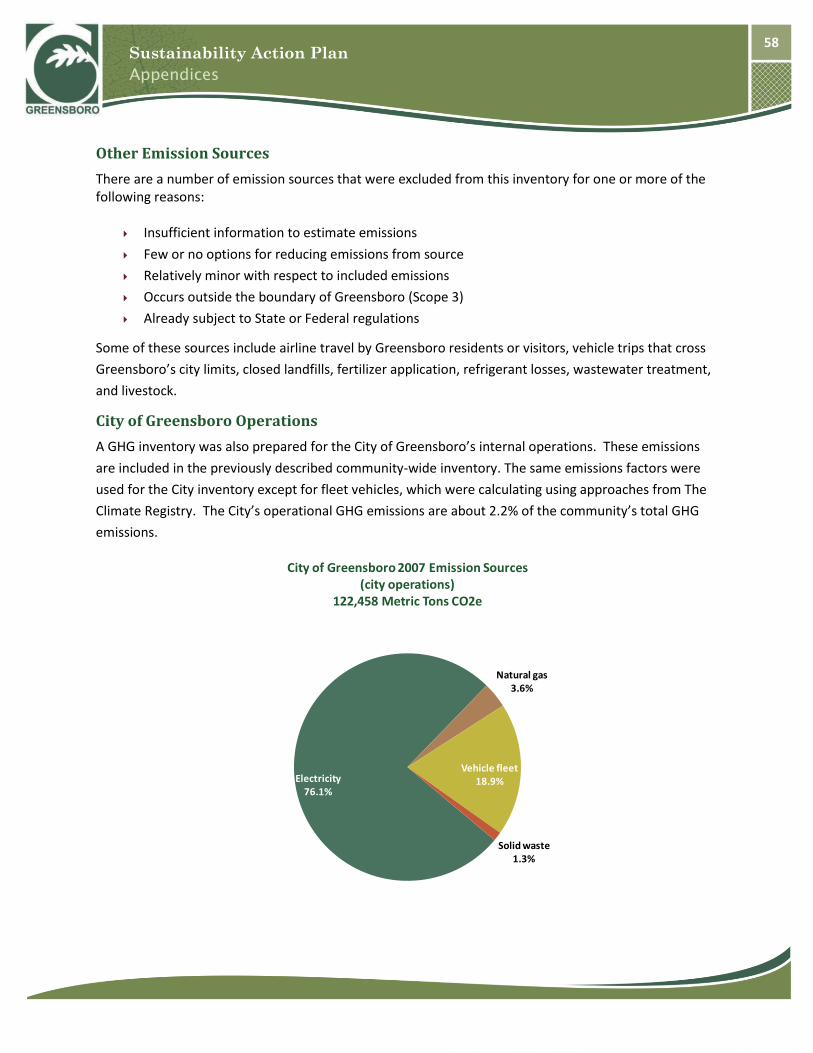
Sustainability Action Plan
Appendices
58
Other Emission Sources
There are a number of emission sources that were excluded from this inventory for one or more of the following reasons:
Insufficient information to estimate emissions
Few or no options for reducing emissions from source
Relatively minor with respect to included emissions
Occurs outside the boundary of Greensboro (Scope 3)
Already subject to State or Federal regulations
Some of these sources include airline travel by Greensboro residents or visitors, vehicle trips that cross
Greensboro’s city limits, closed landfills, fertilizer application, refrigerant losses, wastewater treatment,
and livestock.
City of Greensboro Operations
A GHG inventory was also prepared for the City of Greensboro’s internal operations. These emissions
are included in the previously described community-wide inventory. The same emissions factors were
used for the City inventory except for fleet vehicles, which were calculating using approaches from The
Climate Registry. The City’s operational GHG emissions are about 2.2% of the community’s total GHG
emissions.
Electricity76.1%
Natural gas3.6%
Vehicle fleet18.9%
Solid waste1.3%
City of Greensboro 2007 Emission Sources(city operations)
122,458 Metric Tons CO2e
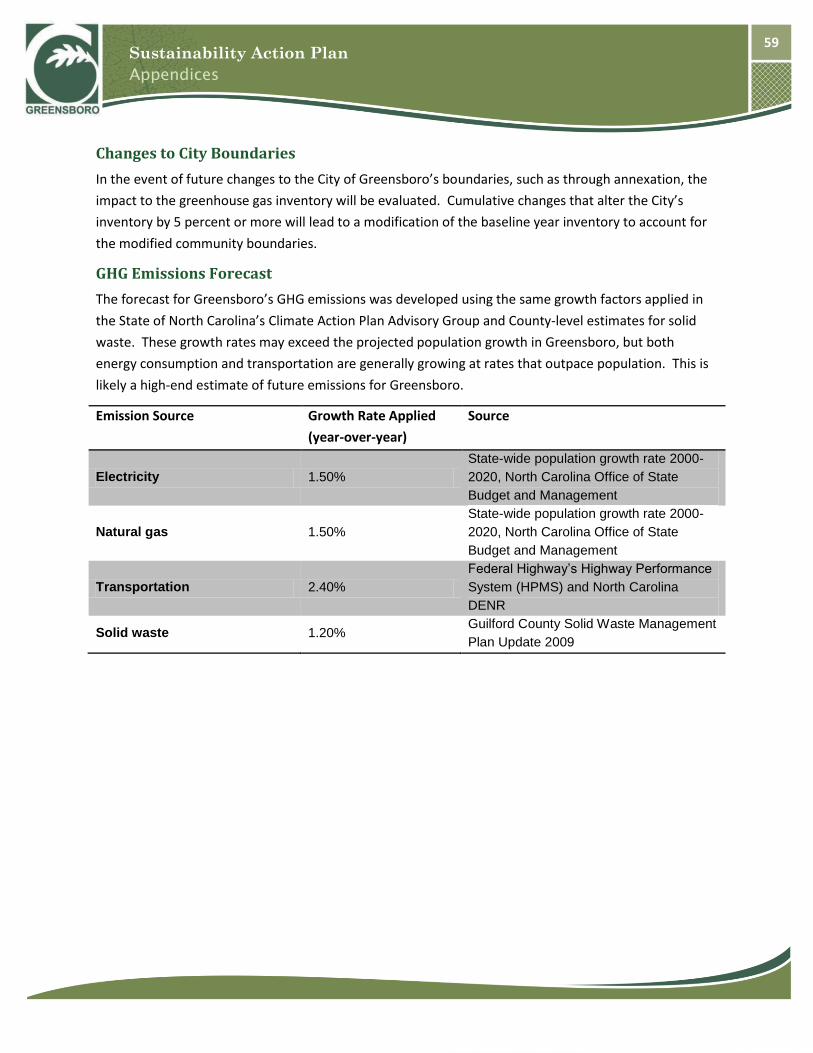
Sustainability Action Plan
Appendices
59
Changes to City Boundaries
In the event of future changes to the City of Greensboro’s boundaries, such as through annexation, the
impact to the greenhouse gas inventory will be evaluated. Cumulative changes that alter the City’s
inventory by 5 percent or more will lead to a modification of the baseline year inventory to account for
the modified community boundaries.
GHG Emissions Forecast
The forecast for Greensboro’s GHG emissions was developed using the same growth factors applied in
the State of North Carolina’s Climate Action Plan Advisory Group and County-level estimates for solid
waste. These growth rates may exceed the projected population growth in Greensboro, but both
energy consumption and transportation are generally growing at rates that outpace population. This is
likely a high-end estimate of future emissions for Greensboro.
Emission Source Growth Rate Applied
(year-over-year)
Source
Electricity 1.50%
State-wide population growth rate 2000-
2020, North Carolina Office of State
Budget and Management
Natural gas 1.50%
State-wide population growth rate 2000-
2020, North Carolina Office of State
Budget and Management
Transportation 2.40%
Federal Highway’s Highway Performance
System (HPMS) and North Carolina
DENR
Solid waste 1.20% Guilford County Solid Waste Management
Plan Update 2009
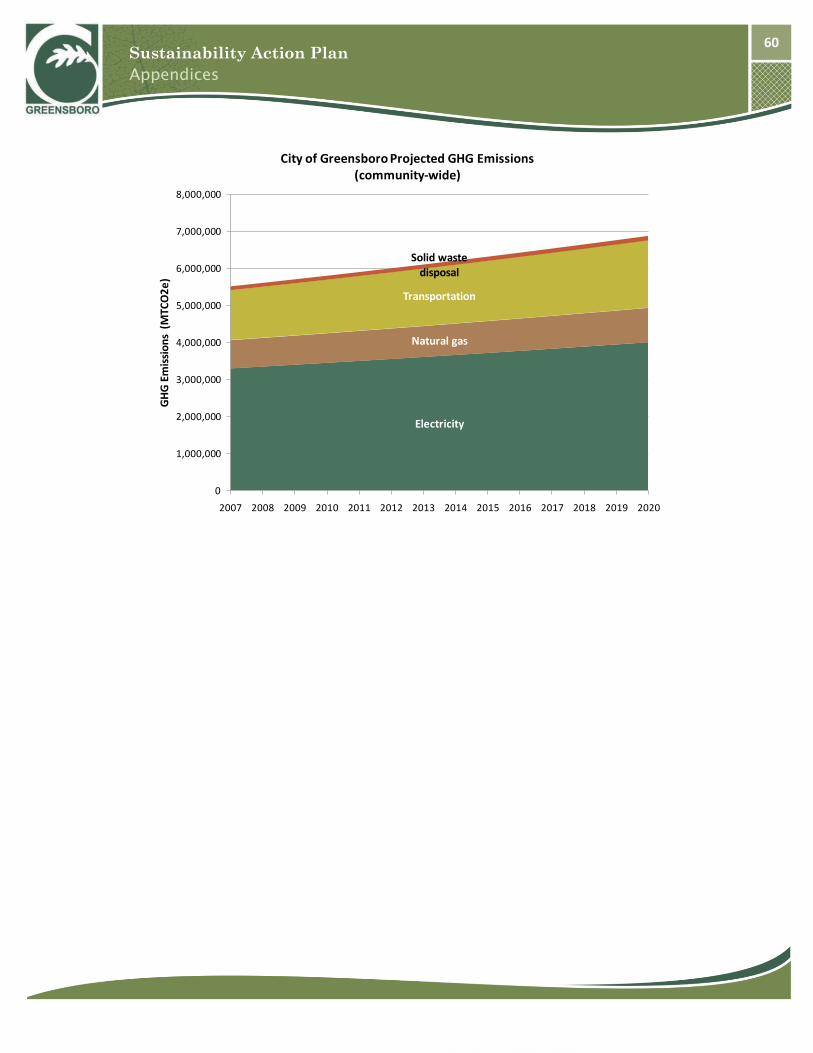
Sustainability Action Plan
Appendices
60
Electricity
Natural gas
Transportation
Solid waste disposal
0
1,000,000
2,000,000
3,000,000
4,000,000
5,000,000
6,000,000
7,000,000
8,000,000
2007 2008 2009 2010 2011 2012 2013 2014 2015 2016 2017 2018 2019 2020
GH
G E
mis
sio
ns
(MTC
O2
e)
City of Greensboro Projected GHG Emissions(community-wide)

Sustainability Action Plan
Appendices
61
APPENDIX B: FULL TEXT OF COMMUNITY SUSTAINABILITY
COUNCIL REPORTS (VIRTUAL APPENDIX)
During preparation of the Sustainability Action Plan in 2009-2010, a series of reports were prepared by sub-committees to the CSC to support development of the policies and strategies in this Plan. Specifically, these sub-committees addressed the following topics: Land Use and Transportation
Green Jobs and Buildings
Recycling and Waste Reduction
City Operations
Nature in the City
Education and Outreach
Green Technologies – in progress
You can read copies of these sub-committee reports and learn more about the Sustainability Action Plan
and activities of the CSC by visiting the CSC website at: http://www.greensboro-
nc.gov/citygovernment/sustainability/.

Sustainability Action Plan
Appendices
62
APPENDIX C: DEVELOPMENT OF COST ESTIMATES FOR
POLICIES
In Section 5.0, Sustainability Action Plan Policies and Strategies, the following table is presented to convey the estimated cost of implementation, cost savings, and greenhouse gas reductions associated with the recommended policies and strategies. This Appendix elaborates on the assumptions stated in Section 5.0 to better document the process of estimating the costs and cost savings for these policy topics.
Policy Topic Minimum Cumulative Cost to Implement by 2020
(as proposed case only)
Minimum Cumulative Cost Savings by 2020
(as proposed case only)
GHG Reductions in 2020
[MTCO2e]
(as proposed, fully implemented)
Percentage Reduction of Business-as-usual GHG Emissions in 2020
(as proposed, fully implemented)
Transportation and Land Use $3,600,000 $17,600,000 181,000 - 403,000 2.6% - 5.9%
Green Jobs and Buildings $2,900,000 $4,000,000 67,000 - 204,000 1.0% - 3.0%
Waste Reduction and Recycling
$2,300,000 $2,300,000 6,000 - 12,000 0.1% - 0.2%
City Operations $500,000 $600,000 13,000 - 22,000 0.2% - 0.3%
SUBTOTAL $9,300,000 $24,500,000 267,000 - 641,000 3.9% - 9.3%
Funded EECS Strategies $3,100,000 $4,570,000 9,000 - 9,000 0.1% - 0.1%
TOTAL $12,400,000 $29,070,000 276,000 - 650,000 4.0% - 9.4%
**Notes: Numbers in the above table may not sum exactly due to rounding. No direct GHG reduction benefits from Nature and
the City were quantified. The benefits of Education and Outreach are included under the Funded EECS Strategies. See
Sections 5.5 and 5.6 of the Action Plan for further discussion. Only a portion of Funded EECS Strategies are assumed to still be
in effect in 2020.
This Appendix only includes strategies for which costs and cost savings were estimated. Costs and cost savings were not estimated for the unlisted strategies due to lack of available information on which to base an estimate or because the cost and cost savings for the strategy are already captured by another strategy or one of the funded EECS strategies.

Sustainability Action Plan
Appendices
63
Transportation and Land Use
Policy 2: Strategy 2A.
Individualized marketing of transit and alternative transportation services is the basis of this strategy.
The cost of implementing this strategy is based on reaching 120,000 households in Greensboro over five
years. The Portland SmartTrips program delivered individualized transit marketing to households for
$30 per householdxvi. Therefore, the cost of achieving similar marketing for Greensboro is estimated to
be 120,000 households * $30/household = $3,600,000.
Individualized marketing of transit services in a number of communities resulted in an average VMT
reduction of about 7 percentxvii. Assuming that a 7 percent VMT reduction is achieved over a 5-year
program roll-out, with one-fifth of households receiving marketing each year, the annual VMT reduction
would be approximately 2,900,000,000 VMT/yr (2020 est.) * 7 percent * (24,000 households/120,000
households year) = 39,000,000 VMT/yr.
While strict fuel cost savings are as much as $0.13/mile (based on $2.64/gallon of fuel and 19.7
miles/gallon), cost savings are estimated to be $0.03/mile for reduced VMT to account for the additional
costs associated with other modes including transit passes, the purchase of a bike and associated
equipment, etc. At this conservative rate of savings, the annual cost savings is 39,000,000 VMT/yr
*$0.03/VMT = $1,200,000/yr. Cumulative performance of the strategy over 5-years would proceed as
follows:
Year
Total
Households
Annual
VMT Reduction
(Million VMT)
Annual
Cost Savings
(Million Dollars)
Cumulative
Cost Savings
(Million Dollars)
1 24,000 39 $1.2 $1.2
2 48,000 78 $2.3 $3.5
3 72,000 117 $3.5 $7.0
4 96,000 157 $4.7 $11.7
5 120,000 196 $5.9 $17.6
The total cumulative cost savings over 5-years are estimated to be $17,600,000.

Sustainability Action Plan
Appendices
64
Green Jobs and Buildings
Policy 3: Strategy 3A.
Research indicates that education alone can result in 5 to 30 percent energy savingsxviii.
The cumulative cost to implement an educational outreach program is estimated to be equivalent to
one full-time employee at $75,000/yr * 10 yr = $750,000.
Based on programs in other communities, the “As Proposed” case assumes an adoption rate of 2.5
percent for the efforts to promote existing energy conservation programs and an energy savings of 5
percent for participants. Cost savings are based on typical energy rates, which are conservatively
estimated at $0.04/kWh and $10/Dth.
Electricity: 1,940,000,000 kWh/yr (est. 2020) *2.5 percent * 5 percent *$0.04/kWh =$97,000/yr
Natural Gas: 7,000,000 Dth/yr (est. 2020) *2.5 percent * 5 percent *$10/Dth = $87,000/yr
Annual savings for electricity and natural gas are approximately $184,000 ($97,000 + $87,000). Over the
course of 10-years, the cumulative savings would be approximately $1,840,000.
Policy 3: Strategy 3B.
The cost of assessment program is estimated to be $250/household based on assessment programs
offered by other utilities nationwide: 250 households/yr * $250/household * 10 yr = $625,000.
The cost of the additional outreach and implementation support to achieve compact fluorescent lamp
(CFL) and efficient heating, ventilation and air conditioning (HVAC) system upgrades, with community-
wide penetrations of an additional 0.8 and 0.2 percent per year, and assuming an average upgrade cost
of $150/household: 100,000 households *(0.8+0.2) percent/yr *$150/household * 10 yr = $1,500,000.
Assessments are anticipated to achieve energy savings of 5 percent per household per year. Cost
savings are based on typical energy rates.
Electricity:
53 MMBtu/household (CERT) * 5 percent *250 households/yr * $0.04/kWh * 10^6 Btu/MMBtu / 3,413
Btu/kWh = $8,000/yr
Natural Gas:
56 MMBtu/household (CERT) * 5 percent *250 households/yr * $1/Therm* 10 Therm/MMBtu =
$7,000/yr
The annual cost savings from assessments is $15,000 ($8,000 + $7,000).
The savings from increased penetration of CFLs and HVAC upgrades are estimated to be 2.5 percent and
10 percent, for electricity and natural gas respectively, per household.

Sustainability Action Plan
Appendices
65
Electricity:
53 MMBtu/household (CERT) *100,000 households * 0.8 percent penetration*2.5 percent savings *
$0.04/kWh * 10^6 Btu/MMBtu / 3,413 Btu/kWh = $12,000/yr
Natural Gas:
56 MMBtu/household (CERT) * 100,000 households * 0.8 percent penetration*10 percent savings *
$1/Therm* 10 Therm/MMBtu = $11,000/yr
The total annual cost savings from audits and implementation support are approximately $40,000
($15,000 + $12,000 + $11,000). The cumulative savings are expressed in the following table
Year Cumulative Savings
($)
1 $40,000
2 $80,000
3 $120,000
4 $160,000
5 $200,000
6 $240,000
7 $280,000
8 $320,000
9 $360,000
10 $400,000
Total $2,200,000
The total cost of strategies under Green Jobs and Buildings is $2,900,000 ($750,000 + $625,000 +
$1,500,000). The total cost savings are approximately $4,000,000 ($2,200,000 + $1,840,000)

Sustainability Action Plan
Appendices
66
Waste Reduction and Recycling
Policy 7: Strategy 7B, 7C and 7D.
These strategies are collectively assumed to be capable of reducing emissions from solid waste
generation by at least 5 percent.
The cost to implement efforts such as increasing the number of recycling drop-off sites, mandatory
recycling, and incentive programs that can lead to this level of increase in diversion vary widely by
community from cost reductions of up to 15 percent to cost increases of up to 20 percent over current
diversion program costs. It was assumed that the City’s adopted recycling program budget for 2009-
2010 would increase by 5 percent and that those funds would be required each year to maintain
diversion levels: $4,531,710 budget * 5 percent * 10 yr= $2,300,000.
Savings are the result of the cost difference between recycling ($21/ton) and landfill disposal ($41/ton).
For a 5 percent reduction in landfilled material: 232,000 tons waste (est. 2020) * 5 percent * $20/ton
savings * 10 yr = $2,300,000.
City Operations
Policy 8: Strategy 8D.
The benefits of re-commissioning have been generally estimated to be between 5 and 30 percent
energy savings by a number of sources, such as the federal Environmental Protection Agency’s ENERGY
STAR programxix.
The cost to implement recommissioning is estimated to be $0.25/square foot of building space and
recommissioning is estimated to be applicable for approximately 2 million square feet of City buildings:
2,000,000 sq. ft. * $0.25/sq. ft. = $500,000.
The “As Proposed” and “Fully Implemented” cases assume that 40 and 70 percent, respectively, of
electricity and natural gas consumption in City buildings are consumed for heating and cooling uses
based on data from the Commercial Buildings Energy Consumption Survey. It is estimated,
conservatively, that 7 percent of this consumption will be saved through re-commissioning. Cost savings
are based on average utility rates for the City.
Electricity: 30,000,000 kWh for City * 40 percent * 7 percent *$0.05/kWh = $40,000
Natural Gas: 300,000 therms for City * 70 percent * 7 percent *$1.14/therm = $20,000
Annual savings for electricity and natural gas are approximately $60,000 ($40,000 + $20,000). Over the
course of 10-years, the cumulative savings would be approximately $600,000.

Sustainability Action Plan
Appendices
67
Endnotes
i Appalachian State University Energy Center. (2008) Secondary Economic Impact Analysis of Greenhouse Gas Mitigation Options for North Carolina Prepared for the Center for Climate Strategies, Washington, D.C.
ii U.S. Conference of Mayors Climate Protection Agreement: http://www.usmayors.org/climateprotection/agreement.htm
iii As an example, a policy/strategy as proposed may result in GHG reductions from retrofitting of 1,000 homes with more energy efficient equipment. A “full implementation” scenario would assume retrofitting of all of Greensboro’s homes.
iv Johnston, Robert A. (2006) Review of U.S. and European Regional Modeling Studies of Policies Intended to Reduce Motorized Travel, Fuel Use, and Emissions. Victoria Transportation Policy Institute, Victoria, BC.
v Victoria Transportation Policy Institute: http://www.vtpi.org/tdm/tdm23.htm
vi Walkinginfo.org: http://www.walkinginfo.org/library/details.cfm?id=3961
vii U.S. Green Building Council. (2009) Green Buildings for Cool Cities: A Guide for Advancing Local Green Building Policies. http://www.usgbc.org/ShowFile.aspx?DocumentID=6445
viii Doppelt, Bob and Markowitz, Ezra M. (2009) Reducing Greenhouse Gas Emissions through Behavioral
Change: An Assessment of Past Research On Energy Use, Transportation and Water Consumption.
Climate Leadership Initiative Institute for a Sustainable Environment, University of Oregon, Eugene, OR.
ix U.S. Department of Energy. (2009) Impacts of the 2009 IECC for Residential Buildings at State Level. Pacific Northwest National Laboratory, Richland, WA.
x U.S. Department of Energy. (2009) Impacts of Standard 90.1-2007 for Commercial Buildings at State
Level. Pacific Northwest National Laboratory, Richland, WA.
xi Davis Langdon. (2007) The Cost of Green Revisited: Reexamining the Feasibility and Cost Impact of Sustainable Design in the Light of Increased Market Adoption. Davis Langdon US, www.davislangdon.com.
xii http://www.epa.gov/climatechange/wycd/waste/downloads/greengas.pdf.
xiii Savings from the City’s current Energy Performance Contract would not be included in the account.
xiv U.S. Green Building Council. (2009) Leadership in Energy and Environmental Design for New Construction (LEED-NC) Checklist. www.usgbc.org.
xv http://www.energystar.gov/ia/business/BUM_recommissioning.pdf

Sustainability Action Plan
Appendices
68
xvi Walkinginfo.org: http://www.walkinginfo.org/library/details.cfm?id=3961
xvii Victoria Transportation Policy Institute: http://www.vtpi.org/tdm/tdm23.htm
xviii Doppelt, Bob and Markowitz, Ezra M. (2009) Reducing Greenhouse Gas Emissions through Behavioral
Change: An Assessment of Past Research On Energy Use, Transportation and Water Consumption.
Climate Leadership Initiative Institute for a Sustainable Environment, University of Oregon, Eugene, OR.
xix http://www.energystar.gov/ia/business/BUM_recommissioning.pdf


