Page 1
This is a repository copy of Sustainability analysis of Chinese transport policy.
White Rose Research Online URL for this paper:http://eprints.whiterose.ac.uk/2010/
Article:
Mao, B. and Chen, H. (2001) Sustainability analysis of Chinese transport policy. International Journal of Sustainable Development and World Ecology, 8 (4). pp. 323-336. ISSN 1745-1604
[email protected] ://eprints.whiterose.ac.uk/
Reuse
See Attached
Takedown
If you consider content in White Rose Research Online to be in breach of UK law, please notify us by emailing [email protected] including the URL of the record and the reason for the withdrawal request.
Page 2
White Rose Research Online
http://eprints.whiterose.ac.uk/
Institute of Transport StudiesUniversity of Leeds
This is an author produced version of a paper published in the International Journal of Sustainable Development and World Ecology. This paper has been peer-reviewed but does not include final publisher proof-corrections or journal pagination. White Rose Research Online URL for this paper: http://eprints.whiterose.ac.uk/2010/
Published paper Mao B.; Chen, H. (2001) Sustainability Analysis of Chinese Transport Policy. International Journal of Sustainable Development and World Ecology, 8(4), pp.323-336.
White Rose Consortium ePrints Repository [email protected]
Page 3
Sustainability analysis of Chinese transport policy
Baohua Mao
School of Traffic and Transportation, Northern Jiaotong University,
Beijing 100044, P. R. China
Haibo Chen*
Institute for Transport Studies, University of Leeds, Leeds LS2 9JT, UK
Headline title: Chinese Transport
Keywords: Chinese transport, sustainability, transport policy, energy consumption,
and environment protection.
*Corresponding author: Dr Haibo Chen,
Institute for Transport Studies, University of Leeds, Leeds LS2 9JT, UK
Tel: (+44) 0113 2335341, Fax: (+44) 0113 2335334
Page 4
2
SUMMARY: Whilst the world economy is developed, the life and development of
human beings have been threatened by the imbalance among environmental and
ecological aspects. Thus sustainability is becoming increasingly the focus of
various social fields. For most developing countries, a strategy with good
sustainability for social development is of long-term significance to keep the
economy in expansion. This paper first reviews the conceptual framework and
up-to-date development of sustainability. Second, it reviews the current transport
situation of China and its future demands. Third, the paper analyses transport policy
from the viewpoints of energy consumption and environment pollution caused by
transportation. It finally summarises suggestions for transport policy that China
should consider in the future.
INTRODUCTION
Since the 1980s, many issues on environmental and economical fields have arisen
with the expansion of world population and the development of the world economy,
as it is important to maintain the quality of human life in social ecological and
environmental aspects. Sustainability has certainly played an important role in
decision making at national and even international levels (Masser et al, 1993; Ono,
1993; OECD/ECMT, 1995; Mao, 1996).
The Brundtland Commission (WECD, 1987) in Our Common Future defined
sustainable development as �development that meets the needs of the present
without compromising the ability of future generations to meet their own needs�.
The European Conference of Ministers of Transport pointed out in 1995 that road
construction may make more people travel by car but with very limited
improvement on the relaxation of peak-hour traffic congestion (OECD/ECMT,
1995). Transport is in nature an unsustainable activity for the following two reasons
(Buchanan et al., 1997). First, the infrastructure and many factors (such as land,
architecture materials and petroleum) dealing with transport operations use
non-renewable resources. Second, the transport process is responsible for great
pollution, damages irreplaceable resources and also leads to long-term
environmental change. It is believed that sustainability policy is far from being
achieved, especially in developing countries. In most of these countries,
sustainability has not been considered as an important issue either in transport or in
transports planning (Mao, 1996). A sustainable transport policy may be achieved
only when economic development and long-term environmental and ecological
considerations have been combined in the transport decisions.
As the basis of global sustainable development, an agenda towards the twenty-first
Page 5
3
century was set up at the United Nations Conference on Environment and
Development (UNCED) in June 1992, with the agreement of 150 countries. The
overall objective for sustainable development was defined as �improving the social,
economic and environmental quality of human beings as well as the living and
work environments of all people�. Obviously sustainability has been a world-wide
problem. We will analyse the characteristics of transport sustainability, with a focus
on Chinese transport and discuss possible policies to improve transport
sustainability. Our main interest in this paper is to carry out a case study of China.
Our conclusions on Chinese transport sustainability are given, together with
suggestions for transport policy that China should take in the future.
ANALYSIS OF TRANSPORT SUSTAINABILITY
Traffic congestion
Traffic congestion is the most important target of all transport decisions to balance
the relationship between the demand and supply in a transport system so as to relax
the traffic congestion. Vehicle speed in the central urban areas of many Chinese
cities has been decreased greatly over the past decades (Mao et al., 1999). For
example, the average speed of public vehicles fell to 12.9 km/h in Guangzhou in
1999. In many other big cities, vehicle speed is lower than 10 km/h during peak
hours.
Air pollution
NOx produced in combustion is harmful to human health and possibly leads to
smog and acid rain. The World Health Organisation (1987) gave a density value of
about 0.04 to 0.06 ppm for daily NO2 in urban areas. However, this standard is not
yet maintained in most Chinese cities. Statistics show that, in Beijing, the CO2
emission from vehicles was over 50% of the total CO2 emission in the 1980s (CTI,
1998). This figure continues to increase with the expansion of transport demand.
Traffic noise
Many populations near railway lines and trunk roads are exposed to an environment
of worse than third level, with more than 65 decibels of noise in China (GBEPC,
1999). Much of the noise is generated by transport, including the tremors caused by
heavy-loaded cars as well as loading and unloading operations at night.
Road safety
Currently, about 75 000 people die and more than 174 000 people are injured each
year in traffic accidents in China. In the 15 EC countries, the annual deaths are 44
Page 6
4
000, although the accident rates per car kilometre are high in Portugal and Greece.
Urban space and scenery
The construction of new transport infrastructure inevitably occupies urban space
and also damages urban sightseeing. For future development, urban space has been
a key problem as population density is increasing and space is reducing.
Land use
Land use has greatly changed car ownership and travelling patterns. At present, the
motorization of China is not so high. However, the land available for each urban
resident makes it more difficult to construct transport facilities such as roads and
parking once car ownership increases.
Global warming
CO2 is a very important and a contributing source to global warming. It is estimated
that 25% of CO2 in the world is produced by transport (Prades et al., 1996). Many
developed countries have been searching for management strategies to control the
transport emissions. However, the situations in some developing and
rapidly-motorising countries are not optimistic. Data in 1994 showed that the CO2
emitted in China was 13.4% of the total emissions, whereas the number of vehicles
in China accounted for only 1.7% of the total vehicles in the world (CTI, 1998).
Energy consumption
Energy consumption by industry has been reduced since the first petroleum crisis.
However, energy consumed by transport has become greater with the development
of highway transportation. For example, transport energy consumption is 30% of
the total consumption among EC countries. Even though the oil crisis seems to have
been relaxed since the second oil crisis in 1978, the demand of road transport from
developing countries will increase the conflict between energy production and
supply.
Urban deconcentration
The development of motorised transport has led to the expansion of travel distance
and journey time that deconcentrates residents as well as their travel demands.
Urban deconcentration reversibly increases the dependence of people on private
cars and limits the development of public transport.
Experts have pointed that rail transit systems have better characteristics on energy
consumption and pollution emissions (Gercek and Tekin, 1996). The efforts to
Page 7
5
improve transport sustainability may include these three aspects, namely
technology, policy and city planning and landuse, as described below.
Technology
Transport sustainability can be improved by (1) reducing the environmental
emissions of vehicles and (2) improving the efficiency on energy utility and
transmission. China has speeded up the studies of substituent fuels for vehicles
since 1990. One achievement of these studies was that a few thousand natural
gas-fuelled public vehicles were manufactured and used for public transport
services in Beijing (Yang and Zhang, 1993). However, many experts argue that the
improvements in combustion efficiency and emission control would not help in
finally solving the traffic congestion problem caused by increasing demand
(OECD/ECMT, 1995; Buchanan et al., 1997). In addition, tele-communications
have also been regarded as a long-term way to reduce the amount of travels.
Policy
Government policies have significant effects on transport market share (Banister,
1994). There are indeed many ways for governments to implement their policies:
(1) Controlling the transport network by various transport investment schemes
which would affect customers� choices.
(2) By taking account of some extra costs, such as traffic congestion and
environmental pollution, governments may establish different taxes and price
policies which would change the selections of customers.
(3) By subsidy, some transport modes may obtain priority to be developed.
(4) By restrictions to some infrastructure, such as city centre and car parking,
governments may affect the choices of passengers.
Owens (1995) noticed a recent change of the role of transport policy on practice
from �prediction-supply� to �prediction-protection�. The argument on how to
include the whole social costs in customer price has become one of the most
interesting topics. Policy for sustainable transport is, therefore, to maximise the
accessibility within a network, subject to environmental constraints. Button and
Verhoef (1998) advanced the concept of real transport price and pointed out the
necessity of converting the extra price into the inner one. Bansiter (2000) pointed
out that the common sense on un-sustainability caused by the increase of transport
volume was achieved in European countries and most transport professionals have
Page 8
6
agreed that traffic congestion could not be solved completely by road investments.
Many strategies have been proposed to discourage the use of private cars. It is
difficult at this stage to coordinate the strategic inconsistency among political and
public targets.
City Planning and Landuse
There is an interactive relationship between urban planning and transport.
Transport influences the urban form during its development and urban style also
has a great effect on transport performance, both on mode choices of users and
transport network constructions. For example:
(1) Different land use itself may change private car use and be helpful to its
transformation to public transport, cycling and walking.
(2) Encouragement and guidance to use public transport should be made for the
public in their preferences. These measurements include separated bus lanes,
car ban network with park and ride in city centres. The fuel consumption will
be reduced by about 13% when 8% of private car passengers shift to other
modes.
(3) Compact city planning may limit the land available so as to enlarge the density
of landuse in present urban areas. Industrial and commercial houses may be
established in those planning areas to form multi-purpose zones that make
work and service more accessible to residents.
(4) It would lead to greater energy saving if the mid-level income group changes
from low-rise buildings to high, efficient buildings and from private cars to
public transport. This saving becomes less for the low income group. The high
income group, however, can afford the additional fees additional for car use
and would occupy larger and more luxurious houses.
CASE ANALYSIS OF CHINA
Sustainable transport issues in developing countries are not the same as those in
developed countries (Muttagi, 1998; Chakravarty and Sachdeva, 1998). As a
developing country, China has some special conditions that need to be considered
in our analysis.
Page 9
7
Economic growth
As a developing country with a population of more than 1300 millions, the Chinese
government needs to pay more attention to economic development than
sustainability to solve imminent living problems. The importance of industry may
be revealed by it being 77% of the total gross domestic production in 1997. In
China, about 75% of the total energy consumption results from industry. The
situation has greatly affected government�s consideration to set and implement
sustainable targets.
Transport policy
Most policies aim to balance transport demand and supply. However, the traffic
demand is so great compared to transport supply that there are not many
opportunities available for transport users (Wang, 2000). This is a very important
practice in considering transport problems in these developing regions. Some issues
related to transport policies in China that need to be addressed are as follows:
(1) An integrated transport policy package is not available in China, making
transport expansions confusing. For instance, there is no well-demonstrated
transport planning based on demand forecast for all modes and their
sustainability (Mao, 1996). Transport systems are not efficient because of the
poor cooperation between different transport modes and the infrastructure.
Public transport has been depressed for the past decade.
(2) Tests and examination of transport facilities need to be enhanced. Expired
vehicles and locomotives can still be seen in operation, with increased
transport emissions and accident risks (Yang and Zhang, 1993).
(3) Poor administration needs to be improved. There exist individual,
group-owned and nation-owned transport enterprises on the transport market.
These enterprises have poor administration and implementation systems.
There are not comprehensive regulations available on price, services and
insurance. Also fair competitive systems need to be established in many
regions at the administration level.
Data collection and processing: There is, so far, no integrated system for collecting
and processing observational and statistical data in China, which makes it difficult
to get detailed research results (NBS, 1999). Many decisions are thus based only on
experience with lack of scientific evidence.
Technology: The production and management of the transport industry are not
Page 10
8
advanced. For example, the traditional transport industry is still producing low
standard vehicles with excessive emissions. In addition, there exist some
difficulties in coordinating and managing multiple regional departments across the
country.
Current transport market
The railway was the main form of land transport in China before the 1980s when
transport demand and supply were basically in equilibrium, though its network was
sparse. Entering the 1980s, rapid economic growth has led to a great increase of
traffic volumes (Wang, 2000). Rail transport supply started to lag behind demand
and consequently availability of train tickets fell short of the public�s expectations
and demands. Meanwhile, highways experienced high-speed development with
support from central and local governments. The market share of highway transport
was greatly augmented during the period. Figure 1 illustrates the development of
passenger transport of China in the past twenty years.
It is noted that, while the population in China increased by 30%, highway transport
achieved greater development of five times for passenger volume and eight times
for passenger-kilometres in the past 20 years. Comparatively, the railway obtained
an increase of only 7% for volume and 68% for its passenger-kilometres. Two
conclusions may be drawn from these data. First, the development in transport was
faster than the increase in population, which is consistent with economic growth
and improvement of the average trip rate. Second, the development of highways
was much quicker than that of the railway. This difference is due to the advantages
of highways for short-distance transport. Figure 2 describes the development of
economic and freight transport in China.
It is easy to see from Figure 2 that the Gross Domestic Product (GDP) has increased
4.9 times in the past 20 years. Highway freight volume has increased by 1.6 times
and highway freight turnover has increased by 6.5 times during this period. Railway
freight experienced only a 41% increase in volume and a 120% increase in turnover.
It may be concluded from the above two figures that highways have played the
principal part in transport since the 1990s.
The Chinese railway has been depressed since the middle of the 1990s in terms of
both volume and market share. This may be because:
(1) Since the 1980s, the road construction and network have been greatly
improved. Road transport has become competitive and changed the traditional
transport market, dominated and manipulated by a monopolistic railway
Page 11
9
operation.
(2) Traffic demand is being decentralised spatially due to the increase in
population. Road transport is very suitable for short-distance trips, as it
provides better accessibility and flexibility than railway transport.
(3) The aging infrastructure of railway transport failed to offer competitive
services. For example, obsolete facilities lower the comfort of passenger
transport. The travel speed of railway freight transport is very low at about 9
km/h from its acceptance of conveyance to delivery, resulting in a loss of
market share.
(4) Poor railway management cannot cope with the changing environment. For
example, there are too many staff serving customers. Transport services
offered by railways are too simple to satisfy the requirements of different kinds
of customers, etc.
For solving traffic congestion, the most common sense solution is the extension of
transport capacity in time and space. There was an on-going argument between
transport and industrial professionals at the beginning of the 1990s about the policy
of private car ownership (Mao, 1995). However, the worsening traffic states in
many city centres have displayed the after-effects of private car use in a developing
country with a large population like China.
The increase in traffic volume and motor vehicles is 9% each year, nearly equal to
that of the development of the gross national economy. Since 1990, the passenger
volume of all transport modes has been increasing rapidly. The total volume
reached 13.8 billion passengers, with a turnover of 1056 billion
passenger-kilometres in 1998. The average travel distance for different modes has
been changing since the 1980s. For example, the average travel distance of highway
passenger transport increased from 35 km in 1978 to 47 km in 1998, for railways
from 134 km to 395 km and for air from 1212 km to 1390 km during the same
period. This directly reveals that railway market space has been greatly restricted
by highway and air transport. A similar situation appears for freight transport. The
average travel distance of highway goods increased from 32 km in 1978 to 56 km in
1998. Railways showed an increase from 485 km to 764 km and waterways from
873 km to 1771 km in the same time. Air transport changed from 1667 km to 2392
km (CATC, 1999). These changes have greatly altered the structure of the Chinese
transport market.
Page 12
10
Forecast of transport and economic development
In order to estimate the national transport demands of China, it is necessary to make
a forecast of some important social and economic data. Table 1 lists several
important indexes related to transport demand. Obviously, Gross National Product
(GNP) and urban population have indexes which have increased fastest. They
indicate more car ownership and more trips by motor vehicles in the near future.
Table 2 shows the forecast of transport demands to 2020. It is obvious that the
passenger volume and its turnover would increase at an annual rate of 6.0-6.7%
from 2000 to 2010. The freight volume increase will be from 3.4 to 4.8 % over the
same time period. From 2010 to 2020, the expansion of transport demands is a little
lower than highway and airline transport.
Sustainability analysis
Many aspects have been studied in the evaluation of transport sustainability, among
which energy consumption and pollution emissions are the most important
indicators of transport sustainability and need further analysis.
Transport energy consumption
There is a close relationship between the energy industry and transport, especially
where the energy production of China is not so optimistic. The energy resource in
China is less than 100 years for production, either of coal or petroleum (NBS, 1999).
Figure 3 describes the structure of energy production of China in 1997.
Obviously, three quarters of the total energy is coal production. Oil production is
less than one fifth. This balance is especially disadvantageous for a developing
country wishing to expand road transport, and the solution would be to import oil
and gas from elsewhere.
From the viewpoint of the balance of energy production and consumption, the
average energy production increased from 650 km standard coal in 1980 to 1090
km in 1996. The average energy consumption, however, increased from 615 km to
1141 km during the same period. This means China has changed itself from an
energy balanced to an energy insufficient state, a change that needs to be realised by
all policy decision-makers. Figure 4 gives the statistic of data of energy
consumption in 1997 for the whole country. It is easy to see that industry is the
biggest state energy consumer of energy, as in most developing countries. China is
still in her industrialising stage. It is necessary to note that there is a statistical
difference in Figure 4. The energy used by transport facility manufacture, which is
about 1.4% of total industrial energy consumption, is not included. Some other
Page 13
11
items related to transport such as energy consumption by some big mineral mills
and private transport suppliers may also not be included in the statistics.
Though there are no official data about transport energy consumption in China, it is
possible to give a n approximate calculation of total annual energy consumption of
all transport modes according to their turnover and average unit consumption. Table
3 shows the energy consumption of different transport modes in 1995. Obviously,
highways entail the most energy consumption though the turnover volumes are not
so large. This means that highways consume more energy than other modes in
carrying out the equivalent traffic. Table 4 lists the physical energy consumption of
transport in 1985, 1990 and 1995. It is easy to see that coal consumption has
decreased and oil consumption has become the main source of the energy
consumption since 1990. This change may be due to the rapid increase of motor
vehicles in the past decade.
As mentioned above, energy production in China is less than energy consumption.
National Bureau of Statistics (1999) data show that the total energy production in
1997 is 1320 million ton standard coal, slightly less than the consumption of 1420
ton standard coal. Table 5 shows the unit energy consumption by different transport
modes in 1995. For freight transport in 1995, the energy consumption of railways
was 59.22 kcal per ton-km, whereas highways consumed 446.76 kcal per ton-km,
6.5 times more than railways. The energy consumption of railway passenger
transport was about the same as that of railway freight transport and highway public
transport was 116.74 kcal per pkm, based on diesel engines. It is easy to see that the
energy efficiency of the railway is 97% higher than that of highways on passenger
transport.
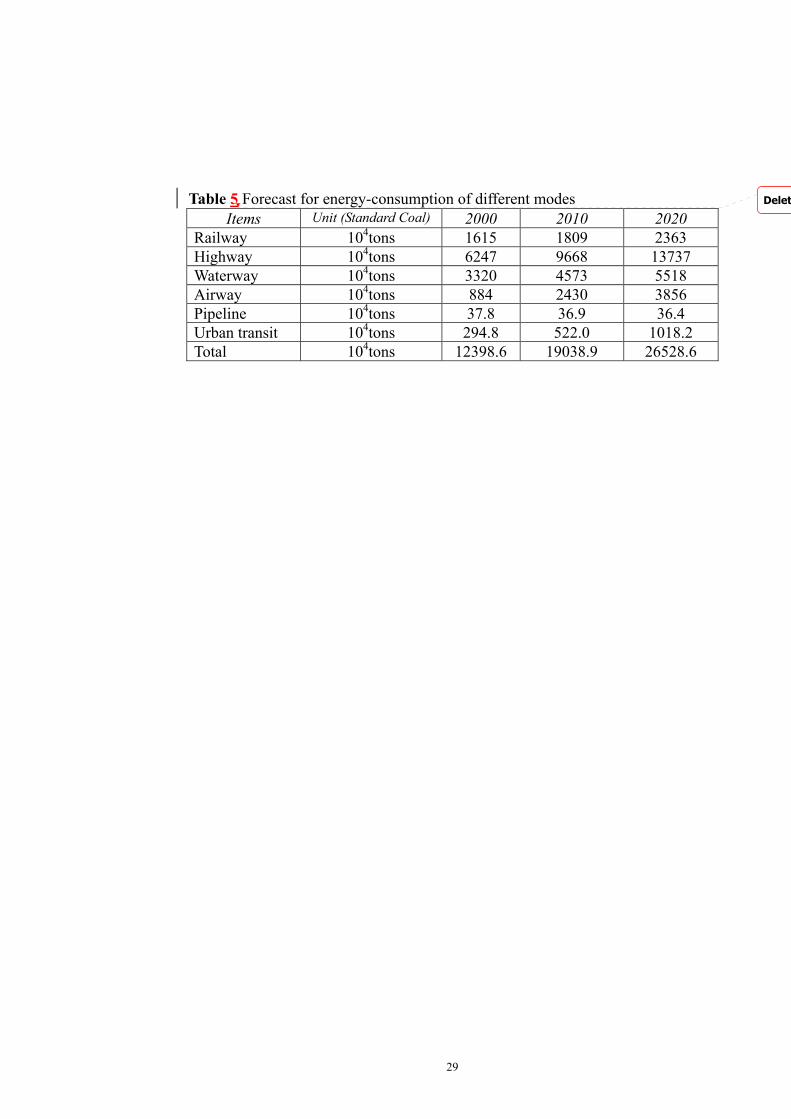
Table 6 gives the forecast for energy consumption of various transport modes based
on the results of Table 2. As the energy consumption per pkm/tkm of highways is
far greater than that of the railway, the corresponding energy consumption by
highways in 2020 may possibly double the value of 2000. In urban areas, the
increase is even greater according to the current policy of preference for private car
ownership, though some big cities such as Beijing, Shanghai and Guangzhou have
planned a large-scale rail transit network.
Table 7 lists the calculations of oil demands from 2000 to 2020 according to the
energy consumption structure, based on Table 2, Table 5 and corresponding unit
standards. The results show that the demand for liquid energy may show a rapid
increase in the coming years. This demand will stimulate the conflict between oil
consumption and production as petroleum only occupied 17.4% of total production
as shown in Figure 3. It may also become one of the reasons for an unsustainable
Page 14
12
transport future for China.
The energy production is insufficient in China. Experiences in developed countries
have shown that the development of transport will surely change the framework of
the energy system.
Transport emissions analysis
Table 8 shows the calculated emissions by transport modes in 1995. The data warn
that highways will become the biggest source of pollution contributing 88.4% of
total emissions. Still worse, it is also the most rapidly developing form of transport
in China.
Total suspended particles (TSP) has been one of the major resources of air pollution,
especially in some big cities of the northern regions of China. The pollution of the
atmosphere comes mainly from coal, the major energy resource in China. In some
middle and small cities, the characteristic pollution is a mixture of combusted coal
smog and vehicle emission gases. According to the statistical report by the Bureau
of National Environment Protection, the total emission of exhaust gases, such as
SO2, NOX, COX, HC, TSP etc., from industrial factories were over 53.44 million
tons in 1997. Table 9 describes the forecast of the average emissions in 2020.
Experience of developed countries has shown that road transport will contribute the
most important emissions (Serageldin, 1993) if its market share becomes the
largest.
The values of different emissions by road transport may be described as follows.
TX = XVV
VV
P ES
V,*)1(
*β
α+
Where TX is the emission of pollution X; EV,X is the unit emission of X per vehicle
kilometre; VP is the turnover of road passenger transport of the whole country; SV is
the average passengers per vehicle; αV is the loading rate of a vehicle; and βV is the
additional running coefficient with consideration to the empty state. Table 10 shows
the forecast of various transport emissions till 2020 according to the future demand
and technological developments. The results are based on the improving structure
of 2020. The emissions will be 1.7 times higher than for the current structure.
It is easy to see the total volume of harmful emission gases is more than 52.5
million tons each year, excluding the emissions from urban transport. Statistics also
show that the total passenger kilometres of urban public transport is 25.13 billions
in 1997, among which 90% is from bus transport. As the unit bus emission in urban
Page 15
13
areas is larger due to their lower operation speed, it is therefore reasonable to
reckon that total gas emissions of transport would be greater than 70 million tons,
including those from aircraft, railways, waterways and other private transport. This
number is nearly equivalent to total industrial emissions, 53.4 million tons
published officially, based on incomplete statistics in 1997. The further
development of road transport will certainly worsen the situation.
On the other hand, China has also been confronted with great challenges of landuse
and noise pollution. Statistics show that average area of land per capita is 0.777 ha,
1/3 of the world average value. The average ploughland per capita is 0.106 ha, less
than half of the world average. Still worse, 60% ploughland has no guarantee of
water resources and irrigation facilities, and 79% is low production status (NBS,
1999). The ploughland of the country is decreasing each year with industrialisation
and poor administration of rural areas. In 1999, the loss of ploughland was as great
as 8.42 million ha. The reasons include non-rural occupation, ecological reuse of
farmland for other purposes and natural disasters.
Environmental deterioration has become a more and more serious problem in China
due to the rapid economic development as well as the mass population, high density
and sparse resources. Taking water pollution as an example, a sampling
investigation in 1999 dealing with 141 Chinese inner rivers showed that the water
quality of 63.8 % of the rivers had been reduced to No.4 or No.5 class standards. In
some big cities, the emission of industrial liquid waste is just starting to be under
limited control, but the emission of raw urban sewage has increased due to the
continuing urbanisation in the past decades.
Policy analysis
Transport policy and its consequences have greatly influenced social development.
It is easy to see from Table 2 that highway traffic will have a greater increase than
other modes, and air traffic will also possibly show a great increase in the coming
decades. The forecasts show that the turnover of airway passenger transport in
China will be over 20% of total pkm in 2020, which is greater than 12.4% for the
USA and 6.1% for the EU in 1994.This reveals the possible transport policy of
China in the coming years. It is necessary to note that the above statistics do not
take account of the traffic generated by industrial enterprises and private vehicles.
The further development of individual private cars would affect the above
consequences.
However, it has been recognised that the highway traffic increase is not sustainable
(Banister, 2000). Some countries have put forward a series of integrated policies to
Page 16
14
achieve a sustainable output of society (Jakomin and Trupac, 2000; May, 1991).
Rail transport should give priority to developing intercity and urban transport
systems. That is why we appeal here for attention to the fact that a long-term and
integrated policy is needed for future development.
Page 17
15
CONCLUSIONS
(1) China has been at a crossroads in the choice of transport policies, among which
the development of private transport tools is the most important. It is very
important for the government to define a long-term sustainable transport policy
that takes account of current and future situations in China.
(2) The highway network has been developed greatly in the past two decades. It
has also been shown a great increase in both passenger and freight transport
market shares. The development of highways is paramount in the land
transport of China and also greatly improves the situation of transport in terms
of both quantity and quality. Sustainability warns, however, that the inefficient
railway transport system must be reformed to enable it to play an important
role in the future as it is a sustainable resource.
(3) Railway departments fail to make the most of urban transport markets for two
reasons. First, the railway management system is inflexible and difficult to
coordinate with local authorities. This inflexibility hinders local railway
development. Second, the railways have failed to develop urban rail transport,
including the market development, demand analysis and technical revolution.
This failure makes rail transport disadvantageous in competition with other
forms of transports. All in all, this shrinkage of rail transport over middle and
short distances is not conducive to the establishment of a united and sustainable
transport system. The government should analyse in detail the demand for
transport and a reasonable market of various modes based on the available
resources so as to balance the transport supply and its demand as planned.
(4) The government should adopt policy favourable to the development of urban
railways, especially in cities of big and middle scales. As mentioned above,
urban railways have not developed as well as they would have. Most commuter
and suburb railway transports are almost certain to fail. They lack an efficient
and quick connection between long distance intercity railways and urban
transport systems.
(5) It is necessary to prompt railways to speed up the development of railway
technology and train organisation so as to meet the requirements of urban rail
transport. For example, rail motor vehicles suitable for urban transport should
be developed. On the other hand, a more flexible timetable appropriate for
urban passenger transport is also necessary. The railway networks should be
extended so as to improve the accessibility of passengers to urban areas. At the
same time, better alternatives for the connection of passenger changes at
Page 18
16
terminal stations, and better information and ticketing systems for passengers
should be established.
(6) Government should organise an integrated study to better coordinate transport
resources and develop policies as done in UK (May, 1991), including the prices
of energy, land-use policy, car parking system and extra charges on some roads
at peak hours, etc. This is beneficial as well as necessary for both transport
users and a sustainable future.
(7) Motor manufacturing technologies need to be improved and advanced.
Focuses should be on energy efficiency and pollution emissions. Although
there are many regulations related to the emissions (NEPB, 1989a, b, c, 1995,
1999) in China, they still lack measures for their implementation and a regular
emission monitoring system. This has become a major obstacle to a sustainable
transport policy.
Page 19
17
REFERENCE
Banister, D. (1994). Transport planning in the UK, USA and Europe. (London: E &
F N Spon)
Banister, D. (2000). Sustainable Urban Development and Transport - A Eurovision
for 2020. Transport Reviews, Jan-Mar, 113-30
Buchanan, M. Freer, N. and Edwards, A. (1997). Unsustainability - transport
problem or lifestyle problem? In Policy, Planning and Sustainability, Proceedings
of Seminars C and D held at the European Transport Forum Annual Meeting,
Brunel University, England, 1-5 September, Vol. P413, pp. 519-536
Button K.J. and Verhoef, E.T. (eds) (1998). Road Pricing, Traffic Congestion and
the Environment. (Northampton: Edward Elgar)
Chakravarty, A.K. and Sachdeva, Y.P. (1998). Sustainable urban transport policies
for developing countries. In Freeman & Jamet (eds) Urban Transport Policy,
Proceedings of the CODATU VIII, pp. 59-67 (Rotterdam: Balkema)
China Association of Transportation and Communications (CATC) (1999). Year
Book of China Transportation & Communications, pp. 547-636 (Beijing: Year
Book House of China Transportation and Communications)
Comprehensive Transport Institute (CTI) of State Planning Committee of China
(1998). Energy, Environment and Transport Development of China. Research
Report (in Chinese), Beijing.
Comprehensive Transport Institute (CTI) of State Planning Committee of China
(2000). Forecast on the total demand and market shares of various transport modes.
Research Report (in Chinese), Beijing.
General Bureau of Environment Protection of China (GBEPC) (2000). 1999
Environment Report of China. (in Chinese), Beijing
Gercek, H. and Tekin, I. (1996). Sustainable development and urban public
transportation systems planning with special reference to Istanbul. Urban
Transport and the Environment, II, 185-197
Jakomin, L., and Trupac, I. (2000). Transport Integration of Slovenia with the
European Union. Transport Reviews, 2, 233-55
Page 20
18
Mao, B. (1995). Transport planning towards sustainability. Proceedings of the 1st
Youth Professionals in Transportation, pp. 357-61. (Zhongqing: Zhongqing
University Press) (in Chinese)
Mao, B. (1996). Sustainability-based Analysis to Transport Policy of China in 21th
Century. Proceedings of the 1st Forum of China Science and Technology, pp.
177-82 (Beijing: Xueyuan Publishing House) (in Chinese)
Mao, B., Xiao G. and Xu H. (1999). Bicycle Development Policy under Mixed
Traffic Environment of China. Journal of International Association of Traffic and
Safety Sciences (IATSS), 2, 62-9
Masser, I., Sviden O. and Wegener, M. (1993). Transport Planning for Equity and
Sustainability. Transportation Planning and Technology, 22, 319-30.
May, A.D. (1991). Integrated transport strategies: a new approach to urban
transport policy formulation in the UK. Transport Reviews, 3, 223-47
Muttagi, P.K. (1998). Sustainable development - a third world perspective.
Sustainable Development and the Future of Cities, 43-56. (London: International
Technology Publications Ltd)
National Environment Protection Bureau (NEPB) (1989a). Act of Environmental
Protection of People�s Republic of China. (Beijing: NEPB)
National Environment Protection Bureau (NEPB) (1989b). Integrated Emission
Standard of Air Pollution. (Beijing: NEPB)
National Environment Protection Bureau (NEPB) (1989c). Standard of
Environmental Noise of Urban Area. (Beijing: NEPB)
National Environment Protection Bureau (NEPB) (1995). Ambient Air Quality
Standard, China Architecture & Building Press. (Beijing: NEPB)
National Bureau of Statistics (NBS) (1998). Urban Statistical Yearbook of China
1997. (Beijing: China Statistic Press)
National Environment Protection Bureau (NEPB) (1999). Emission Standard for
Pollutants from Light-duty Vehicles. (Beijing: China Architecture & Building
Press)
Page 21
19
National Bureau of Statistics (NBS) (1999). China Environmental Statistics�98,
(Beijing: China Statistic Press)
OECD/ECMT (1995). Urban Travel and Sustainable Development (Paris:
OECD/ECMT).
Ono,Y. (1993). Japan's sustainable transport policy towards the 21st century.
Transport policy, 1, 32-42.
Owens, S. (1995). From 'predict and provide' to 'predict and prevent'? - pricing and
planning in transport policy. Transport policy, 1, 43-9
Prades, J.A., Labriet, M. and Waaub, J. (1996). Cities, environment and
development: an integrative societal approach toward a sustainable transport
system. Urban Transport and the Environment, II, 15-24
Serageldin, I. (1993). Environmentally sustainable urban transport: defining a
global policy. Public Transport International, 2, 17-24
Wang, Q. (2000). Review of Transport in 1999 and Prospect of 2000 Transport.
Comprehensive Transport (in Chinese), 1, 1-4
WCED, (1987). Our Common Future. (Oxford: Oxford University Press)
World Health Organisation (1987). Air quality guidelines for Europe. (Copenhagen:
WHO)
Yang, Q. and Zhang K. (eds) (1993). 1990-1991 Yearbook of China City Public
Transport. (Beijing: China City Publishing House)
Page 22
20
0
2000
4000
6000
8000
10000
12000
14000
Tra
ffic
an
d T
urn
over
0
40
80
120
160
200
Po
pu
lati
on
(m
illi
on
s)
Highway Traffic 2228 4765 5481 9539 12573 13400
Railway Traffic 912 1109 948 1087 936 977
Highway Turnover 730 1725 2621 4220 5943 6480
Railway Turnover 1380 2413 2610 3636 3696 4046
Population 98.7 105.9 114.3 119.9 124.8 126.1
1980 1985 1990 1994 1998 1999
Figure1 Statistics of Chinese highway and railway passenger transport. Traffic: in
million passengers. Turnover: in108 passenger kilometres.
Page 23
21
0
2000
4000
6000
8000
10000
12000
14000
Tra
ffic
an
d T
urn
over
0
10000
20000
30000
40000
50000
GD
P (
10
8Y
ua
n)
Highway Traffic 3820 5381 7240 8949 9760 10000
Railway Traffic 1113 1307 1507 1631 1612 1569
Highway Turnover 764 1903 3358 4486 5483 5750
Railway Turnover 5717 8126 10622 12458 12312 12578
GDP 4518 7519 10980 17499 24856 26596
1980 1985 1990 1994 1998 1999
Figure 2 Developments of economy and freight transport in China. Traffic: in
million tons. Turnover: in 108 ton kilometres. Data of GDP in 10
8 Yuan are based on
the price in 1980.
Page 24
22
6
17.4
2.3
74.3
Coal
Oil
Gas
Electricity
Figure 3 Structure of Energy Production of China in 1997.
Page 25
23
1.3
3.9
10.9
4.1
76.7
3.1
Rural
Inustry
Transport
Commercial
Living
Others
Figure 4 Energy Consumption of China in 1997.
Page 26
24
Table 1 Forecast for Social and Economic Indexes of 2000-2020
Items Unit 1995 practical 2000 2010 2020
Population 104 persons 121121 128000 140000 150000
GNP 108 Yuan 57277 85000 170000 310000
UPa 108passengers 1489 1745 2067 2437
UPo 108 persons 5.0 5.9 7.0 8.25
Source: CTI ( 2000); UPa: Urban Passengers, UPo: Urban Population.
Delet
Page 27
25
Table 2 Forecast for transport demands in 2010-2020
1998 practical 2000 2010 2020
Items
Turn-
over
(%) Turn-
over
(%) Turn-
over
(%) Turn-
over
(%)
Pa 3696 35.0 4150 34.3 6580 29.1 10000 25.1
Rail
way
Fr 12312 32.5 12700 30.4 16100 28.9 19200 27.2
Pa 5943 56.3 6860 56.8 13500 59.7 24500 61.5
Hig
hw
ay
Fr 5483 14.5 6150 14.7 9100 16.3 12000 17.0
Pa 120 1.1 125 1.0 138 0.6 150 0.4
Wa
terw
ay
Fr 19405 51.3 22200 53.2 29500 52.9 38000 53.8
Pa 800 7.0 950 7.9 2400 10.6 5200 13.0
Air
lin
e
Fr 34 0.1 41 0.1 100 0.2 190 0.3
Pa - - - - - - - -
Pip
elin
e
Fr 606 1.6 645 1.5 950 1.7 1200 1.7
Source: CTI (2000), Wang (2000); Pa: Passenger, Fr: Freight.
Delet
Page 28
26
Table 3 Transport energy consumption of different modes in 1995
Volume Energy-consumption Transport Modes
Unit Turnover Unit Consumption
Pa pkm, 108 4603 10
4 TSC 542
Hig
hw
ay
Fr tkm, 108 4695 10
4 TSC 3943
Pa pkm, 108 3546 10
4 TSC 300
Rail
way
Fr tkm, 108 12870 10
4 TSC 1085
Pa pkm, 108 172 10
4 TSC 30
Wa
terw
ay
Fr tkm, 108 17552 10
4 TSC 2631
Pa pkm, 108 681 10
4 TSC 324
Air
way
Fr tkm, 108 22.3 10
4 TSC 147
Pip
elin
e Fr tkm, 108 590 10
4 TSC 40.5
UP
T Pa pkm, 10
8 1328.4 10
4 TSC 172
PT
104 TSC 25.3
Resource: STI (1998), NSB (1999); TSC: Ton of Standard Coal, Pa: Passenger, Fr:
Freight, UPT: Urban Public Transport, PT: Private Transport.
Delet
Page 29
27
Table 4 Physical consumption of different energy forms by transport
Items Unit 1985 1990 1995
Coal 104 tons 1932 1396 746
Gasoline 104 tons 1187 1666 2621
Diesel gas 104 tons 1170 1646 2221
Kerosene 104 tons 69 122 320
Electricity 104 kw 1291085 2511369 3635038
Source: NSB (1999).
Page 30
28
Table 4 Energy consumption of highway and railway of China (1995)
Mode Energy Consumption
Highway Passenger 116.74 kcal/pkm
Railway Passenger 59.22 kcal/pkm
Highway Freight (based on diesel engine) 446.76 kcal/tkm
Railway Freight 59.22 kcal/tkm
Delet
Page 31
29
Table 5 Forecast for energy-consumption of different modes
Items Unit (Standard Coal) 2000 2010 2020
Railway 104tons 1615 1809 2363
Highway 104tons 6247 9668 13737
Waterway 104tons 3320 4573 5518
Airway 104tons 884 2430 3856
Pipeline 104tons 37.8 36.9 36.4
Urban transit 104tons 294.8 522.0 1018.2
Total 104tons 12398.6 19038.9 26528.6
Delet
Page 32
30
Table 6 Oil Demands Forecast
Items Unit 2000 2010 2020
Inter-city 104 tons 3091 5499 6899
Urban 104 tons 270.4 301.9 588.2
Ga
sol
ine
Total 104 tons 3361.4 5800.9 7487.2
Railway 104 tons 379 492 500
Highway 104 tons 1082 1926 2284
Waterway 104 tons 2113.6 2910.9 3512.3
Pipeline 104 tons 16.6 15.2 13.8
UPa 104 tons 30 53 104 D
iese
l o
il
Total 104 tons 3621.2 5397.1 6414.1
Ker
ose
ne 10
4 tons 601 1652 2622
Upa: Urban Passenger.
Delet
Page 33
31
Table 7 Emissions by transport in 1995 (104tons)
CO NOx HC SO2 Total
Highway 3422 1104 644 81.3 5251.3
Railway 45 111.4 24.9 67.2 248.5
Air 135 111 25 9.3 280.3
Waterway 4.5 126 20 2.6 163.1
Total 3606.5 452.4 713.9 170.4 5943.2
Delet
Page 34
32
Table 8 Average transport emissions in 2020
CO NOX HC SO2
Highway 14.4 2.4 2.5 0.13
Railway 0.01 0.15 0.01 0.3
Passenger Transport
(g/pkm)
Air 2.2 1.8 0.4 0.15
Highway 0.25 3.0 0.32 0.28
Railway 0.15 0.4 0.07 0.18
Freight Transport
(g/tkm)
Waterway 0.018 0.5 0.08 0.05
Source: CTI (1998), GBEPC (2000).
Delet
Page 35
33
Table 9 Forecast of total emissions in 2020 (104ton)
CO NOX HC SO2 Total
Highway 4173 1346 785 99.2 6403.2
Railway 55 135.8 30.3 81.9 303
Air 165 135 30 11.3 341.3
Waterway 5.5 153 24.5 15.3 198.3
Total 4398.5 1769.8 869.8 207.7 7245.8
Delet


![Social Sustainability in an Ageing Chinese Society ... › 4e09 › fce3bf32bf... · available on social sustainability issues in China [12,13], which held 19.1% (1.4 billion) of](https://static.documents.pub/doc/80x56/5f0d85257e708231d43ac40d/social-sustainability-in-an-ageing-chinese-society-a-4e09-a-fce3bf32bf.jpg)


