51
Massachusetts Water Resources Authority Sustainability and Asset Protection at MWRA Frederick A. Laskey Executive Director October 10, 2017

Massachusetts Water Resources Authority
Sustainability and Asset Protection at MWRA
Frederick A. LaskeyExecutive Director
October 10, 2017
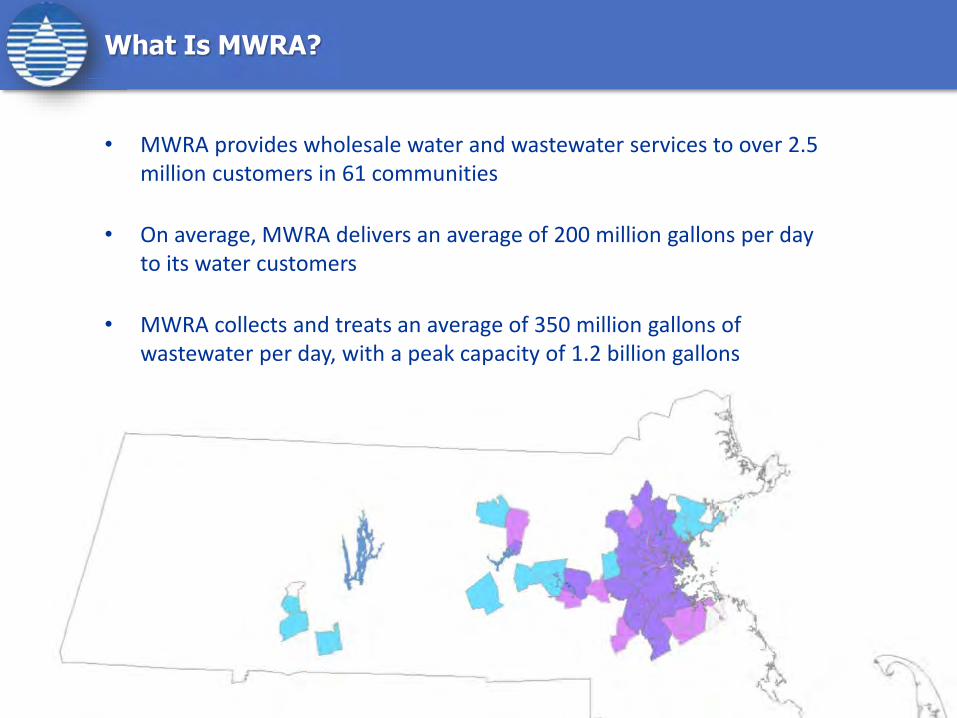
• MWRA provides wholesale water and wastewater services to over 2.5 million customers in 61 communities
• On average, MWRA delivers an average of 200 million gallons per day to its water customers
• MWRA collects and treats an average of 350 million gallons of wastewater per day, with a peak capacity of 1.2 billion gallons
What Is MWRA?

What Happens When YouDon’t Do Maintenance?
3
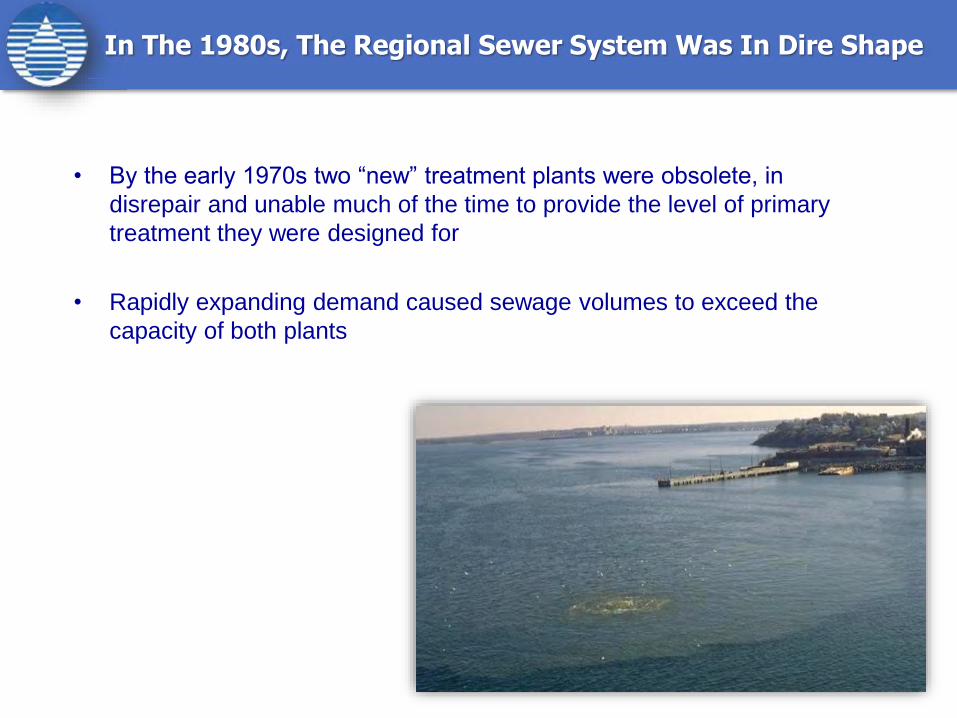
In The 1980s, The Regional Sewer System Was In Dire Shape
• By the early 1970s two “new” treatment plants were obsolete, in disrepair and unable much of the time to provide the level of primary treatment they were designed for
• Rapidly expanding demand caused sewage volumes to exceed the capacity of both plants

Raw Sewage Poured Into Boston Harbor Daily
55
6
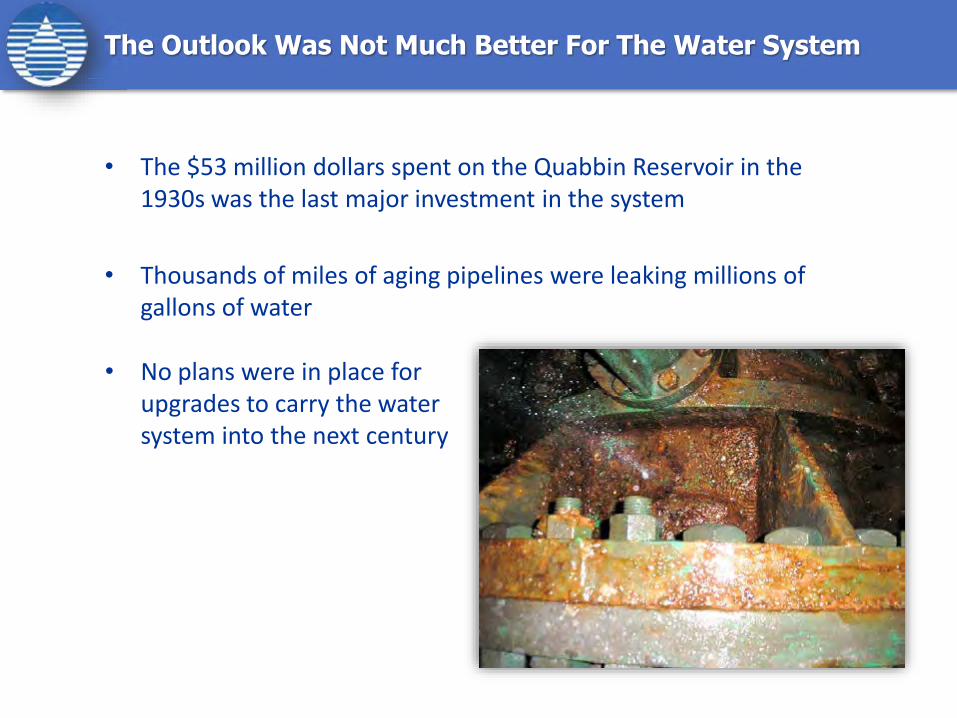
The Outlook Was Not Much Better For The Water System
• The $53 million dollars spent on the Quabbin Reservoir in the 1930s was the last major investment in the system
• Thousands of miles of aging pipelines were leaking millions of gallons of water
• No plans were in place for upgrades to carry the water system into the next century

Dam Maintenance Was Also Underfunded
8

• Appropriations by the legislature were on the decline, which in turn led to staffing reductions, which in turn led to the deferral of much needed maintenance and repairs
MCD Appropriations Were Declining
$-
$5,000,000
$10,000,000
$15,000,000
$20,000,000
$25,000,000
$30,000,000
$35,000,000
Water Divison Sewerage Division
1982 1983
1984
1982 19831984

Creation Of The MWRA
• A federal lawsuit forced the creation of the MWRA to take over responsibility for greater Boston’s water and sewer systems
• MWRA assumed responsibility for the water and sewer infrastructure serving greater Boston, and to end the pollution of Boston Harbor from obsolete treatment plants
• MWRA was created as an independent authority charged with raising its revenue from ratepayers, bond sales and grants
• MWRA had to establish wholesale water and sewer rates to cover all costs, including a massive capital program to repair and upgrade the systems

What Did We Have To Do?
11
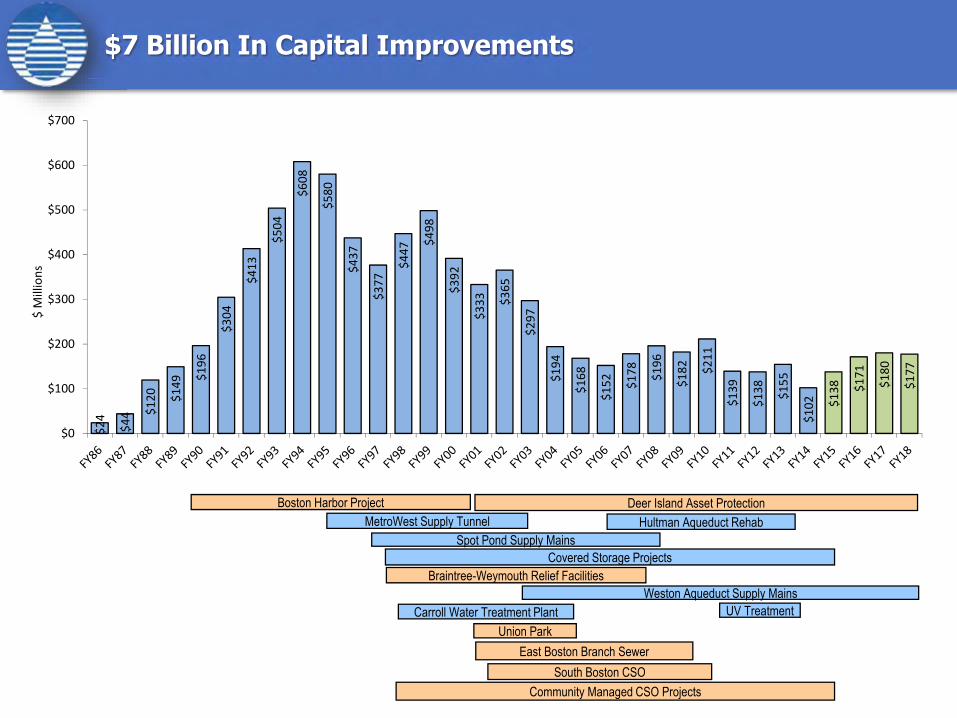
$7 Billion In Capital Improvements
Boston Harbor ProjectMetroWest Supply Tunnel Hultman Aqueduct Rehab
Spot Pond Supply Mains
Braintree-Weymouth Relief FacilitiesCovered Storage Projects
Weston Aqueduct Supply MainsCarroll Water Treatment Plant UV Treatment
Union ParkEast Boston Branch Sewer
South Boston CSOCommunity Managed CSO Projects
Deer Island Asset Protection
$24
$44 $1
20
$149
$196
$304
$413
$504
$608
$580
$437
$377
$447
$498
$392
$333
$365
$297
$194
$168
$152
$178
$196
$182
$211
$139
$138
$155
$102
$138
$171
$180
$177
$0
$100
$200
$300
$400
$500
$600
$700
$ M
illio
ns

Over 80% Of Spending Mandated By Federal Or State Over 80% Of Spending Mandated By Federal Or State Over 80% Of Spending Mandated By Federal Or State Regulations
$0
$100
$200
$300
$400
$500
$600
$700
FY86 FY88 FY90 FY92 FY94 FY96 FY98 FY00 FY02 FY04 FY06 FY08 FY10 FY12
Milli
ons
Mandated v. Non-Mandated Project Spending
Mandated(Court Orders,
Consent Orders)
Non-Mandated(Pipeline Rehabilitation and Infrastructure Replacement)
13

• New 17.6 mile aqueduct
• New state-of-the-art treatment plant
• 7 new covered storage facilities
$2 Billion Modernization Of The Water System
1414

15
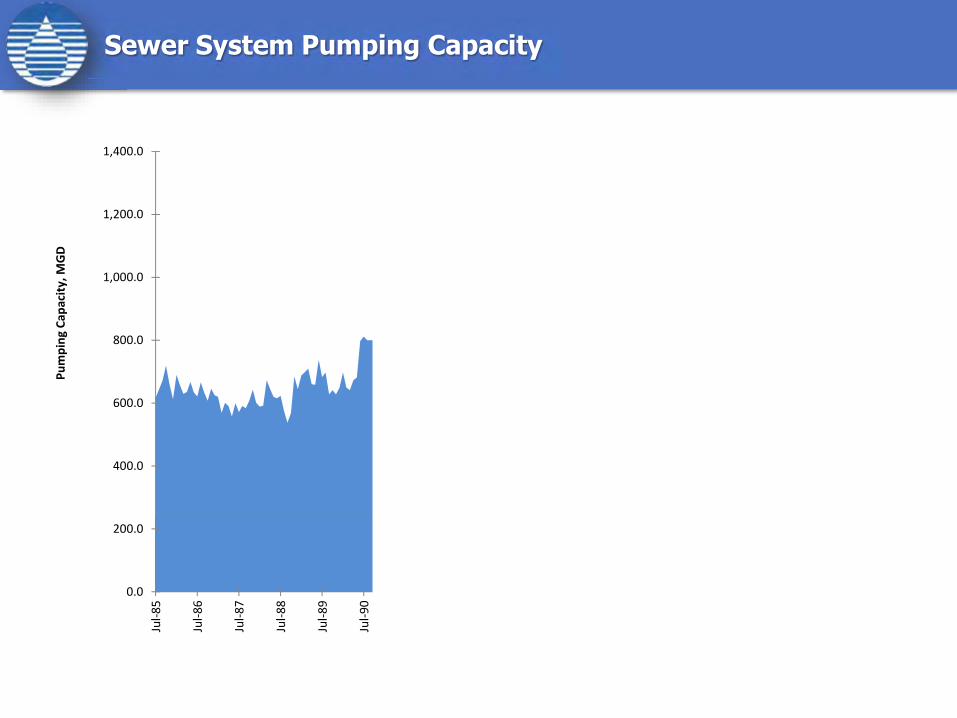
$4.5 Billion On The Wastewater Side
• The 15-year, $3.8 billion Boston Harbor Project completed in 2001
• $900 Combined Sewer Overflow Control Program completed in 2015
0.0
200.0
400.0
600.0
800.0
1,000.0
1,200.0
1,400.0Ju
l-85
Jul-8
6
Jul-8
7
Jul-8
8
Jul-8
9
Jul-9
0
Jul-9
1
Jul-9
2
Jul-9
3
Jul-9
4
Jul-9
5
Jul-9
6
Jul-9
7
Jul-9
8
Jul-9
9
Jul-0
0
Jul-0
1
Jul-0
2
Pum
ping
Cap
acity
, MGD
Sewer System Pumping Capacity

Dramatic Improvements In Water Quality Dramatic Improvements In Water Quality –– Even In Wet Dramatic Improvements In Water Quality Dramatic Improvements In Water Quality Weather
17
Average Enterococcus counts in Boston Harbor in wet weather
The lighter the blue, the better
1987-1998 (Before Secondary Treatment and South System transfer)
1999 - 2014 (After Secondary Treatment and New Outfall)
1999 - 2014 1987 - 1991

We Built It, Now WeHave To Maintain It
18
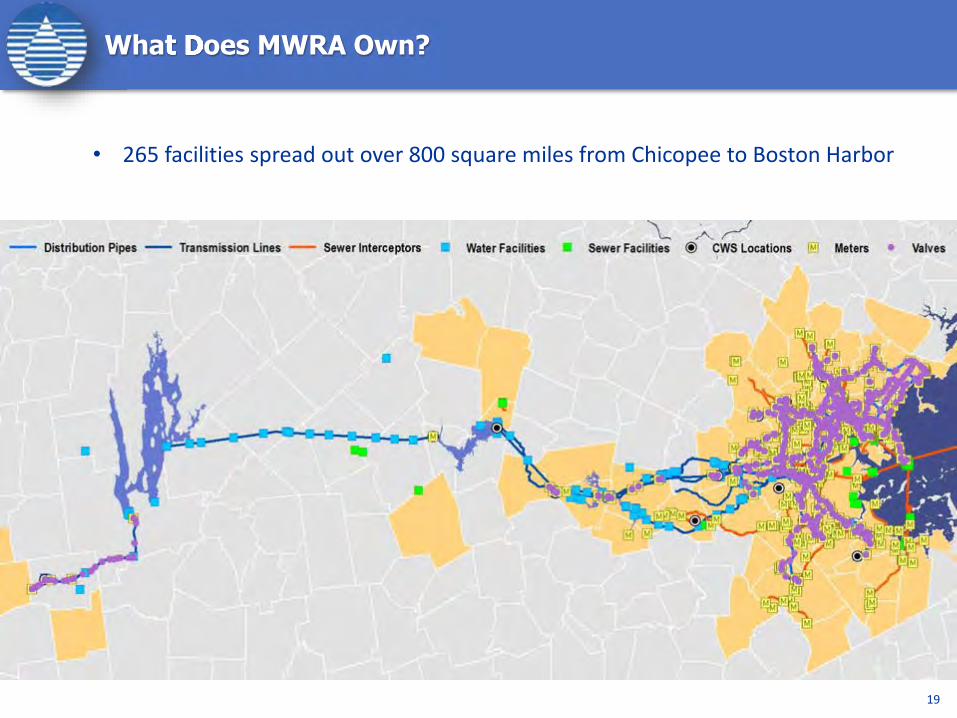
What What DDDoes MWRA Own?
19
• 265 facilities spread out over 800 square miles from Chicopee to Boston Harbor
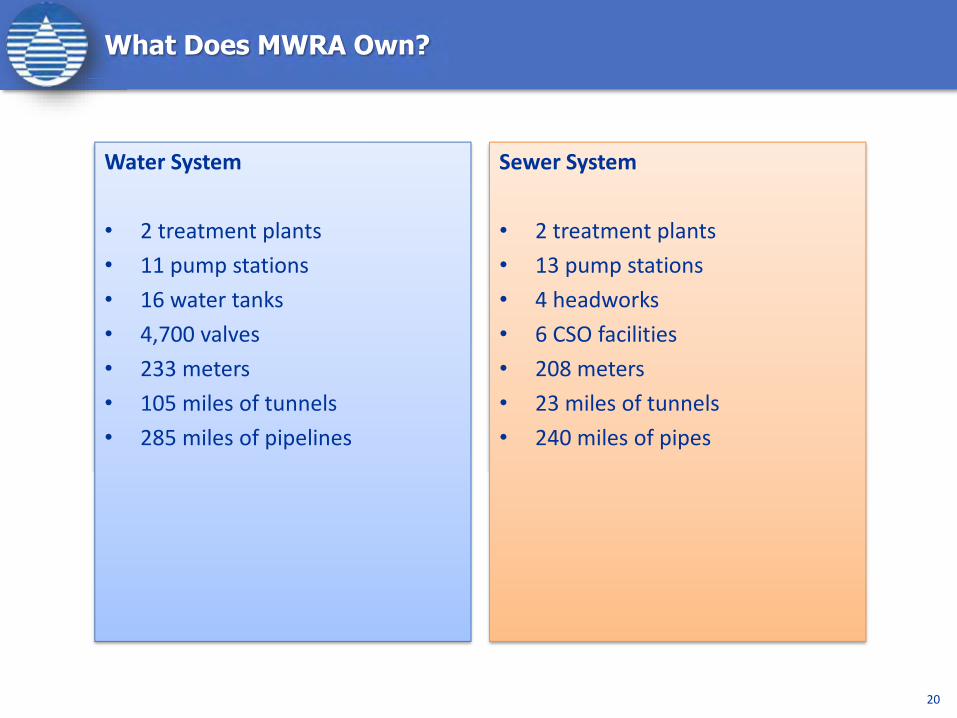
Water System
• 2 treatment plants• 11 pump stations• 16 water tanks• 4,700 valves• 233 meters• 105 miles of tunnels• 285 miles of pipelines
What Does MWRA Own?
20
Sewer System
• 2 treatment plants• 13 pump stations• 4 headworks• 6 CSO facilities• 208 meters• 23 miles of tunnels• 240 miles of pipes
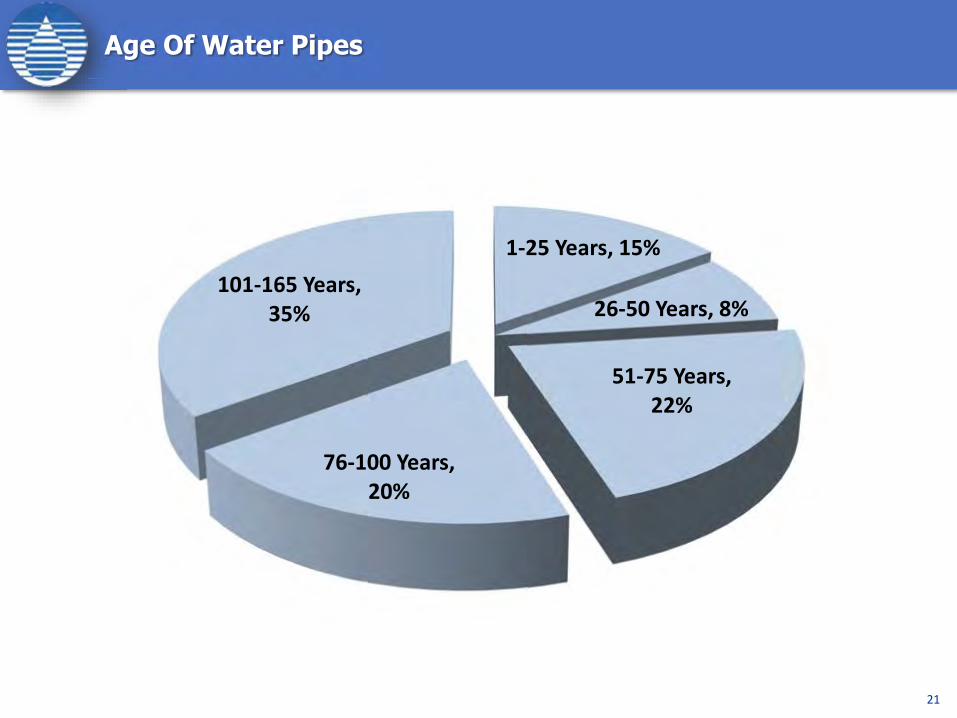
Age Of Water Pipes
21
1-25 Years, 15%
26-50 Years, 8%
51-75 Years, 22%
76-100 Years, 20%
101-165 Years, 35%
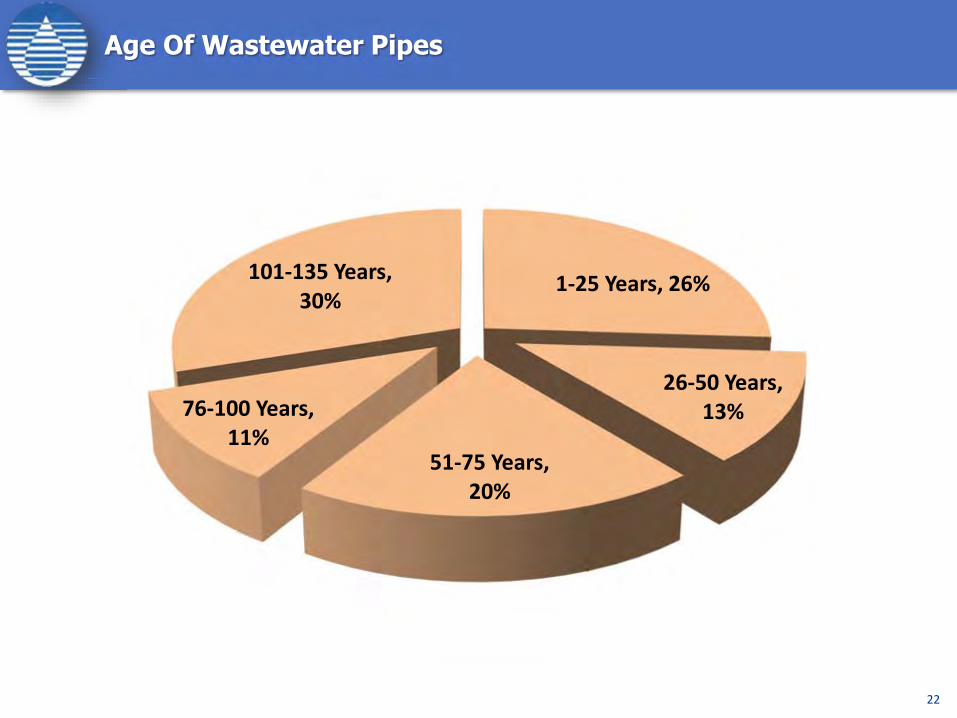
Age Of Wastewater Pipes
22
1-25 Years, 26%
26-50 Years, 13%
51-75 Years, 20%
76-100 Years, 11%
101-135 Years, 30%

23
404040-40-Year Water And Wastewater Master Plans
• MWRA maintains Water and Wastewater Master Plans which provide the framework for the Capital Improvement Program
• Currently projects $5 billion over the next 40 years
• Updated every 5 years

24
Master Plan Projected System Reinvestment Needs
• Over $5 billion over the next 40 years
Reliability Centered Maintenance Approach
25
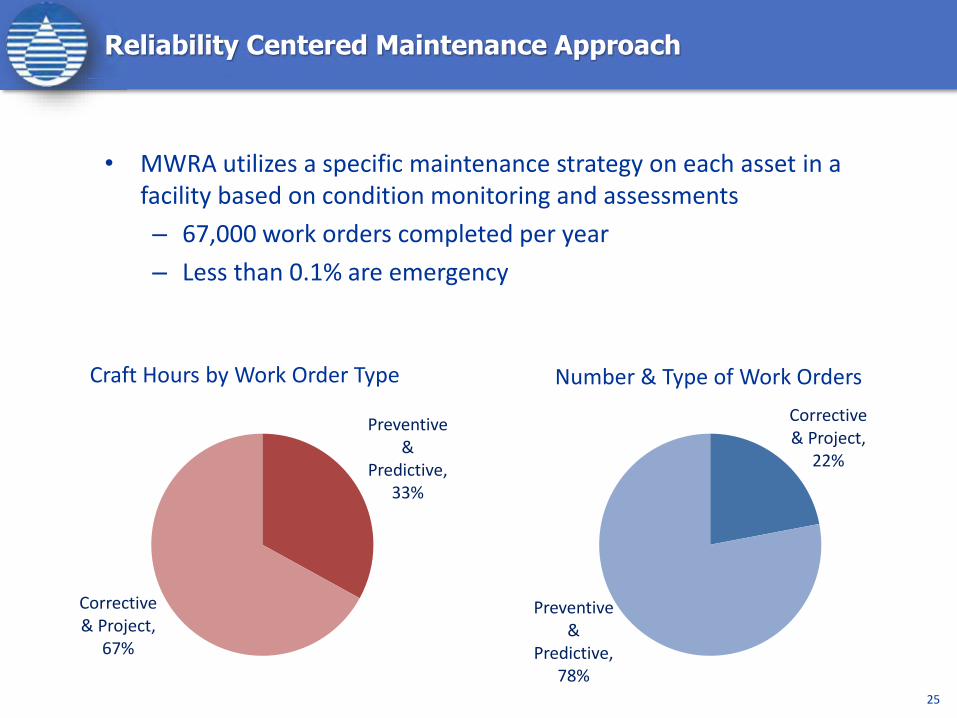
• MWRA utilizes a specific maintenance strategy on each asset in a facility based on condition monitoring and assessments– 67,000 work orders completed per year– Less than 0.1% are emergency
Preventive &
Predictive, 33%
Corrective & Project,
67%
Corrective & Project,
22%
Preventive &
Predictive, 78%
Craft Hours by Work Order Type Number & Type of Work Orders
Condition Monitoring
26
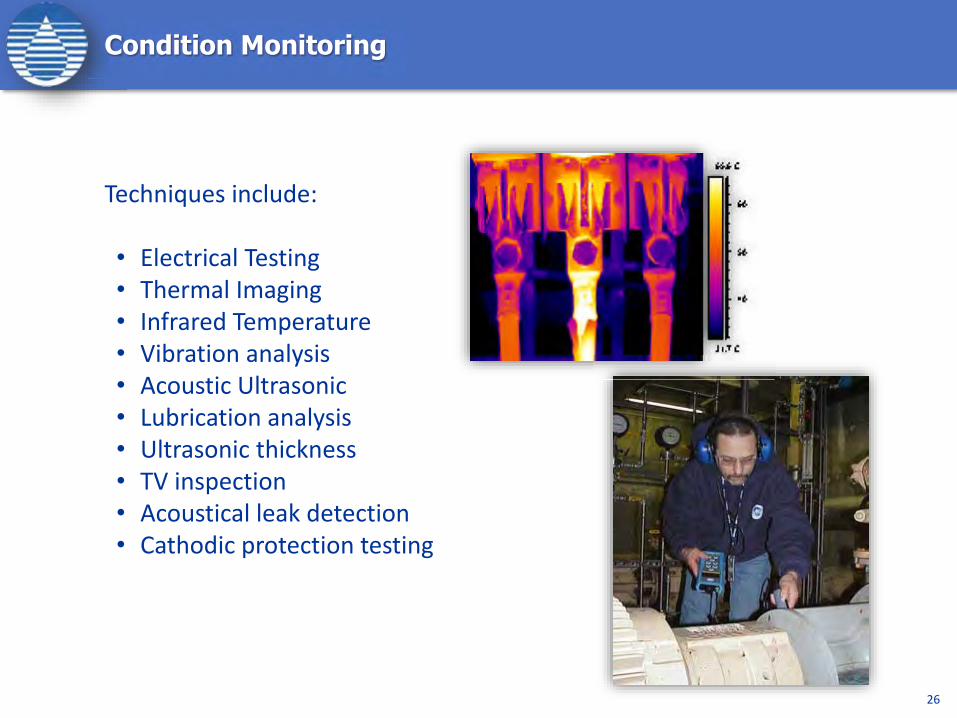
Techniques include:
• Electrical Testing• Thermal Imaging• Infrared Temperature• Vibration analysis• Acoustic Ultrasonic• Lubrication analysis• Ultrasonic thickness• TV inspection• Acoustical leak detection• Cathodic protection testing

Condition Assessments
27
• Components include Roofs, Coatings, Gearboxes, Pumps
• Identified in the Master Plan
• Budgeted in the Capital Program
How Does MWRA Track What It Owns?
28
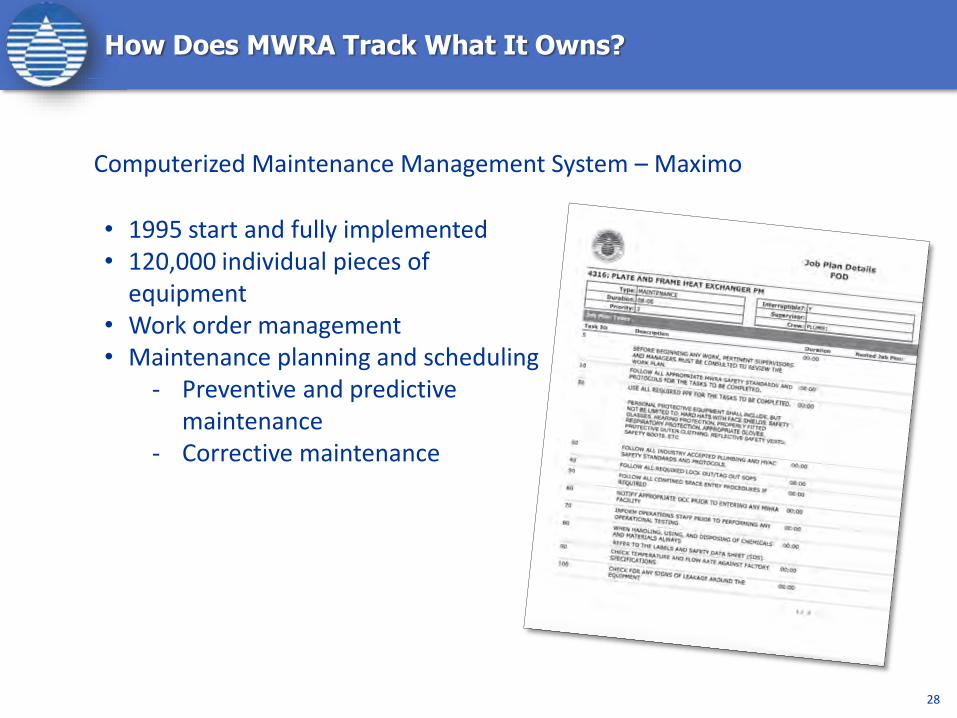
Computerized Maintenance Management System – Maximo
• 1995 start and fully implemented• 120,000 individual pieces of
equipment• Work order management• Maintenance planning and scheduling
- Preventive and predictive maintenance
- Corrective maintenance

Who Performs Maintenance?
29
• In house staff complete majority of maintenance
• 491 maintenance staff• 40% of all MWRA
• Contracted services • $13 million per year• Specialized training,
experience or tools• One time or intermittent
29

Is Enough Maintenance Being Done?
30
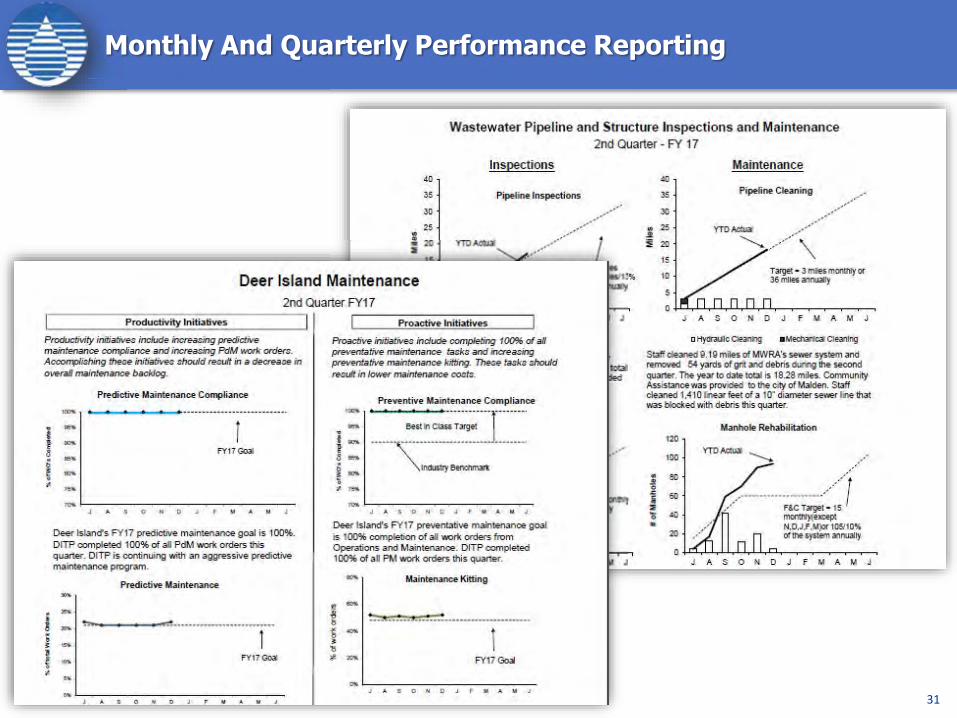
• Over 36 maintenance metrics are tracked• Reviewed daily, monthly, quarterly, and yearly• Reported internally and externally
For example:• 99.9% of all predictive maintenance work
orders completed in FY16• 10,000 hours of preventive maintenance
completed by operations staff
Reviewed daily, monthly, quarterly, and yearly
99.9% of all predictive maintenance work
10,000 hours of preventive maintenance
Monthly And Quarterly Performance Reporting
31

$0
$5
$10
$15
$20
$25
$30
$35
FY86
FY87
FY88
FY89
FY90
FY91
FY92
FY93
FY 9
4
FY 9
5
FY 9
6
FY 9
7
FY 9
8
FY 9
9
FY 0
0
FY 0
1
FY 0
2
FY 0
3
FY 0
4
FY 0
5
FY 0
6
FY 0
7
FY 0
8
FY 0
9
FY10
FY11
FY12
FY13
FY14
FY15
FY16
$s in
Mill
ions
Annual Maintenance Spending Continues To Climb
32
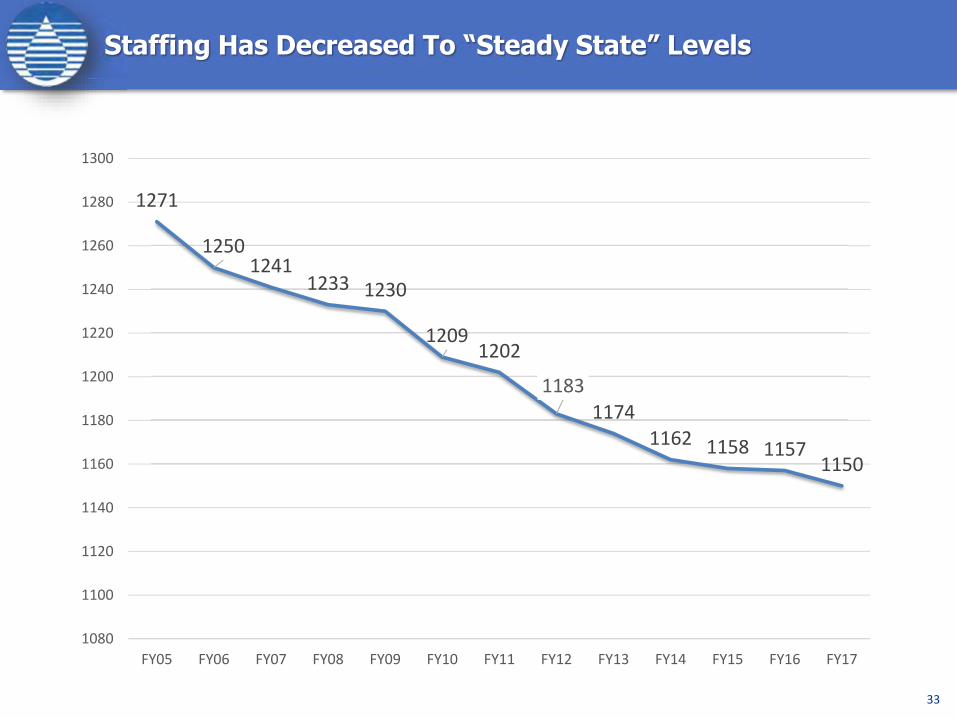
1271
12501241
1233 1230
12091202
11831174
1162 1158 11571150
1080
1100
1120
1140
1160
1180
1200
1220
1240
1260
1280
1300
FY05 FY06 FY07 FY08 FY09 FY10 FY11 FY12 FY13 FY14 FY15 FY16 FY17
Staffing Has Decreased To “Steady State” Levels
33
New Challenges
34

35
Preparing for Climate Change:Preparing for Climate Change:Preparing for Climate Change:Drinking Water System Is In Good Shape
• Quabbin Reservoir, Belchertown– 65 miles west of Boston– Elevation 528 feet
• Wachusett Reservoir, Clinton– 35 miles west of Boston– Elevation 395 feet
• Water treatment plant is in Marlborough
• 85% of water delivered by gravity
• Lowest elevation of a water tank is 192 feet above sea level
35

• Deer Island plant fully protected– 100-year flood– 1.9-foot sea level rise– Wave runup of 14 feet on east side and 2 feet on west side
• On-site power plant ensures uninterrupted power supply
36
• Nut Island headworks in Quincy similarly designed for sea level rise
On The Wastewater Side, Sea Level Rise Was Anticipated In The On The Wastewater Side, Sea Level Rise Was Anticipated In The On The Wastewater Side, Sea Level Rise Was Anticipated In The Design of Deer Island Treatment Plant

21 Of MWRA Coastal Sewer Facilities Are Within 21 Of MWRA Coastal Sewer Facilities Are Within 21 Of MWRA Coastal Sewer Facilities Are Within 15 Feet Of Mean Sea Level
3737
38
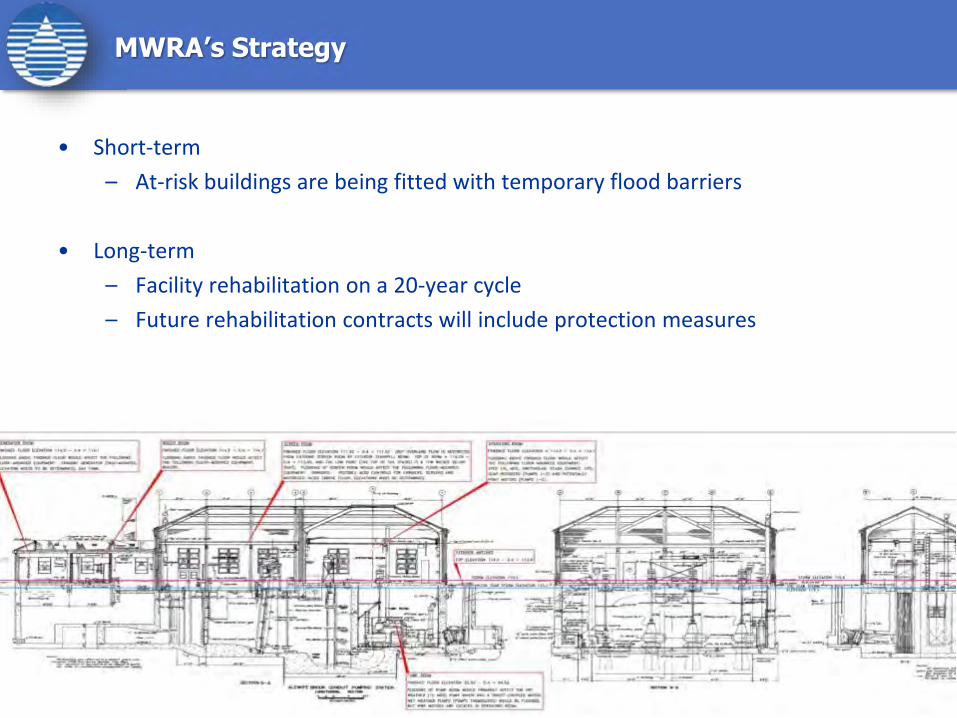
MWRA’s Strategy
• Short-term– At-risk buildings are being fitted with temporary flood barriers
• Long-term– Facility rehabilitation on a 20-year cycle– Future rehabilitation contracts will include protection measures

Envelope Flood Protection Measures
39
Flood logs (exterior)
Flood logs (interior)
Watertight hatch
Flood logs (interior)
All flood logs to el 115.6

Envelope Flood Protection Measures
4040
Install valve for landing drain
Flood logs (exterior)
Raise berm to 115.6
Flood logs at berm to 115.6
Flood logs (interior)
Flood logs (interior)

41
Pipeline Corrosion
• Original pipe was 77 years old• New Pipe was Installed in 2004 with coating and insulation

• Soil properties
• Electrochemical reactions with other nearby dissimilar metals
• High levels of hydrogen sulfide
• In storage tanks, reaction at the interface between the water and the interior surface of the tank wall
• Effects of stray currents from other structures in the vicinity
42
Causes of Corrosion

43
Typical Test Stations and Rectifier Units
57-42-CTS1
57-43-RFT5

• text
Corrosion Mitigation
44
• text
Tape wrapped steel pipe reducer
Passive Sacrificial Anode System Installation
Anode
Wire Lead to Test Station

The Results
45
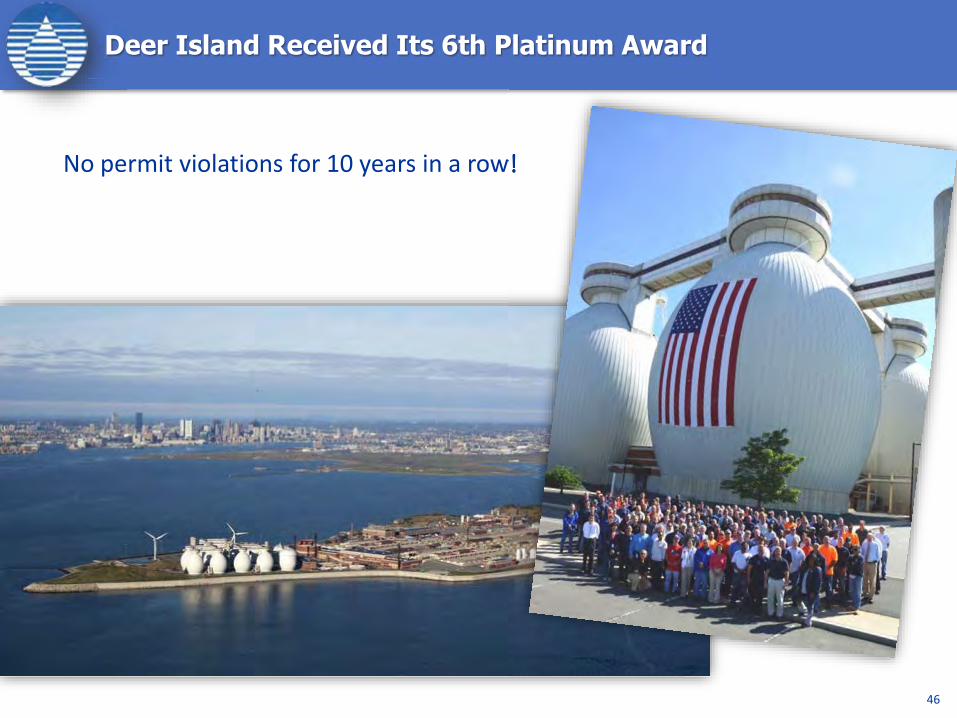
No permit violations for 10 years in a row!
Deer Island Received Its 6th Platinum Award
46
No permit violations for 10 years in a row!
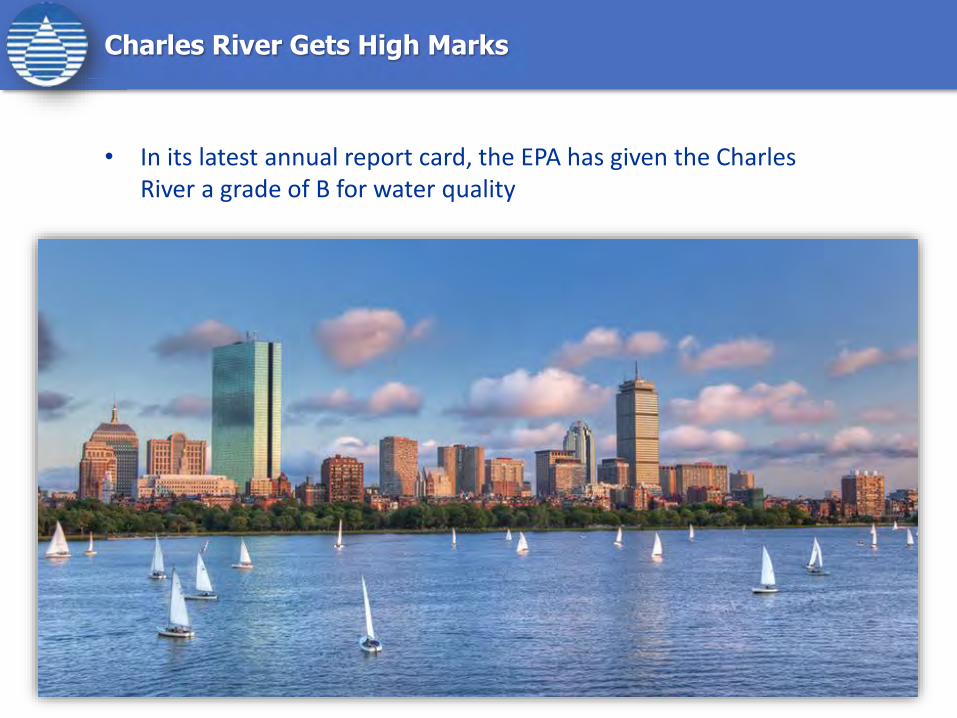
• In its latest annual report card, the EPA has given the Charles River a grade of B for water quality
Charles River Gets High Marks
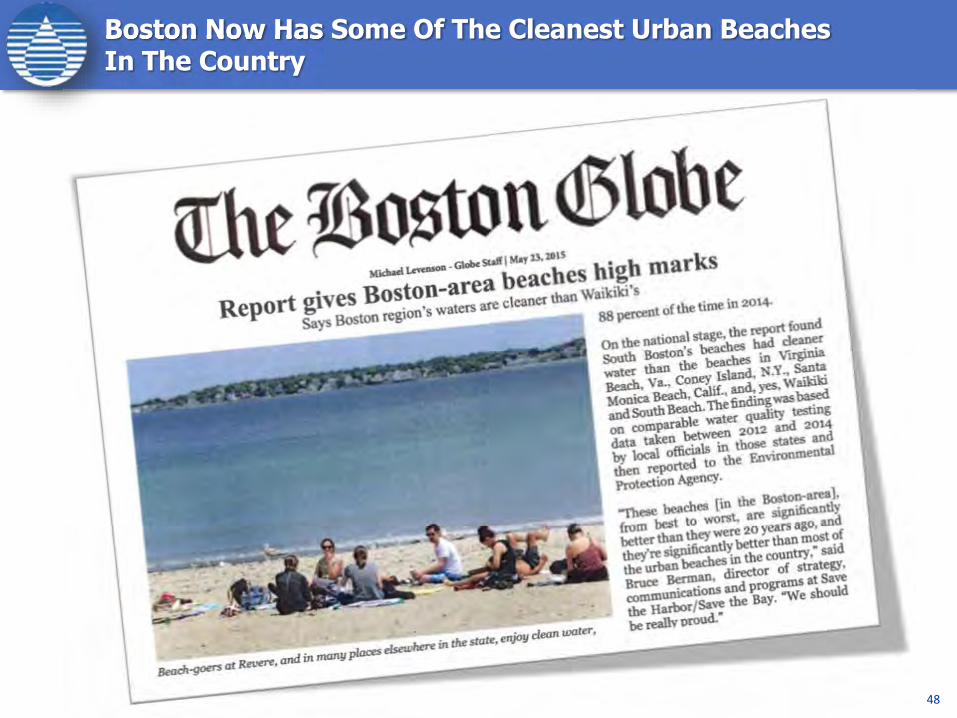
Boston Now Has Some Of The Cleanest Urban Beaches Boston Now Has Some Of The Cleanest Urban Beaches Boston Now Has Some Of The Cleanest Urban Beaches In The Country
48

Boston’s Waterfront Is The Region’s Fastest Growing Zip Code
49

“Best Drinking Water” In The Country
50


