Sustainability and waste management:
a case study on an UK oil refinery during
day-to-day and turnaround operations
Gledys González
A thesis submitted in partial fulfilment of the requirements for the Degree
of Master of Philosophy in sustainability engineering and energy systems
Faculty of Engineering & Physical Sciences
University of Surrey
November 2015
© Gledys González 2015
Declaration of originality
2
Declaration of originality
This thesis and the work to which it refers are the results of my own efforts. Any ideas,
data, images or text resulting from the work of others (whether published or
unpublished) are fully identified as such within the work and attributed to their
originator in the text, bibliography or in footnotes. This thesis has not been submitted in
whole or in part for any other academic degree or professional qualification. I agree that
the University has the right to submit my work to the plagiarism detection service
TurnitinUK for originality checks. Whether or not drafts have been so-assessed, the
University reserves the right to require an electronic version of the final document (as
submitted) for assessment as above.
Student’s name: _________________ Date: _______________
Summary
3
Summary
To achieve sustainability in the global economy requires all organisations to operate in
ways which are equitable and socially acceptable, technological viable, economically
affordable and with minimum impact to the environment. Worldwide, and in particular
in the UK, the sustainability of the oil refining industry has come under increasing
scrutiny in an environment with high energy demand and stringent regulations. The oil
refining sector processes large amounts of raw materials and produces substantial
quantities of waste which need to be treated, mostly at facilities away from the refinery
site. Waste management represents a challenge to the industry not only because of the
impacts to the environment but also due to high treatment costs.
This thesis describes research carried out to investigate and address some of the
problems related to sustainability, in particular the management of raw materials and
waste, based on the Valero Refinery, Pembroke, Wales as a specific example.
The starting point of this research was a review of general theory, legislation and
practice for measuring, monitoring and managing raw materials consumption and waste
production. This was followed by an analysis of specific waste management practices at
the Valero Refinery which showed that individual process units can do much to improve
their performance by increased monitoring and control. Following the identification,
classification and quantification of refinery waste over 2007-2013, it was observed that
although variable, the annual amount of total waste produced has shown an increasing
trend from about 21 kt to 24 kt with a peak of 29 kt in 2011. Similarly, the total annual
costs of waste treatment have increased from about £2.0 M to £5.0 M. From this trend it
was identified that hazardous waste was the largest (about 75 % w/w) and costliest
(about 70 % of total) waste to treat, composed mainly of fluoridic caustic (about 85 %)
but with significant contributions from phenolic caustic and oily sludge.
Finally, a novel application of material flow analysis (MFA) methodology was
developed to detect points where value could be recovered and waste reduced during a
refinery-wide turnaround for maintenance and project purposes. The MFA revealed that
waste management practices, in particular collection, segregation and temporary storage
of some wastes, can be improved to avoid environmental contamination, landfilling and
transportation within and outside the Refinery boundaries. It also evidenced
opportunities to investigate alternative treatment methods, especially for used catalysts.
Acknowledgements
4
Acknowledgements
I would like to thank the Centre for Environmental Strategy (CES) of the University of
Surrey especially Chris France for giving me the opportunity to carry out this research
providing all the support on both academic and personal levels. To Brian and Kelly a
big “thank you” for their continued help which made the research process less difficult.
To my academic supervisors Phil Holmes and Roland Clift goes my deepest gratitude
for their constant guidance and dedication during the last three years, thanks for your
wisdom, motivation and experience. Special thanks to Aidong Yang who gave guidance
at the beginning of this project.
I do not have words to express my gratitude to Neil White, my industrial supervisor
who provided all the expertise and information required to finish this project. Thank
you very much Neil for making the time spent at the Refinery an invaluable
professional and personal experience.
I am especially grateful to the HES team for sharing unforgettable moments; guys your
commitment and hard work have made Pembroke one of the most reliable, safe,
efficient and environmentally sound world class refinery.
Special thanks go to Veolia, particularly to Wayne Tapper who kindly answered all of
my questions related to the management of waste on-off site.
The Environment Agency of England deserves special thanks for providing pollution
inventory data with regard to the production of oily sludge.
I would also like to thank my family, in particular my parents, brother, sisters and
Aunty G.R., whose love, patience and wise words were always there specially when
most needed.
Special thoughts go to my husband Inigo and daughter Giovanna, two precious gifts that
God has given me; thanks for being with me on this journey unconditionally.
Finally I would like to say “Glory to God in the highest”, my Lord Jesus Christ, the
way, the truth and the life.
Table of contents
5
Table of contents
1 INTRODUCTION ................................................................................................ 23
1.1 The general approach to sustainability ............................................................... 23
1.2 The challenge of achieving sustainability in the oil refining industry ............. 24
1.2.1 Oil refining business ....................................................................................... 26
1.2.2 Oil refinery operations and main environmental issues .................................. 29
1.2.3 EU environmental policies and targets: key challenges for the oil refining
industry ....................................................................................................................... 34
1.3 Problem definition ................................................................................................ 36
1.4 Project aim and specific objectives ...................................................................... 37
1.5 Thesis content ........................................................................................................ 38
2 REVIEWS OF ESTABLISHED THEORY AND PRACTICE ........................ 39
2.1 Introduction ........................................................................................................... 39
2.2 Sustainable development in manufacturing processes ...................................... 40
2.2.1 The concept of sustainable development and the systems approach .............. 40
2.2.2 Sustainable development in the EU ................................................................ 42
2.2.3 Measuring progress in sustainable development ............................................ 47
2.2.4 Existing tools for sustainability assessment .................................................... 50
2.2.4.1 Life cycle assessment (LCA) .................................................................. 52
2.2.4.2 Environmental impact assessment (EIA) ................................................ 56
2.2.4.3 Corporate social responsibility (CSR) .................................................... 59
2.2.5 Sustainable industry ........................................................................................ 63
2.3 Regulatory frameworks governing EU/UK oil refining facilities ..................... 65
2.3.1 Legislative framework .................................................................................... 66
2.3.1.1 Industrial Emissions Directive (IED) ..................................................... 67
2.3.1.2 Waste Framework Directive (WFD) ....................................................... 71
2.3.1.3 List of Waste (LoW) ............................................................................... 74
Table of contents
6
2.3.1.4 Regulation on Shipments of Waste ......................................................... 75
2.3.1.5 Landfill Directive .................................................................................... 76
2.4 Environmental management in the oil refining industry .................................. 76
2.4.1 Integrated approach, continuous improvement and pollution prevention ...... 77
2.4.1.1 Integrated approach and continuous improvement ................................. 78
2.4.1.2 Pollution prevention ................................................................................ 80
2.4.2 Environmental Management System of Valero Refinery, Pembroke ............. 81
2.4.2.1 Environmental policy .............................................................................. 82
2.4.2.2 Procedures, work processes and other documents .................................. 84
2.4.3 Environmental permitting: the case of Valero Refinery, Pembroke ............... 88
2.4.4 Waste management practices at Valero Refinery, Pembroke ......................... 94
2.4.4.1 Types, treatment and classification of waste .......................................... 95
2.4.4.2 On-site management ............................................................................... 95
2.4.4.3 Relevant improvements on the management of waste ............................ 97
2.4.4.4 PKB-0021-Coordinate & Manage Waste ............................................... 99
2.4.5 Gaps in the current practices ......................................................................... 100
2.5 Material flow analysis in the context of resource efficiency and waste
management ................................................................................................................ 102
2.5.1 MFA principle and methodology .................................................................. 105
2.5.1.1 System definition .................................................................................. 107
2.5.1.2 Identification of relevant process, flows and stocks ............................. 108
2.5.1.3 Compilation of material flow diagrams ................................................ 108
2.5.1.4 Estimation of mass flows ...................................................................... 108
2.5.1.5 Interpretation of results and conclusions .............................................. 109
2.5.2 MFA applications ......................................................................................... 109
2.5.3 Gaps in the current knowledge ..................................................................... 112
2.6 Oily sludge production at the oil refining industry ......................................... 112
2.6.1 General aspects ............................................................................................. 112
2.6.2 Treatment methods: overview ...................................................................... 113
2.6.2.1 Oily sludge: oil recovery techniques and disposal methods ................. 115
2.6.3 Tools available for technology selection: identified opportunities ............... 118
2.6.3.1 Multi-criteria decision analysis (MCDA) tools .................................... 118
Table of contents
7
2.6.3.2 Identified opportunities in the treatment of oily sludge ........................ 119
2.7 Findings and concluding remarks ..................................................................... 119
2.7.1 Sustainable development in manufacturing facilities in the EU and UK ..... 120
2.7.2 Regulatory frameworks governing EU/UK oil refining facilities ................ 120
2.7.3 Environmental management in the oil refining industry .............................. 121
2.7.4 Waste management practices in Valero Refinery, Pembroke ....................... 122
2.7.5 Material Flow Analysis for resource efficiency and waste management ..... 123
2.7.6 Review of current and new technologies for the treatment of oily sludge
generated at the oil refining industry ........................................................................ 123
3 METHODOLOGY ............................................................................................. 125
3.1 Introduction ......................................................................................................... 125
3.2 Continuous review, monitoring and control of waste ...................................... 125
3.2.1 Five-Year Waste Review .............................................................................. 127
3.2.1.1 Period of study and activities involved ................................................. 128
3.2.1.2 Data collection ...................................................................................... 128
3.2.1.3 Classification of waste: types and treatment methods .......................... 130
3.2.1.4 Development of a template for data recording and analysis ................. 130
3.2.1.5 KPIs definition/calculation ................................................................... 131
3.2.2 Yearly Waste Monitoring ............................................................................. 131
3.2.3 Monthly Waste Control ................................................................................ 132
3.3 Assessment of flow of materials from use/consumption to the generation of
waste ............................................................................................................................. 133
3.3.1 Valero Refinery, Pembroke, 2012 turnaround: definition, space and time
boundaries ................................................................................................................. 136
3.3.2 Preparation for monitoring the TA ............................................................... 137
3.3.3 MFA in the context of 2012 turnaround of Valero Refinery, Pembroke ...... 139
3.3.4 Definition stage ............................................................................................. 139
3.3.5 Calculation stage ........................................................................................... 139
3.3.6 Analysis stage ............................................................................................... 140
3.4 Oily sludge treatment ......................................................................................... 140
Table of contents
8
3.4.1 Review of oily sludge pollution from oil refineries of England and Wales . 141
3.5 Methodology and results chapters: links and significance.............................. 142
4 RESULTS AND DISCUSSION ......................................................................... 144
4.1 Introduction ......................................................................................................... 144
4.2 Five-Year Waste Review .................................................................................... 145
4.2.1 Collection of data over 2007-2011 ............................................................... 145
4.2.2 Overall trends in total waste generated and costs in the period 2007-2011 . 146
4.2.3 Disposal and recycling operations and total quantity of HW and NHW treated
...................................................................................................................... 149
4.2.4 Detailed breakdown of HW and NHW Disposed and Recycled over 2007-
2011: amount generated and costs ............................................................................ 152
4.2.5 Refinery TA and MO events that generated wastes over 2007-2011 ........... 157
4.2.6 Trends in production and costs of fluoridic caustic and all other wastes ..... 160
4.2.6.1 Production and costs of fluoridic caustic (EWC code 05.01.11*) ........ 161
4.2.7 Trends in production and costs of HW other than fluoridic caustic ............. 162
4.2.7.1 Production and costs of oily sludge from different sources .................. 163
4.2.7.2 Production and costs of phenolic caustic (EWC code 05.01.11*) ........ 167
4.2.7.3 Production and costs of waste blasting materials (EWC code 12.01.16*) .
.............................................................................................................. 168
4.2.7.4 Production and costs of soil and stones containing dangerous substances
(EWC code 17.05.03*) ......................................................................................... 168
4.2.8 NHW production and costs ........................................................................... 168
4.2.8.1 Spent FCCU catalyst (EWC code 16.08.04) ......................................... 170
4.2.8.2 Metals (EWC code 16.08.04) ............................................................... 170
4.2.8.3 Mixed municipal waste (EWC code 20.01.03) ..................................... 171
4.2.8.4 Spent FCCU catalyst (EWC code 16.08.04) not from FCCU .............. 171
4.2.9 Refinery Waste and Cost KPIs over 2007-2011 ........................................... 172
4.3 Refinery waste production and costs in 2012 ................................................... 173
4.4 Yearly Waste Monitoring ................................................................................... 176
4.4.1 Overall Refinery waste performance ............................................................ 177
Table of contents
9
4.4.2 Detailed on-site work and off-site waste costs ............................................. 181
4.4.3 Most significant waste streams in 2013 ........................................................ 183
4.4.4 Refinery waste ownership and performance at a business unit level in 2013 ....
...................................................................................................................... 187
4.4.5 Relevant aspects of the 2013 Detailed Waste Database PI ........................... 190
4.5 Monthly waste control ........................................................................................ 190
4.6 MFA applied to the Refinery TA ....................................................................... 193
4.6.1 Raw materials and waste streams used/produced in the 2012 Refinery TA . 193
4.6.1.1 Unifiner and HTU-2 catalysts ............................................................... 194
4.6.1.2 CCR/CRU catalyst ................................................................................ 196
4.6.1.3 Blasting materials ................................................................................. 200
4.6.1.4 Insulation materials ............................................................................... 202
4.6.1.5 Personal Protective Equipment (PPE) .................................................. 204
4.6.1.6 Metals .................................................................................................... 206
4.7 Review of oily sludge produced by England and Wales oil refineries over
2008-2012 ..................................................................................................................... 209
4.8 Findings and concluding remarks ..................................................................... 212
4.8.1 Five-Year Waste Review .............................................................................. 212
4.8.2 Refinery waste production and costs analysis in 2012 ................................. 215
4.8.3 Yearly Waste Monitoring ............................................................................. 216
4.8.4 Monthly Waste Control ................................................................................ 218
4.8.5 MFA applied to the Refinery TA .................................................................. 218
4.8.6 Review of oily sludge produced by England and Wales oil refineries over
2008-2012 ................................................................................................................. 220
5 CONCLUSIONS AND RECOMMENDATIONS............................................ 221
REFERENCES ............................................................................................................ 225
APPENDIX .................................................................................................................. 249
Appendix A. EMS elements based on ISO-14001:2004 at glance ......................... 250
Table of contents
10
Appendix B. Refinery areas, business units and waste streams ........................... 251
Appendix C. List of Waste (LoW) ........................................................................... 262
Appendix D. Waste Framework Directive: disposal and recovery (recycling) codes
.............................................................................................................. 268
Appendix E. Waste collection, vehicles and containers most used in Valero
Refinery, Pembroke .................................................................................................... 270
Appendix F. Main waste streams, handling and storage areas in Valero Refinery,
Pembroke, and Off-Site Treatment Facilities .......................................................... 271
Appendix G. Work process PKB-0021-Coordinate and Manage Waste of Valero
Refinery, Pembroke .................................................................................................... 272
Appendix H. Criteria for determining best available techniques. ........................ 278
Appendix I. Wastes generated in Valero Refinery, Pembroke, over 2007-2011 .......
.................................................................................................................. 279
Appendix J. Crude oil processed and alkylate produced over 2007-2011 in Valero
Refinery, Pembroke .................................................................................................... 286
Appendix K. Waste and Cost KPIs per type of waste of Valero Refinery,
Pembroke, over 2007-2011 ......................................................................................... 287
Appendix L. Five Year Waste Review Executive Summary of Valero Refinery,
Pembroke .................................................................................................................. 289
Appendix M. Waste production and off-site costs per type of waste in 2012 of
Valero Refinery, Pembroke ....................................................................................... 296
Appendix N. Waste production and off-site costs per treatment method and EWC
codes in 2013 of Valero Refinery, Pembroke ........................................................... 299
Appendix O. Detailed metals production and rebate costs in 2013 of Valero
Refinery, Pembroke .................................................................................................... 307
Table of contents
11
Appendix P. Detailed oily sludge production of England and Wales oil refineries
over 2008-2012 ............................................................................................................. 309
List of figures
12
List of figures
Figure 1.1. Seeking sustainability ................................................................................... 23
Figure 1.2. Growing power demand by region (a) and by fuel (b) ................................. 25
Figure 1.3. Refining in the oil industry context .............................................................. 26
Figure 1.4. UK refineries’ primary oil processing capacities and location as at the end of
2012 ........................................................................................................................ 28
Figure 1.5. Schematic flow diagram of a typical crude oil refinery ............................... 31
Figure 1.6. Representative specific consumption and emission levels in European
refineries ................................................................................................................. 32
Figure 1.7. Thesis structure ............................................................................................. 38
Figure 2.1. Schematic diagram of the human economy ................................................. 41
Figure 2.2. Interaction of viability loops in the real world ............................................. 44
Figure 2.3. The process of sustainable development ...................................................... 44
Figure 2.4. Generation of waste (excluding major mineral wastes) per capita in
Denmark, Germany and the UK over 2004-2010 ................................................... 49
Figure 2.5. The life cycle of a product ............................................................................ 53
Figure 2.6. LCA methodology ........................................................................................ 54
Figure 2.7. The stages in the EIA process ...................................................................... 57
Figure 2.8. Tools striving sustainability: relationship .................................................... 62
Figure 2.9. Transposition of the most relevant EU legislation (covering environmental
permitting and waste) into UK law and implementation in the refining industry of
England and Wales ................................................................................................. 69
Figure 2.10. IED second principle: BAT ........................................................................ 70
Figure 2.11. Waste Management Hierarchy ................................................................... 72
Figure 2.12. A vision of environmental management in the oil refining industry ......... 79
Figure 2.13. EMS Process at Valero Refinery, Pembroke .............................................. 83
Figure 2.14. General structure of environmental permits in England and Wales ........... 88
Figure 2.15. Conditions addressed and schedules of the Refinery’s Environmental
Permit ...................................................................................................................... 90
Figure 2.16. Overview of waste management at the Refinery ........................................ 96
Figure 2.17. Overall vision of waste management at the Refinery including potential
improvements ........................................................................................................ 102
List of figures
13
Figure 2.18. Conceptual representation of mass flowing through a defined system .... 105
Figure 2.19. Main elements of a MFA .......................................................................... 106
Figure 2.20. Overview of oily sludge treatment methods ............................................. 114
Figure 3.1. Methodology for control, monitoring and review of waste at the Refinery .....
.............................................................................................................................. 126
Figure 3.2. Outline of the Five-Year Waste Review methodology .............................. 127
Figure 3.3. Outline of the Five-Year Waste Review methodology: user approach ...... 128
Figure 3.4. Waste classification developed for the continuous review, monitoring and
control of waste ..................................................................................................... 130
Figure 3.5. Structure and contents of the 2013 Detailed Waste Database PI ............... 134
Figure 3.6. Outline of Waste in Brief Monthly Bulletin ............................................... 136
Figure 3.7. The Refinery 2012 TA Phasing Plan .......................................................... 138
Figure 3.8. MFA methodology developed for application during the 2012 Refinery TA
.............................................................................................................................. 139
Figure 3.9. Methodology to determine technology solutions for the treatment of oily
sludge .................................................................................................................... 141
Figure 4.1. Amount of HW and NHW Disposed and Recycled in the Refinery over
2007-2011 ............................................................................................................. 148
Figure 4.2. Costs of HW and NHW Disposed and Recycled in the Refinery over 2007-
2011 ...................................................................................................................... 148
Figure 4.3. Quantity of total refinery waste treated over the five year period of 2007-
2011 ...................................................................................................................... 150
Figure 4.4. Costs of total refinery waste treated over the five year period of 2007-2011
.............................................................................................................................. 151
Figure 4.5. Distribution of waste generated in the Refinery over 2007-2011 .............. 154
Figure 4.6. Distribution of the costs of waste in the Refinery over 2007-2011 ............ 155
Figure 4.7. Total waste produced in the Refinery over 2007-2011 compared to fluoridic
caustic ................................................................................................................... 160
Figure 4.8. Refinery waste costs over 2007-2011 ........................................................ 161
Figure 4.9. Production (a) and costs (b) of most significant HW generated at the
Refinery over 2007-2011 excluding fluoridic caustic .......................................... 164
Figure 4.10. Production and costs of oily sludge produced in the Refinery over 2007-
2011 ...................................................................................................................... 165
Figure 4.11. Production and costs of NHW over 2007-2011 ....................................... 169
List of figures
14
Figure 4.12. Refinery Waste and Cost KPIs over 2007-2011 ...................................... 172
Figure 4.13. Normalised Amount of Alkylate Waste in the Refinery over 2007-2011 173
Figure 4.14. Total Refinery waste production and costs in 2013 excluding metals ..... 177
Figure 4.15. Refinery waste production (a) and off-site costs (b) by type of waste in
2013 ...................................................................................................................... 178
Figure 4.16. Refinery waste production in 2013 per treatment method ....................... 179
Figure 4.17. Detailed Refinery on-site work costs in 2013 .......................................... 182
Figure 4.18. Detailed Refinery off-site waste costs in 2013 ......................................... 182
Figure 4.19. Production and costs of most significant wastes in 2013 ......................... 183
Figure 4.20. Ferrous (a) and non-ferrous (b) metals produced in the Refinery in 2013186
Figure 4.21. Refinery waste production at the BOs, B&S and Gral areas in 2013 ...... 187
Figure 4.22. Refinery waste production in 2013 at the areas: Utls and WOs ............... 189
Figure 4.23. Refinery Waste in brief monthly bulletin December 2013 ...................... 192
Figure 4.24. Hydrotreating catalysts material flow diagram for the 2012 Refinery TA
.............................................................................................................................. 197
Figure 4.25. Reforming catalyst material flow diagram for the 2012 Refinery TA ..... 199
Figure 4.26. Blasting materials flow diagram over the 2012 Refinery TA .................. 201
Figure 4.27. Insulation materials flow diagram over the 2012 Refinery TA ................ 203
Figure 4.28. PPE material flow diagram over the 2012 Refinery TA .......................... 205
Figure 4.29. Metals flow diagram over the 2012 Refinery TA .................................... 208
Figure 4.30. Oil refineries total waste production in England and Wales over 2008-2012
.............................................................................................................................. 209
Figure 4.31. Oily sludge production of main oil refineries in England and Wales over
2008-2012 ............................................................................................................. 210
List of tables
15
List of tables
Table 1.1. Yields of UK oil refinery products and main uses in 2012 ........................... 30
Table 2.1. A summary of key performance indicators for measuring sustainability
performance of manufacturing facilities ................................................................. 48
Table 2.2. Tools with a common purpose: Sustainability............................................... 51
Table 2.3. Material intensity of materials, fuels, transport services, food ...................... 64
Table 2.4. The most relevant EU legislation covering environmental permitting and
waste of the oil refining industry ............................................................................ 67
Table 2.5. Relationship between the elements of the Refinery EMS: a selected example
................................................................................................................................ 85
Table 2.6. Main environmental aspects and impacts of the Refinery associated with
specific areas and business units as at October 2012 .............................................. 87
Table 2.7. Detailed conditions of the Refinery’s Environmental Permit ........................ 91
Table 2.8. Information detailed in the Schedules of the Refinery’s Environmental Permit
................................................................................................................................ 92
Table 2.9. Progress made on waste management at the Refinery with regard to relevant
UK regulations ........................................................................................................ 98
Table 2.10. MFA study areas and applications ............................................................. 110
Table 2.11. Three examples of MFA case studies ........................................................ 111
Table 2.12. Main features of oily sludge treatment methods: oil recovery .................. 116
Table 2.13. Main features of oily sludge disposal methods .......................................... 117
Table 3.1. Refinery Waste and Cost KPIs. ................................................................... 131
Table 3.2. Description of all types of Refinery on-site work costs in 2013 ................. 132
Table 3.3. Information, description and data sources contained in sheets 3-6 of the 2013
Detailed Waste Database PI .................................................................................. 135
Table 3.4. Specific objectives in relation to Methodology and Results and discussion
chapters: links and significance ............................................................................ 143
Table 4.1. Summary of total waste generated in the Refinery and costs over 2007-2011
.............................................................................................................................. 147
Table 4.2. Treatments used for the disposal of the major constituents of the HW
produced in the Refinery over 2007-2011 ............................................................ 156
List of tables
16
Table 4.3. Treatment operations used for the recycling of NHW most largely produced
in the Refinery over 2007-2011 ............................................................................ 156
Table 4.4. Most relevant turnaround (TA) and maintenance operation (MO) activities
performed on the Refinery business units over 2007-2011 .................................. 158
Table 4.5. Other relevant maintenance operation (MO) activities, costs, amount and type
of waste generated at the Refinery over 2007-2011 ............................................. 159
Table 4.6. Oily sludge generated at the Refinery over 2007-2011 ............................... 164
Table 4.7. Refinery waste production and costs in 2012 .............................................. 174
Table 4.8. Most significant HWD and NHWR generated in the Refinery in 2012 ...... 175
Table 4.9. Production of metallic waste and rebate costs in 2013 ................................ 178
Table 4.10. Production and costs of less significant wastes in 2013 ............................ 185
Table 4.11. Normalised costs of waste treated from BOs, B&S and Gral Refinery areas
during 2013 ........................................................................................................... 188
Table 4.12. Raw materials used and waste streams produced during the 2012 Refinery
TA ......................................................................................................................... 194
Glossary
17
Glossary
AlkyU Alkylation Unit
a.k.a also known as
ARU Amine Recovery Unit
ASO acid soluble oil
B&S Blending and Shipping
BOs Black Oils
£ Sterling Pound
CCR/CRU Catalytic Reforming Unit
CEOs Chief Executive Officers
C&O Cracking and Olefins
CDU Crude Distillation Unit
CO2 carbon dioxide
DEFRA Department for Environment, Food and Rural Affairs
c/w contaminated with
EA Environment Agency
EC European Commission
EIA Energy Information Administration (US government department)
EMS Environmental Management System
EP Environmental Permit (Valero Refinery Pembroke)
EPA Environmental Protection Agency (US government department)
EPR Environmental Permitting Regulations
EU European Union
EWC European Waste Catalogue
FC fluoridic caustic
FCCU Fluidized Catalytic Cracking Unit
Gral General
H2S hydrogen sulphide
HCN heavy catalytic naphtha
HES Health, Environment and Safety
HDS Hydrodesulphurisation
HF hydrofluoric acid
HRU Hydrogen Recovery Unit
HSE Health and Safety Executive
HTU Hydrotreating Unit
HW Hazardous Waste
HWD Hazardous Waste Disposed
HWR Hazardous Waste Recycled
IBC intermediate bulk container
IED Industrial Emissions Directive
IPPC Integrated Pollution Prevention and Control
Glossary
18
Isom Isomerisation Unit
k thousand
kg kilogram
KMU Kerosene Merox Unit
KPI key performance indicator
LCA life cycle assessment
LCN light catalytic naphtha
LCT life cycle thinking
LPG liquefied petroleum gas
LPGRU Liquid Petroleum Gas Recovery Unit
LoW List of Waste
M million
MFSU manufacture, formulation, supply and use
MO maintenance operation
MSDS Material Safety Data Sheet
NaF sodium fluoride
N/A not applicable
NHW Non-Hazardous Waste
NHWD Non-Hazardous Waste Disposed
NHWR Non-Hazardous Waste Recycled
NRW Natural Resources Wales
NOx nitrogen oxide
n/o/s not otherwise specified
OECD Organisation for Economic Co-operation and Development
PAHs polyaromatic hydrocarbons
PI Pollution Inventory
PKB Pembroke Knowledge Base
PPC Pollution Prevention and Control
PPE personal protective equipment
PPs procedures (Valero Refinery, Pembroke, EMS)
Q Quarter
Qty Quantity
RBI risk based inspection
REL rear end loader
RORO roll-on/roll-off
SOx sulphur oxide
SRU Sulphur Recovery Unit
t tonne (1000 kg)
TA Turnaround
UKPIA United Kingdom Petroleum Industry Association
ULSG Ultra Low Sulphur Gasoline
US United States
Utls Utilities
VAT Value Added Tax
Glossary
19
VBU Visbreaking Unit
VDU Vacuum Distillation Unit
VGO Vacuum Gas Oil
VOCs volatile organic compounds
WAC Waste Acceptance Criteria
WEEE Waste Electrical and Electronic Equipment
WFD Waste Framework Directive
WMP Waste Management Plan
WOs White Oils
WWTP Waste Water Treatment Plant
y year
Definitions
20
Definitions
Alkylate Product of the alkylation process. It is a highly branched
alkane used as a premium gasoline blending stock which is
high octane, clean burning and good anti-knocking
properties.
Alkylation A catalytic process in which olefins are combined with iso-
butane in the presence of acid catalysts to yield a highly
branched alkane product in the gasoline boiling range
called alkylate.
Collection Gathering of waste, including the preliminary sorting and
storage of waste for the purposes of transport to a waste
treatment facility.
Disposal Any operation which is not recovery, even where the
operation has, as a secondary consequence, the reclamation
of substances or energy. In the context of this study,
disposal operations are performed off-site. They include
transportation of the waste streams from the Refinery to
the third party treatment facility and the operations to treat
and dispose of waste.
Fluoridic Caustic A waste stream resulting from the treatment of
hydrofluoric acid with bases.
Hazardous Waste Waste which is harmful to human health, or to the
environment, either immediately or over an extended
period of time.
Hydrofluoric acid A catalyst that promotes the reaction between olefins and
iso-butane to produce Alkylate.
IndX An intranet based system that references plant information.
It displays live site-wide data and possesses many useful
trending capabilities that can be used for analysis or
troubleshooting.
Maintenance Operations Activities performed on-site that can cause a partial or a
total shutdown of the Refinery business units. Generally,
Definitions
21
the scope of work of these activities is more limited than
the scope of work of a turnaround (TA).
Non-Hazardous Waste Municipal, industrial and commercial waste that does not
have a toxic or dangerous character.
Plant information Basic and calculated plant operating data such as, flow,
temperature, pressure, stream composition, mass balance,
etc.
Recovery Any operation in which the principal result is waste
serving a useful purpose by replacing other materials
which would otherwise have been used to fulfil a particular
function, or waste being prepared to fulfil that function, in
the plant or in the wider economy.
Recycling Any recovery operation by which waste materials are
reprocessed into products, materials or substances whether
for the original or other purposes. It includes the
reprocessing of organic material but does not include
energy recovery and the reprocessing into materials that
are to be used as fuels or for backfilling operations. In the
context of this study, recycling operations are performed
off-site. They include transportation of the waste streams
from the Refinery to the third party recycling facility and
the recovery operations of waste.
Treatment Recovery and disposal operations, including project work
(preparation prior to or post recovery or disposal
operations).
TR548 Waste Database An intranet based database through which site personnel at
the Refinery record information such as name of waste
originator, location of waste, waste material, quantity, final
destination and treatment method.
Unallocated on-site work A term used in the Five-Year Waste Review to define all
type of activities carried out by Valero Pembroke Refinery
Waste Contractor on-site such as drains cleaning, desludge
operations, clearing of catalyst lines, etc).
Definitions
22
Unallocated on-site work
costs
Includes all costs derived from unallocated on-site work,
supply and rental of materials, equipment and vehicles for
waste management on-site and waste contractor labour.
Waste Any substance or object which the holder discards or
intends or is required to discard.
Waste management The collection, transport, recovery and disposal of waste,
including the supervision of such operations and the after-
care of disposal sites, and including actions taken as a
dealer (purchases and subsequently sells waste) or broker
(acts on behalf of others arranging recovery or disposal of
waste).
Waste producer Anyone whose activities produce waste (original waste
producer) or anyone who carries out pre-processing,
mixing or other operations resulting in a change in the
nature or composition of this waste. In the context of this
report, the waste producer is the Refinery.
Chapter 1- Introduction
23
1 INTRODUCTION
1.1 The general approach to sustainability
The sustainability of the oil refining industry worldwide and in particular in the UK has
become essential in an environment influenced by a growing energy demand and
characterised by tough regulatory frameworks. Achieving “sustainability” in this
industry and more broadly in all societal systems requires that actions should be taken
to operate in a way which is equitable and socially acceptable (socio-centric concerns),
technologically viable and economically affordable (techno-centric concerns) and
capable of using resources and producing effects which can be supplied and absorbed
by the environment (eco-centric concerns) (Clift, 1995). The Venn diagram shown in
Figure 1.1 presents the relation between these three core areas when pursuing
sustainability. Clift (1995) argues that exceeding any of these limits means that an
activity or a system is unsustainable. Achieving sustainability – i.e. sustainable
development - therefore means following paths of development which balance the
concerns of society, the environment and the economy.
Figure 1.1. Seeking sustainability (Source: Dodds and Venables, 2005, p 7, derived
from Clift, 1995)
The goal of achieving sustainability has imposed important challenges on all parts of
society. In a broader sense, the sustainability of societal systems has been conceived as
the stage when development is sustained in order to improve current human wellbeing
in every part of the globe in manners which do not damage the natural environment and
deprive future generations from meeting their own needs (Azapagic and Perdan, 2011, p
22). To put into practice the concept of sustainability, different strategies and objectives
Chapter 1- Introduction
24
have been set out by governments, international organisations and the general public.
The UK government, for instance, defined four objectives which are at the core of its
sustainable development strategy and addresses the three domains (i.e. society,
environment and economy) pointed out by Clift (1995) as:
• social progress which recognises the needs of everyone;
• effective protection of the environment;
• prudent use of natural resources; and
• maintenance of high stable levels of economic growth and employment
(DEFRA, 2011, p 15).
1.2 The challenge of achieving sustainability in the oil refining industry
In the oil refining industry the importance of addressing sustainability has been widely
recognised, although it is still contentious how an industry which depends on a non-
renewable resource - i.e. crude oil - can be sustainable. Weston (2011, p 17) emphasised
this and argued that “promoting sustainable development in the oil refining industry is a
case of making the present less unsustainable, rather than the future more sustainable”.
It is clear that this statement has a number of implications for the oil refining sector and
leads to the question of how this industry can assist in making the present more
sustainable. To provide an answer, it is imperative to look at the global and domestic
energy scenario which is influenced by oil as a source of primary energy.
It has been estimated that around 90% of the growing power demand over 1990-2030
will occur due to the industrialisation, urbanisation and motorisation of countries
outside the OECD1, particularly China and India as shown in Figure 1.2a. Within this
global scenario it is predicted that oil will likely be the most important fuel in the
energy mix by 2030, followed by coal and gas. Renewable sources will be the fastest
growing fuels but will still represent the smallest proportion of energy mix, as shown in
Figure 1.2b (BP, 2013).
1 The OECD is the Organisation for Economic Co-operation and Development which aims to promote
policies to improve the economic and social well-being of people around the world. USA, Canada, Japan,
UK, Germany, France, Mexico, Chile and Turkey are some of the members of this organisation.
Chapter 1- Introduction
25
Locally it is foreseen that by 2030 oil derivatives will still be meeting an important
portion of primary transport energy needs at 85% of total transport fuels in Europe and
over 32% in the UK (IEA, 2012).
(a) (b)
Figure 1.2. Growing power demand by region (a) and by fuel (b) (Source: BP, 2013, p
10)
Although these facts give oil, and in consequence the refining sector, a key role in
securing energy supply, at least for the next 15 years, the environmental problems
associated with the production and combustion of fossil fuels (e.g. resource
consumption, waste generation and global warming causing climate change2) remain.
Hence it is essential for so very to find solutions which reduce the environmental
impacts, develop new technologies using alternative sources of energy and move
towards low carbon economies. In the UK, the concept of a low carbon economy first
appeared in a white paper 2003 as an inevitable component of sustainable development3
(DTI, 2003).
2 The Fifth Assessment Report (AR5) prepared by the Intergovernmental Panel on Climate Change
(IPCC) provides an important amount of scientific evidence that climate has changed across the globe
over the last 100 years showing the relevant influence of human activities (e.g. burning fossil fuels and
the related green house gas emissions) on these changes (IPCC, 2013).
3 DTI (2003, p 6) stated in the white paper “Our energy future: create low-carbon economy” that a low-
carbon economy is one in which higher living standards and a better quality of life are possible by
producing more with fewer natural resources and generating less pollution.
Chapter 1- Introduction
26
1.2.1 Oil refining business
The oil refining industry is part of an integrated business which altogether represents
"The Oil Industry” as shown in Figure 1.3.
Figure 1.3. Refining in the oil industry context (Source: Europia, 2012, p 2)
An oil refinery aims to convert raw materials (i.e. crude oil) into a wide range of
petroleum products which can be used as energy sources or feedstocks for material
products. As energy sources, the products can be used either directly as fuels or inputs
into electricity generation. As feedstocks, some of the products can be used in the
petrochemical industry. The complexity of a refinery depends mainly on the crude oil
characteristics and the type, number and configuration of the process units. These
factors determine to a large extent the variety, quantity and quality of the products a
refinery generates (Europia, 2012).
The 2013 Digest of United Kingdom Energy Statistics (DUKES) report prepared by
DECC (2013) presented data on UK refineries’ primary oil processing capacities
(distillation, reforming, cracking and conversion) as at the end of 2012 and a map with
their location shown in Figure 1.4. Primary oil included crude oil, natural gas liquids
(NGLs) and other feedstocks. The annual capacity was determined by multiplying the
rated capacity of the plant per day when on stream by the number of days the plant was
on stream during 2012.
As seen in Figure 1.4, the UK in 2012 had in operation ten refineries - six in England,
two in Wales and two in Scotland - strategically located with a total processing capacity
of 120.5 Mt/y. The Refineries underlined in the figure only had distillation capabilities.
Chapter 1- Introduction
27
Europe and in particular the UK refining industry have faced difficult times since 2008
due to a surplus of gasoline in the Atlantic Basin sector caused mainly by the shift on
the demand from petrol to diesel in the European road vehicles and other reasons
including a more intensive use of biofuels in the US and new projects in the Middle
East to increase refining capabilities (McKenna, 2015). It is well known that European
refineries were mainly built over 1950-1970 and designed to process light and sweet
oils leading to higher yields to petrol. Enforcement of new regulatory measures in
Europe related to emissions reduction and improvements in fuel quality specifications,
has also added more pressure to the industry over the last few years and has made more
difficult for them to stay competitive (Energy Intelligence Group, 2010).
In the UK three refineries have closed in five years. In 2009 Petroplus Refinery in
Teesside was shutdown and in 2012, Coryton Refinery located in the South West of
England closed and turned into a marine terminal by the end of 2014 (both refineries are
not shown in Figure 1.4). In 2014, Murco Refinery in Milford Haven, Wales, closed
after a failure to reach a deal with the Swiss firm Klesch Petroleum (McKenna, 2015).
The UK has also seen changes in refinery ownership where, although with low margins,
staying in business is important for some refiners or entering to new markets is
attractive to others (McKenna, 2015). In 2011, Chevron Refinery, Pembroke was sold to
Valero, which also acquired Chevron's marketing and logistics assets in the UK and
Ireland. This acquisition marked Valero’s entry into the European refining market
(BBC, 2011).
Chapter 1- Introduction
28
Figure 1.4. UK refineries’ primary oil processing capacities and location as at the end of
2012 (Source: DECC, 2013, p 65)
The total quantity of primary oil processed in the UK to generate the products shown in
Table 1.1 in 2012 was 68.9 Mt, including natural gas liquids (NGL) (1% w/w) and other
feedstocks (1.9% w/w), equivalent to 80.3 Mm3 (BP, 2014). As seen in Table 1.1,
transport fuels were the largest product; this is common to all UK oil refineries (DECC,
2013, p 68) according to their current configurations. The quantity of motor spirit (a.k.a.
petrol or gasoline) produced was 17.7 Mt or 23.9 Mm3, i.e. the petrol required to
provide 478 M cars/50 L tank loads of which only 75% w/w was consumed locally.
PembrokeValero Energy Ltd
(18 Mt/y)
Milford HavenMurco Pet. Ltd
(10 Mt/y) FawleyExxonMobil(25.7 Mt/y)
KillingholmePhillips 66 UK
(19.7 Mt/y)
Lindsey Oil Refinery LtdTotal (UK)
(15.3 Mt/y)
StanlowEssar Energy PLC
(17.2 Mt/y)
Grangemouth IneosRefining Ltd(15.6 Mt/y)
HarwickPetrochem Carless Ltd.
(0.4 Mt/y)
EasthamEastham Refinery Ltd.
(1.2 Mt/y)
Dundee (Camperdown)Nynas UK AB
(0.7 Mt/y)
Chapter 1- Introduction
29
Table 1.1 shows the yields of UK refinery oil products in 2012 (DECC, 2013). The
quantity of products does not include the amount imported by refineries4.
1.2.2 Oil refinery operations and main environmental issues
This project addresses one of the three areas of sustainable development: the
environment, in relation to the oil refining industry and with particular emphasis on the
UK oil refining industry. In overall terms improving the environmental performance of
the oil refining industry involves maximising energy efficiency, optimising the use of
resources, and reducing or avoiding emissions to air, land and water and the production
of waste. This research focuses on improving the efficiency of the use of raw materials
and enhancing the management of waste.
An oil refinery comprises process units which separate the fractions of crude oil
(atmospheric and vacuum distillation), convert them into useful and valuable products
(isomerisation, reforming, alkylation, catalytic cracking and visbreaking) and treat those
which need to meet specifications according to relevant legislation (hydrotreating and
mercaptan oxidation) (ExxonMobil, 2012). Figure 1.5 shows a schematic of a typical
crude oil refinery and the main products it generates. Units which produce ancillary
services (i.e. cooling water, steam, nitrogen and electricity) and facilities which provide
the site with supply, storage and blending capabilities are also part of an oil refinery.
4 In some cases UK refineries need to import oil products due to increases in local demand which cannot
be met by indigenous production.
Chapter 1- Introduction
30
Table 1.1. Yields of UK oil refinery products and main uses in 2012 (Source: DECC, 2013, pp 76-77 and 79-81)
Petroleum products
Yield
(t product/t primary
oil)*100
Main uses
Motor spirit 25.6
Also known as petrol or gasoline it is used as a fuel for spark-ignition internal combustion engines other than
aircraft engines. It includes the premium unleaded grade (95 octanes) and lead replacement petrol/Super premium
unleaded grade (97 octanes).
Diesel Engined Road
Vehicle (DERV) 22.9 Fuel for use in high speed, compression ignition engines in vehicles subject to vehicle excise duty.
Gas oil 13.0 As a burner fuel in heating installations, industrial gas turbines and DERV for agriculture, fishing and construction.
Fuel oils 10.4 For electricity and heat generation. For heavy duty marine engines requiring pre-heating before combustion.
Aviation turbine fuel (ATF) 8.4 All turbine fuel intended for use in aviation gas turbine power units and including bench testing of aircraft engines.
Other gases 3.8 Used in industries as fuel.
Burning oil 3.3 Also known as kerosene or “paraffin”, used primarily for heating.
Petroleum coke 3.0 Used for metallurgical electrode manufacture and sometimes as fuel in power plants.
Propane 2.3 Used as Liquefied Petroleum Gas (LPG) in industries as fuel in heating appliances and vehicles and in domestic
heating and cooking.
Miscellaneous products 1.8 Includes aromatic extracts (i.e. benzene, toluene and xylenes), solvents and other minor miscellaneous products
Bitumen 1.8 Used mainly for road making and building construction purposes.
Butane 1.4 Also used as Liquefied Petroleum Gas (LPG). Additionally used as a constituent of motor spirit to increase vapour
pressure and as a chemical feedstock for the production of 1,3 butadiene.
Naphtha 1.3 A light distillate feedstock primarily used as feedstock for producing high octane motor spirit (a.k.a gasoline or
petrol).
Lubricants 0.7 Used for lubrication of various internal combustion engines.
Losses in refining process 0.2 Losses that take place during the processing of crude oil.
White spirit and Specific
Boiling Point (SBP) spirits 0.1 Used as a paint or commercial solvent. Applications may include oil seed extraction and preparation of perfumes.
Chapter 1- Introduction
31
Figure 1.5. Schematic flow diagram of a typical crude oil refinery (Source: Adapted
from McDonough, 2011)
Refinery operations involve the use of important quantity of raw materials (i.e. water,
chemicals, fuel oil/gas and other ancillary materials not directly associated with the
processing of oil), the consumption of huge amount of energy, the generation of
important quantities of emissions, the discharge of a large quantity of treated water and
the production of considerable amounts of hazardous and non-hazardous waste (EC,
2013). Figure 1.6 shows a simplified example of what is typically consumed and
emitted by a refinery in Europe per Mt of crude oil processed, the amount of crude oil
processed in 37 days by a typical UK oil refinery5. Consumption and production levels
are presented in ranges: low ranges normally correspond to refineries with abatement
techniques in place and better environmental performance.
5 A typical UK oil refinery processes around 10 Mt/y or 27.4 kt/d, equivalent to 200 kb/d (BP, 2014). The
UK currently has seven oil refineries of similar capacities.
HYDROTREATING
ISOMERISATION
REFORMING
MERCAPTAN
OXIDATION
HYDROTREATING
FLUIDISED
CATALYTIC
CRACKING
VISBREAKING
ALKYLATION
HYDROTREATING
Atmospheric
Distillation
Vacuum
Distillation
Motor spirit
(Petrol)
Aviation turbine fuel
(ATF)
Diesel Engined
Road Vehicle
(DERV)
Fuel Oil
Propane/Butane
(LPG)
Chapter 1- Introduction
32
Figure 1.6. Representative specific consumption and emission levels in European
refineries (Source: EC, 2013, p 118)
Energy consumption can be as high as 4 PJ/ Mt crude oil processed when energy
savings and recovery measures are not in place. Water use can reach 15 Mm3/Mt crude
oil processed when practices are not optimised and systems not integrated. Chemicals
comprise additives such as anti-corrosives, anti-fouling, demulsifiers and caustics; solid
catalysts used in the conversion process are not included.
The waste stream depicted in Figure 1.6 consists of solid, semi-solid and liquid
materials which are either classified as hazardous - when contaminated with dangerous
substances - or non-hazardous waste. Waste comprises different materials such as spent
catalysts (from all conversion and treatment units), desiccants and adsorbents, drums,
vessels and containers, construction and demolition debris, packaging, lagging, coke,
refractory materials, scrap metals, grit blast, oily sludge from different sources, tank
bottom scales, soil and stones contaminated and spent chemicals (e.g. caustic, solvents,
additives, etc) (EC, 2013, p 31). Emissions to the air are mainly carbon dioxide (CO2)
but also include some toxic substances such as sulphur dioxide (SO2), volatile organic
Chapter 1- Introduction
33
compounds, benzene and heavy metal compounds. Treated water contains organic
compounds such as phenols, polyaromatic hydrocarbons (PAHs) and heavy metals.
The environmental impacts of oil refineries result from controlled or accidental releases
to air, land and/or water (i.e. receiving environmental media) of these toxic and/or
hazardous substances. Depending on their subsequent environmental pathways, these
materials can cause severe pollution either to the medium to which they were originally
discharged or by migration into other media. The main problems associated with
pollution are disruptions to natural eco-systems and negative effects on human health.
For instance, CO2 emissions produce global warming causing important changes in the
climate equilibrium; SO2 can generate acid rain affecting soil composition, vegetation
and eco-systems and leaching of minerals into water bodies; heavy metals and organic
compounds released to or leached into water courses can affect the health of humans
and eco-systems, including marine ecosystems (O’Rourke and Connolly, 2003).
There are also a number of environmental impacts associated with waste treatment.
Although the majority of waste streams are treated (i.e. recycled or disposed) off-site,
there can be life cycle effects on the environment (including the large amounts of water
and electricity consumed, treated water discharged and toxic emissions produced) which
should be allocated to oil refining operations. For example, during the landfilling of
some solid hazardous waste, chemicals substances such as polyaromatic hydrocarbons
(PAHs) contained in the waste can leach into the soil and contaminate ground water,
thereby increasing the risk of cancer in humans.
These environmental impacts show that the final effects of refinery waste go beyond
their immediate consequences. This illustrates the need for a holistic approach when
assessing environmental impacts for the oil refining industry, showing the relevance of
life cycle thinking in particular when dealing with waste. Life cycle thinking is not only
essential for the sustainability of the oil refining industry but also for other
manufacturing facilities. Life cycle thinking assures that the environment of a particular
way of treatment becomes visible, identifying the points at which the major impacts
arise. In this way any “shifting burdens” or “transferring negative impacts from one
part of the life cycle to another” (Weston et al. 2011a) are avoided. The life cycle in this
context refers to all the stages through which a particular waste stream is managed from
generation to disposal. According to Clift (2013) one of the most useful tools which
Chapter 1- Introduction
34
take such a perspective is life cycle assessment (LCA). As an important decision
making tool, LCA was developed to identify all the impacts throughout the whole chain
of a product or process, allowing also the comparison between different technological
routes. Currently it is also used as a complementary tool to others such as environmental
impact assessment (EIA) which also evaluates impacts but related to specific sites
(Clift, 2013).
Sub-section 1.2.2 has shown the complexity of a refinery and the variety of emissions
and environmental impacts that can occur. Awareness of these impacts is currently
central to the thinking of different industries and regulators of the oil refining sector
(Valero Energy Ltd., 2013; ExxonMobil, 2013a; ESSAR, 2013; BP, 2013b and EA,
2013a). Although finding ways to assess and select cost-effective technology solutions
for more sustainable oil refining has been the subject of particular studies over the last
few years (e.g. Weston et al., 2008; EPA, 2010 and CONCAWE, 2011), there is still
room for improvement; hence the incentive for this study.
1.2.3 EU environmental policies and targets: key challenges for the oil refining
industry
EU policies influence an important portion of UK legislative frameworks. Article 191 of
The Treaty on the Functioning of The European Union (EC, 2010a, p 132) indicates that
policies on the environment shall:
• “preserve, protect and improve the quality of the environment;
• protect human health;
• utilise natural resources in a prudent and rational manner; and
• promote measures at international level to deal with regional or worldwide
environmental problems”.
Policies and targets of sustainable development - a fundamental objective in the EU6-
have particularly influenced UK legislation and in consequence the oil refining industry.
6 Article 3 of the Treaty on European Union (EC, 2010) states that: “The Union shall establish an internal
market. It shall work for the sustainable development of Europe based on balanced economic growth and
price stability, a highly competitive social market economy, aiming at full employment and social
progress, and a high level of protection and improvement of the quality of the environment. It shall
promote scientific and technological advance”.
Chapter 1- Introduction
35
For instance Europe 2020, an EU strategy to promote “smart, sustainable and
inclusive” growth (EC, 2013a), has set targets with regard to climate change and energy
sustainability, one of the five key priority areas addressed by the strategy7. The targets
for climate change and energy sustainability by 2020 are:
Reductions of greenhouse gas emissions by 20% (or 30% if conditions allow it)
relative to 1990;
Increase to 20% in the share of renewable energy sources in final consumption;
and
20% improvement in energy efficiency.
Meeting these targets will be brought about primarily by compliance with new
legislation8 which has posed important challenges to the oil refining industry in the EU
and the UK in particular. Work by IHS Purvin & Gertz (2013) indicates that conforming
to these legislative measures could cost the oil refining sector significant capital and
operational costs (i.e. about £11.4 billion not including the Fuel Quality Directive).
Furthermore the competitive advantage of the domestic oil refining industry would be
severely affected as the UK would be more dependent on the import market where non-
EU refineries face less severe legislative requirements (DECC, 2013a). Hence if current
low refining margins do not allow additional investment, refinery closures could result
and security of energy supply be at risk (UKPIA, 2013).
In terms of resource efficiency, the oil refining industry faces further challenges. In the
EU, resource efficiency is also a cornerstone of sustainable development. Optimising
the use of resources (“creating more with less”), providing high standards of living
while using resources in a sustainable way (“delivering greater value with less input
and therefore with less waste”) and minimising the impacts to the environment
(“securing and managing all environmental assets within their maximum sustainable
yields”) are the aims of “A Resource Efficient Europe”, a flagship initiative of the
Europe 2020 strategy (EC, 2011, p 3). Under this strategy, optimising the use of
resources involves changing patterns of consumption and production. At the production
7 The other four priority areas are: employment, research and development, education and poverty.
8 EU ETS Phase III (EC, 2014), Industrial Emissions Directive (EC, 2010c), Fuel Quality Directive (EC,
2009d), CRC Energy Efficiency Scheme (UK government, 2014) and Carbon floor pricing (HM Revenue
& Customs, 2013) are among the EU and UK policies that the oil refining sector has to comply with.
Chapter 1- Introduction
36
level, this means a reduction in the total amount of raw materials used in the economy
which can be achieved, among different options, by re-using materials such as by-
products or waste. Industrial symbiosis is proposed as mean of using waste from one
site as a resource to others (EC, 2011, p 6). Although the oil refining industry in the UK
applies the principles of industrial symbiosis, in particular in the management of
sulphur, it is still in its infancy in the development of broader industrial symbiosis.
One of the most significant pieces of EU environmental legislation affecting the oil
refining industry is the Waste Framework Directive (EC, 2008a). Waste disposal (e.g.
landfilling) and energy recovery (e.g. incineration) are indicated as the least preferable
options for waste treatment according to this directive, while recycling and re-use are
the best choices. At present, the majority of wastes generated at refineries, at least in the
UK, go to disposal which indicates that there is a challenge either to reduce or change
the precursors of waste streams or to find alternatives to the current treatment methods.
1.3 Problem definition
Sub-sections 1.2.1 to 1.2.3 have provided evidence-based understanding of the main
sustainability issues, particularly their environmental perspectives that face the UK oil
refining industry. This review provides the background to the problem addressed by the
present research.
Although it has been determined that low carbon economies are inevitable objectives of
sustainable development, fossil fuels will be used for at least the next 15 years as the
most safe, secure and affordable sources of energy (UKPIA, 2013). It is predicted that
by 2030 oil, gas and coal will still be the most important fuels in the energy mix, and oil
in particular will play a key role in the UK transport sector (BP, 2013 and UKPIA,
2013). Based on these facts the sustainability of the oil refining industry becomes
essential and sustainable development a cornerstone objective in the EU and the UK in
particular due to resulting legislation which has added more pressure on the sector. As
an intensive resource consumer and an important producer of emissions and waste, this
industry needs to improve its environmental performance if mandatory targets on
emissions, energy use and waste are to be reached.
Chapter 1- Introduction
37
In the UK oil refining industry efforts have been made to enhance performance in terms
of resource efficiency and particularly in the management of waste (Weston, 2011),
albeit there is still room for improvement and looking at both areas is required. The
present study is based on a UK oil refinery, specifically on Valero Refinery, Pembroke.
The Refinery is wholly owned by Valero Energy Ltd. (2014) which through its
subsidiaries “is an international manufacturer and marketer of transportation fuels,
other petrochemical products and power”. It has the capacity to refine a total of
270,000 barrels per day, including 220,000 barrels per day of crude plus 50,000 barrels
per day of other feedstocks. Valero acquired the Refinery in 2011 from Chevron. It
makes products including gasoline, diesel, kerosene, LPG and petrochemical
feedstocks. About 44% of the Refinery’s products are gasolines, including ultra-low
sulphur gasoline, and about 40% are distillates for diesel and heating oil markets.
Personnel include about 600 employees and 400 term contractors during normal
operations and up to 4000 people on-site during major turnarounds.
1.4 Project aim and specific objectives
On the basis of the research problem identified, the aim of this research was defined as:
The identification of more sustainable solutions for the oil refining industry
which allow the important sustainability issues of raw materials consumption
and waste production to be assessed holistically for potential improvement.
The following specific objectives were established:
1) to review general theory, legislation and practice for measuring, monitoring and
managing raw materials consumption and waste production for improved
sustainability;
2) to critically analyse the waste management practices of a UK oil refinery
(Valero Refinery, Pembroke);
3) to identify, classify and quantify the amount and treatment costs of waste
produced by a UK oil refinery (Valero Refinery, Pembroke);
4) to define a methodology to assess performance in both areas, namely raw
materials and waste management; and
Chapter 1- Introduction
38
5) to analyse current and possible new technologies for treatment of wastes from an
UK oil refinery, specifically oily sludge.
1.5 Thesis content
This thesis is structured in five chapters as shown in Figure 1.7. Chapter 1 provides the
research topic, context of the research, problem definition, aim and specific objectives
which define the scope of work. The reviews of known theory and practice presented in
Chapter 2 comprise an analysis of sustainable development in the context of
manufacturing processes; legislation which governs the EU and UK oil refining
industry; how the environmental management is carried out in this sector with particular
emphasis on raw materials and waste; and gaps that exist between theory and current
industry practices. Chapter 3 describes the methodology developed to assess
performance in both areas, namely raw materials and waste. In Chapter 4 the
methodology is applied to the analysis of raw materials consumption and waste
management at a UK oil Refinery (Valero Refinery, Pembroke) and the results derived
and discussed. Chapter 5 gives the conclusions of the thesis and recommends possible
paths to follow for future research.
Figure 1.7. Thesis structure
Chapter 1
-Introduction and context of
the research,
problem definition, aim
and specific objectives
Scope of work
Chapter 2
Reviews of established
theory and
practice
industry current
practices
(Identified
gaps)
Chapter 3
Methodology
Chapter 4
Results and
discussion
Industry improved
practices
Chapter 5
Conclusions and
recommendations
Chapter 2- Reviews of established theory and practice
39
2 REVIEWS OF ESTABLISHED THEORY AND PRACTICE
2.1 Introduction
In this Chapter a review of the theory and practice of management for sustainability is
presented. Section 2.2 provides a view of the main problems encountered when
attempting to implement sustainability in manufacturing processes. As this research
aims to improve the environmental sustainability of the oil refining industry operations
this review also explores some of the existing approaches (i.e. tools and methodologies)
for assessing sustainability related to environmental performance.
Aiming to achieve the first specific objective of this thesis, Section 2.3 sets out the
regulations which govern the operations of the EU/UK oil refineries. The understanding
of different legislation is important as much of the progress towards sustainable
development - and in particular to better environmental performance – is expected to
result from compliance with regulations.
Section 2.4 aligned to the second specific objective of the present work, reviews the
environmental management of industrial facilities where waste is produced. After
providing the general context, waste management is studied at a UK oil refinery. This
study includes the identification of gaps between current and best available practices so
that opportunities for improvement can be identified which constitute the
motivations/justification of the present research work.
The fourth specific objective of this research is related to Section 2.5. This section
analyses one of the existing methodologies to assess sustainability performance in terms
of raw materials use and waste production: Materials flow analysis (MFA). This tool is
of interest because of possible application to a specific case study in the oil refining
industry.
Finally in this Chapter, Section 2.6 focuses on the analysis of one of the most significant
wastes generated by a refinery: oily sludge. The aims are to review current treatment
practices and to identify possible new improved technologies to be considered in the
future, as stated by the fifth specific objective at the end of Section 1.
Chapter 2- Reviews of established theory and practice
40
Finally, Section 2.7 presents the main findings and conclusions to provide links to
subsequent chapters.
2.2 Sustainable development in manufacturing processes
2.2.1 The concept of sustainable development and the systems approach
Sustainable development highlights many challenges for society in regard to how
humans should interact with their surrounding environment. The human inhabit one
planet, so resource availability is limited as is the ability of the earth to absorb
emissions and waste. Predicted population growth and current trends of harm to the
planet9 have increased the incentives for moving to a path of sustainable development.
According to UNCSD (2002) “population is projected to grow to about 8 billion in
2025, to 9.3 billion in 2050, and eventually to stabilize between 10.5 and 11 billion”.
The UN Brundtland statement “Sustainable development is the development that meets
the needs of the present without compromising the ability of future generations to meet
their own needs” (WCED, 1987) has been the most referenced definition of Sustainable
Development. A less cited definition has provided a more pragmatic approach:
“Sustainable Development is seen as a system approach to organise the sustainable
interactions between natural and man-made systems, which in practice means the
patterns by which human societies organise productive activities in a renewable and
equitable way utilising natural, social, economic, human and cultural resources”
(Bonazzi, 1999). Although the concept of sustainable development is still contentious10
,
it seems that there is a broad consensus that integrated structures (i.e. system-
based/systems thinking) are at the core of sustainable development (Bonazzi, 1999;
Robèrt et al. 2002; Hjorth and Bagheri, 2006; Azapagic and Perdan, 2011).
9 It has been determined that at current rates of consumption and production the boundaries of the earth
carrying capacity have already been exceeded in some areas (e.g. around half of the world’s rivers are
seriously depleted and polluted) and in others alarming trends are underway (e.g. species are becoming
extint at rates which are 100 times faster than the rate shown in the fossil fuel record) (Azapagic and
Perdan, 2011, p 4).
10 According to Johnston et al. (2007) after the Brundtland statement around 140 alternative definitions
emerged only in a period of two years. After that and by 2007 around 300 concepts had emerged
including definitions of sustainable development and sustainability.
Chapter 2- Reviews of established theory and practice
41
The complex system of human activities was simplified by Clift (1995) as shown in
Figure 2.1.
E: emissions
Figure 2.1. Schematic diagram of the human economy (Source: Clift, 1995)
This figure illustrates that human society interacts with industry and agriculture for
goods, services, food and some other natural products. These interactions inevitably
generate waste which is considered a useable material until it is disposed into final
environmental sinks (i.e. to land, water bodies and the atmosphere). The following
interesting points emerge from Clift’s schematic diagram:
• human productive activities are based on a contrived system of interactions;
• there is an interdependence between the actors: human society, agriculture and
industry;
• the system requires the input of renewable and non-renewable resources to
operate;
• the system activities results in food, goods and services required by human
society;
• waste is also generated and circulates within the system until it can no longer be
re-used and is disposed or dispersed into natural sinks; and
• natural sinks are required to dispose of the waste generated in the system.
Hjorth and Bagheri (2006) also depicted the main interactions in a human-based system
(Figure 2.2) using a causal loop diagram (CLD)11
to represent the key loops (named as
viability loops) which from their perspective “are responsible for the viability of all
11
According to Hjorth and Bagheri (2006) a CLD “is a powerful graphic tool to see the relationships
among a system’s parts and their interactions with each other”.
Chapter 2- Reviews of established theory and practice
42
ecosystems including human based ecosystems”. They claimed that sustainable
development is more than a target but is instead the process by which viability loops are
not disrupted.
In Figure 2.2, a “plus” symbol represents a cause that produces an increase (e.g. human
needs increase the demand for economic support) and a “minus” symbol is a cause that
produces a decrease (e.g. economic capital is reduced due to expenditures and
depreciation). The most significant observations are the complexity of human-
environment-economy interactions from which a set of new interactions can also be
derived (i.e. the life supporting services loop), that renewable and non-renewable
resources exploitation support economic utilisation and human needs, and that waste,
pollution and depletion of resources appear to be unavoidable.
Figure 2.1 and Figure 2.2, clearly show how complex and challenging can be the
process of organising man-kind activities and their interactions in ways which utilise
resources equitably and in a renewable manner, i.e. sustainably. Both figures reinforce
the points that a system approach is fundamental to progressing sustainable
development and that the environment ultimately constrains the human-made system
interactions.
Dodds and Venables’ vision (2005) shown in Figure 2.3 illustrates very well how
progress towards sustainability can be achieved within the contrived interactions of
human systems as presented in Figure 2.1 and Figure 2.2. They suggested that progress
towards sustainability could be achieved by merging the circles of Clift (1995) such that
the societal and techno-economic circles are ultimately located within the
environmental circle.
2.2.2 Sustainable development in the EU
Sustainable development is a central objective of the EU as shown by the European
Council (2006) in its Sustainable Development Strategy (EU SDS) for an enlarged EU.
This strategy aimed to provide a framework upon which policies and actions help
communities to make the most efficient use of resources, protect the environment and
promote inclusive and prosperous economies. The EU SDS added the environmental
component to the Lisbon Strategy which aimed to promote growth and jobs (i.e.
Chapter 2- Reviews of established theory and practice
43
economic and social renewal) (Steurer and Berger, 2010). The EU SDS comprised
seven key priorities:
1. Climate change and clean energy;
2. Sustainable transport;
3. Sustainable consumption & production;
4. Conservation and management of natural resources;
5. Public Health;
6. Social inclusion, demography and migration; and
7. Global poverty and sustainable development challenges.
In 2009 the SDS strategy was reviewed in order to measure the progress made on
incorporating sustainable development into many EU policies. Priorities 1, 3 and 4 -
those which tackle climate change and promote low carbon economies12
appeared to be
the most advanced and, in the context of this study, of most relevance to manufacturing
facilities (EC, 2009). A summary of the main regulations addressing the most relevant
priorities follows.
Priority 1: Climate change and clean energy
For fighting climate change and promoting clean energy, the directive on the EU
Emission Trading System (ETS) was amended in 2009 and directives on carbon capture
and storage (CCS) and on renewable energy sources were adopted. These three pieces
of legislation became part of the climate and energy package which is “a set of binding
legislation which aims to ensure the EU meets its ambitious climate and energy targets
for 202013
” (EC, 2014a).
12
In the EU a low carbon economy is conceived as an economy which is more climate friendly (i.e. less
green house gas emissions), less energy-consuming and more competitive (Hedergaard, 2014).
13 Targets of Europe 2020 described in Section 1.2.3: 20% reduction in EU greenhouse gas emissions
from 1990 levels, raising the share of EU energy consumption produced from renewable resources to
20% and 20% improvement in the EU's energy efficiency (EC, 2013a).
Chapter 2- Reviews of established theory and practice
44
Figure 2.2. Interaction of viability loops in the real world (Source: Hjorth and Bagheri, 2006, p 87)
Figure 2.3. The process of sustainable development (Source: Dodds and Venables, 2005, p 8)
Progress towards sustainability
Chapter 2- Reviews of established theory and practice
45
The EU ETS operates under the “cap and trade” principle with the aim to cut emissions of
the regulated industrial installations covered by this directive. A cap is set on the total
amount of greenhouse gases that can be emitted by all participating installations.
Allowances for emissions are traded off or allocated for free. The operators report their
CO2 emissions to the competent authority and ensure that their allowances cover their
emissions. If their emissions exceed their allowances then the operators can purchase
allowances from others which have performed well (EC, 2009a).
The directive on carbon capture and storage provides a framework for the safe and
environmentally friendly management of carbon capture technologies. The underlying
principle involves capturing CO2 emissions from industrial facilities and storing them in
geological formations to avoid in this way releases into the atmosphere (EC, 2009b). The
Renewable Energy Directive aims to promote the use of renewable sources and raising their
share in the energy mix. Targets are imposed throughout the member states (EC, 2009c).
Priority 3: Sustainable consumption and production
The Sustainable Consumption and Production and Sustainable Industrial Policy (SCP/SIP)
Action Plan was adopted in 2008 (EC, 2008). This plan sought to increase the uptake, and
improve the environmental and energy performance of products throughout their life-
cycles. The plan also aimed to foster innovation (i.e. eco-innovation) by providing
incentives for development and by introducing voluntary schemes, such as the Community
Eco-Management and Audit Scheme (EMAS). EMAS is a “premium environmental
management tool” (EC, 2014b) intended to aid companies to optimise their production
activities from financial and environmental perspectives and to communicate their
performance to stakeholders and broader society.
To promote smart consumption, regulations were revised and concrete actions proposed to
overcome weaknesses. For example the Ecodesign (EuP) Directive14
, adopted in 2005 to
provide a framework for the design of energy-using products under a set of requirements
taking a life cycle perspective, was extended to cover all energy-related products with
14
Directive 2005/32/EC (OJ L 101, 22.7.2005, p 29).
Chapter 2- Reviews of established theory and practice
46
relevant environmental impacts. Energy labelling directives and the design of the Ecolabel
were also revised to include streamlining/simplifying of the process of obtaining the label
which itself was enhanced to contain information on energy savings and main
environmental impacts.
For sustainable production, the Industrial Emissions Directive (IED) (explained in Sub-
section 2.3.1.1), and EU ETS (described here already) cover the performance of industrial
facilities. In addition the review of the EU SDS in 2009 indicated that efforts should
continue to improve resource efficiency (i.e. to create more value with fewer resources) and
promote the uptake of eco-innovative production processes (i.e. those which use fewer
materials and recycle more). To these ends, the development of tools was proposed to
monitor, assess and promote resource efficiency throughout the whole life cycle of
materials from cradle to crave. Particular relevance was given to material-based analysis
tools on addressing environmental effects and determining natural resources availability.
Priority 4: Conservation and management of natural resources
Among the measures to promote conservation and management of natural resources is the
EU Raw Materials Initiative which was adopted in 2008 (EC, 2008b). This initiative
proposed an integrated strategy to ensure access to raw materials produced outside the EU,
encourage sustainable supply from EU sources and promote recycling of by-products to
reduce the EU’s consumption of primary raw materials. Another regulation adopted was the
revised Waste Framework Directive (EC, 2008a) which can be regarded as one of the most
important influencing manufacturing facilities and, in particular, the oil refining industry.
This directive aims to manage waste from its prevention to its final treatment giving
particular relevance to life-cycle thinking and will be explained in more detail in Sub-
section 2.3.1.2.
The EU has taken seriously the issue of sustainability as an overarching objective at a
policy level although there is a broad consensus that much of the progress towards
sustainability will also rely on the extent to which all of society will be committed to it.
Moving towards a low carbon economy requires a shift not only from current lifestyles, i.e.
patterns of consumption and production, but also a deep understanding of how human
Chapter 2- Reviews of established theory and practice
47
activities impact the environment and how better choices can lead to more sustainable
lifestyles.
2.2.3 Measuring progress in sustainable development
Understanding, measuring and communicating progress in any targeted area is important.
Through these three processes effectiveness of policies and strategies can be determined
and if necessary corrective measures be timely taken. This conforms to the well-known
quotation of Lord Kelvin15
“If you cannot measure it, you cannot improve it”
(TODAYINSCI, 2013).
In the context of sustainable development this statement is more alive than ever. It is not
accidental that organisations at international, national and local levels have made
considerable efforts to monitor and communicate progress towards sustainability in
comprehensive, meaningful and focused ways. In particular procedures and indicators have
been developed aiming not only to measure improvements towards sustainability goals but
also to aid in decision making (leading in some cases to re-defined objectives and targets).
Table 2.1 shows a sample of sustainability indicators relevant to manufacturing facilities
developed by the United Nations Commission on Sustainable Development (UN CSD), the
EU and the UK national and local authorities. It also reports indicators developed for
business and the process industry by different organisations such as the Global Reporting
Initiative (GRI) and the Institution of Chemical Engineers (IChemE) respectively.
15
William Thompson (also known as Lord Kelvin) was a physicist who, among other achievements, theorized
a whole new temperature scale that included absolute zero.
Chapter 2- Reviews of established theory and practice
48
Table 2.1. A summary of key performance indicators for measuring sustainability performance of manufacturing facilities
Authority/Organisation Total number of
indicators Areas covered/targeted themes Indicators relevant to manufacturing facilities (i.e. consumption and production indicators)
UN CSD
(International level) (UN
CSD, 2007)
96
Poverty, health, governance, demographics, education, natural hazards,
atmosphere, economic development, land, oceans, seas and coasts, global
economic partnership, freshwater, consumption and production patterns and
biodiversity.
Material intensity of the economy, domestic material consumption, annual energy consumption (total and by main user category), share of renewable
energy sources (in total energy use), intensity of energy use (total and by economic activity), generation of hazardous waste, waste treatment and
disposal, management of radioactive waste, modal splits of passenger and freight transport.
EU
(Regional level) (EC, 2013b) 128
The seven key priorities of the EU SDS. The targeted themes are:
socioeconomic development, sustainable consumption and production,
social inclusion, demographic changes, public health, climate change and
energy, sustainable transport, natural resources, global partnership and good
governance.
The EU SDS indicators are categorised into four main types: headline, operational, explanatory and contextual indicators16
. For sustainable
consumption and production the indicators are:
Headline indicator: Resource productivity
1. Operational indicator 1: Resource use and waste-Generation of waste excluding major mineral waste.
Explanatory indicators: components of domestic material consumption, domestic material consumption by material, municipal waste generation
and treatment by type of treatment method, generation of hazardous waste by economic activity, emissions of sulphur oxides (SOx) by source
sector, emissions of nitrogen oxides (NOx) by source sector, emissions of non-methane volatile organic compounds by source sector and
emissions of ammonia (NH3) by source sector.
2. Operational indicator 2: Consumption patterns-Electricity consumption of household.
Explanatory indicators: final energy consumption by sector, consumption of certain foodstuffs per inhabitant and motorisation rate.
3. Operational indicator 3: Production patterns-Organisations and sites with Eco-Management and Audit Scheme (EMAS) registration.
Explanatory indicators: ecolabel licenses, area under agro-environmental commitment, area under organic farming, livestock density index.
The contextual indicators of resource productivity are: number of persons in households and final consumption expenditure of households by
consumption purpose.
UK
(National level) (DEFRA,
2013)
35*
The priority areas of the UK sustainable development strategy “Securing the
Future”: sustainable consumption and production, climate change and
energy, natural resource protection and enhancing the environment and
creating sustainable communities and a fairer world (DEFRA, 2005).
Greenhouse gas emissions (UK greenhouse gas emissions), natural resource use (consumption of construction and non-construction raw materials),
water use (abstractions from non-tidal surface and ground waters), CO2 emissions by sector, energy consumed from renewable sources (proportion of
gross energy consumption from renewable sources), waste (proportion of household waste recycled and construction and demolition waste recovered).
UK
(Local level) (Audit
Commission, 2013)
45
A set of quality of life indicators17
were developed. People and place,
community cohesion and involvement, community safety, culture and
leisure, economic well-being, education and life-long learning, environment,
health and social well-being, housing, transport and access and other
indicators.
From an environmental perspective key indicators report levels of key air pollutants, CO2 emissions by sector and per capita emissions and the
percentage of river length assessed as (a) good biological quality; and (b) good chemical quality.
IChemE
(Business level) (IChemE,
2014)
49
Environmental: resource usage, emissions, effluents, waste and additional
environmental items. Economic: profit, value, tax, investments and
additional economic items. Social: workplace, society and additional social
items.
Resource usage: total net primary energy usage, percentage total net primary energy sourced from renewables, total net primary energy usage per kg
product, total net primary energy usage per unit value added, total raw materials used per kg product, total raw materials used per unit value added,
fraction of raw materials recycled within the company, fraction of raw materials recycled from consumers, hazardous raw material per kg product, net
water consumed per unit mass of product and net water consumed per unit value added.
Emissions, effluents and waste: atmospheric acidification burden per unit value added, global warming burden per unit value added, human health
burden per unit value added, ozone depletion burden per unit value added, photochemical ozone burden per unit value added, aquatic acidification per
unit value added, aquatic oxygen demand per unit value added, ecotoxicity to aquatic life per unit value added, eutrophication per unit value added,
hazardous solid waste per unit value added and non-hazardous solid waste per unit value added. Additional environmental items refer to reporting on
impacts when decommissioning, compliance and long-term supply of raw materials from non-renewable resources.
GRI
(Business level) (GRI, 2013) 91
Economic, environmental and social performance or impacts of an
organization related to its material aspects18
.
34 cover environmental aspects: materials, energy, water, biodiversity, emissions, effluents and waste, products and services, compliance, transport,
overall (total environmental protection expenditures by waste disposal, emissions treatment, remediation costs and prevention and environmental
management costs), supplier environmental assessment and environmental grievance mechanisms. For example effluents and waste have five indicators.
With regard to waste the indicators measure the total weight of hazardous and non-hazardous waste, by the disposal methods: reuse, recycling,
composting, recovery (including energy recovery) incineration (mass burn), deep well injection, landfill, on-site storage, and other method to be
specified by the organisation. Waste disposal methods are also to be reported (e.g. disposed of directly by the organization or otherwise directly
confirmed, information provided by the waste disposal contractor or organizational defaults of the waste disposal contractor).
(*) of which 12 are headline indicators and 23 supplementary indicators.
16
Headline indicators (Level 1) are directly related to the EU SDS key priorities. Operational indicators (Level 2) are related to the operational objectives of EU SDS. Explanatory indicators (Level 3) relate to actions to be taken towards the achievement
of SDS objectives and usually describe with more details higher level of indicators. Contextual indicators although they are considered also part of the set of SD indicators they cannot by themselves express any progress towards sustainable development.
They provide relevant information to be used by the others indicators (EC, 2013b). 17
The Audit Commission of DEFRA describes the quality of life as “those things that make somewhere a good place to live, now, and for generations to come”. Quality of life indicators aim to help local communities become more sustainable and
measure communities’ social, economic and environmental well-being. They also seek to monitor progress in terms of “the effectiveness of local sustainable community strategies” (Audit Commission, 2013). 18
According to GRI (2013) Material Aspects are “those that reflect the organization’s significant economic, environmental and social impacts; or substantively influence the assessments and decisions of stakeholders”.
Chapter 2- Reviews of established theory and practice
49
Table 2.1 highlights the following aspects:
• the considerable number of indicators shows the complexity of
characterising/measuring sustainable development;
• the indicators are grouped by themes within which the three pillars of
sustainable development are embedded;
• for manufacturing facilities, relevant indicators are replicated throughout the
authorities and organisations;
• there is a lack of normalisation between different set of indicators;
• at international level, i.e. UN, EU and GRI, the total number of sustainable
indicators is substantially more than at the national and local level, i.e. UK; and
• from the business perspective it is clearly shown that the environmental
indicators are more detailed. This can suggest that adhering to these reporting
guidelines could involve important organisational changes in current
management and measurement systems.
One example of a sustainable development indicator is of particular relevance here, and
is worth noting to illustrate the information it can provide. This example is the EU
operational indicator: Generation of waste excluding major mineral wastes which is
expressed in kg of waste produced per capita per year. Figure 2.4 shows the trends in
Denmark, Germany and the UK over 2004-2010.
Figure 2.4. Generation of waste (excluding major mineral wastes) per capita in
Denmark, Germany and the UK over 2004-2010 (Data source: Eurostat, 2014)
The figure highlights that over the seven year period there was a 22% reduction in waste
generation in the UK whereas the situation in Germany and Denmark deteriorated with
0
500
1000
1500
2000
2500
3000
2004 2006 2008 2010
kg
waste
per cap
ita
Denmark
Germany
UK
Chapter 2- Reviews of established theory and practice
50
increases of 16% and 56% respectively. These trends are the basis for future analysis
and decision making in terms of waste management practices. For instance questions
that can arise from the analysis could include: Were the measures for waste recycling
effective? Were incineration plants with energy recovery successfully implemented?
Was the segregation of waste improved? Can waste management practices from the UK
be transferred to other countries?
It is not intended in the context of this research to study all the existing sustainability
regulations, procedures and indicators although this research is grounded in the view
that measuring and reporting guidelines are essential to improve the sustainability of a
system.
2.2.4 Existing tools for sustainability assessment
Ness et al. (2007) suggest that the purpose of sustainability assessment is “to provide
decision-makers with an evaluation of global to local integrated nature-society systems
in short and long term perspectives in order to assist them to determine which actions
should or should not be taken in an attempt to make society more sustainable”.
Sustainability assessment and decision making as research areas have grown fast.
Different tools have been developed aiming to deliver particular sustainability issues
through environmental assessment and decision making (Sheate, 2010). Table 2.2 lists
some of these tools.
Sub-section 2.2.1 showed that the issue of achieving sustainability in human systems
involves complex and diverse matters. Hence developing and selecting the most
appropriate tools to deal with this complexity have not been easy tasks, as discussed by
Sheate (2010, p 1). Although every system will be unique and has a variety of different
problems to address in the context of sustainability, it is good news that there are many
available tools to use, some in combination with each other, e.g. LCA and EIA (Clift
2013, p 388).
Chapter 2- Reviews of established theory and practice
51
Table 2.2. Tools with a common purpose: Sustainability (Source: Sheate, 2010, p 3)
Tool/Technique/Approach Acronym
Environmental impact assessment EIA
Strategic environmental assessment SEA
Sustainability assessment SA
Environmental management systems EMS
Corporate social responsibility CSR
Risk assessment RA
Life cycle assessment LCA
Substance flow analysis SFA
Material flow analysis MFA
Cost benefit analysis CBA
Ecological footprinting EF
Carbon footprinting CF
Health impact assessment HIA
Social impact assessment SIA
Integrated impact assessment IIA
Impact assessment IA
Appropriate assessment AA
Such tools also play a key role in the planning process of sustainable development.
According to Robèrt (2000) the originator and promoter of the Natural Step (TNS),
“metrics for sustainable development” aim “to plan for sustainability”19
through the
following steps:
1. A description of the system: statement of the principles which define the
interrelated functions society/ecosystems;
2. A determination of the favourable outcomes in the society/ecosystems based on
sustainability principles;
3. A description of how the favourable outcomes of Step 2 will be reached; this
relates to the strategic principles of sustainable development in place;
4. A definition of the activities through which the system works aligned with the
sustainability principles for a favourable outcome; and
5. A definition of the metrics for sustainable development: the concepts and tools
for measuring and monitoring the extent to which activities deviate from the
sustainability principles and the favourable outcome.
Tools for sustainable development are applied in the fifth stage of this framework.
According to Robèrt (2000), to align a business with sustainable development, tools
such as EMS and CSR are the “administrative tools or vehicles” for use within
19
Weston (2011, p 16) interpreted this framework with relation to the management of industrial activities.
Chapter 2- Reviews of established theory and practice
52
organisations whereas LCA and EF provide the metrics for measuring and monitoring
activities.
The following sub-sections summarise the main aspects of some of the tools for
sustainability assessment: LCA, EIA and CSR which have been widely used by
organisations to measure sustainability. EMS and MFA are more detailed in Sections
2.4 and 2.5 respectively.
2.2.4.1 Life cycle assessment (LCA)
According to ISO20
(1997) LCA is “the study of environmental aspects and potential
impacts of a product or process or service throughout its life, from raw materials
acquisition through production, use and disposal”.
Another and more recent definition of LCA is provided by UNEP (2009, p 33): “LCA is
a technique that aims at addressing the environmental aspects of a product and their
potential environmental impacts throughout that product’s life cycle. The term
“product” refers to both goods and services. A product’s life cycle includes all stages of
a product system, from raw material acquisition or natural resource production to the
disposal of the product at the end of its life, including extracting and processing of raw
materials, manufacturing, distribution, use, re-use, maintenance, recycling and final
disposal (i.e. cradle-to-grave)”.
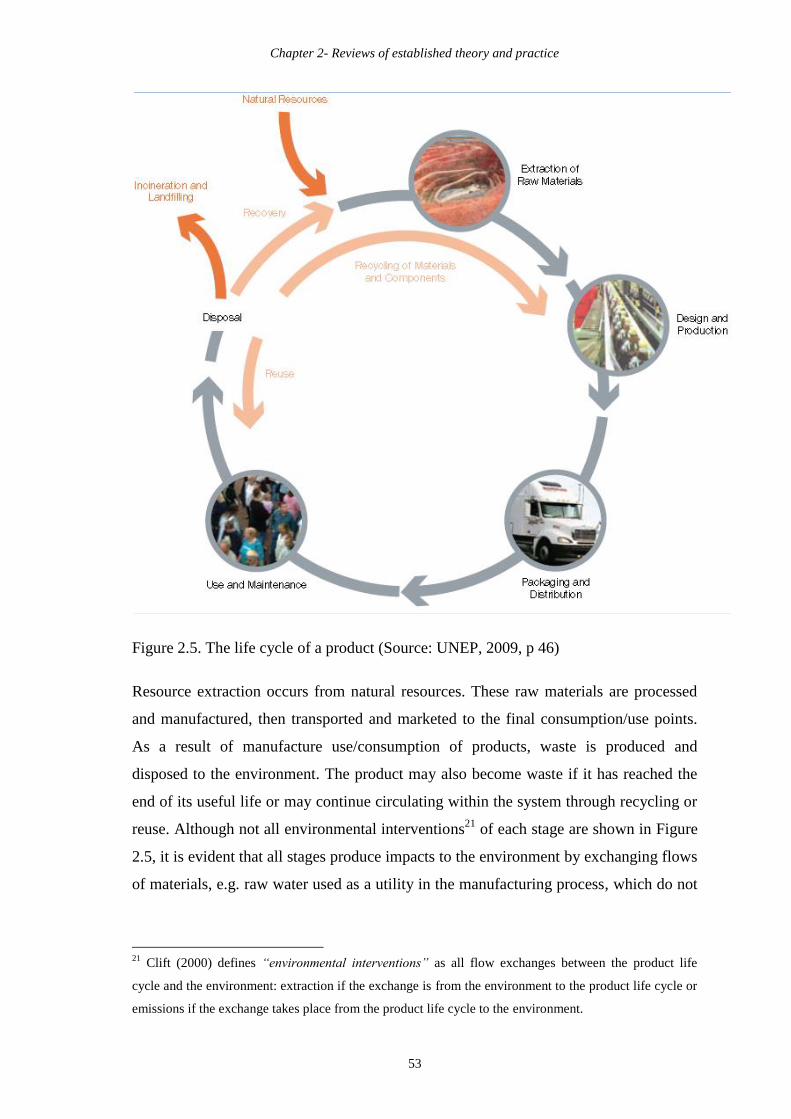
Figure 2.5 illustrates the life cycle or what has been defined as the “cradle to grave”
life of a product.
20
In the context of environmental management and with the aim of standardising LCA methodologies,
ISO standards were developed. The most recent standards are ISO 1040 and ISO 1044.
Chapter 2- Reviews of established theory and practice
53
Figure 2.5. The life cycle of a product (Source: UNEP, 2009, p 46)
Resource extraction occurs from natural resources. These raw materials are processed
and manufactured, then transported and marketed to the final consumption/use points.
As a result of manufacture use/consumption of products, waste is produced and
disposed to the environment. The product may also become waste if it has reached the
end of its useful life or may continue circulating within the system through recycling or
reuse. Although not all environmental interventions21
of each stage are shown in Figure
2.5, it is evident that all stages produce impacts to the environment by exchanging flows
of materials, e.g. raw water used as a utility in the manufacturing process, which do not
21
Clift (2000) defines “environmental interventions” as all flow exchanges between the product life
cycle and the environment: extraction if the exchange is from the environment to the product life cycle or
emissions if the exchange takes place from the product life cycle to the environment.
Chapter 2- Reviews of established theory and practice
54
end up in any useful form or as part of the manufactured product. This fact is important
to note and is considered in LCA methodology.
Overall the LCA methodology involves four well defined stages: goal and scope
definition, inventory analysis, impact assessment and interpretation of results (Figure
2.6).
Figure 2.6. LCA methodology (Original source: ISO, 1997 adapted by Basson, 2010)
The goal and scope definition stage describes the aims of the study and establishes the
functional unit. The functional unit of a system focuses on what the system delivers, and
is the reference for comparison between different alternatives. For instance, if the
function of the system to be analysed is treating oily sludge from an oil refinery, i.e.
waste treatment, the functional unit could be a specified quantity of oily sludge or its
total amount produced in a year. At this stage the system boundaries are also established
and can be defined in terms of geographical location, time, type of goods, etc.
At the inventory analysis, compilation of data such as energy and material flows from
the system and to the environment and vice versa throughout the life cycle of the
product or service is performed. For instance, in the example of treating oily sludge on
an oil refinery, once it is collected from the source of production, e.g. the tank farm, it
needs to be transported from the site to the incineration facility. During transportation
there are flows of materials that need to be extracted for the trucks to operate, i.e. fossil
fuels, and flows of substances that are released to the air as a result of their combustion
Chapter 2- Reviews of established theory and practice
55
(i.e. CO2 emissions). Data to be collected in this simplified example would be the mass
quantities of fuel consumed and the CO2 emitted to air.
The inventory stage is related to the impact assessment as all the flows calculated in the
inventory analysis are converted into impact factors. This is possible using
characterisation factors which express specific or potential impacts for each substance
emitted (Clift, 2000). For example, in the case of transportation of oily sludge the mass
quantity of greenhouse gases (GHGs) emitted would be expressed by the global
warming potential (GWP) measured as the equivalent quantity of CO2 which produces
the same effect.
The ISO (1997) and UNEP (2009) definitions highlight the usefulness of LCA for
environmental assessment in manufacturing facilities. Hence it is not surprising that
LCA has been widely used in many industrial applications, e.g. product development
and performance improvement, cleaner technology22
development, environmental
management and planning, and as part of companies’ sustainability framework (EC,
2014c). In the case of waste management, LCA has helped to determine most
significant environmental impacts or “hot spots” of technologies and has also enabled
the identification of more sustainable options. Examples can be found in work by Clift
et al., 2000; Hart et al., 2005; Weston et al., 2011a; Liu et al., 2011 and Evangelisti et
al., 2013.
Azapagic and Perdan (2011, p 58) indicate that although LCA has been a prominent tool
in industrial applications it has also been used in public policy, i.e. cleaner production
programmes and development of Best Available Techniques23
, and consumer
applications, e.g. labelling. According to Zbicinski et al. (2007), in the context of
sustainability, LCA aims “to provide a basis for decisions which will promote
sustainable development of our economies”.
22
A clean technology (also known as “cleaner technology”) “is that which avoids the environmental
damage at source” (Clift and Longley, 1995a).
23 Best Available Techniques (as defined in the IPPC Directive 2008/1/EC) “means the most effective and
advanced stage in the development of activities and their methods of operation which indicate the
practical suitability of particular techniques for providing in principle the basis for emission limit values
designed to prevent and, where that is not practical, generally to reduce emissions and the impact to the
environment as a whole” (EC, 2008c) (Appendix H).
Chapter 2- Reviews of established theory and practice
56
In the case of waste management (a priority area in the EU policy), a particular strategy
on the prevention and recycling of waste was communicated in 2005 (EC, 2005). This
strategy, built on the EU waste legislation, “set objectives and outlined the means by
which the EU could move towards improved waste management”. This strategy aimed
to reinforce the objectives of the EU policy “to prevent waste and promote re-use,
recycling and recovery so as to reduce the negative environmental impact”.
Part of the actions proposed by this strategy involved the introduction of life cycle
thinking24
(LCT) and assessment (LCA) in policy making in order to ensure that all
adverse environmental impacts were avoided or minimised in the whole cycle of
resources life. To this end the Waste Framework Directive (WFD) in 2008 introduced
the requirement of LCT as follows:
“When applying the waste hierarchy: 1) prevention, 2) preparing for re-use, 3)
recycling, 4) other recovery/energy recovery and 5) Disposal, Member States shall take
measures to encourage the options that deliver the best overall environmental outcome.
This may require specific waste streams departing from the hierarchy where this is
justified by life-cycle thinking on the overall impacts of the generation and management
of such waste” (EC, 2008a).
As mentioned in Chapter 1 there is a variety of environmental issues that the oil refining
industry faces and despite much having been done there is still room for improvement.
LCA can support these improvements for instance, in the treatment and disposal of oily
sludge from refining operations. LCA combines many features in a way which is useful
to address the problems associated with the management of this waste. Oily sludge
production and treatment issues are further explained in Section 2.6.
2.2.4.2 Environmental impact assessment (EIA)
EIA in its widest sense is a procedure which aims to asses, analyse and inform all
possible effects that a new development or project has on the environment. It forms part
of a process where decisions are made with regard to the planning and approval of
24
According to EC (2010b) “LCT considers the range of impacts throughout the life of a product while
LCA quantifies this by assessing the emissions, resources consumed and pressures on health and the
environment that can be attributed to a product”.
Chapter 2- Reviews of established theory and practice
57
particular projects which can be either public or private and with relevant importance to
local authorities, regulators, authorising bodies and the general public (Carrol and
Turpin, 2009). After it was introduced in the USA by the National Environmental
Protection Act 1969 (EPA, 2014), EIA was universally adopted and developers were
encouraged to use it to meet standards and take measures in order to mitigate
environmental harm.
Figure 2.7 shows the stages in the EIA process.
Figure 2.7. The stages in the EIA process (Source: IEMA, 2011)
Before describing the main stages of the EIA process (shadowed squares in Figure 2.7),
it is important to mention that one of the main characteristics of EIA is the multi-
stakeholder involvement of local planning authorities and communities, throughout the
planning process25
. Another important characteristic is that the EIA process can be
complex and time consuming. In any case, the major strength of EIA is that all possible
adverse effects of new projects are identified and communicated as early as possible.
25
LCA can also be used to support stakeholder engagement (e.g. Sinclair et al., 2007) but it is more
commonly used as an expert tool.
Chapter 2- Reviews of established theory and practice
58
The proposal identification stage is followed by the screening stage where the planning
authority advises the developers whether or not to carry out an EIA based on the nature,
size and location of the project. The scoping stage involves key issues requiring the
description of potential concerns and environmental effects on specific areas such as
population, flora, fauna, water, air, soil, landscapes and architectural heritage; the
description of mitigating measures and the identification of risks of accidents and
hazards to people.
After the scoping stage, an iterative process follows which aims to ensure that the
development’s design is assessed and modified to minimise and compensate any
negative impacts and maximise the positive effects. The effectiveness of EIA in
protecting the environment increases as the probability of overlooking or ignoring
negative impacts reduces. Significant impacts, e.g. concentration of air pollutants
exceeding air quality objectives, are determined during the assessment stage which
relies upon reliable, reproducible and verifiable data (Sadler, 1996). EIA also considers
the geographical area upon which the impacts will occur and the duration, frequency
and reversibility of these impacts. Such characteristics make EIA site specific, unlike
LCA.
The outcomes of the EIA are communicated through an environmental statement (ES)
and, in order to influence the decision-making process, an effective ES should be
prepared to cover all the stakeholder expectations. This is definitely not an easy task due
to the diversity of their different interests (Tromans, 2012).
EIA in contrast to LCA exhibits different characteristics. The most relevant to this study
are:
• the impact assessment is site-specific;
• the existing regulations specify EIA as compulsory for certain types of projects;
• EIA is used principally for new projects and planning enquiries; and
• multi-stakeholder participation is essential throughout the process.
These main features suggest that LCA and EIA can be used as complementary tools, as
indicated by Clift (2013).
Chapter 2- Reviews of established theory and practice
59
In the UK, a wide range of projects have been subjected to EIA such as those related to
minerals extraction, energy production, waste management, water management, housing
and mixed-use developments and transport. IEMA (2014) provides information on more
than 100 case studies in the UK which have carried out EIA.
In the EU, EIA is required through the EU Directive 85/337/EEC (EC, 1985) which has
been amended three times: firstly in 1997 Directive 97/11/EC (EC, 1997), secondly in
2003 Directive 2003/35/EC (EC, 2003) and thirdly in 2009 Directive 2009/31/EC (EC,
2009b). Directive 2011/92/EU (EC, 2011a) codified the initial Directive and the
subsequent amendments. In the UK EIA was introduced in 1988 and implemented
through secondary legislation. The majority of EIA in the UK has been undertaken in
order to apply for planning permission (IEMA, 2011).
In the UK the Town and Country Planning Act 1990 (Legislation.gov.uk, 1990)
specifies that major developments requiring planning approval have to carry out an EIA.
EIA is also required for other projects such as trunk roads and motorways, power
stations, marine fish farming, land drainage improvements and long distance oil and gas
pipelines. A list of major projects which require an EIA is found in Annexes 1 and 2 of
the EC Directive 2011/92/EU (EC, 2011a) and in Schedules 1 and 2 of the Town and
Country Planning Regulations 1999 (Environmental Impact Assessment) (England and
Wales) (Legislation.gov.uk, 1999).
For projects in Schedule 1 of the Town and Country Planning Regulations 1999, e.g.
nuclear power stations and crude oil refineries, EIAs are always compulsory. For
projects in Schedule 2 EIAs are mandatory only if it is likely that important
environmental impacts occur. These projects must meet certain thresholds and criteria
to require an EIA; for example, new projects involving the installation of facilities for
the disposal of waste, e.g. incineration, to be located within a perimeter of 100 m of any
controlled waters requires an EIA (Carroll and Turpin, 2009, p 167).
2.2.4.3 Corporate social responsibility (CSR)
The attention focused on CSR has increased over the last 10 years although its
definition and interpretation have evolved since 1950 (De Bakker et al., 2005). Vaaland
and Heide (2005) conceive that CSR defines to a large extent how firms relate to society
Chapter 2- Reviews of established theory and practice
60
and their surrounding environment. From their viewpoint, CSR is an instrument to
demonstrate engagement, ethical behaviour and commitment to communicate
performance. Babbie (2007) defines CSR as “a systematic set of interrelated statements
intended to explain some aspects of social life”. In the EU, CSR is defined as “the
responsibility of enterprises for their impacts on society” (EC, 2011b). The EU points
out that being socially responsible aims to increase value to both owners and
stakeholders, and to identify, avoid and mitigate negative impacts of organisations (EC,
2013c).
The International Institute for Sustainable Development (IISD) indicates that CSR is a
form of business accountability to broader stakeholders which seeks in the short,
medium and long terms to address issues such as environmental conservation and
contribute to the wellbeing of employees and their surroundings or “hosting” societies
(IISD, 2013). Maon et al. (2008, p 55) collected and presented more definitions of CSR
over the period 1975-2005. The definitions explored suggest that, under the concept of
CSR, maximising the profitability of business is not regarded as a bad or prohibited
objective; instead it is seen as a welfare which should be shared by business and society
and not gained at the expense of environmental degradation.
Some of the attractive features of CSR practices are that organisations can adopt them
voluntarily and use them as a means to share knowledge and learn from best practices.
As a mean to measuring and communicating performance (which is essential for
sustainability), CSR has gained more interest within a broad range of organisations such
as Johnson & Johnson, Hewlett-Packard, Nestlé and Nike (Maon et al., 2008). In the oil
industry, CSR has also been widely adopted as shown by the CSR reports and web sites
of companies such as Valero Energy Ltd., ExxonMobil, BP and ESSAR.
Unlike LCA and EIA, CSR voluntary instruments seek to provide recommendations and
guidance to enterprises on good practices to promote economic, environmental and
social progress aligned with existing regulations. Different approaches of CSR exist at
the EU and international levels as shown by the OECD Guidelines for Multinational
Enterprises (OECD, 2011), the ten principles of the UN Global Compact (UN Global
Compact, 2014), the International Labour Organisation Tri-partite Declaration of
Principles concerning multinational enterprises and social policy (ILO, 2006) and the
ISO 26000:2010 Guidance Standard on Social Responsibility (ISO, 2010).
Chapter 2- Reviews of established theory and practice
61
Some of the tools such as ISO 26000:2010 can be used for different types of
organisations, i.e. large/small enterprises, and with no distinction between the activity
and location (ISO, 2010). Others, such as the OECD Guidelines for Multinational
Enterprises, are more appropriate for larger organisations which in principle can cause
more significant impacts (OECD, 2011).
The most relevant guidelines for the EU are the OECD Guidelines for Multinational
Enterprises (EC, 2013c) which are “recommendations addressed by governments to
multinational enterprises operating in or from adhering countries” (OECD, 2011).
These guidelines consist of principles and standards for responsible business conduct
and contributions to sustainable development globally without any means of
enforcement.
The areas addressed are disclosure (referring to the obligations of enterprises to disclose
reliable information with regard to activities, structure, finances, performance and
governance); human rights; employment and industrial relations; the environment;
combating bribery, bribe solicitation and extortion; consumer interests; science and
technology; competition and taxation.
More than a proper environmental assessment or decision making tool, CSR mostly has
been articulated in enterprises as a managerial tool to demonstrate commitment to
economic, social and environmental wellbeing (Du and Vieira, 2012). In the specific
case of the environment, society comprising companies, stakeholders, local
communities, governments, non-governmental organisations, etc., have put increased
pressure on companies to disclose their performance. As a result, companies have
concentrated more on CSR reporting to communicate their performance and
sustainability-related efforts (Spangler and Pompper, 2011) as a strategy to strive for
legitimacy26
.
In the case of the oil industry, this strategy is of particular significance since the
combustion of fossil fuels and emissions of CO2 (a greenhouse gas) is causing adverse
effects on the environment due to global warming. In addition the occurrence of some
26
Legitimacy has been defined as “a generalised perception or assumption that the actions of an entity
are desirable, proper or appropriate within some socially constructed system of norms, values, beliefs
and definitions” (Suchman, 1995, p 574).
Chapter 2- Reviews of established theory and practice
62
catastrophic events, such as the BP Gulf of Mexico oil spill, has threatened the
legitimacy of the industry (Villiers and van Staden, 2011; Du and Vieira, 2012). This
legitimacy is important to the oil industry, and also to other organisations worldwide,
because it provides a basis for prosperity, credibility, general public acceptance, support
for future large scale projects and increased competitiveness (Du and Vieira, 2012).
The EU has a CSR policy in place (EC, 2011b). This policy aims to enhance the
performance (economic, social and environmental) of organisations which strive for
sustainability. The EC states that to fully meet social responsibility, enterprises “should
have in place a process to integrate social, environmental, ethical human rights and
consumer concerns into their business operations and core strategy in close
collaboration with their stakeholders”.
Based on this literature review, Figure 2.8 shows how LCA, EIA and CSR principles
can be used to promote sustainability by their different perspectives on environmental
assessment.
Figure 2.8. Tools striving sustainability: relationship
However, despite sharing the common purpose of striving for sustainability, LCA, EIA
and CSR have different functionalities which can be enhanced if used together. Figure
2.8 indicates that LCA results can be used to inform either EIA or CSR whereas EIA
results fed into CSR. LCA in a comprehensive and rigorous manner determines all the
impacts on the environment associated with a process, product or service independently
of the location of the plant, the activity performed and the company. EIA also
Managerial tools
Environmental assessment/decision making tools
LCAEIA
CSR
Chapter 2- Reviews of established theory and practice
63
determines impacts but ignores the supply chains and focuses on the site, the process
and the activity to be performed. Both LCA and EIA results can thus feed CSR which is
required to demonstrate performance in an accurate and reliable way. LCA and EIA are
considered environmental and decision making tools whereas CSR is a managerial tool.
2.2.5 Sustainable industry
It is generally accepted that industrial systems have enhanced the quality of people’s
lives and promoted economic growth over time. However, their operations have
produced serious damage to the environment - from extraction of raw materials to the
generation of emissions and waste - which are now more evident than ever. What one
should have in mind when considering an industry in the context of sustainable
development is that less input is associated with less waste and emissions or, in overall
terms, less environmental burden.
Examples are provided in Table 2.3 to give the extent to which productive systems
impact the environment. The table shows by material intensity analysis (MIT) the
amounts of abiotic materials (non-renewable resources such as minerals, fossil energy
sources and soil excavations), water and air which are consumed to produce selected
materials and services in different regions. MIT is a practical application of the concept
of material intensity per service unit (MIPS)27
developed by Schmidt-Bleek and
colleagues from the Wuppertal Institute for Climate Environment and Energy in
Germany (Schmidt-Bleek, 1993).
27
According Schmidt-Bleek (1993) MIPS measures the quantity of materials utilised (also called
materials input) during the production, consumption or waste disposal/recycling of a service or product
through the whole life cycle (from cradle to cradle). It is expressed as kg material input/kg product or
service.
Chapter 2- Reviews of established theory and practice
64
Table 2.3. Material intensity of materials, fuels, transport services, food (Source:
Wuppertal, 2013)
Material/Service Specification Material Intensity (kg/kg)
Abiotic materials Water Air Region
Aluminium Primary production 37 1,047.7 10.9 Europe
Gold Estimated 540,000 Not available Not available World
Platinum Not reported 320,301 192,728 13,772 South Africa
(mono) Ammonium
phosphate Not reported 7.4 50.6 3.7 Germany
Stainless steel 17% Cr; 12% Ni 17.9 240.3 3.4 Europe
Cement Portland cement 3.2 16.9 0.3 Germany
Leather Chrome tanned 12.30 515 2.8 Europe
Paper and board Primary, bleached 9.2 302.9 1.3 Europe
Crude oil Not specified 1.2 4.3 0.01 Germany
Diesel 42.8 MJ/kg 1.4 9.7 0.02 Germany
Hard coal 24.1 MJ/kg 5.9 5.3 0.02 UK
Biogas plant*
400kW, without heat
extraction, at grid
connection point
595 1,747 954 Germany
Electricity
Electrical power,
European OECD
Countries
1.58 63.8 0.4 Europe
(*) This biogas plant also consumes 2.973 kg of biotic materials (i.e. biomass) and 346 kg of earth
movements.
As can be seen production of these materials has a significant environmental impacts
with water being the most affected raw material. Although more data is needed to
perform a more comprehensive analysis (by including other inputs such as composite
materials and waste generated per product or service unit), the results suggest that the
goal of achieving sustainability in industry - at least from an environmental perspective
- is a significant technological challenge which may require adapting existing
infrastructures and/or modified current practices and methodologies.
In the EU, industry is classified according to the Statistical Classification of Economic
Activities in the European Community (NACE). The Industry includes manufacturing;
construction; energy and the water utilities; the extractive industries and agriculture;
forestry and fishing. The manufacturing sector aggregates the subsectors of food;
beverages and tobacco; textiles; leather and footwear; wood and products of wood and
cork; pulp; paper; printing and publishing; chemical; rubber; plastics and fuel; other
non-metallic minerals; basic metals and other fabrication of metal; machinery not
Chapter 2- Reviews of established theory and practice
65
classified elsewhere; electrical and optical equipment; transport equipment;
manufacturing not classified elsewhere and recycling.
Some manufacturing processes utilise enormous amounts of natural capital which do
not end up in any useful form; hence the importance of optimising the production
process. Whilst consumption patterns and life styles in most industrialised countries
need to change, industries need to optimise their processes to use fewer resources.
Within the context of sustainable development, challenges have been widely
acknowledged by different sectors, e.g. food production, automotive manufacturing,
energy generation, etc, which have changed industrial practices to minimise their
environmental impacts. There is still room for improvement in targeted areas such as
product planning and design, but industrial manufacturing, use/re-use of manufactured
materials and management of waste can make the difference and help industrial systems
move towards paths of sustainable development (Evans et al., 2009).
2.3 Regulatory frameworks governing EU/UK oil refining facilities
To give an overview of how waste is currently managed in industrial facilities
(specifically in the UK oil refining industry), it is important to provide background on
the relevant legislation which covers manufacturing facilities with regard to the
environment and in particular to the management of waste. Much of the progress
towards sustainability in terms of environmental protection is being driven by
legislation; hence the importance of understanding the rules and recommendations set
out by regulatory authorities.
Under the Treaty on the Functioning of the European Union, Member States agree to
adopt EU laws (i.e. regulations, directives, decisions, recommendations and opinions)
with binding powers as follows (EC, 2012, pp 171-172):
• Regulations: are similar to national laws and “shall be binding in their entirety
and directly applicable in all Member States”;
• Directives: establish general rules to be transferred into national legislations.
Each Member State has the choice to select the form and methods to address
these rules but “they shall be binding as to the result to be achieved”;
Chapter 2- Reviews of established theory and practice
66
• Decisions: are EU laws addressed to specific parties (unlike regulations), but are
fully binding; and
• Recommendations and Opinions “shall have no binding force”.
2.3.1 Legislative framework
In the UK, the oil refining industry, in order to grant/keep permission to operate, is
required to comply with different types of direct and indirect regulations designed to
protect the environment and to meet other legal obligations28
. These regulations (mostly
from the EU) address areas related to environmental permitting; waste; air pollution;
water; contaminated land; nuisance; climate change and energy; hazardous substances
and chemicals; major incidents (control of major accidents hazards - COMAH);
planning; wildlife and biodiversity; marine and corporate responsibility (Valero Energy
Ltd., 2013a).
With regard to the environmental permitting and management of waste, the most
relevant legislations at the EU level are shown in Table 2.4.
Other legislation includes Directive 2012/19/EU (OJ L197, 24.7.2012, p 38) on waste
electrical and electronic equipment (WEEE) (recast) and the Commission Regulation
No. 142/2011/EU (OJ L54, 26.2.2011, p 1) on health rules as regards animal by-
products and derived products not intended for human consumption (EC, 2011b).
In the UK, such EU legislation has been transposed into law according to Figure 2.9. As
seen, the transposition of EU legislation into UK law (specifically with regard to
environmental permitting and the management of waste) is done by the Department for
Environment, Food and Rural Affairs (DEFRA). Through statutory instruments (SIs),
DEFRA delegates the Environment Agency (EA) (an executive non-departmental
public body) and Natural Resources Wales (NRW) to regulate them in England and
Wales respectively. In carrying out this function, EA and NRW (EA, 2013 and NRW,
2013) are required to evaluate the environmental impacts of the refineries’ operations
28
The legal register of Valero Energy Ltd. Pembroke Refinery comprises 80 different types of regulations
(Valero Energy Ltd., 2013a). This legal register is managed by Waterman Environmental (Waterman,
2013), maintained up-to-date and constituted by all the environmental and/or occupational health and
safety legislation and other requirements applicable to the site activities.
Chapter 2- Reviews of established theory and practice
67
and to establish certain conditions, e.g. emissions limits, to grant, keep or renew their
permits to operate. These permits are issued under the Environmental Permitting
Regulations (EPR) (England and Wales) SI 2010/675 (Legislation.gov.uk, 2010).
Table 2.4. The most relevant EU legislation covering environmental permitting and
waste of the oil refining industry
EU legislations covering the management of
waste No Reference
Industrial Emissions Directive (IED) 2010/75/EU EC, 2010c
Waste Framework Directive (WFD)* 2008/98/EC EC, 2008a
Decision on the European List of Waste
(LoW) 2000/532/EC EC, 2000
Regulation (EC) on Shipments of Waste ** 1013/2006/EC EC, 2006a
Landfill Directive*** 99/31/EC EC, 1999
(*) Until the revised WFD 2008/98/EC, Directive 2006/12/EC (OJ L114, 27.04.2006, p 9) was the only
legally valid version.
(**) This decision has been amended by regulations No. 308/2009/EC (OJ L97, 16.04.2009, p 8),
664/2011/EC (OJ L182, 12.07.2011, p 2) and 135/2012/EC (OJ L46, 17.02.2012, p 30).
(***) The Council Decision 2003/33/EC (OJ L11, 16.1.2003, p 27) establishes the criteria and procedures
for the acceptance of waste at landfills pursuant to Article 16 of and Annex II to Directive 1999/31/EC.
The EA and NRW work closely with individual operators and trade bodies such as the
UK Petroleum Industries Association (UKPIA) in order to demonstrate that established
conditions should be priorities and the balance of costs and benefits of these conditions
will be reasonable for the sector (UK Parliament, 2013).
2.3.1.1 Industrial Emissions Directive (IED)
The operations of refineries in the EU are controlled by the Industrial Emissions
Directive (IED) 2010/75/EU29
. Under IED all industrial installations in Annex I of the
Directive are required to meet a wide range of obligations aiming to systematically
minimise/avoid environmental pollution and adverse effects to human health.
29
The IED has integrated seven existing directives into one, i.e. the Large Combustion Plant Directive
(LCPD); the Integrated Pollution Prevention and Control Directive (IPPCD); the Waste Incineration
Directive (WID); the Solvent Emissions Directive (SED); and the three existing directives on titanium
dioxide on (i) disposal (78/176/EEC), (ii) monitoring and surveillance (82/883/EEC) and (iii) programs
for the reduction of pollution (92/112/EEC) (DEFRA, 2014).
Chapter 2- Reviews of established theory and practice
68
One of the main features of the IED is that it has aggregated several regulations which
were previously applicable to different industrial installations. This was done in order to
take advantages of streamlining the implementation process, facilitate the activities of
permitting, reporting and monitoring throughout all installations and considerably
reduce administrative burdens.
The IED comprises five core elements or principles which define how the Directive
functions. They are: integrated approach, best available techniques, flexibility,
inspections and public participation.
The integrated approach means that under the IED a facility will be allowed to operate
as long as it holds a permit through which the management of all of its impacts are
addressed and controlled from the consumption of raw materials and energy use to the
generation of emissions to air, land and water and production of waste. This approach is
the first principle of the IED which aims to ensure environmental protection holistically
and prevent shifting of environmental burdens. It may be noted that this implicitly
requires life cycle thinking.
Figure 2.10 shows the second principle of the IED, i.e. the Best Available Techniques
(BAT), and how it relates to the permit conditions.
As already mentioned, a facility requires an environmental permit to operate. The
second principle of the IED sets out that all installation permits are conditioned by
emission limit values (ELVs) resulting from the facilities operations which have
used/implemented BATs. References to BATs and ELVs are normally found in a
document known as the BAT Reference Document (BREF) elaborated per industrial
sector and in collaboration with different entities such as non-governmental
organisations, EU Member States and industry experts as set out in Article 13 of the
IED. The original BREF for the Refining of Mineral Oil and Gas was adopted by the
European Commission in 2003 (EC, 2003a) and in July 2013 a review (formal draft)
was submitted to the IED Article 13 Forum for its opinion (EC, 2013d).
Chapter 2- Reviews of established theory and practice
69
(*) The Council Decision 2003/33/EC of 19 December 2002 establishes the criteria and procedures for the acceptance of waste at landfills pursuant to Article 16 of Annex II to Directive 1999/31/EC.
Figure 2.9. Transposition of the most relevant EU legislation (covering environmental permitting and waste) into UK law and
implementation in the refining industry of England and Wales
European Commission (EC)
Industrial Emissions Directive
(IED)2010/75/EU
Waste Framework Directive (WFD)2008/98/EC
Commission Decis ion on List of
Waste (LoW)2000/532/EC
The Landfill Directive
99/31/EC*
Regulation on Shipments of
Waste1013/2006
Environmental
Permitting (England and
Wales) Regulations
2010, as amended
SI 2010/675
Environmental
Permitting (England and
Wales) (Amendment)
Regulations 2013
SI 2013/390
Environmental Permitting
(England and Wales)
Regulations 2010, as
amended
SI 2010/675 Schedule 9
Waste (England and Wales)
Regulations 2011
SI 2011/988
Hazardous Waste (England
and Wales) Regulations 2005
as amended
SI 2005/894
The Waste (Miscellaneous
Provisions) (Wales) Regulations 2011
SI 2011/971The List of Wastes
(Wales) Regulations 2005
SI 2005/1820
Environmental Permitting (England
and Wales) Regulations 2010, as
amendedSI 2010/675 Schedule 10
TransfrontierShipment of Waste Regulations 2007SI 2007/1711
Environment Agency (EA)/Natural Resources Wales (NRW)
Environmental Permit/Conditions
Refining Industry in England and Wales
UK Government/Department for Environment, Food and Rural Affairs(DEFRA)
UK Petroleum Industry Association (UKPIA)
Chapter 2- Reviews of established theory and practice
70
Figure 2.10. IED second principle: BAT (Source: EC, 2014d, adapted from text)
The IED establishes that flexibility on the permits should be contemplated to allow the
licensing authorities to set less strict emission limit values in specific cases when
environmental benefits in contrast to the costs of abatement measures cannot be
justified; especial concessions can be awarded to installations depending on their
location conditions and technical features of the installation. It also indicates that all
facilities must be inspected regularly in order to assess their performance and
compliance with permit conditions.
This Directive also seeks to ensure that the public take part in the decision-making
process and are granted access to information contained in permit applications, reports
of monitoring releases and the European Pollutant Release and Transfer Register (E-
PRTR). The E-PRTR is a public register which reports environmental information, i.e.
pollutant releases, pollutant transfers and waste transfers, of all EU reporting states. The
data is organised by industrial activities (according to NACE) and economic sector
(EEA, 2014).
The IED is a relevant example of how the EU progressively has incorporated the
principles of sustainable development into its legislations. Although IED targets
environmental issues (one of the three pillars of sustainable development) and
performance of industrial facilities, key elements required to achieve sustainability are
addressed. These elements explained here can be summarised as follows:
• the holistic approach on tackling environmental impacts;
• the economic considerations when applying BATs; and
• the promotion of public participation in the decision-making process (i.e. for
permit applications) and free access to information.
Permit Conditions
Emission Limit Values (ELVs)
Best Available Techniques (BAT)
Technologies (installation’s design and procedures) used over
the operating life cycle of a facility which protect the
environment effectively (holistically) , affordably and are
accessible to operators.
Average emission levels obtained under normal/reference
operating conditions using a BAT or a combination of them.
Those conditions that all member states shall comply with or
ensure that all measures are in place necessary for compliance
Chapter 2- Reviews of established theory and practice
71
In this sense it can be said that the IED seeks to aid industrial facilities in striving for
sustainability in terms of environmental protection.
2.3.1.2 Waste Framework Directive (WFD)
The Waste Framework Directive 2008/98/EC (EC, 2008a) sets the basic concepts and
definitions related to waste and delivers guidance principles on how to collect,
transport, recover and dispose of waste with minimum risk to human health and least
environmental impact. In this sense preventing actions to reduce waste adverse effects
and efficiency measures to improve resource use are at the core of this Directive (EC,
2008a). The cornerstone of the WFD is to help the EU to become a ‘recycling society’
with a “high level of resource efficiency” by avoiding the production of waste and,
when it is produced, using waste as a resource.
The WFD has established targets by 2020 to guide measures30
and actions of EU
Member States with regard to preparing for re-use, recycling and other material
recovery as follows:
• 50% w/w (as minimum) of waste materials such as paper, metal, plastic and
glass from households and possibly other sources; and
• 70% w/w (as minimum) of non-hazardous construction and demolition waste
(including the use of waste to substitute naturally occurring materials such as
non-contaminated soils and stones).
The WFD lays down that the waste hierarchy shown in Figure 2.11 shall apply as a
priority order in waste prevention and management legislation and policy.
30
Annex IV of the WFD provides examples of waste prevention measures as set out in Article 29 of the
Directive. For example, the development of meaningful indicators to measure, control and prevent waste
generation is recommended as is the uptake of “creditable environmental management systems, including
EMAS and ISO 14001”.
Chapter 2- Reviews of established theory and practice
72
Figure 2.11. Waste Management Hierarchy (Source: EC, 2012a)
As seen in this figure, prevention is the preferred option, followed by re-use, recycling
and other forms of recovery, with disposal, i.e. landfill, as the last resort. Adopting this
waste hierarchy is one of the cornerstones of the WFD which also considers the use of
life-cycle thinking (LCT) when it comes to justify - in the context of waste policy - the
departure of some waste streams from the waste hierarchy.
Debate has surrounded the application of LCT “a priori” to solve environmental
problems (Lazarevic et al., 2012) although its benefits are widely recognised
specifically in the context of this EU Directive. The most relevant are:
• the ability to identify areas of environmental impacts;
• the capacity to ensure that any decision and/or action has an overall benefit to
the environment rather than bringing advantages to specific process, products or
services; and
• the capability to determine when initiatives to deal with specific waste streams
are compatible with other options to treat wastes in the product chain (EC,
2010d).
Annexes I and II of the WFD advice on the codes and their definitions of waste disposal
and recovery operations. They aim to normalise the terminology throughout the EU for
easy reference and to facilitate the exchange of information between country members.
These two annexes are of particular importance to manufacturing facilities and in
particular to the oil refining industry in keeping records and controlling the management
and treatment of waste more effectively.
The three concepts of polluter pays principle, extended producer responsibility and the
definition of waste are worth describing here as they are key to this Directive.
Chapter 2- Reviews of established theory and practice
73
The Polluter Pays Principle establishes a requirement that “the costs of disposing of
waste must be borne by the holder of waste, by previous holders or by the producers of
the product from which the waste came” (EC, 2008a). This principle is commonly
accepted at the EU and international levels with the aim of preventing damage not only
to the environment but also to human health. In this sense the polluter or waste producer
has the responsibility for the safe treatment and disposal of all the waste generated.
The Extended Producer Responsibility indicates that “Member States may take
legislative or non-legislative measures to ensure that any natural or legal person who
professionally develops, manufactures, processes, treats, sells or imports products
(producer of the product) has extended producer responsibility” which means that
producers of specific categories of products and equipment take full responsibility for
the finance of treatment, recycling and reprocessing of these items when they reach end
of life (EC, 2008a).
According to WFD the definition of waste is one of its key concepts. It is defined as
“any substance or object which the holder discards or intends or is required to
discard”. Depending on its properties waste is classified as hazardous and non-
hazardous. This classification is based on the properties laid down in Annex III of this
Directive and are further specified by the Commission Decision 2000/532/EC (EC,
2000). This Directive also has included provisions for the management of hazardous
waste and waste oils.
As seen previously the waste hierarchy, LCT and extended producer responsibility are
essential elements of the WFD although it comprises some other components which
provide guidance on the management of waste and are noteworthy:
• labelling of hazardous waste;
• permits and registration requirements from Member States to any establishment
or waste carriers undertaking waste management activities;
• waste management plans and prevention programmes follow up;
• stakeholders, authorities and general public participation on the elaboration of
waste management plans; and
• waste production record keeping, reporting and reviewing.
Chapter 2- Reviews of established theory and practice
74
2.3.1.3 List of Waste (LoW)
The European Waste Catalogue (EWC) (Commission Decision 94/3/EC) was to be a
“reference nomenclature providing a common terminology throughout the Community”
aiming to improve efficiency of waste management activities and setting a common
terminology in the European Community (EC, 1994). It was further developed into the
European List of Waste (LoW) by Commission Decision 2000/532/EC (EC, 2000)
which establishes that all Member States shall classify and codify wastes according to
the activity where they were produced, the specific source where they were generated,
their physico-chemical properties and their nature, i.e. hazardous or non-hazardous.
Currently this Commission Decision is adopted by the EU members together with the
provisions in the Annex III of the WFD (Directive 2008/98/EC).
In the EU, codifying waste is a priority and an underlying issue for the IED and WFD.
In manufacturing facilities, a clear and consistent classification of waste is essential not
only due to regulatory obligations and reporting requirements but also because of the
aim to effectively control and improve performance through environmental
stewardship31
(Chevron, 2010). The LoW framework allows (among different activities)
to:
• elaborate the inventory of all waste streams produced by a site;
• inform and educate the workforce about wastes generated by process units;
• perform historical trend analysis and measure progress in performance; and
• facilitate decisions on waste management activities such as transportation,
environmental permits (facilities are usually granted for the processing of
specific waste codes) and treatment (i.e. recycling, disposal and landfilling).
According to Decision 2000/532/EC, the LoW should be revised regularly on the basis
of new knowledge and, in particular, of new research studies results. Currently this
Decision and Annex III of the WFD are being reviewed. The main purpose is to adapt
the existing legislation to technical and scientific progress made to date.
31
Promoting environmental stewardship in industrial installations and all parts of the society is important
and also challenging as it involves a shared responsibility for improving environmental quality by those
whose actions affect the environment (EPA, 2005).
Chapter 2- Reviews of established theory and practice
75
2.3.1.4 Regulation on Shipments of Waste
This Regulation (1013/2006/EC) specifies conditions under which waste can be shipped
between countries. It aims to ensure the safe shipment of waste (i.e. hazardous and non-
hazardous excluding radioactive waste) between Member States, within the Community
or with transit through third countries (i.e. imported into the Community from third
countries, exported from the Community to third countries or in transit through the
Community on the way from and to third countries) (EC, 2006).
The Regulation has been amended by the Commission’s Regulations 308/2009/EC,
664/2011/EC and 135/2012/EC and different procedures apply to waste shipment
depending on the country from, to or through which the waste is going to be moved.
The most common guidance principles are:
• all measures must be taken into account to ensure waste is managed (during
shipment and recovery or disposal) with the least risk to the environment and
human health;
• prior notification and consent of Countries involved, i.e. country of dispatch,
country of transit and country of destination, with the waste shipment must be
given;
• all shipments of waste for which notification is required shall be subject to the
requirement of a financial guarantee or equivalent insurance;
• if any interim recovery or disposal operations take place, the same obligations
apply as a final recovery or disposal facility;
• take-back obligations apply (with some exemptions) when shipment cannot be
completed as intended; i.e. the notifier must take the waste back, normally at his
own expense; and
• wastes subject to notification are set out in the “Amber List” (Annex IV of the
Directive), while wastes subject only to information requirements are set out in
the “Green List” (Annex III of the Directive) (Europa, 2011b).
In the UK oil refining industry this regulation is of relevance in particular for some
specific waste streams. Spent catalyst from hydrotreating, reforming, isomerisation and
catalytic cracking processes are the most common waste streams shipped to other
Chapter 2- Reviews of established theory and practice
76
countries for reprocessing, recycling and/or metals reclamation through specialised
companies or the catalyst manufacturer.
2.3.1.5 Landfill Directive
The Landfill Directive is intended to prevent or reduce the adverse effects of the landfill
of waste on the environment. It aims, “by way of stringent operational and technical
requirements on the waste and landfills, to provide for measures, procedures and
guidance to prevent or reduce as far as possible negative effects on the environment, in
particular the pollution of surface water, groundwater, soil and air, and on the global
environment, including the greenhouse effect, as well as any resulting risk to human
health, from landfilling of waste, during the whole life-cycle of the landfill” (EC, 1999).
This Directive also defines the different categories of waste which can be disposed into
landfills and establishes a procedure to be followed prior to landfilling:
• waste must be treated before being landfilled;
• hazardous waste within the meaning of the Directive must be assigned to a
hazardous waste landfill;
• landfills for non-hazardous waste must be used for municipal waste and for non-
hazardous waste; and
• landfill sites for inert waste must be used only for inert waste (Europa, 2010).
In the UK, this Directive applies for refineries in the sense that waste sent to landfill
should comply with acceptance criteria if the waste is not hazardous. For this purpose a
test must be performed to assess the waste against specified Waste Acceptance Criteria
(WAC) to certify that the material can be disposed of into a non-hazardous landfill.
Among refinery waste streams sent to non-hazardous landfill is biological sludge from
waste water treatment plants. For hazardous waste such as asbestos there are designated
or specialised landfill sites for disposal and analysis is not required.
2.4 Environmental management in the oil refining industry
As seen in Chapter 1 and depicted in Figure 1.6, environmental management in an oil
refinery is a cornerstone of operations and also a complex process since different
aspects (i.e. raw materials use, energy consumption, water utilisation, emissions,
Chapter 2- Reviews of established theory and practice
77
products and waste management) need to be handled at the same time and in an
integrated manner. The issue is not simply one of legal compliance or economic
performance (i.e. generating more profits by consuming less and producing more). It
goes beyond the gates of a refinery where surrounding communities demand high and
continuously improving performance. This has resulted from people’s increased
awareness of environmental topics, particularly the impacts of industrial operations.
This situation is faced by different oil refineries no matter who their owners or operators
are or where their installations are located.
Oil refineries have more common features than differences. They belong to a mature
and well established global business which has shared/transferred knowledge and best
practices over time not only within brands but also between different operators in the
sector (Grant, 2013). Another aspect that oil refineries have shared (at least those
operating in the same area such as the EU and the UK) are the regulatory frameworks.
This environment has ensured that most oil refineries’ systems and methodologies are in
a broad sense “similar” and from a general perspective “comparable”. For this reason,
analysing how the environment is managed in a particular UK oil refinery should yield
insights into practices in other facilities in the sector.
This Section explores general aspects of environmental management systems with
particular emphasis on the ISO 14001:2004 standard, analyses how the EMS of Valero
Refinery, Pembroke, is structured and articulated, investigates what are the main
elements of the Refinery’s environmental permit and explores how waste is managed
on-site. When applicable, opportunities for improvement are pointed out.
2.4.1 Integrated approach, continuous improvement and pollution prevention
The management of refinery operations (process units, systems and activities) is
performed in an integrated manner in order to improve efficiency in the production
processes and ancillary units resulting in enhanced overall economic and environmental
performance (EC, 2013, p 405). Aiming to minimise impacts and demonstrate
compliance with environmental objectives (the two main goals of management systems)
and without compromising the yield to useable products, oil refining operators across
the globe have integrated into their business Environmental Management Systems
Chapter 2- Reviews of established theory and practice
78
(EMSs) under the guidance of standards such as ISO 1400132
(ExxonMobil, 2013a;
Ineos, 2007; Total, 2013 and Valero Energy Ltd., 2012a).
In England and Wales, all industries regulated by the EA and NRW are required to have
a management system although the guidance or standard to be adopted (e.g. ISO 14001
and Eco Management and Audit Scheme -EMAS) is not prescribed. In this sense, the
use of any guidance or standard to develop the EMS is voluntary. The EA and NRW
indicate that industrial installations can develop or adopt their own in-house
management systems provided that they cover all the environmental aspects of the
company, include measures to continuously reduce the risk of pollution and allow
internal or external audits (EA, 2013a).
2.4.1.1 Integrated approach and continuous improvement
EMSs have been designed to provide a structure (i.e. network of rules, responsibilities
and objectives) for systematic management of environmental impacts so that improved
performance can be achieved continuously (Dixon et al., 2005). The ISO 14001
standard defines the EMS as: “The part of the overall management system that includes
organisational structure, planning activities, responsibilities, practices, procedures,
processes and resources for developing, implementing, achieving, reviewing and
maintaining the environmental policy” (BSI, 1996). In 2009 BSI provided a shorter
version of the previous EMS definition and added to it the management of
environmental aspects which are essential to determine how and the extent to which an
organisation interacts with its surrounding environment. The definition follows:
“an EMS is a part of an organisation’s management system used to develop and
implement its environmental policy and manage its environmental aspects” (BSI, 2009,
p 2).
The EMS vision of continual improvement in environmental performance responds to a
fundamental principle that (at the heart of total quality management) aspires to achieve
32
The ISO 14001 “is an international standard covering environmental management which intends to
provide organisations with the elements of an effective environmental management system that can be
integrated with other management requirements and help organisations achieve environmental and
economic goals” (BSI, 2009, pp v).
Chapter 2- Reviews of established theory and practice
79
“quality” or “zero-defects” on products or services and (in the context of environmental
management) “zero negative impacts to the environment” (Welford, 1997, pp 53-54).
The key elements or requirements of an EMS based on the ISO 14001 standard are:
environmental policy, planning, implementation and operation, checking and corrective
actions and management review. These requirements are further explained in Appendix
A.
A vision of environmental management in the oil refining industry based on the total
quality management approach and the ISO 14001 standard is shown in Figure 2.12.
Figure 2.12. A vision of environmental management in the oil refining industry (Source:
adapted from text in BSI, 2009, p vi, EC, 2013, p 405 and Cheremisinoff, 2006, p 51)
According to the figure, dealing with the environmental issues in the oil refining
industry involves the integrated management of water, waste, emissions, products, raw
materials and energy in a continual improvement process which, based on a
management system, aims to prevent pollution and comply with regulatory frameworks.
Overall the system-based approach to environmental management (i.e. the EMS)
comprises:
• definition/formulation of a policy statement which declares the commitment of
the company to comply with all environmental legislation and regulations and
the established targets and objectives aiming to protect the environment;
Water
management
Energy
management
Waste
management
Raw materials
management
Emissions
management
Environmental
Management
Products
management
Environmental policy
Implementation and operation
Checking and corrective actions
Management review
Planning
Chapter 2- Reviews of established theory and practice
80
• identification of environmental aspects and impacts33
, planning the activities and
actions to improve environmental performance on the areas affected and
establishing the objectives, targets and expectations;
• implementation of these actions;
• measurement (checking) of progress of the actions taken against the pre-set
expectations;
• review of the progress made to determine whether further changes are
appropriate or needed; and
• agreement on improvement measures and incorporation into the management
system, so that the process of continual improvement starts again.
The process of continuous improvement, first championed by Deming in the 1950′s
(Kanji, 1990), has provided organisations with the flexibility to modify and adapt
systems and strive for enhancements in environmental performance over time
(Cheremisinoff, 2006).
2.4.1.2 Pollution prevention
A theme running through this thesis is that prevention or minimisation of environmental
impacts is a central guiding principle in the EU and UK, in particular applied to
manufacturing facilities such as the oil refining industry. The term “environmental
impacts” refers to a wide range of effects covering the use/consumption of water,
energy, chemicals and other type of raw materials, the emissions of pollutants to air,
land and water and the generation of waste. The system-based approach of EMS is
widely adopted as the way to achieve these objectives.
Pollution prevention, as distinct from “end-of-pipe” or “clean-up” approaches, means
that any contamination or adverse effects to the environment are prevented or reduced at
the source whenever possible (Clift and Longley, 1995; Bartzokas and Yarime, 1997
and Clift, 2006) by minimising the production of pollutants (including their precursors)
or avoiding it completely. An efficient EMS can provide a rigorous and organised
33
According to ISO 14001:2004 environmental aspects are “elements of an organisation’s activities or
products or services that can interact with the environment” whereas environmental impacts are “the
changes to the environment, whether adverse or beneficial, wholly or partially resulting from an
organisation’s environmental aspects” (BSI, 2009, p 2).
Chapter 2- Reviews of established theory and practice
81
system through which pollution prevention activities are planned, implemented and
improved continuously.
2.4.2 Environmental Management System of Valero Refinery, Pembroke
Valero Refinery, Pembroke, has implemented an environmental management system
(EMS), shown in Figure 2.13, based on the essential elements of ISO 14001:2004 as
described in Appendix A.
As seen in the figure, the formulation of an environmental policy statement precedes the
planning, implementation and operation and checking stages in the EMS whilst the
environmental policy statement is preceded by the management review. This figure also
shows that all the stages (excluding the policy statement and management review) are
described by procedures (PPs), work processes (PKBs)34
and other documents. PPs,
PKBs and other documents are kept, controlled, maintained and updated in a refinery
network administrated by the HES department.
The PPs, PKBs and other documents address different aspects of the EMS including:
• measures to reduce environmental adverse effects and harm to human health;
• legal issues to assure compliance with regulatory frameworks;
• communication channels (internal and external) to record performance and
demonstrate compliance with regulatory frameworks;
• staff training to promote awareness and engagement in protecting the
environment;
• emergency plans to record, minimise and prevent accidents; and
• specific procedures and process to indicate how activities should be performed
in ways which are cost effective and protect the environment.
The following two sub-sections provide an overview of what the Refinery
environmental policy states and how the procedures, work process and other documents
are organised within the EMS.
34
PKB in the Refinery stands for “Pembroke Knowledge Base”.
Chapter 2- Reviews of established theory and practice
82
2.4.2.1 Environmental policy
The environmental policy of the Refinery (as of 5th
March 2012) integrates 16 elements
addressing health, environment and safety issues which must be implemented site-wide
The policy aims:
“to ensure that the appropriate standards are set, maintained, reviewed and improved
to comply with regulatory, corporate and Pembroke Refinery requirements35
” (Valero
Energy Ltd., 2012b).
With regard to the environment, Element 10 of the policy points out that the Refinery
must seek to:
“continuously improve environmental performance and reduce the impacts of
operations by promoting the use of best practices to minimise the generation of waste
and actively protect/manage areas of conservation interest in and around Pembroke
Refinery” (Valero Energy Ltd., 2012b).
From the perspective of the researcher, the Valero Refinery Pembroke Policy Statement
points out clearly that its core objectives include pollution prevention and
environmental protection and also indicates clearly how these two goals will be
achieved (i.e. by implementing best practices). This meets the requirement of ISO
14001:2004 that a policy statement must “provide a framework for setting and
reviewing environmental objectives and targets” (BSI, 2009, p 4), but more specific
targets (e.g. by how much is waste to be reduced or the percentage of waste that will be
recycled and when) must then be established at the planning stage to reinforce the
policy statement by committing the workforce to it and promoting environmental
stewardship site-wide.
35
These regulatory requirements refer to the operating conditions imposed by the EA (EA, 2013a). The
corporate requirements are those established by Valero Energy Ltd. (the current refinery operator) in its
Commitment to Excellence Management System (CTEMS) with regard to environmental practices
(element 2 of CTEMS - protecting people and the environment - referring to environmental practices)
(Valero Energy Ltd., 2012d). Refinery requirements refer to those originally set in the EMS based on ISO
14001:2004 (Valero Energy Ltd., 2012a).
Chapter 2- Reviews of established theory and practice
83
Figure 2.13. EMS Process at Valero Refinery, Pembroke (Source: developed from Valero Energy Ltd., 2012a)
Environmental aspects
Environmental Policy
PlanningImplementation
and operationChecking
Legal and other requirements
Objectives, targets and programs
PP-ENV-ISO-1005 Environmental Impacts
Environmental aspects and Impacts
register
Register of Legal and other
requirements
PP-ENV-ISO-1004 EnvLegislation
Environmental aspects and Impacts
register
Compliance assurance register
PKB-0311-Investigate and report incidents
PKB-0067-Identify & Respond to compliance
requirements
Resources roles and responsibilities and
authority(organ. chart)
Competence, training and awareness
Policies and objectives
Work process & SPIDefines who, what,
when & How
Local work procedures & work instructions
Determines how
Objective evidence and records
The results
Communication(internal-external)
Documentation
Control of documents
Operational control
Emergency preparedness &
response
PKB-0135-Develop & Maintain staff Competence
PKB-0271-Build & Manage the training
budget
PKB-0311-Investigate and report incidents
PKB-0314-Reporting incidents and
investigations to
external bodies
PP-ENV-ISO-2006 EA Reports
PP-ENV-ISO-2026 Water Quality Report
PP-ENV-ISO-2027 SOxEmissions Report
PP-ENV-ISO-2028 Air Quality Report
PP-ENV-ISO-1001-Doc Control
PKB-0121-Policies, SPIs and procedures
Environmental aspects and Impacts
register
PKB-0048-Emergency response
PKB-0020-Control of mustering
Monitoring & Measurement
Evaluation of compliance
Non-conformity (NC), corrective actions &
preventing actions
Control of records
Internal audit
Management review
Compliance Assurance Process
PKB-0024-Coordinate Management System Audits
NC: SPI-009-DSE:Display screen equipment-RSIPP:
Repetitive Stress Injury Prevention Program
NC: PP-ENV-ISO-1002 Internal Audit 6.4
NC: PKB-0153-Provide Environmental Compliance
Reports
NC: PKB-0311-Investigate & Report Incidents
NC: PKB-0314-Incident Investigation & Reporting to
External Bodies
NC: PKB-0024-Coordinate Management System Audits
Corrective action: PKB-0311 Investigate and Report
Incidents
Corrective action: PP-ENV-ISO-1002 Internal Audit 6.4
PP-ENV-ISO-1001 Doc control
PP-ENV-ISO-1002 Internal Audit
EMS Audit Schedule
Chapter 2- Reviews of established theory and practice
84
Cheremisinoff (2006, p 56) argues that the environmental policy statement “can reflect
not just an overall policy but rather be viewed as a vision statement with specific targets
and goals to achieve”.
2.4.2.2 Procedures, work processes and other documents
Every stage of the Refinery EMS, except for the environmental policy statement and
management review is detailed in procedures (PPs) (primary and secondary) and work
processes (PKBs).
Primary procedures (coded as PP-ENV-ISO-1xx) provide guidance on how to deal with
the different sections of the management system and secondary procedures (PP-ENV-
ISO-2xx) detail how the work should be carried out. The final “xx” digits are assigned
according to an internal numbering framework explained in the EMS procedure index
document (Valero Energy Ltd., 2012c). PKBs define the specific activities to be
executed and identify the workforce roles and responsibilities. Work processes are
coded in the EMS with the acronym PKB-yyyy where the last four digits also
correspond to a Refinery internal numbering framework. Standard practice instructions
(SPIs) are being substituted by PKBs.
The Refinery EMS also includes other uncodified documents, such as environmental
impacts and compliance assurance registers shown in Figure 2.13 associated to the
relevant planning stage. These documents contain specific refinery data such as areas,
business units, activities and materials responsible for producing environmental
impacts, impacts produced, abatement techniques in place, applicable legislation and
controls to assure compliance.
It is important to clarify that the EMS map depicted in Figure 2.13 only shows the most
relevant PPs and PKBs of the EMS. There are other PPs, PKBs and non-codified
documents not shown in the figure but also forming part of the EMS. For instance,
waste management is covered by the process PKB-0021-Coordinate and Manage Waste
which details how waste should be managed on-site and indicates the roles and
responsibilities of all involved parties. This PKB is further explained in Sub-section
2.4.4.4. To illustrate how elements of the Refinery EMS relate to each other, an
example is provided in Table 2.5. Specific points in the EMS, in particular with regard
Chapter 2- Reviews of established theory and practice
85
to the environmental aspects and impacts register, are significant and merit further
comment.
Table 2.5. Relationship between the elements of the Refinery EMS: a selected example
(Source: Valero Energy Ltd., 2012a)
EMS stage Section Procedure (PP) Related documents
Planning Environmental
aspects
PP-ENV-ISO-1005: Development,
maintenance and review of register of
environmental impacts. This procedure
aims to ensure that the environmental
aspects and impacts at the Refinery are
documented, assessed, prioritised and
reviewed. It requires that:
1) activities which produce adverse
effects to the environment during
normal, abnormal (turnarounds or
shutdowns) or emergency operations
should be identified and differentiated;
2) the main environmental impacts to
the air, water and land should be
registered;
3) the duration of the environmental
impacts (i.e. short, medium or long
term), the frequency of occurrence (i.e.
highly unlikely, unlikely, likely and has
occur), the risk ranking (i.e. low,
medium and high), the probability (i.e.
highly unlikely to occur, unlikely to
occur, may occur and highly likely to
occur) and the consequences (i.e.
minimal, low, moderate and high)
should be estimated.
4) the controls required to mitigate the
risks and improvement plans should be
determined;
5) the monitoring of environmental
emissions and when applicable their
impacts should be carried out; and
6) the legal requirements affecting the
environmental aspects and impacts
should be identified.
Environmental Aspects
and Impacts Register.
This document records:
a) the area of responsibility,
location and type of material
leading to the environmental
impacts;
b) the activities and aspects
associated with point (a);
c) the description of the
aspect (normally same as
point b);
d) the potential impacts,
their consequences,
probability and significance
according to PP-ENV-ISO-
1005;
e) the existing controls or
abatement techniques in
place;
f) the improvement plans
(conditions) if required;
g) the type of monitoring
undertaken;
h) the legal requirements;
and
i) the key contractors
involved or personnel
undertaking the tasks.
Chapter 2- Reviews of established theory and practice
86
Table 2.6 lists the areas and business units of the Refinery responsible for producing
environmental impacts and the associated materials; and describes and enumerates the
most relevant impacts and their consequences as at October 2012. Refinery areas and
business units are further explained in Appendix B.
Table 2.6 highlights the following features:
• the Environmental Aspects and Impacts Register of the Refinery as at October
2012 included 148 environmental impacts; this further demonstrates the
complexity of environmental management in oil refineries reflected by the
number of impacts which have to be controlled and mitigated;
• the majority of environmental impacts at the Refinery are produced by ancillary
services provided by the areas: Blending and Shipping (B&S), the Utility
Systems and the General On-Site Facilities;
• the worst-case impacts produced by the activities performed in these areas were
classified with the highest level of consequences;
• the number of environmental impacts arising from areas such as Black Oils
(BOs), Cracking and Olefins (C&O) and White Oils (WOs) (where the
processing, transformation and upgrading of crude oil and its derivatives take
place) was considerably lower but the worst-case consequences were higher; and
• although the number of impacts and their consequences in the Register indicates
the overall scope of the environmental management issues in a refinery, no
general conclusions can be drawn on which impacts produce the greatest
environmental effects.
It follows from the last point that more detailed information in the register, e.g. the
quantity of pollutants generated including emissions and waste, the amount of raw
materials consumed per activity and progress made in terms of efficiencies, could aid
the Refinery to establish priorities when setting up improvement plans and
implementing controls to manage environmental impacts. This measure is not a
requirement of the ISO 14001:2004 standard but has been identified in the present
review as an opportunity for improvement.
Chapter 2- Reviews of established theory and practice
87
Table 2.6. Main environmental aspects and impacts of the Refinery associated with specific areas and business units as at October 2012 (Source: Valero Energy Ltd., 2012e)
Refinery areas and business units Material (s) Description of main impacts Number of
impacts
Consequence
level at the
worst case
scenario*
-Black Oils (BOs): the Kerosene Merox Unit (KMU).
-Cracking and Olefins (C&O):
Naphtha, Butane and Olefins Merox Units.
Liquid chemicals and caustic solutions
(including phenolic caustic).
Accidental spills onto land and volatilisation of light fractions - i.e. volatile organic compounds (VOCs) - can cause air pollution
and odour issues. Uncontrolled discharges of caustic solutions to the Waste Water Treatment Plant (WWTP) through drains can
alter the performance of this unit (by increasing its load and the concentration of phenols and sulphides) and compromise the final
quality of the treated water.
5 2
Blending and Shipping (B&S): the Jetty and the In-
Shore Tank Farm.
Crude oil (imports), heavy and light oils
(imports/exports), liquefied petroleum gas
(LPG) (imports/exports) and refinery liquid
products (e.g. petrol, diesel, kerosene, etc).
Emissions to air of volatile organic compounds (VOCs) can occur during receiving, storing and transferring (from tanks and
pipelines) these materials on-site. VOCs are important sources of air pollution (odour issues) and creators of explosive
atmospheres. Accidental releases of hydrocarbons to land and water can also cause pollution affecting in particular vegetation and
sea life.
54 4
Cracking and Olefins (C&O): Fluidised Catalytic
Cracking Unit (FCCU). Alumina and molecular sieve catalyst fines.
During normal operations and turnarounds fines containing metals such as nickel or vanadium can be accidentally expelled through
stacks or the unit causing pollution to air by increasing the concentration of particulate matter. Minor contribution to landfill can
also occur if these fines are not recycled.
3 3
Cracking and Olefins (C&O): Alkylation Unit
(AlkyU). Hydrofluoric acid (HF).
Releases to air and water can occur due to the purging of equipment or loss of containment. Acid water (wash water) can be
accidentally discharged to land during emergency events. Significant air quality issues and pollution can occur due to the venting of
acidic fumes causing damage to plants and animal life. An increase in the concentration of fluorides in the waste water can alter
significantly the performance of the Waste Water Treatment Plant (WWTP) and further compromise the quality of treated water.
3 4
Cracking and Olefins (C&O):
Sulphur and Amine Recovery Units
Hydrogen sulphide (H2S), sulphur oxides
(SOx), nitrogen oxides (NOx) and amine (fresh,
lean or spent).
WWTP performance can be affected and the quality of treated water changed if sour water is discharged without any control.
Ground water pollution can occur due to amine runoff during delivery or accidental spillages. Air quality can be affected by
(uncontrolled) fugitive releases of H2S, SOx and NOx emissions.
6 4
General On-Site Facilities: include the areas: Bundle
Cleaning, Laboratory, Grit Blasting, Recycling Facility,
Crushed Concrete Compound and Buildings (i.e.
catalysts, adsorbents and bulk chemicals storage, control
rooms, the canteen, the health centre, the admin
building, workshops, warehouses and contractor work
sites).
Solid catalysts containing metals such as
cobalt, molybdenum, platinum; catalyst
supporting materials such as molecular sieve,
alumina and clays; spent grit blasting materials;
general/municipal waste; laboratory chemicals;
radioactive substances; oily sludge; cardboard,
paper, plastic cups; wood; medical waste; used
tyres; food waste; etc.
Releases to land of catalyst during transportation and storage due to loss of containment. Accidental spills of oil can occur onto land
during the decontamination of pipes and/or equipment. Contribution to landfill can increase if general waste is not correctly
segregated. Contamination of groundwater can occur due to runoff of hydrocarbons contained in hazardous waste if not well stored
and isolated. Noise pollution can be generated at workshops and heavy duty areas. Air quality can be compromised due to blow-off
of waste and debris from skips and bins. Radioactive emissions to air can compromise human health. Emissions of carbon dioxide
(CO2) and methane (CH4) during the incineration of materials such as oily sludge, medical wastes and tyres can contribute to the
global warming potential.
33 4
Utility Systems: include the fuel oil and fuel gas
systems, the Raw Water Treatment Plant, the Steam
Generation System, the Waste Water Treatment Plant
(WWTP), the Flare System, the Cooling Towers (a.k.a.
the Cooling System) and the natural gas pipeline.
Combustion gases including CO2, SOx, NOx
and particulates; solid and carbonaceous
materials resulting from clean-up operations;
fuel oil; raw and treated water; oily and
biological sludge; volatile organic compounds
(VOCs), methane (CH4) and hydrogen sulphide
(H2S).
Visual impacts can occur due to black smoke generation if combustion is not well controlled. CO2, NOx and SOx emissions
increase the concentration of greenhouse gases in the atmosphere and the global warming potential. Visual impacts can also occur
due to steam venting. The raw water consumption for steam generation can increase if the Steam Generation System is not well
operated. Leaks in this system can also generate important losses of steam casing and increase in raw water demand. Water
bacterial contamination (i.e. legionella) can occur leading to further air pollution. Ground water contamination can be caused by
accidental run-off of fuels during handling. Explosive clouds can be generated due to volatilisation of organic compounds in fuel
oil. There is a landfill contribution due to WWTP oily and/or biological sludge disposal (if sent to hazardous and non-hazardous
landfill). Contributions to air quality issues and greenhouse gases result from CH4 and H2S emitted by WWTP ponds. Energy use is
considered another impact as the Refinery consumes energy in combustion processes, steam generation and site-wide.
36 4
White Oils (WOs): the Diesel Hydrotreaters One and
Two (HTU-1 and HTU-2), the Naphtha Hydrotreater
(the Unifiner), the Isomerisation Unit, the Catalytic
Reforming Unit (CCR/CRU) and the Liquid Petroleum
Gas Recovery Unit (LPGRU).
Catalysts containing metals such as cobalt,
molybdenum and platinum; catalyst supporting
materials such as alumina, molecular sieves;
clays and freon.
During normal operations, turnarounds (i.e. catalyst changeouts) or emergency shutdowns, emissions to air of catalysts and
supporting materials can cause pollution due to the increased amounts of dust and particulates released. Also, if pyrophoric
materials contained in the catalysts are discharged and ignite, fumes and smoke can be generated causing air contamination.
Migration of metals can pollute watercourses if transfers between environmental media occur. A small contribution to landfill can
occur if catalyst particulates released and collected are not recycled. Fugitive leaks and minor venting of freon can compromise the
air quality and contribute to ozone depletion.
8 3
(*)According to the PP-ENV-ISO-1005 (Valero Energy Ltd., 2012h) the consequence levels are as follows: (1) impact confined to site boundaries, with no adverse effects and short-time duration (hours); (2) impacts outside site boundaries, with no direct
threat to sensitive receptors and a duration no more than days (short-term); (3) impacts can last weeks (medium-term impacts) affecting limited areas outside the boundaries of the Refinery requiring significant remedial measures; and (4) impacts likely to
last several months to years affecting large areas outside the boundaries of the Refinery (i.e. the Milford Haven Estuary) requiring major abatement measures.
Chapter 2- Reviews of established theory and practice
88
2.4.3 Environmental permitting: the case of Valero Refinery, Pembroke
As seen in Figure 2.9, the Environmental Permitting (England and Wales) Regulations
2010 No. 675 (EPR) (transposed into domestic legislation from the EU IED) is one of
the most relevant pieces of legislation governing the operations of oil refineries in
England and Wales (see Schedule 1, Part 2, Chapter 1, Section 1.2 of the Regulation).
In England and Wales, environmental permits are regulated by the EA and NRW and
require that “all installations may only be operated if the operator holds a bespoke
environmental permit containing all the provisions required to protect the
environment” (Legislation.gov.uk, 2010). This sub-section investigates the main
elements of environmental permits in England and Wales, with particular reference to
the Refinery.
Overall environmental permits in England and Wales include a range of conditions or
rules which indicate what the operators should do to protect the environment and
people. These conditions are further detailed in specific schedules. Figure 2.14 presents
a general vision of how environmental permits are structured in England and Wales.
Figure 2.14. General structure of environmental permits in England and Wales
The Refinery has a bespoke permit with conditions and schedules specific to the site
activities. Figure 2.15 lists the conditions and the schedules addressed by the permit,
Table 2.7 further explains these conditions and Table 2.8 details the information
contained in the schedules.
The most significant aspects of the Refinery’s Environmental Permit for the
management of waste are:
Conditions
Environmental permit
Schedules
Chapter 2- Reviews of established theory and practice
89
• the environmental issues and conditions set out in most detail in the Permit
relate to the management and control of emissions of pollutants to air (e.g.
greenhouse gases, VOCs, etc), land (e.g. hydrocarbon products in case of loss of
containment) and water (e.g. metals, sulphides, chlorides, ammonia, etc); less is
said with regard to the production and management of solid waste;
• all operating techniques (including the management of waste) shall be carried
out as specified in the “application for a permit” document which recommends
that they be selected based on the BAT criteria (Annex III of the IED). This
permit application document was issued in 2006 and has not been updated since
then;
• there are certain limitations on the type of fuels to be used in the combustion
processes;
• general conditions apply to the selection of other raw materials (e.g. crude oil,
catalyst). These indicate that the selection of these materials should be based on
their potential to pollute less and minimise the generation of waste (as pointed
out in the permit application document);
• there is no indication that waste production figures shall be reported to the
agency nor how frequently36
;
• among the improvement conditions, the only requirement with regard to waste
concerns the management of oily wastes; and
• reporting duties in terms of improvements made in the Permit’s conditions
include their recording, review and notification to the Agency every four years;
36
Waste production figures are reported annually to the EA according to the Hazardous Waste (England
and Wales) Regulations 2005 as amended (SI 2005/894).
Chapter 2- Reviews of established theory and practice
90
Figure 2.15. Conditions addressed and schedules of the Refinery’s Environmental Permit (Source: EA, 2013b)
1.1 General management
1.2 Accident management
plan
1.3 Energy efficiency
1.4 Efficient use of raw
materials
1.5 Avoidance, recovery
and disposal of wastes
produced by the activities
1.6 Site security
1. Management3. Emissions and
monitoring2. Operations 4. Information
2.1 Permitted activities
2.2 The site
2.3 Operating techniques
2.4 Off-site conditions
2.5 Improvement
programme
2.6 Pre-operational
conditions
2.7 Closure and
decommissioning
2.8 Site protection and
monitoring programme
3.1 Emissions to water, air
or land
3.2 Transfers on-site
3.3 Fugitive emissions of
substances
3.4 Odour
3.5 Noise and vibration
3.6 Monitoring
3.7 Monitoring for the
purposes of the Large
combustion Plan Directive
4.1 Records
4.2 Reporting
4.3 Notifications
4.4 Interpretation
1. Operations
2. Site plan
3. Waste types, raw
materials and fuels
4. Emissions and
monitoring
5. Reporting
6. Notifications
7. Interpretation
Conditions Schedules
Chapter 2- Reviews of established theory and practice
91
Table 2.7. Detailed conditions of the Refinery’s Environmental Permit
Element Conditions
Management
• All activities, accidents and non-conformances shall be managed according to a management system which identifies and minimises risks of pollution;
• energy must be used efficiently and improvement plans should be in place to minimise consumption;
• convenient actions shall be taken to ensure that raw materials and water are used efficiently and measures shall be adopted to substitute materials for those that are less harmful to the
environment;
• appropriate actions shall be taken to ensure that waste produced by the activities is avoided or reduced, and wherever is produced it shall be treated manners which minimise impacts to
the environment;
• in case of improvement actions and measures to manage raw materials, energy and waste be taken and implemented, records of these actions and measures should be kept and reviewed
at least every four years; and
• site security should be guarantee to prevent unauthorised access to the site.
•
Operations
• The operator shall carry out the type of activities pointed out in Schedule 1 of the permit*;
• the location where these activities can take place shall be as indicated in Schedule 2 of the permit*;
• the operations should be performed according to the techniques described in the application for a permit document as indicated in Schedule 1 of the permit*;
• the type of raw materials to be used and consumed and the waste streams to be treated shall be as specified in Schedule 3 of the permit*;
• the improvement programme requirements shall be implemented in accordance with Schedule 1 of the permit* and notifications be made to the agency after completion;
• if a site closure is going to take place a decommissioning program shall be submitted to the agency to indicate how the activities will be carried out and demonstrate that they will be
performed without causing any pollution to the area; and
• the installation shall maintain a site protection and decommissioning programme.
Emissions
and
monitoring
• The limits and source of emissions shall not be exceeded and modified respectively as pointed out in Schedule 4 of the permit*;
• all wastes sent off-site for disposal or recovery (recycling) should be recorded and maintained on-site;
• fugitive emissions shall not cause pollution and should be controlled through measures established in Schedule 1 of the permit*; to prevent liquid emissions to land and water, secondary
containments shall be provided to minimise the risk of pollution;
• odour, noise and vibration shall be managed and controlled in manners that do not affect areas outside the borders of the facility (see Schedule 1 of Table 2.8);
• the monitoring and records - of sampling procedures, analysis and surveys results - of emissions shall be carried out as indicated in the Schedule 4 of the permit (and permanent access to
the information shall be guarantee) taking into account their sources, locations and methodologies; this condition specifies that “monitoring equipment, techniques, personnel and
organisations employed for the emissions monitoring programme shall have either MCERTS (i.e. the EA’s Monitoring Certification Scheme) certifications or MCERTS accreditations
unless otherwise agreed in writing by the Agency”; and
• all monitoring activities in the combustions plants should be performed in accordance with Annex VIII of the Large Combustion Plant Directive (LCP) (currently in Annex V, Part 3 of
the IED which provides technical aspects relating to combustions plants).
Information
• All records shall be maintained legible, accessible and available for inspection by the Agency;
• performance figures (Schedule 5 of the permit*) as well as any improvements made shall be informed and submitted to the agency by the 31st January each year corresponding to the
data generated the previous calendar year;
• the Refinery shall notify the agency as soon as any malfunctions, breakdowns, failures or breaches occur and also any intentions with regard to site plants closures (see Schedule 6 of the
permit*); and
• for interpretation conditions see Schedule 7 of the permit.
(*) See Table 2.8
Chapter 2- Reviews of known theory and practice
92
Table 2.8. Information detailed in the Schedules of the Refinery’s Environmental Permit
(EA, 2013b)
Schedule
(No) Information
1
Operations
-Restrictions on the type of activity the facility can carry out and their limit values: the Refinery can operate and perform
the following units and activities: boiler plant, business units for the processing, conversion and upgrading of crude oil and its
fractions, crude oil and derivatives blending and shipping, LPG (or natural gas) odorising, sulphur recovery and production,
disposal of hazardous and non-hazardous (e.g. ballast water, oily waste and waste water through the WWTP), burning of sour
and sweet gases at flares, systems used for cooling (e.g. cooling towers), lagoons and settling ponds for temporary storage of
water, effluents and oil-based liquids, oxygen and/or nitrogen generation systems (e.g. air separation units), surface water
drainage systems, and WWTP.
-Operating techniques: the Refinery’s activities shall be carried out using the techniques and in the ways described in the
application document37
(Entec, 2006) presented to the EA for a permit to operate under the Pollution Prevention and Control
(PPC) Regulations, now the Environmental Permitting (England and Wales) Regulations 2010.
-Improvement programme requirements: the Refinery’s permit comprises a total of 31 improvement conditions which
includes procedures, measures and programmes to: control, minimise or avoid the contamination of waterways by measuring
and limiting the concentrations of pollutants such as Cu, Fe, Zn, Hg, Cd, monitor emissions of NOx, SOx and particulates by
implementing continuous emission monitoring systems (CEMS) certified by schemes such as MCERTS (i.e. the EA’s
Monitoring Certification Scheme), demonstrate compliance against an hourly bubble limit38
for SO2, control of noise, vibration
and odour to minimise disturbances to areas outside the borders of the facility, reduce fugitive emissions by implementing leak
detection and repair (LDR) programmes, control the influents of the WWTP in order to prevent malfunctions and low quality
of treated water, recover gases and prevent unnecessary flaring, assure that primary and secondary containment measures are
sufficient to prevent spillages, keep a high efficiency of the Sulphur Recovery Unit (SRU) and ensure that the production of
hydrocarbon-containing wastes are prevented in the first place or in the case it cannot be possible they are treated in ways
which maximise the recovery of valuable materials and minimise their environmental impacts.
2 Site plan: specifies the border limits within which allowed units and activities can be operated and performed.
3
Waste types and raw materials: specifies the raw materials (fuels and water) the facility can handle and the waste types that
can be imported to site for treatment. Fuels permitted: refinery fuel gas and other fuels such as natural gas to be consumed in
combustion process. Although this Schedule does not specify other type of raw materials it refers to the permit application
document where it is indicated that raw materials should be selected giving priority to those with the lowest potential to pollute
and with the minimum capability to generate waste after use. Wastes allowed: ship ballast water oil.
4
Emissions and Monitoring: indicates the emissions limits, point of reference, location, source and monitoring requirements
for SOx, NOx, particulate matter, CO, VOCs, sour gas, HCl and benzene in air and oil, phenols, sulphides, fluorides,
ammonia, cyanides, Fe, Zn, Ni, Ar, Cr, Pb, suspended solids, Hg, and Cd in treated water (effluents). Other requirements
include the monitoring of sulphur content in the refinery fuel oil and the SRU efficiency.
5
Reporting: establishes the parameters (i.e. emissions values, annual production and performance figures) the operator shall
report to the regulator. Among these parameters are: the quantity of SOx, NOX, VOC and particulate matter emitted, treated
water pH, ammonia, metals, sulphides, chlorides and cyanides content, the amount of fuels produced, the quantity of crude oil
and other feedstocks processed, the total energy used and the amount of raw water consumed and treated water discharged.
6 Notification: indicates other relevant information that the operator should notify to the regulator (e.g. site name and address,
notifications of any malfunction, breakdowns or failures which have caused significant pollution, etc).
7 Interpretation: provides detailed information about the terminology used in the Permit.
37
The Refinery’s permit application document prepared by Entec in 2006 described the controls the
Refinery had in place to prevent pollution representing the BATs for the site. As part of the improvement
programme requirements after 2006, separate documents were submitted to the Agency concerning the
introduction of new techniques to control pollution and report progress made in environmental
performance.
38 The bubble concept has been adopted as one of the BAT techniques in the refining of mineral oil and
gas sector to estimate the “total emissions of one substance released by all the stacks on-site as a single
value” (EC, 2013d, p 143). This allows individual emissions sources (e.g. FCCU or combustion plant) to
be modified as long as the limit value or the “bubble-expressed emission level” limit is not exceeded.
Chapter 2- Reviews of known theory and practice
93
Current waste management practices at the Refinery are detailed in Sub-section 2.4.4.
The requirements and progress to date on the improvement condition for oily wastes are
discussed in more detail as follows to provide the background for further discussion.
This improvement condition requires the Refinery to propose a plan and techniques for
the treatment of site-wide oil-containing wastes such as tank bottom sludge and
centrifuged cake, activated charcoal, tank bund contaminated earth, filter press cake
from the WWTP surge pond cleaning, WWTP dissolved air flotation (DAF) centrifuge
cake, biological centrifuge cake and Merox oxidation clay filter bed39
. This condition
establishes that the treatment of these materials should be performed following the
waste hierarchy shown in Figure 2.11 and taking economic viability into account.
Whilst the Refinery was owned by Chevron, in 2008 a report was submitted to the EA
with a proposed strategy to reduce the production of these wastes on-site and improve
performance in this regard (Chevron, 2008)40
. In 2010 another report was presented to
the Agency including the performance achieved on the implementation of some
techniques such as the crude oil washing system (COWS)41
(Chevron, 2010a). The
techniques and strategies in the Chevron (2008) report proposed were as follows:
• the COWS and thermal desorption processes to increase recovery of oil fractions
from the sludge;
• centrifuge treatment of tank bottom sludges with thermal pre-heating to improve
oil-solids separation;
• minimisation of oily sludge production from the WWTP by prior segregation of
bio and DAF sludge, enabling disposal of the bio sludge (after centrifuge and
filter press) into non-hazardous landfill;
• re-use or re-cycling of oil recovered from sludge into the crude unit;
• using oily sludge off-site as a secondary fuel for cement kilns after separation
on-site in a centrifuge or filter press;
• incineration of oily sludge with energy recovery;
39
For these wastes and associated units see Appendix B.
40 Chevron Limited fully owned Pembroke Refinery until 2011.
41 COWS refers to a technique that uses warmed crude oil which is spread through nozzles onto the oily
sludge to allow the re-suspension of solids and maximise the separation of hydrocarbon fractions
including waxes.
Chapter 2- Reviews of known theory and practice
94
• treatment of oily sludge through pyrolysis with production of syngas (a
feedstock for the petrochemical industry);
• on-site permanent installations for separation of oily sludge using centrifuge or
filter press followed by thermal desorption for integrated management of this
waste on-site42
;
• bioremediation to reduce hazardous properties of the sludge; and
• use of emulsion technologies to promote/increase oil-solids separation linked to
centrifuge and filter press operations.
According to the communication to the EA in 2010, the COWS technique was
implemented on-site showing significant reduction in production of oily sludge
although with high operating costs which impacted the Refinery budget. Until 31st
December 2013, no more progress on this improvement was made, suggesting that
further cost-benefit analysis and feasibility studies were required to evaluate other
techniques to treat oily sludge.
In the context of the present research, which has highlighted that oily sludge is one of
the largest wastes produced at the Refinery, this required improvement condition was
identified as an opportunity to aid the Refinery in the process of evaluating and
selecting technologies to treat oily sludge. To this end a literature review was performed
to identify the main issues in evaluating and selecting technologies to treat oily sludge
(see Section 2.6).
2.4.4 Waste management practices at Valero Refinery, Pembroke
According to Schedule 1 of the Refinery’s Environmental Permit (Table 2.8), the only
waste treatment activity permitted on-site is the disposal of ballast water in the WWTP.
All other wastes are required to be safely collected, segregated and contained on-site
and transported to off-site permitted facilities for treatment. If a technique to treat waste
on-site is to be introduced, it must be subject to a new environmental permit application.
42
Trials using thermal desorption to maximise oil recovery from oily sludge took place on-site but this
technique was questionable due to the high risk of fire and lack of appropriate controls to manage this
risk.
Chapter 2- Reviews of known theory and practice
95
2.4.4.1 Types, treatment and classification of waste
In the Refinery, waste streams are generated by different sources and during normal
operations, i.e. when business units operate at their full capacity, turnarounds (TA) and
specific maintenance operations (MO) which may require the partial or total shutdown
of the Refinery business units.
In order to explain where waste generally originates, Appendix B provides a list and a
brief description of the major units and associated waste streams, which can be liquid,
mixed (liquid-solid) or solid. Examples of liquid wastes are spent caustic, contaminated
water, refrigerants and chemicals as solvents. Contaminated soil, spent catalysts and
adsorbents, oily sludge and contaminated personal protective equipment (PPE) are
examples of mixed (liquid-solid) waste materials. Solid waste materials include
refractory, lagging and insulation, scrap metal and waste electrical and electronic
equipment.
All waste streams at the Refinery are reported according to the List of Wastes (England)
Regulations 2005 (SI 2005/895) which is derived from the European Waste Catalogue
(EWC) codes (Appendix C). These codes describe the type of operations that generate
waste, the specific sources of production and the wastes physicochemical character.
Refinery wastes treated off-site are either recycled or disposed. Disposal and recycling
(recovery) operations are registered according to Annexes I and II of Directive
2008/1/EC (EC, 2008c) (Appendix D). The lists of disposal and recovery codes aim to
provide illustrations of the way these operations are carried out in practice.
2.4.4.2 On-site management
Waste management activities on-site are carried out by a waste contractor and
coordinated by Environmental Engineering of HES Department. Appropriate facilities
across the site are provided to ensure effective management of waste, allow correct
segregation and minimise the risk of cross contamination. Waste compliance assessment
is monitored daily by the on-site environmental specialist who also constantly evaluates
new disposal routes in accordance with the EU waste hierarchy. Life cycle assessments
have also been used to analyse different approaches for the treatment of specific waste
streams, such as fluoridic caustic, and the associated impacts (Weston, 2011).
Chapter 2- Reviews of known theory and practice
96
Figure 2.16 shows a general view of the process of managing waste at the Refinery.
Figure 2.16. Overview of waste management at the Refinery
As can be seen, after waste is produced it is segregated and collected. Segregation is
ensured through the use of different labelled containers such as bins, skips, drums, bags,
intermediate bulk containers (IBCs), etc., and the collection is made by vehicles
especially designed to transport every type of container and waste. Appendix E shows
the waste collection vehicles, containers and their capacities most commonly used at the
Refinery, with the typical wastes collected and transported also included.
After collection, temporary storage of waste (if required) is carried out mainly for
economic and logistical reasons. Transport movements on/off site are reduced
significantly when their use is optimised in terms of the quantity loaded and the number
of journeys within site and to off-site treatment facilities. Waste is managed and stored
temporarily in different areas at the Refinery. These areas (see Appendix B) are:
• Asbestos Compound;
• Bundle Cleaning Area;
• C&Os Settling Basins and Mixing Ponds;
• Crushed Concrete Compound;
• Grist Blast Area;
Waste production Segregation Collection
Temporary storage
required?
Handling/temporary storage
yes
no
Disposal
Transportation (off-site)
Transportation (on-site)
Recycling
Refinery sources of waste generation
Off-site treatment facilities
Ref
iner
y o
n-s
ite
hand
ling
/sto
rage
fac
iliti
es
Chapter 2- Reviews of known theory and practice
97
• Merox Units43
;
• Recycling Facility;
• Scrap Metal Compound;
• SNAMS44
and;
• Waste Water Treatment Plant (WWTP)45
.
There are also other areas for waste storage at the Refinery not listed in Appendix B.
For example, spent catalysts (collected in special containers designed specifically for
national and international transportation) are temporarily stored in other Refinery areas
while transfrontier shipment procedures are completed. Appendix F shows the main
waste streams produced on-site, their handling and storage areas and Off-Site Treatment
Facilities.
2.4.4.3 Relevant improvements on the management of waste
Driven by legislation and the Refinery environmental policies with regard to protecting
the environment, significant improvements have been made in terms of waste
management over the last ten years. Sub-section 2.3.1 explained the most relevant
regulations governing oil refineries in the EU and pointed out how they were transposed
into UK legislation (Figure 2.9). The Refinery has progressed in many aspects indicated
by these regulations as shown in Table 2.9.
This table highlights that part of the progress made on waste management at the
Refinery results from the development and implementation of the in-house TR548
waste database. From the perspective of the researcher, TR548 is a significant
achievement as it has changed the waste culture at the Refinery, in particular by
integrating waste producers in the process of managing waste and encouraging them to
exercise waste stewardship. It has also achieved important savings for the Refinery, not
only in terms of the time devoted to control waste but also with regard to costs. For
43
Merox Units produce phenolic caustic which is normally treated at the WWTP although in some cases
it is sent off-site for incineration. For this reason they are mentioned here although they are not
considered waste handling and storage areas.
44 An area designated to store catalysts, adsorbents and bulk chemicals.
45 Oily and biological sludge is generated at the WWTP. Although some of these wastes are collected and
sent to the Refinery Recycling Facility for temporary storage, on some occasions they are kept at the
WWTP lay-by areas before disposal.
Chapter 2- Reviews of known theory and practice
98
instance, in the oil and gas industries in the United Arab Emirates a commercial solid
waste management database was adapted to log waste inventory from the generation
source up to final disposal (Elshorbagy and Alkamali, 2005). This database, which is
commercially available, can cost up to $5,000 (Scientific Software Group, 2013). The
TR548 database is an important element of the process of coordinating and managing
waste on-site. How to complete TR548 electronic forms is explained in a Pembroke
Refinery EMS secondary procedure (Valero Energy Ltd., 2012i).
Table 2.9. Progress made on waste management at the Refinery with regard to relevant
UK regulations (Source: McDonough, 2012)
UK Regulations Progress up to July 2012
Waste (England and Wales)
Regulations 2011 (SI 2011/988)
- Development and implementation of an electronic waste database (the
TR548) to provide the site with a complete “auditable history” of waste
from generation to final disposal or recycling. This database has a provision
to reflect the decision making on waste management in accordance with the
EU waste management hierarchy (Figure 2.11).
Hazardous Waste (England and
Wales) Regulations 2005 as
amended (SI 2005/894)
- Proper segregation of hazardous waste on-site to avoid mixtures;
- registration of all hazardous waste transfers off-site in consignment notes
and maintenance of records for three years;
- yearly submission to the EA of waste production figures; and
- quarterly submission to the EA of waste (ballast water) returns documents
(the only waste allowed to be treated on-site).
Transfrontier Shipment of Waste
Regulations 2007 (SI 2007/1711)
- Overseas recycling of the Hydrotreating Catalyst permitted under the Basel
Convention46
; and
- measures and controls in place to guarantee correct classification of
Hydrotreating Catalyst and safe shipment from port to port.
The List of Wastes (England)
Regulations 2005 (SI 2005/895)
- Classification of all waste on-site according to the LoW (EWC codes)
(Appendix C); and
- provisions in place to guarantee that off-site waste receiving facilities make
use of the LoW.
Environmental Permitting
(England and Wales) Regulations
2010, as amended (SI 2010/675
Schedule 10)
- WAC testing in off-site certified laboratories for all waste planned to be
sent to non-hazardous landfill.
Environmental Protection Act
1990 Part II*
- Development and implementation of a process named “Third Party Waste
Stewardship” to audit off-site treatment facilities in order to ensure they are
competent and licensed to receive, manage and treat waste.
(*) This piece of legislation was not included in Figure 2.9. It is an act to make provisions for waste management and
control of emissions into the environment “arising from certain industrial and other processes” (Legislation.gov.uk, 1990).
Part II specifically refers to the management of waste on land. One of the most relevant provisions indicates that Duty of
Care Transfer Notes should accompany all non-hazardous waste being transferred to permitted sites.
46
The Basel Convention aims to control the transboundary movements of hazardous wastes and their
disposal. This convention was adopted in 1989 by the Conference of Plenipotentiaries in Basel,
Switzerland “in response to a public outcry following the discovery, in the 1980s, in Africa and other
parts of the developing world of deposits of toxic wastes imported from abroad” (Basel Convention,
2011).
Chapter 2- Reviews of known theory and practice
99
2.4.4.4 PKB-0021-Coordinate & Manage Waste
The Refinery work process PKB-0021-Coordinate and Manage Waste details the
activities (through instructions) to manage waste from generation to disposal and
indicates who is responsible to undertake every task (Appendix G). It is fully integrated
into the Refinery EMS. Figure G-1 of Appendix G shows the version of this PKB in
force on 27th
November 2013. It is important to mention that all PKBs at the Refinery
are frequently reviewed and amended to adopt new requirements and changes in
relevant legislations. This makes the Refinery activities and processes more robust and
ensures they are aligned with the aim of continual performance improvement. PKB-
0021-Coordinate & Manage Waste is summarised below; for more details about the
responsibilities in the process, see Appendix G.
Instruction 1 covers the initial waste submission from the waste originator (waste
producer) to the environmental specialist by completing a form in the TR548 database.
If it is anticipated that the waste to be disposed has to be sent to landfill, testing against
the Waste Acceptance Criteria (WAC) is required and Instructions 2 to 10 have to be
followed. Activities on these instructions comprise the testing of the waste sample either
on-site or by a third party laboratory and the analysis of the results by the
Environmental Specialist. This information is added to the TR548 form including
Material Safety Data Sheet (MSDS) and other relevant information. The TR548 at this
point is used as an authorisation for the transfer of waste from the generation point to
the on-site storage.
Instruction 11 indicates that waste be categorised according to the LoW (EWC codes)
and disposal routes be agreed with the on-site waste contractor. It is verified at this
stage that the off-site facility is licensed to manage the specific waste being sent for
treatment. This can be checked on the “Third Party Waste Stewardship” documentation
filed at the HES Refinery Network. Instruction 12, advises if the waste is non-
hazardous, the waste contractor is required to fill out a Duty of Care Transfer Note as
indicated in the Environmental Protection Act 1990 Part II. However, if the waste is
hazardous, then the waste contractor completes a Consignment Note in accordance with
the Hazardous Waste (England and Wales) Regulations 2005 as amended (SI
2005/894).
Chapter 2- Reviews of known theory and practice
100
Instructions 13 to 20 specify all the activities from the arrival of the transport, through
collection and weighing of the waste to authorisation for the truck to leave the Refinery.
Instruction 21 covers final approval and signature of the TR548 form by the
Environmental Specialist. Instruction 22 instructs the on-site waste contractor to prepare
a monthly composite report and send it to Environmental Engineering for approval. It is
important to highlight that waste figures sent to the EA each year are those reported in
these waste contractor composite reports. Finally Instruction 23 points out that
hazardous waste returns from off-site treatment facilities are to be recorded and kept at
the Refinery for three years.
2.4.5 Gaps in the current practices
Four aspects of the current waste management practices at the Refinery are worth noting
since they could lead to opportunities for improvement. These aspects are:
1. The segregation of waste is not indicated in the PKB-0021;
2. the waste producer (originator) responsibilities in PKB-0021 end once the waste
stream is transferred to the on-site handling/storage area;
3. a continuous review and analysis of waste generated and any measures to
avoid/reduce production are not part of the process to manage waste on-site;
and
4. the selection and use of raw materials, as precursors of waste, are not addressed
in the process to manage waste on-site, i.e. systematic waste reduction at source
is not part of current practices.
Although waste segregation measures (such as the availability of different types of
containers across the site and information campaigns for correct waste segregation) are
in place at the Refinery it would be beneficial to incorporate these activities within
PKB-0021. This would make the information accessible to all personnel on-site, in
particular to term contractors who carry out activities on-site (e.g. minor or major
maintenance and equipment replacements) which generate large amounts of waste.
In terms of the waste producer responsibilities, it was identified that stewardship could
be enhanced and waste reduction promoted at the process unit level by developing and
monitoring waste key performance indicators (KPIs). These KPIs should inform the
Chapter 2- Reviews of known theory and practice
101
waste generator about the material efficiency of the unit and allow him/her to address
those aspects (e.g. procurement, process conditions, operating protocols, control
systems, etc.) which can be modified or re-adapted to reduce the generation of waste.
The continual review and analysis of waste generated is performed to identify ways to
avoid/reduce its production and minimise the use of raw and ancillary materials as the
precursors of waste. Sub-section 2.2.3 indicated that measuring performance is essential
to achieving sustainability and Sub-section 2.4.3 pointed out that reviewing and
informing the Environment Agency about measures and improvements in waste
management and the use of raw materials are mandatory conditions to operate.
In this context it was identified that a continuous waste review analysis is needed,
including raw and ancillary materials as precursors of waste, as part of the process to
manage waste. This should enable the Refinery not only to comply with the
recommendations on measuring progress towards sustainability and reporting
improvements to the Agency but also to:
• assist the facility in evaluating effectiveness of measures already in place;
• introduce corrective actions in existing procedures; and
• develop and implement new strategies to enhance the use of raw materials and
the recovery of waste with the final end of reducing environmental impacts.
Taking Figure 2.16 as the basis, Figure 2.17 highlights identified potential
improvements to the on-site management of waste.
Chapter 2- Reviews of known theory and practice
102
Figure 2.17. Overall vision of waste management at the Refinery including potential
improvements
2.5 Material flow analysis in the context of resource efficiency and waste
management
The increasing concerns about resource scarcity and the impacts that human activities
have on the environment at regional, national and international levels have led
governments, agencies, organisations and communities to focus attention on how the
use of materials can be optimised, waste production reduced and impacts to the
environment minimised47
. For instance, resource efficiency is currently part of the EU
2020 strategy (EC, 2011b) and is promoted by the Organisation for Economic
Cooperation and Development (OECD) and the United Nations Environment
Programme (UNEP) for “green growth” and green economy” (Bleischwitz, 2011).
Resource efficiency strategies underpinned by these and other organisations pose
47
These concerns were ignited by the environmental movement or “Environmentalism” which became
more popular after the 1960s. The aims of this movement were the protection of the environment by
promoting environmental stewardship, including sustainable management of resources.
Waste production Segregation Collection
Temporary storage
required?
Handling/temporary storage
yes
no
Disposal
Transportation (off-site)
Transportation (on-site)
Recycling
Enhancement s on environmental stewardship by waste producer extended responsibility
Improvements in waste segregation on-site
Waste KPIs
Review and analysis of raw materials use
and waste production
Refinery sources of waste generation
Off-site treatment facilities
Continuous improvement in waste management, environmental permit compliance and measuring progress towards sustainable development
Ref
iner
y o
n-s
ite
hand
ling
/sto
rage
fac
iliti
es
Chapter 2- Reviews of known theory and practice
103
challenges at different levels (i.e. social, economic and environmental) which in a
broader sense aim to boost not only the economic performance, competitiveness
through innovation and security of essential resources but also minimise the
interferences to the natural equilibrium of ecosystems.
The interactions between humans and ecosystems are at the core of the environmental
movement (McCormick, 1991). Hence understanding the dynamics of the relationships
between human systems and ecosystems has been the subject of numerous studies (e.g.
Allenby, 1998, Allenby 1999 and Alberti et al., 2003). In this context, different
disciplines have emerged such as industrial ecology and industrial metabolism.
Industrial Ecology seeks “to optimize the total materials cycle from virgin material to
finished material, to component, to product, to waste product, and to ultimate disposal”
(Jelinski et al., 1992). A more recent concept was provided by Professor Roland Clift on
Industrial Ecology and Sustainability who in the context of Chemical Engineering
argued:
“Chemical engineering is about managing material and energy flows and
transformations inside pipes in plants, and industrial ecology is about exactly that but
in the economy” (Clift, 2010).
Industrial Metabolism aims “to study the flow of materials and energy through human
networks in order to better understand the sources and causes of emissions, along with
the effects of the linkages in socio-technological systems” (Ayres and Simonis, 1994).
For these disciplines, assessing the flows and stocks of materials through their whole
cycle provides important insights to understand the different dynamics between process
and systems and within them the recognition of early resource depletion and further
environmental impacts.
Material flow analysis (MFA) has been widely used as a tool to quantify flows and
stocks within a system defined in space and time based on the first law of
thermodynamics on the conservation of matter, i.e. mass and/or energy can neither be
created nor destroyed by any process which involves physical transformation,
(Dahlström et al., 2004 and Huang et al., 2012). Hence MFA allows the accounting of
materials which enter, accumulate and leave a system providing insights of the
relationships between flow of resources, energy and wastes, socioeconomic systems and
Chapter 2- Reviews of known theory and practice
104
the environment from which materials are extracted and to which emissions and wastes
are discharged (Bringezu and Moriguchi, 2002; Fischer-Kowalski et al., 2011 and
Huang et al., 2012).
For resource management, this tool has been of particular interest since it enables
materials use to be controlled and industrial processes to be improved. Within this
context Graedel (2002) argued that MFA may be used to determine the amount of
materials consumed and transformed in a process, the quantity of them added to stocks,
the recycling and/or disposal rates of those which do not end up in any useful form and
make predictions of raw materials depletion times. MFA results have been used directly
and to derive composite indicators in particular in policy-oriented and sustainability
analysis (Tachibana et al., 2008).
It has been demonstrated through various case studies that MFA can also provide
transparency in environmental impact assessments and enable priorities in waste
management and decision making to be established. To differentiate the analysis of
bulked or composite materials flows (e.g. concrete, steel, plastics, etc) from individual
substances (e.g. heavy metals) the terms of materials flow analysis (MFA) and
substance flow analysis (SFA) are used respectively (Binder et al., 2009).
In the context of the present research, it has been determined that resource efficiency
and the production of waste are important issues to be addressed in the oil refining
industry where assessing flows from raw materials to waste is essential and the use of
tools such as MFA is appropriate.
Stiller (1999) in his report “Material Intensity of Advanced Composite Materials”
stresses the fact that making more efficient use of materials is an essential strategy
towards sustainable development which requires to respect the limited carrying capacity
of our planet. Clift (2011) at the third International Conference on Eco-Efficiency48
(EE3) also pointed out that “a truly low-carbon economy requires not only low carbon
48
The term Eco-efficiency was originated in 1992 by the World Business Council for Sustainable
Development (WBCSD) to define a strategy of making more sustainable the production of goods and
services. The Eco-efficiency strategy to sustainable development aimed to “produce more with less input
and little ecological impact as possible” (WBCSD, 2000).
Chapter 2- Reviews of known theory and practice
105
energy sources and more efficient energy use but also dematerialisation through
systematic use and reuse of materials”.
The following sub-sections present methodological foundations of MFA and some
applications in the context of environmental management.
2.5.1 MFA principle and methodology
MFA uses the mass balance principle which states that the mass entering a process
inputm
equals the mass leaving the same process outputm
(which include losses of the
system) plus any change in the mass stored in the process storagem
(Figure 2.18).
Figure 2.18. Conceptual representation of mass flowing through a defined system
(Source: Brunner and Rechberger, 2004, p 59)
On this case the process represents the system through which the mass is flowing. One
system can involve more than one process. Figure 2.19 suggests that accumulation of
mass will result in the process mstock if storagem
does not equal zero. Brunner and
Rechberger (2004, p 59) represented mathematically in Equation 1 the relation of the
mass flows indicated in Figure 2.19.
I Ok k
storageoutputinput mmm
.
Eq. 1
Where:
kI = number of input flows
kO = number of output flows
m = mass flow
m = mass
Chapter 2- Reviews of known theory and practice
106
The system depicted in Figure 2.19 can become more complex as the number of flows
and processes involved increase. Also the analysis can be more complex when certain
mass flows cannot be determined or quantified leading to numerical and analytical
uncertainties. In these cases, assumptions need to be made or comparisons drawn to
similar systems in order to share information between systems. The aim of the MFA,
the time and the monetary resources available will all determine to a large extent the
accuracy of the quantities of flows and stocks required for a specific analysis (Brunner
and Rechberger (2004, p 60).
Geyer et al. (2007) discussed that although MFA features have been shared over time by
different disciplines, its methodological approaches have varied widely. Figure 2.19
shows a diagram which has been employed to illustrate the main elements of a MFA
(Mattews et al., 2000; Geyer et al., 2007; Fischer-Kowalski et al., 2011; Huang et al.,
2012).
Figure 2.19. Main elements of a MFA (Source: adapted from Brunner and Rechberger,
2004, p 38 and Azapagic et al., 2004, p 285)
As shown, a MFA is comprised of:
• material flows which enter and leave a defined system;
• stocks of these materials if they are stored or accumulated in this system; and
• the economic process through which these materials flow.
In the figure materials as imports (if they are obtained from different countries) or
feedstocks (if they are obtained from local environments) enter a system where they are
used, consumed, transformed and/or stored (or accumulated) in processes and/or sub-
Stock/accumulation
Flow
rate
Rate of changeFlow
rateFlow rate
Materials:
Imports/FeedstocksMaterials:
Exports/Products
Flow rate
Materials:
Emissions
Materials:
Emissions
Flow rate
System: Main process and sub-processes
System boundary
Chapter 2- Reviews of known theory and practice
107
processes. After use, consumption, transformation and/or accumulation another flow of
materials leave the same system as exports (if they are sent overseas), products (if they
are for domestic consumption), emissions and/or wastes. A more detailed representation
of the main elements of a MFA was presented by Mattews et al. (2000) and defined as
“The Materials Cycle”.
Huang et al. (2012) presented a classification framework for MFA (and also for SFA)
with regard to material type, analytical scope, chemical ingredient and research
objectives. In terms of analytical scope they categorised MFA, according to the OECD
guide on measuring material flows and resource productivity (OECD, 2008a), as:
• Business level MFA for monitoring material flows within the boundary limits of
companies, firms and/or plants;
• Input-output MFA for monitoring material flows to, from and through specific
economic activities; and
• Economy-wide MFA for monitoring all material flows entering or leaving the
boundary of national economies.
According to Bringezu et al. (2002) and Ley (2003), once the MFA objectives and
scope are defined five general steps follow:
1. System definition;
2. Identification of relevant processes, flows and stocks;
3. Compilation of materials flow diagrams;
4. Estimation of mass flows;
5. Interpretation of results and conclusions.
2.5.1.1 System definition
The system(s) (i.e. process, companies, sectors, regions, etc) is defined in terms of their
physical boundaries which include the mass flows and stocks to be investigated. Since
these flows and stocks may vary over time, a definition of the time frame is required.
The time frame is commonly established according to the scope and objectives of the
MFA study (Ley, 2003).
Chapter 2- Reviews of known theory and practice
108
2.5.1.2 Identification of relevant process, flows and stocks
The objectives and complexity of the study to a large extent will determine the relevant
processes, flows and stocks to be studied within a defined system. Information about
flows and stocks (specifically their mass flows) can be obtained directly from different
sources (e.g. companies’ reports, national statistics, regional databases, etc). When the
information is not readily available it is common to use other data sources (e.g. known
flows or stocks from other systems) to infer or calculate the flows under study.
2.5.1.3 Compilation of material flow diagrams
Different types of diagrams (e.g. block flow and Sankey diagrams) are used for the
graphical representation of the material flow analysis results. Graphics are of particular
help when it comes to present results in a concise and effective way. In the particular
case of MFA, relevant findings can be easily visualised in terms of quantities of flows
and stocks and points of materials accumulation and/or depletion. Graphic
representations also allow pathways to be drawn from the materials sources to their
sinks and the qualitative behaviour of the system to be elucidated.
2.5.1.4 Estimation of mass flows
Geyer et al. (2007) argued that as “material flows are the link between stocks and
processes” the change in mass units of the stock of a specific material (i) over a defined
period of time (k) (i.e. the accounting period) can be calculated as:
∆Stockik = productionik –consumptionik + importsik - exportsik49
This equation is particularly useful for the estimation of stocks in systems where there
are no transformation processes (i.e. the terms of production and consumption equal
zero) and stocks represent the assets of a plant to be sold, transferred or
decommissioned at the end of its useful life (e.g. steel in vessels and equipment on an
oil refinery).
49
Here imports and exports can also represent feedstocks and products or simply the flow of materials
entering and leaving the system respectively.
Chapter 2- Reviews of known theory and practice
109
2.5.1.5 Interpretation of results and conclusions
The results of a MFA are quantities of flows and stocks generally expressed in mass
units (i.e. kg or tonnes). Depending on the objectives and the scope of the MFA, it is
possible that further calculations need to be performed aiming to more comprehensively
evaluate the system under study. In this sense, interpretation of MFA results will largely
be determined by the aims of the study.
2.5.2 MFA applications
MFA results have been used independently or coupled with other methodologies in
different fields and for distinct purposes. For instance the development and use of
indicators derived from MFA results have been shared practices in different sectors
aiming to provide more meaningful information “about the state of a system” (Brunner
and Rechberger, 2004, p 135). Bringezu et al. (2003) developed indicators based on
MFA to monitor and assess the metabolic performance of economies, specifically in
terms of resource efficiency50
. The OECD also developed sets of indicators obtained
from MFA to assess the environmental performance of its member countries and to
assist them in policy and decision making (OECD, 2008). MFA is particularly relevant
for the development of this indicator as the analysis of all hidden material flows - all
those extracted/used that do not end in any useful form (i.e. water, air and soil) - is
required.
MFA results have also been used as an input of different assessment methodologies. For
instance LCA uses MFA results to determine environmental loads/impacts of products
and/or services from cradle to grave (Rincón et al., 2013). Huang et al. (2012)
investigated the relevance of MFA in sustainable development, specifically as means to
calculate sustainable development assessment indicators.
Table 2.10 shows most common study areas of MFA and the usefulness of its results.
50
Within the indicators developed can be found Total Material Requirement (TMR), Total Material
Consumption (TMC) and Net Addition to Stock (NAS).
Chapter 2- Reviews of known theory and practice
110
Table 2.10. MFA study areas and applications
Study area Results applications
Resource conservation
• To control pathways for materials use (from raw
inputs to pollutant releases;
• To create industrial closed-loop systems 51
;
• To optimise production/consumption networks;
• To identify points of accumulation/depletion of
materials;
• To identify best practices on resource
conservation.
Environmental management
• To elaborate pollution monitoring and control
programs;
• To detect early depletion of raw materials and
establish mitigation measures;
• To support studies such as Environmental Impact
Assessments;
• To assist in environmental policy and decision
making;
• To design plans and strategies for environmental
management and regulatory framework
compliance.
Waste Management
• To assess performance on the generation,
collection, transportation and treatment of waste
over time;
• To evaluate current treatment practices and
identify better practices;
• To assist in waste management technology
selection and decision making;
• To establish strategies for site remediation;
• To identify waste streams and their precursors;
• To manage recycling/disposal and treatment
facilities.
Table 2.11 presents three selected case studies which made use of SFA/MFA
methodologies with particular relevance to resource and environmental management.
They are described in terms of the study area, the system definition and the purpose of
the study. Key findings, conclusions and limitations identified are also presented.
51
According to Clift (2011) a closed-loop system emphasises the use of remanufacturing practices in
industrial environments rather than primary manufacturing.
Chapter 2- Reviews of known theory and practice
111
Table 2.11. Three examples of MFA case studies
Study area System Purpose Key findings and conclusions Limitations Reference
Environmental
management
The system was defined in a Swiss
region (Bunz Valley) of 66 km2
and 28,000 inhabitants. The study
took place in 1990.
To develop a
methodology to assess
and analyse the flows and
stocks of lead through
Bunz Valley in a
comprehensive and
holistic way.
The methodology framework developed to assess and analyse the flows and stocks of lead made use
of SFA principles. The analysis of results served to “early recognise potential environmental
hazards” due to the increase of lead accumulation in the soil and subsequent contamination of water
courses within a period of 100 years. SFA results estimated that the build-up of lead could be seven
times higher if practices (use and disposal) continue as they were. It was also determined that landfill
was the main stock of lead in the region indicating that ensuring safe landfilling -as an environmental
measure- of lead contained-materials was a priority to avoid future leaching and contamination. The
forecasting capabilities of SFA was presented in the analysis as an attractive feature in contrast to
other tools such as soil monitoring programs which were determined to be more expensive and time
consuming.
Although SFA results foresee potential hazards, serving
to establishing priorities for environmental measures
and represented a useful tool for environmental
monitoring, it required the input of information
provided by other analysis tools to complete the
information of some unknown flows (e.g. lead content
in sewage sludge and in municipal waste incinerator
residues). In the same way, to determine the long-term
toxic effects on human health due to lead contamination
in soils and water required further expert analysis which
cannot be provided solely by SFA. In any case the
analysis performed making use of SFA principles
helped to identify the problem and to formulate relevant
questions to be answered in future with regard to the
use, stock and disposal of this pollutant but not to
determine impacts in the long-term.
Brunner and Rechberger
(2004, pp 168-184)
Resource and
environmental
management
The system was defined in Europe
and analysed eight industrial
sectors: industrial catalysts,
autocatalysts (catalytic systems
used in the automotive industry),
electronics, glass industry, dental
metals, jewellery and other
industrial applications over 1990-
2030. The use of Platinum Group
Metals (PGMs) – in particular
platinum, palladium and rhodium -
was studied in this region and the
environmental impacts were
analysed involving their regional
(Europe) and overseas (i.e. South
Africa, Russia, North America)
production.
The overall goal of the
study was to develop a
MFA methodology to
determine the
environmental impacts
on the production of
PGMs used in Europe.
Mitigation measures
associated with their use
were also investigated.
PGMs used in Europe are generated at “primary production process” (i.e. when the material is
extracted from the ore and then refined) - which takes place overseas - or at “secondary (regional)
production process” (i.e. when the material is recovered from recycled materials).
The MFA methodology allowed the estimation of three environmental “pressures”: CO2 and SO2
emissions and the Total Material Requirement52 in the two production process. The most relevant
pressure was determined and quantified (e.g. the SO2 emissions in the PGM primary production). This
showed that environmental problem shifting was occurring and suggested that promoting/enhancing
secondary production of PGMs was a priority.
On the other hand it was identified that the autocatalyst sector consumed more than 60% of the total
European primary PGM, indicating that especial attention needed to be put into the use of these
resources in the sector and highlighting the relevance of technology development in the area.
This case study used MFA to provide important insights
in terms of resource use, in particular when raw
materials are imported from overseas and problems of
environmental burden shifting occur. On the other hand
it shows that high consumption in a particular sector
can drive industries to focus attention on introducing
changes in current practices and/or finding alternatives
to substitute raw materials. Due to the broad scope of
the study, which involved industries from different
sectors and geographical areas, the use of different
sources of information and data proxies was required,
which in some cases reduced considerably the accuracy
of the results (e.g. data obtained from primary
production of PGMs in Russia). This is probably one of
the major limitations of MFA.
Saurat, 2006
Environmental
management
The system involved the
production of electricity in a coal-
fired power plant. It included the
processes of coal mining, power
generation, pollution control and
ash landfilling. The study belonged
to a project developed by the
Austrian Environmental Agency in
1995.
To investigate the
potential impacts of
electricity production
from coal on a regional
environment in Austria.
The MFA was used as a
support tool for an EIA
and for the preparation of
the Environmental
Impact Statement (EIS).
This case study made use of MFA. Through the MFA the following aspects were determined:
• the depletion time of the coal mine (̴ ten years) affecting mainly the landscape due to the
excessive extraction of material from the earth’s crust;
• the material consumed in the greatest quantity, i.e. air used for cooling in the power
generation process;
• the high concentration of mercury, arsenic, sulphur and carbon in the combustion ash, with
landfill the major reservoir of these elements;
• the need to develop strategies to avoid possible leaching of these metals through soils and
further water pollution;
• in the long term, the requirement to properly maintain the landfill site infrastructure and
minimise risks of pollution specially during the decommissioning of the plant;
• CO2 emissions represented half of the region’s CO2 emissions; and
• emissions controls in place reduced considerable emissions of SO2 and NOx.
This study enabled determination of flows of materials with the most environmental impacts from the
extraction, consumption, emissions and waste production perspectives. It also enabled the depletion
time of the principal feedstock, i.e. coal, to be estimated, suggesting - to a large extent -the time that
the plant should be decommissioned or revamped to process a different feedstock. It also helped to
detect points of most concern in terms of pollution, allowing early planning and preparation of action-
driven waste management strategies.
This particular case study highlights the use and value
of MFA in EIA. Although coupling with other
assessment tools will be required to further estimate, for
instance, impacts on human health and of changing
feedstocks, etc. This case study is a very good example
of the analysis of a system from the consumption/use of
a raw material (coal) through to the production of waste
(ash landfill). It also provided insights about key points
with major environmental impacts (i.e. earth crust
during the extraction of coal and the disposal of waste
into landfill).
Brunner and Rechberger
(2004, pp 200-215)
52
According to Bringezu (2003) Total Material Requirement (TMR) “is the total mass extracted from the nature to support human activities”.
Chapter 2- Reviews of known theory and practice
112
2.5.3 Gaps in the current knowledge
MFA is a well-established and widely used tool covering different areas from materials
extraction, use and consumption to emissions and disposal of waste. This review has
confirmed the versatility of the tool in particular for environmental management, i.e.
resource efficiency and waste management. Although it has some limitations since it
depends on data accuracy and availability, it has the potential to foresee environmental
impacts and burden shifting to assist in the development of environmental monitoring
programs and the detection of points where value is lost and can be recovered and to
support decisions concerning materials procurement and waste management.
Having explored the potential benefits of MFA, it was identified that in the context of
this thesis, the tool may be of great help to assess performance in raw materials and
waste management, in the planning of measures to improve environmental performance
and in the implementation of environmental monitoring programs in the oil refining
industry. Since similar use of MFA in the oil refining industry was not discovered in
this review, this thesis (specifically in Section 3.3), proposes a methodology for the
assessment of materials flow from use/consumption to the generation of waste (which in
Section 4.5, is applied to a refinery turnaround event).
2.6 Oily sludge production at the oil refining industry
2.6.1 General aspects
A considerable amount of oily sludge can be produced as a result of oil refining
activities (Yan et al., 2012). Historically, sludges have been managed to recover
hydrocarbons and minimize the risk to human health and the environment (Abrishamian
et al., 1992). The production of oily sludge is mainly influenced by the type of crude oil
processed, the refinery capacity, its configuration and the nature of chemicals used in
the refining process (Hu et al., 2013). It has been estimated that the production of sludge
before treatment can vary between 0.01 - 2 kg/t of crude oil processed (EC, 2003a).
Annual oily sludge production in China’s refinery industry was estimated as 1 Mt in
2011 (Liu et al., 2011). A survey carried out on 89 European refineries indicated that
the total generation reached 0.45 Mt in 1993 (EC, 2013). In the US, the production in
Chapter 2- Reviews of known theory and practice
113
1991 was estimated at 225 kt (EPA, 1991) and in India, the quantity generated in the
sector was 28 kt in 2009 (Joseph and Joseph, 2009). Each year, Petroleum Development
Oman (PDO) generates approximately 18 kt of sludge, 53 kt of petroleum-contaminated
soil and 1 kt of mud cuttings (Taha et al., 2010).
Tank bottom cleaning, waste water treatment, crude oil desalting, general equipment
washings, oil spills and process units drains are the most common sources of oily sludge
(Da Silva et al., 2012). Due to its different sources, oily sludge composition can vary
significantly. Typical compositions reported by Mazlova and Meshcheryakov (1999)
are on average 10-56% w/w petroleum hydrocarbons (PHCs), 30-85% water, 13-46%
particulates (i.e. sand, clay, silt, etc.) and traces of heavy metals (i.e. zinc, lead, copper,
nickel and chromium). As its major components are dangerous substances which can
severely affect the human health and the environment (Mandal et al., 2011; Leonard and
Stegemann, 2010; Speight and Arjoon, 2012; Ramachandran, 2010) oily sludge has
been classified as hazardous waste in many countries (EC, 2000; Chang et al., 2000).
The negative effects that oily sludge has on the environment are related to the
contamination of soils, watercourses and air (Cai et al., 2007; Almutairi et al., 2008).
Nutrients deficit and reduced hygroscopic moisture and water retention capacity can be
created when pores of the receiving soil are blocked by heavy components of oily
sludge - in particular the polycyclic aromatic hydrocarbons (PAHs) - leading to limited
germination and growth of plants (Essien and John, 2010). Additionally PAHs and
heavy metals can migrate through the soil and contaminate groundwater (Li et al.,
2011). It has been determined that PAHs have carcinogenic effects to humans and to
other ecological receptors (Robertson et al., 2007). If oily sludge is stored permanently
in pits or lagoons, there is also a risk of atmospheric pollution due to the release of
volatile organic compounds (VOCs) present in the sludge. Hence there is a need to
implement strategies to manage oily sludge at all of its sources. Da Silva et al. (2012)
proposed a general strategy to follow: to reduce the sludge at the source, to maximise its
reuse/recycling and to perform an effective treatment.
2.6.2 Treatment methods: overview
Oily sludge has several uses, for instance, in the preparation of fuel briquettes, in
drilling operations and as a component of ceramic tiles (Ramaswamy et al., 2007;
Chapter 2- Reviews of known theory and practice
114
Pinheiro and Holanda, 2013). Sludge containing 10% of oil merits treatment for oil
recovery from an economic perspective (Gosh et al., 2000).
According to API (1983), the primary environmental consideration in managing oily
sludge should be maximising hydrocarbon recovery not only for economic reasons but
also because reclaiming PHCs from the sludge can result in up to 70% reduction in its
final volume. Traditionally, oily sludge was disposed into landfills without any
treatment but due to strict legislations (EC, 1999) and high imposed operating costs of
this method (UK Government, 2013), more cost-effective and environmentally sound
techniques have been developed and implemented.
Currently there is no a single preferred method for the treatment of oily sludge due to its
numerous sources, quantity and types (Jing et al., 2011). Treatment methods can be
generally classified as oil recovery (or pre-treatment) and disposal as seen in Figure
2.20.
Figure 2.20. Overview of oily sludge treatment methods (Source: Hu et al., 2013)
As seen in the figure, residuals produced in oil recovery processes need further disposal
treatment. This means that a combination of techniques is normally required when
managing oily sludge. Oil recovery methods exhibit certain common characteristics.
They are generally performed on-site and fully finished - on average - in less than two
days. This provides a competitive advantage as long periods of tank servicing can
represent significant economic losses to a refinery (ORECO, 2002).
Chapter 2- Reviews of known theory and practice
115
2.6.2.1 Oily sludge: oil recovery techniques and disposal methods
Hu et al. (2013) summarised the principal features of oil recovery techniques currently
available. In overall terms they highlighted that these technologies could cost between
100 and 200 US$/m3 of oily sludge. They also pointed out that solvent extraction,
centrifugation, surfactant enhanced oil recovery (EOR), pyrolysis and microwave
irradiation were oil recovery methods tested at a field scale and freeze/thaw,
electrokinetic, ultrasonic irradiation and froth flotation were only demonstrated at
laboratory scale. Finally they concluded that the composition of oily sludge was a key
factor when determining the most suitable method of treatment. Table 2.12 presents
some of the features of these technologies and examples of industrial applications are
referenced.
Disposal techniques can be employed to treat the residuals obtained from oil recovery or
oily sludge without any previous treatment. The disposal techniques most commonly
used are incineration, stabilization/solidification, oxidation and bioremediation (i.e. land
and bio-slurry treatment and biopile/composting). Bioremediation methods exhibit
efficiencies between 75-90% and the others higher than 90%. In contrast to the oil
recovery treatment methods, some disposal techniques require considerably more time.
For instance biopile/composting can take more than six months to successfully degrade
the organic matter of the sludge (ExxonMobil, 2013b).
Table 2.13 summarises the main features of these techniques.
Chapter 2- Reviews of known theory and practice
116
Table 2.12. Main features of oily sludge treatment methods: oil recovery
Method
Efficiency
(% of oil
recovered)
By-products Main features References of industrial
applications
Solvent extraction 50-90 VOCs, sludge slurry*
Widely tested at field scale, requires the use of large amounts of solvents (e.g. 4:1 solvent to
sludge ratio), reports low efficiency when treating large quantity of sludge (Zubaidy and
Abouelnasr, 2010).
Poche, Derby and Wagner, 1991
Centrifugation 50-75
Waste water,
unrecoverable sludge
slurry*
Mature technology, economically viable for the treatment of large amounts of sludge. In some
cases addition of chemicals such as coagulants and demulsifying agents are required (Nahmad,
2012).
Schlumberger, 2007; Ondeo
Water and Surface Active
Solutions, 2013; Veolia
Environmental Services, 2013
Surfactant EOR 75-90
Waste water,
unrecoverable sludge
slurry*
Able to treat large volume of sludge, additional environmental concerns emerge due to the
synthetic surfactants toxicity but the use of bio-surfactants have made the process more
environmentally acceptable (Rashmi and Deka, 2013).
Schlumberger, 2013
Freeze/thaw 50-75
Waste water,
unrecoverable sludge
slurry*
Suitable for places with cold weather, high operational costs, improves sludge dewatering
characteristics (Jean, et al., 1999), it was not evidenced any commercial application. NA
Pyrolysis 50-90 VOCs and chars
Fast and efficient, liquid and/or gas obtained as main products may have higher heating value than
the sludge and can be upgraded, large treatment capacity, energy intensive, able to treat sludge
contaminated with heavy metals (i.e. mercury and cadmium) which could be safely enclosed in the
solid char, lower sulphur and nitrogen oxides emissions in contrast to incineration (Karayildirim et
al., 2006).
Splainex, 2013
Microwave
irradiation >90
VOCs, waste water,
unrecoverable sludge
slurry*
High heating efficiencies, able to convert heavy hydrocarbons into lighter ones, limited industrial-
scale applications, unable to treat sludge with high content of heavy metals, in some occasions it is
required the use of demulsifiers to further reduce the amount of water in the oil recovered (Tan et
al., 2007; Lam and Chase, 2012; Fang et al., 1988), it was not evidenced any commercial
application.
NA
Electrokinetic 50-75 Waste water and sludge
slurry*
Low treatment capacity, in some occasions requires the use of surfactants which may add the
problem of effluent treatment (Yang et al., 2005), not proven at field scale. NA
Ultrasonic irradiation 50-90 Waste water and
unrecoverable solids*
Reduced capacity to treat oily sludge, not secondary source of pollution, addition of chemicals (i.e.
surfactants) is not required (Zhou, 2011). NA
Froth flotation 50-75 Waste water
Large amount of waste water is generated, normally limited to oily sludge with low viscosity, after
water is separated the oil-solids mixture needs to be purified and some moisture may be still found
in the oil recovered (Ramaswamy, 2007; Mishra, 1986).
NA
(*) need further treatment
Chapter 2- Reviews of known theory and practice
117
Table 2.13. Main features of oily sludge disposal methods
Method By-products Main features
References of
industrial
applications
Incineration
Air emissions (i.e. CO2, SOx and NOx),
ash residue, scrubber water and
scrubber sludge.
Waste generated after incineration is significantly reduced as a total combustion of sludge can be achieved in
the process, limited capacity to process oily sludge with high moisture content, high capital and operating
costs, field tested and commercially proven (Oppelt, 1987; Sankaran et al., 1998).
Veolia Water,
2014
Solubilization
/solidification
Solidified matter (i.e. oily sludge
immobilised in binder mixtures)
permanently stored on land
Inorganic materials in the sludge (i.e. heavy metals) can be efficiently encapsulated in the binder mixtures
(e.g. cement, quarry fines, lime, activated carbon, etc.) minimising the risk of leachability (Taha et al.,
2010), not very effective to immobilise organic compounds as PAHs (Conner and Hoeffner, 1998), large
amount of waste produced.
NA
Oxidation
Wet/semi-solid sludge with less
hazardous properties (i.e. significantly
reduced amount of PAHs and PHCs).
The aim of this technique is to oxidise organic compounds present in the oily sludge to produce CO2 and
water and/or non-hazardous inorganic salts. There are different oxidising methods including chemical and
photocatalytic oxidations and ultrasonic irradiation. When treating large amount of oily sludge important
quantity of chemical reagents (oxidising agents) is required. Normally this technique is considered as a pre-
treatment stage of oily sludge to reduce its hazardous character before being disposed onto land or sent to
incineration (Jing et al., 2012).
NA
Landfarming
Emissions of VOCs, leachate which
may contain PHCs phenols and heavy
metals.
Widely applied in the 1980’s and 1990’s but at present some landfarming licenses have been derogated. It is
strongly influenced by weather conditions which can reduce its effectiveness considerably. It requires long
periods (>12 months) to degrade more than 80% of PHCs contained in the sludge. Although it involves low
capital costs and is simple to operate large areas of land are required for this technique.
Valero Energy
Ltd., 2012j
Landfill Emissions of VOCs
Widely used in USA, UK, Canada and Germany albeit its use is currently controlled and limited due to the
high risk of leachability of hazardous substances. It is one of the less recommended methods to dispose oily
sludge.
Augean Land
Resources, 2014
Biopile
composting
Fugitive emissions of VOCs if not
controlled properly
This technique has been successfully proven in a variety of places with different weather conditions. It
requires large land areas if treatment capacities, environmentally friendly as VOCs emissions can be
controlled by auxiliary units, easy to design and to implement (Khan, et al., 2004), in some cases the use of a
mixed bacterial culture is required to enhance performance (Ball et al., 2012)
ExxonMobil,
2013b
Bioslurry Fugitive emissions of VOCs if not
controlled properly, CO2
This technique is also known as bioreactor technology. Addition of water is required (i.e. 5-50% wt/v). It has
been demonstrated at large scale with successful results (i.e. PHCs in sludge were reduced from 20,000 ppm
to less than 100 ppm in two weeks of treatment) (Maga et al., 2003). It is rapid and effective in contrast to
the other bioremediation methods, no large land areas are required, post-dewatering of the treated sludge is
needed (Castaldi, 2003).
Ward and Singh,
2003
Chapter 2- Reviews of known theory and practice
118
2.6.3 Tools available for technology selection: identified opportunities
The previous sub-section reported that the treatment of oily sludge has been studied
widely. The variety of techniques, advantages and limitations and the status of
development suggest that there is still room for performing more studies aiming to
enhance efficiency, improve environmental performance and reduce costs. It was also
seen that the choice of a specific technique is largely determined by a variety of factors
such as sludge quantity, physicochemical properties, legal and environmental
considerations, operational costs and time constraints (Kriipsalu, et al., 2008; Taiwo and
Otolorin, 2009). In this sense Alshammari et al. (2008), Da Silva et al. (2012) and Hu et
al. (2013) argue that the selection of the best suitable treatment should address different
criteria and the use of tools such as multi-objective analysis (a.k.a. multi-criteria
decision analysis) may be of great help to assess the most suitable and cost-effective
technology. This tool is introduced as follows.
2.6.3.1 Multi-criteria decision analysis (MCDA) tools
According to Triantaphyllou et al. (1998), multi-criteria decision-making “plays a
critical role in many real life problems” in particular when it comes to evaluating a
variety of alternatives which are conflicting to each other. Multi-criteria analysis tools
have been developed and used to assist in decision-making processes which require the
consideration of:
• multiple objectives (e.g. improve both the environmental performance and
increase the economic profits of a system);
• different stakeholders preferences and viewpoints (e.g. those arising from
communities, business, local governments and other organisations);
• trade-offs that should exist when alternatives are conflicting; and
• “the management of uncertainties of diverse nature” (Basson, 2004 and
Minciardi et al., 2007).
Basson (2004) and Alshammari et al. (2008) are examples of relevant studies performed
in the area of MCDA.
Basson (2004) studied the relevance of MCDA approaches into assisting complex
“environmental” decisions in the private sector. The work demonstrated that MCDA
Chapter 2- Reviews of known theory and practice
119
principles can aid in company decision processes (involving engineers and technical
specialists), in particular for those activities which interact with the social and
biophysical environment.
Alshammari et al. (2008) applied a multi-objective optimisation model based on the
goal programming approach for the treatment and disposal of solid waste generated by
Kuwaiti oil and petrochemical industries. The results revealed that the model facilitated
the choice of the most suitable treatment processes with their capacities and appropriate
routing of waste streams with regard to the most cost-effective management of solid
industrial waste.
2.6.3.2 Identified opportunities in the treatment of oily sludge
It has been demonstrated that managing oily sludge represents an important
sustainability issue for the oil refining sector and the review has revealed that there are
still developments to be made in the selection/assessment of technologies to treat oily
sludge more sustainably. On the other hand, the specific requirement of the
environmental permit of Valero Refinery, Pembroke, in terms of managing oily-
contained wastes also presents a challenge and represents an opportunity to develop and
test methodologies to select sustainable technology solutions.
This review has provided background about the main aspects to consider when
analysing the treatment of oily sludge and has shown the potential for the use of MCDA
in the technology selection process. However, a more comprehensive review will need
to be carried out in future.
2.7 Findings and concluding remarks
The present chapter has provided a review of general theory, legislation and practice for
improved sustainability in manufacturing facilities and in particular in the UK oil
refining industry. The management of waste was also analysed in the context of a UK
oil refinery (Valero Refinery, Pembroke) and current and possible new technologies for
the treatment of oily sludge were studied. This review, analysis and study support
objectives 1, 2 and 5 of this thesis. Specific objectives 3 and 4 will be covered in
Chapters 3 and 4. The following sub-sections summarise specific findings and
Chapter 2- Reviews of known theory and practice
120
concluding remarks of the review of know theory and practice carried out in this
Chapter.
2.7.1 Sustainable development in manufacturing facilities in the EU and UK
Specific findings and concluding remarks with regard to sustainable development in
manufacturing facilities in the EU and UK (Objective 1) are:
• Systems thinking is essential to analyse/assess the complex and interdependent
interactions between production activities and the environment;
• LCA, EIA and CSR are tools which strive for sustainability and are widely used
in the industrial sector; and
• Sustainability is planned to be achieved in the EU and in the UK through a well-
defined strategy which includes, key priorities areas, schemes, policies, stringent
legislation and performance indicators.
2.7.2 Regulatory frameworks governing EU/UK oil refining facilities
The most relevant findings and conclusions of the review of legislation governing the
EU and UK oil refining operations and concerning the environment (Objective 1) are:
• EU laws comprise regulations, directives, decisions, recommendations and
opinions which have to be adopted by the EU member states;
• In order to grant/keep permission to operate, UK oil refineries are required to
comply with EU directives IED, WFD, LoW, Regulation on Shipments of Waste
and the Landfill Directive which have been transposed into domestic legislation;
• The IED requires facilities to operate under an integrated approach principle
which means the management of all environmental impacts holistically requiring
the uptake of life cycle thinking;
• The WFD indicates that within the waste management hierarchy, prevention is
the preferred option whereas waste disposal into landfill is the last resource;
• The use of life cycle thinking is also pointed out by the WFD when it comes to
justify the departure of some waste streams from the waste hierarchy;
• Classification of waste, as indicated by the LoW, is a priority for the effective
control of waste and improve performance through environmental stewardship;
and
Chapter 2- Reviews of known theory and practice
121
• Waste sent to landfill should comply with waste acceptance criteria to certify
that the materials can be disposed into non-hazardous landfill, otherwise special
engineered landfills (i.e. areas designated for hazardous waste) should be used.
2.7.3 Environmental management in the oil refining industry
From the review of environmental management in the oil refining industry carried out
through the lenses of Valero Refinery, Pembroke (Objective 2), it can be highlighted
that:
• The EA and NRW are the competent authorities in England and Wales which
regulate, from an environmental perspective, the operation of oil refineries of
these areas;
• In order to operate, England and Wales oil refineries are required to implement
an EMS and keep/maintain an environmental permit;
• ISO 14001 was the standard used by the Refinery to guide the EMS
implementation process;
• Integrated approach, continuous improvement and pollution prevention are at
the core of the Refinery’s EMS;
• The EMS of the Refinery comprises an environmental policy, procedures, work
processes and other documents which provide a framework for setting
environmental objectives and targets, detail how work should be carried out to
manage the environment, specify the roles and responsibilities of the different
personnel involved in the management of the environment and inform about the
areas of the Refinery, their environmental impacts, abatement techniques (i.e.
best practices) in place to assure compliance;
• Although the Refinery’s Policy Statement points out its overall core objectives
for a good environmental performance and indicates how they will be achieved,
specific targets are not detailed (e.g. the quantity of waste to be reduced, how it
will be achieved and the timeframe);
• By the end of 2012 the Refinery reported in the Impact Register (a document of
the EMS) a total of 148 environmental impacts, being the ancillary services the
activities which generated the highest number of impacts;
• Although all of the Refinery environmental impacts were well identified, there
was no indication of the impact with the greatest environmental effect;
Chapter 2- Reviews of known theory and practice
122
• The Environmental Permit of the Refinery is comprised of conditions and
schedules which indicate what the operators should do to protect the
environment; and
• With regard to the production and treatment of wastes, Schedule 1 of the
Refinery Environmental Permit only specifies one improvement condition
related to the management of waste, specifically oily sludge from different
sources.
The last point mentioned above motivated this thesis to propose a methodology to aid
the Refinery in determining technology solutions for the treatment of oily sludge
(Objective 5).
2.7.4 Waste management practices in Valero Refinery, Pembroke
Findings, conclusions and recommendations with regard to waste management practices
at the Refinery (Objective 2) are listed as follows:
• All waste streams are classified according to the LoW and recycled or disposed
as indicated in the EU directive concerning integrated pollution prevention and
control;
• Waste is managed on-site is carried out by a waste contractor and coordinated by
HES department;
• The Refinery has different facilities which allow the safe management of waste
from the point where it is produced to its transportation for off-site
recycling/disposal;
• Life cycle approaches have been taken into consideration for the treatment of
specific waste streams;
• Over the last 10 years significant improvements has been made in terms of waste
management, in particular the development of a waste database which integrates
the waste producers to the process of managing waste;
• A work process of the EMS informs about how to carry out the activities and
establishes the responsibilities of managing waste; and
• A procedure for the segregation of waste and methodologies for reviewing and
analysing raw materials use and waste production including the development of
Chapter 2- Reviews of known theory and practice
123
waste KPIs, were identified as opportunities of improvement to be integrated
into the waste management practices of the Refinery.
Proposed methodologies to review the waste generated at the Refinery and analyse raw
materials use as precursors of waste (i.e. identified opportunities of improvement of
current waste management practices as indicated above) are presented in Sections 3.2
and 3.3. These methodologies are later applied in Sub-sections 4.2-4.6 for fully
achievement of specific Objectives 3 and 4.
2.7.5 Material Flow Analysis for resource efficiency and waste management
The review of general theory of MFA presented in Section 2.5 provided the basis for the
development of a methodology to analyse the flow of raw materials to waste in the
Refinery (Objective 4). Main findings and conclusions of this review are:
• MFA allows the quantification of flows and stocks of materials through their
whole cycle, within a system defined in space and time, which provide
important insights about resource depletion and further environmental impacts;
• EIA, LCA and decision making in waste management are activities where MFA
has been of relevance by providing transparency and enabling prioritization; and
• The use of MFA to analyse the use of raw materials and waste production in an
oil refinery is appropriate and represents an opportunity of improvement to be
adopted as environmental management practice;
2.7.6 Review of current and new technologies for the treatment of oily sludge
generated at the oil refining industry
Objective 5 of this thesis was achieved by the study of current and possible new
technologies for treatment of wastes, specifically oily sludge from an UK oil refinery.
From this study can be concluded that:
• The production of oily sludge is an important environmental problem of oil
refineries worldwide;
• Severe environmental impacts and consequences to human health can occur if
oily sludge contamination is not prevented/minimised;
• Value can be recovered by oil recovery, recycling and/or reusing oily sludge;
Chapter 2- Reviews of known theory and practice
124
• Technologies for the treatment of oily sludge are classified depending on their
purpose, i.e. oil recovery or disposal;
• The composition of oily sludge, quantity, costs and efficiency of the treatment
technology determine to a large extent the type of treatment to be selected;
• MCDA can be potentially used as a decision making tool to select technologies
for the treatment of oily sludge.
Chapter 3- Methodology
125
3 METHODOLOGY
3.1 Introduction
As mentioned in Section 2.7, Objectives 1, 2 and 5 have been achieved. In order to
partially achieve Objectives 3 and 4, this chapter proposes methodologies for reviewing
waste generated in the Refinery (i.e. identification, classification and quantification of
the amount and treatment costs of waste produced) and assessing performance of raw
materials use and waste management respectively. These methodologies are later
applied in Chapter 4 for fully achievement of these two objectives. A methodology to
aid the Refinery in determining technological solutions for the treatment of oily sludge
is also proposed in this chapter as an improvement condition of its Environmental
Permit identified in Sub-section 2.4.3 and mentioned in Sub-section 2.7.3.
The Chapter comprises four sections. Section 3.1 the introduction. Section 3.2 proposes
a methodology to review the waste generated in the Refinery over three different
periods of time, i.e. short (monthly), medium (yearly) and long (5 years), terms, for the
continuous review, monitoring and control of waste respectively. Data over 2007-2011
was used for the long term analysis and data of 2013 (collected by analogous means as
for the period 2007-2011) was employed for the Yearly and Monthly Waste Monitoring.
Although data of 2012 was not included in the long, medium and short terms reviews,
Refinery’s waste production and costs in 2012 were also collected in a similar way as
for the period 2007-2011 in order to provide continuity in the analysis of waste over
2007-2013.
Section 3.3 presents a methodology to assess performance of raw materials use and
waste production during a specific event at the Refinery, i.e. the 2012 turnaround. A
methodology is proposed to determine technological solutions for the treatment of oily
sludge in Section 3.4 and Section 3.5 shows the stated objectives and the work
performed.
3.2 Continuous review, monitoring and control of waste
The review of waste generated in the Refinery is proposed to be carried out in three
periods of time, i.e. short, medium and long terms.
Chapter 3- Methodology
126
Figure 3.1 shows the elements and deliverables for the continuous control, monitoring
and review of waste over these periods. Each of the elements was conceived to
accomplish certain objectives and deliver specific products at different periods of time.
Although the figure shows the proposed methodology to be followed in future, in this
Thesis it was developed and applied starting with the 5-Year Waste Review, following
the Yearly Waste Monitoring and finalising with the Monthly Waste Control as
explained in sections 4.2, 4.4 and 4.5 respectively.
Figure 3.1. Methodology for control, monitoring and review of waste at the Refinery
The Five-Year Review included a methodology for the identification, classification and
quantification of the amount and treatment costs of waste produced (Objective 3 of this
thesis). Its intent was to aid the Refinery comply with the EA Environmental Permit
(see Management Condition in Table 2.7) and to provide a framework to analyse waste
every five years. Analysing waste over such a long period sought to identify and inform
the Refinery about those aspects of the management of waste that required business
decisions and actions at a more strategic level. This could include improvements to
installed infrastructure through its modification and/or installation of new technologies
to avoid/reduce the generation of waste, and changes in waste management practices
requiring new installations for the treatment of specific waste streams on-site, etc. The
results of this review, following the application of the methodology proposed in Sub-
section 3.2.1, are presented in Section 4.2 and are available on Refinery’s internal
network.
Through the understanding gained in the Five-Year Waste Review, the basis for the
Yearly Waste Monitoring was established to assist the Refinery in decisions and actions
to be taken in the medium-term not requiring new infrastructures but changes in
established management practices such as collection/segregation of waste, clean-up
operations, etc. For the Yearly Waste Monitoring a waste pollution inventory MS Excel
workbook was created in order to provide the Refinery with an organised and detailed
Monthly Waste Control Yearly Waste Monitoring Five-Year Waste Review
Short-term waste
performance analysis
“Waste in brief
monthly bulletin”
Medium-term waste
performance analysis
“2013 Detailed Waste
Database PI”
Long-term waste
performance analysis
“Five-Year Waste
Review”
Chapter 3- Methodology
127
history of waste from generation to final disposal and including information about costs
and waste management activities carried out on-site by the waste contractor. This MS
Excel workbook “2013 Detailed Waste Database PI” was made available at the
Refinery HES Network at the end of 2013. The identification, classification and
quantification of the amount and treatment costs of waste produced was performed in a
similar way to the Five-Year Review.
Finally the Monthly Waste Control aimed to identify and inform the Refinery, and in
particular the business units, about actions to minimise waste production and costs in
the short term, i.e. day-to-day operations. This element was considered as a “moving
window” for the control of waste involving individual business units, the on-site waste
contractor and Refinery Environmental Engineering. Immediate actions can include the
control of on-site/off-site vehicle movements, changes in logistics of waste collection,
etc. The Monthly Waste Control was carried out through the development of the “Waste
in Brief Monthly Bulletin” and was available on the internal Refinery network by the
end of 2013.
3.2.1 Five-Year Waste Review
Figure 3.2 shows an outline of the methodology developed for the Five-Year Waste
Review. The user approach, as intended to be used in future, is shown in Figure 3.3.
Figure 3.2. Outline of the Five-Year Waste Review methodology
Establish the period of study and
activities involved
Classification of waste (types and
treatment methods)Data collection
Development of a template for data
recording and analysis
Quantity generated
Costs of treatment
KPIs definition/calculation
Presentation of results
Analysis of resultsConclusions
RecommendationsExecutive Summary
write up
Chapter 3- Methodology
128
Figure 3.3. Outline of the Five-Year Waste Review methodology: user approach
As seen in Figure 3.2 , the methodology comprised ten defined elements, the first five
of which are explained in the following sub-sections.
It is important to mention that although a no particular methodology was followed to
write the Executive Summary of the Five-Year Waste Review, i.e. the last element
shown in Figure 3.2, it aims to be a quick reference for the Refinery Environmental
Manager and Engineering Team. Appendix L presents the Executive Summary of this
review which compiles and describes the most relevant aspects encountered in the Five-
Year Waste Review.
3.2.1.1 Period of study and activities involved
The period of study was established from 2007 to 2011 which included the four-year
period of review required by the EA in the Refinery’s EP (issued in 2006 and reviewed
in 2007) and 2011, the year of the most recent waste data available at the moment of the
review. Over 2007-2011 all waste materials generated at the Refinery by the different
site activities were analysed. These activities comprised normal operations, turnarounds
(TA) and specific maintenance operations (MO) which required the partial or total
shutdown of the Refinery business units.
3.2.1.2 Data collection
Four sources of information were used for data collection:
Establish the period of study and
activities involvedData collectionKPIs definition
Classification of waste (types and
treatment methods)
Quantity generated
Development of a template for data
recording and analysis
Calculations and presentation of
resultsAnalysis of resultsConclusions
RecommendationsExecutive Summary
write up
Cost of treatment
Chapter 3- Methodology
129
• Waste Contract Reports produced by the Refinery’s waste contractor;
• Refinery TA Schedules;
• Refinery Technology and Inspection Diaries; and
• Refinery Intranet System IndX (refinery operating data).
Specifically, waste data collected were the type of waste produced, the quantity
generated (t/month), the costs (£/month) of recycling and disposal operations and
unallocated on-site work excluding Value Added Tax (VAT). This information was
obtained from the Waste Contract Reports produced by the Refinery’s waste contractor
and available in the HES Directory Network. Although the previous data was collected
on a monthly basis (as it was in the Waste Contract Reports), for the purposes of this
review it was aggregated and reported on an annual basis. Due to the lack of reported
detailed information about unallocated on-site work costs, in particular in the period
2007-2009, this review did not analyse this type of costs in depth.
Unallocated on-site work in the context of this review defined activities such as tank
cleaning, clearing of catalyst lines, desludge operations, drain cleaning, maintenance of
the bundle washing and grit blast areas, debris removal and other type of on-site
cleaning operations carried out by the Refinery waste contractor. Thus, unallocated on-
site work costs comprised expenses due to:
• the supply and rental of materials (e.g. waste eurobags, sacks, tags, etc),
equipment (e.g. skips, bins, bulk containers, drums) and vehicles (e.g. vacuum
trucks, skip lorries, etc.) provided by the Refinery waste contractor; and
• waste contractor labour for completing specific tasks including monthly
management fees, truck driver’s costs, etc.
Information of TA and MO events was collected from the Refinery TA Schedules and
Technology and Inspection Diaries available at the Refinery business units’ directory
networks. Specifically, the information gathered were the date of the event, business
area and unit involved. In some cases information about the quantity of waste produced
at the TA or MO events and costs of the operations was identified in the Waste Contract
Reports.
Other types of data collected were the quantities of crude oil processed and alkylate
produced both expressed in Mt/y. This data was obtained from the Refinery Intranet
Chapter 3- Methodology
130
System IndX which retrieves operating data from process units such as, temperature,
pressure, flowrate, etc.
3.2.1.3 Classification of waste: types and treatment methods
Waste streams were classified according to the European List of Waste (LoW)
Commission Decision 2000/532/EC (EC, 2000). As this list was derived from the
European Waste Catalogue (EWC), codes to classify individual wastes were named
here as “EWC codes” (see Appendix C). Disposal and Recovery (Recycling) codes
were reported as they are in Annexes I and II of the EU WFD in Appendix D.
Combination of LoW and Disposal and Recycling codes allowed a further
classification, i.e. Hazardous Waste (HW) and Non-Hazardous Waste (NHW),
Hazardous Waste Disposed (HWD) and Hazardous Waste Recycled (HWR), and Non-
Hazardous Waste Disposed (NHWD) and Non-Hazardous Waste Recycled (NHWR).
For the purposes of the Five-Year Waste Review another classification was carried out
according to composition and quantity. Figure 3.4 presents the waste classification
framework including the categories for the 5-Year Waste Review.
Figure 3.4. Waste classification developed for the continuous review, monitoring and
control of waste
3.2.1.4 Development of a template for data recording and analysis
A template was created in MS Excel to record waste data over 2007-2011 not reported
on the Refinery TR548 Waste Database. This template was structured to record the
following information and facilitate the waste review in the period of study:
• waste description according to the EWC;
Hazardous Waste (HW)
HW Disposed (HWD)
Non-Hazardous Waste (NHW)
HW Recycled (HWR)
HWDFluoridicCaustic
HWD Without FluoridicCaustic
t<100100<t<3600
HWRSpent HDS
Catalyst
HWRWithout Spent HDS Catalyst
NHW Disposed (NHWD) NHW Recycled (NHWR)
NHWR Without Spent FCCU Catalyst
NHWRSpent FCCU
Catalyst
Waste
Chapter 3- Methodology
131
• EWC codes;
• disposal/recycling codes;
• year;
• amount of waste produced (t/y);
• costs (£/y) of off-site waste treatment; and
• costs (£/y) of unallocated on-site work.
3.2.1.5 KPIs definition/calculation
Five KPIs were defined and calculated to obtain an overall perspective (environmental
and economic) of the Refinery’s waste performance in the period of review, to focus on
key areas of environmental concern and to provide feedback to business units (in
particular to the AlkyU). This was done to assist in the preparation of measures to
improve the current means to avoid, recover and dispose of waste produced by the
activities.
Table 3.1 describes the five KPIs.
Table 3.1. Refinery Waste and Cost KPIs.
KPI Unit
Quantity of total Refinery waste normalised on
crude oil processed kg total waste/t crude oil processed
Costs of disposal, recycling and unallocated on-site
work for all waste generated by the Refinery £/t waste
Quantity of waste type normalised on crude oil
processed kg waste type/t crude oil processed
Costs of disposal and recycling per quantity and
type of waste generated by the Refinery £/t waste type generated
Quantity of total fluoridic caustic waste normalised
on alkylate production kg fluoridic caustic/t alkylate produced
3.2.2 Yearly Waste Monitoring
The yearly waste monitoring element comprised the development of the MS Excel
workbook “2013 Detailed Waste Database PI” to record, filter, index, sort and report
flexible and combined summaries of detailed monthly waste data. These monthly data
included type of on-site activities and costs, quantity of waste produced per business
unit, and breakdowns of costs due to off-site treatment in 2013.
Chapter 3- Methodology
132
It is important to mention that for the Yearly Waste Monitoring, waste costs are
classified as on-site work costs (named unallocated on-site work costs in the Five-Year
Waste Review and the review of waste in 2012) and off-site costs.
On-site work involve costs due to machinery and other rentals, non-hazardous other
costs, vacuum trucks, monthly management fee and track labour as described in Table
3.2. Off-site costs comprise waste treatment, consignment notes and transport.
The workbook spreadsheets contain general information, data source templates and
pivot tables as shown in Figure 3.5.
The high level general information of sheets 1 and 2 describe the business areas and
wastes produced, the sources of data are specified in sheets 3-6 and pivot tables for
details and analysis are provided in sheets 7-13. A detailed description of each data
source contained in sheets 3-6 is given in Table 3.3.
Table 3.2. Description of all types of Refinery on-site work costs in 2013
On-site work cost Description
Machinery and other rentals Fees for the management of equipment and rental of wheelie bins, REL and
RORO skips, RORO skip wagons, mini diggers, etc.
Non-hazardous other costs
Costs for the supply of materials such as cardboard and steel drums, steel clip
top drums, eurobags, refuse sacks, stickers for labelling, IBCs, shrink wrap,
etc. They also include costs of laboratory analysis (e.g. WAC test) and
sampling of tank bottom sludge, scale, oil spill, contaminated earth, flue ash,
merox clay, coke, spent alumina, etc.
Vacuum trucks Costs of fleet rental, driver fees and hoses inspections.
Monthly management fee
Costs for the waste management activities on-site including coordination of
personnel on/off site, preparation of invoices, attendance of team meeting and
any other Refinery enquiries.
Track labour Expenses for the payment of the on-site waste contractor workforce wages.
3.2.3 Monthly Waste Control
This short-term element aimed to control waste and inform about performance on a
monthly basis. It made use of the 2013 Detailed Waste Database PI developed for the
Yearly Waste Monitoring. The Monthly Waste Control is based on the “Waste in Brief
Monthly Bulletin” which was structured as shown in Figure 3.6.
Chapter 3- Methodology
133
3.3 Assessment of flow of materials from use/consumption to the generation of
waste
MFA was identified for potential use at the Refinery as a mean to improve performance
from environmental and resource management perspectives. Based on the need to assess
the flow of materials from use/consumption to the generation of waste specifically, the
methodology was developed for application at the 2012 Refinery turnaround (TA) when
an important use of resources needed to be managed and a large amount of waste was
expected to be produced. The materials flows analysed were those that were delivered
as raw materials, used in some activities and then became different wastes. As shown in
Schedules of Table 2.8, it is a regulatory requirement that the Refinery should manage
the use of raw materials in selected ways to pollute less and minimise wastage.
Chapter 3- Methodology
134
Sheet 1 Sheet 2
Sheet 3 Sheet 4 Sheet 5 Sheet 6
Sheet 7 Sheet 8 Sheet 9 Sheet 10
Dispose and recycling codes and description (treatment
methodologies)
All Refinery waste production, on-site work and off-site treatment costs excluding the production and
rebate costs of metals
Metals production
and rebate costs
Production of Spent fluidised catalytic cracking catalyst from
FCCU
Production and costs of wastes from cleaning of fuels with bases including fluoridic caustic, sludge and filter cake from AlkyU excluding
phenolic caustic
Treatment site and
address
Sheet 11
2013 Detailed Waste Database PI
MS Excel Workbook
General information
Data source
templates
Pivot tables
Sheet 12Waste production and costs
per business area
Sheet 13Waste production and costs
per business unit
Lists of business areas, units (plants)
and numbers
Detailed monthly waste production and on/off site
costs
Detailed monthly metals production and
rebate costs
Detailed monthly production of spent fluidised catalytic cracking catalyst from
FCCU
Detailed monthly production of fluoridic caustic, sludge and filter
cake from AlkyU
Figure 3.5. Structure and contents of the 2013 Detailed Waste Database PI
Chapter 3- Methodology
135
Table 3.3. Information, description and data sources contained in sheets 3-6 of the 2013
Detailed Waste Database PI
Information Description Data sources
Location: on-
site/off-site
On-site refers to the location of those activities and related costs
that take place within the Refinery boundaries and are carried out
by the waste contractor such as cleaning activities. Off-site refers
to the location of activities and related costs that take place
beyond the gates of the Refinery such as waste treatment.
Waste Contract Reports.
HES expenses
The type of expenses charged to the HES Department for the
management of waste on/off-site. There are five types of HES
expenses if they take place on-site: machinery and other rentals,
monthly management fees, non-hazardous other costs, vacuum
trucks and track labour. HES off-site expenses types include:
waste treatment, waste transport and waste consignment notes
(i.e. a form that should be issued and filled to move hazardous
waste from any premises and which fees must be paid to the
EA).
Waste Contract Reports.
Type of wastes,
treatment method
and code
Hazardous or Non-Hazardous Waste, Disposed or Recycled and
the specific code to further specified the treatment method.
TR548 Waste Database, Waste Contract
Reports and Annexes I and II of WFD
(Directive 2008/1/EC (EC, 2008c) (see
Appendix D).
EWC code and
description The code of waste and description according to the EWC (LoW).
List of Waste (LoW) (Commission Decision
2000/532/EC) (see Appendix C).
TR548
Indicates the TR548 form number through which the waste
stream was authorised to be moved from the source of generation
to on-site temporary storage area or off-site treatment facility.
TR548 Waste Database.
Business area, unit
(plant) and number
The complete address of waste producer, i.e. name of business
area, plant and number
TR548 Waste Database (see also Table B-7
of Appendix B).
Treatment site The name of the off-site treatment site and location. Waste Contract Reports and/or TR548
Waste Database.
Amount of waste
produced Quantity produced expressed in t/month
Waste Contract Reports, Scrap Metals
Monthly Reports and FCCU Spent Catalyst
Delivery & Disposal 2013 Reports.
Costs Costs of on-site work and waste off-site treatment, transportation
and consignment note costs expressed in £/month. Waste Contract Reports.
Chapter 3- Methodology
136
Figure 3.6. Outline of Waste in Brief Monthly Bulletin
The distinction between typical day-to-day operations and a turnaround events in terms
of the space (areas and business units) and time boundaries (phasing plan) and the
preparations for the monitoring the 2012 Refinery TA are described in the following
Sub-section.
3.3.1 Valero Refinery, Pembroke, 2012 turnaround: definition, space and time
boundaries
In general terms, a TA can be defined as a planned and periodic event where one or
more process units in a manufacturing facility are shutdown in order to perform
mechanical activities such as inspection, maintenance, repairs and/or replacement of
materials (e.g. catalysts, adsorbents, etc) or equipment (e.g. vessels, internals
mechanical parts, pumps, heat exchangers, etc) which cannot be serviced and/or
changed during normal operations. Statutory requirements and equipment reliability are
the main drivers of this event which, to a large extent, define the frequency of a TA.
Good planning and execution are import factors of a TA since important operational and
capital expenses are involved (Lawrence, 2012).
From an environmental perspective, TA events may produce severe consequences to the
environment if activities are not properly planned and possible impacts to the
environment identified. For this reason, during the planning phase of a TA an
environmental plan should be in place to indicate, among different aspects, how raw
materials and waste will be managed (McDonough, 2012a).
Figure 3.7 presents the Refinery 2012 TA Phasing Plan and shows the business units
involved. As seen in the figure, the TA duration was defined by three periods, i.e.
operational preparations carried out before and after maintenance or mechanical work
Section 1Refinery overall
performance: waste production and on/off-site
operating costs
Section 2Waste performance per business areas and units
Section 3Waste disposed/recycled and
treatment method
Section 4Comments
Chapter 3- Methodology
137
(i.e. all the steps required to shutdown/restart the unit) and the actual mechanical work.
It can be visualised that it was planned that the mechanical work in the Black Oils Area
was planned to take over 80% of the time whereas White Oils, and Blending and
Shipping, less than 60%. For other Refinery areas and business units refer to Appendix
B.
3.3.2 Preparation for monitoring the TA
Preparing activities for the monitoring of waste during the TA included:
• Development of templates for recording data concerning amount of waste
produced, date, place and type of activity that generates it;
• Specification of a site plot plan to identify areas, business units, and waste
compounds where waste was to be generated, collected and temporarily stored;
• Preparation of diagrams from the waste generation points to off-site treatment
sites to illustrate the complete route of materials;
• Review of the TR548 waste database and preparation of summaries for early
estimation of waste production;
• Identification of types of containers and transport to collect waste;
• Meetings with the Refinery waste contractor to estimate frequency of waste
collection and transport movements on-site; and
• Meetings with process engineers for estimation of waste catalysts to be
generated from units and review of fresh catalysts loading diagrams.
Chapter 3- Methodology
138
Figure 3.7. The Refinery 2012 TA Phasing Plan (Source: Valero Energy Ltd., 2012k)
Chapter 3- Methodology
139
3.3.3 MFA in the context of 2012 turnaround of Valero Refinery, Pembroke
As seen in Figure 3.8 the 2012 Refinery TA MFA was carried out via three phases, i.e.
definition, calculation and analysis. The following explains each phase.
Figure 3.8. MFA methodology developed for application during the 2012 Refinery TA
3.3.4 Definition stage
The system under analysis was defined as “the Refinery”. The period of time was taken
as the 2012 TA. The relevant flows of materials were chosen according to the waste
streams produced and the raw materials which promoted the generation of these wastes.
Waste streams were those reported as TA waste by the on-site waste contractor.
Additionally, spent catalysts which were directly managed by the Refinery were also
included. The materials flow diagrams were elaborated to indicate the flow streams and
quantities, the on-site handling/storage and off-site treatment facilities.
3.3.5 Calculation stage
Resource consumption for some materials was estimated according to the quantities
reported on the purchase orders of TA contractors and amounts used in the different TA
activities. Contractors during the TA operated under “umbrella” contracts which
included the combined and inseparable costs of services and materials. For this reason it
was not possible in all cases to differentiate between these costs on purchase orders.
System definition in space and time
Identification of relevant flows of materials
Compilation of material flow diagrams
Definition stage
Estimation of resource consumption
Estimation of points to recover value
Estimation of waste arising, disposal and recycling rates
Calculation stage
Key questions to be answered in future
analysis
MFA data collection issues and uncertainties
Analysis stage
Conclusions and recommendations
Resource consumption and waste production
analysis
Chapter 3- Methodology
140
In the case of catalysts (fresh, loaded and spent or discharged) which were managed
directly for the Refinery some quantities were gathered from internal refinery reports,
bids and purchase orders and in other cases estimated by mass balancing. To estimate
the resource consumption, use was made of the waste arising figures reported by the on-
site waste contractor.
Raw metals purchase orders were made individually by each process unit using two
different procurement and finance management systems, i.e. Orbit and SAP. Limited
access to these two systems and, in some cases, lack of details about the type of metal
and weight did not allow an estimate to be made of the quantity and costs of metals
purchased for the TA. Metals for the TA were in the form of metal-made materials and
equipment such as heat exchanger shells and bundles, vessels, pipes, flanges, elbows,
valves, studs, etc. In terms of scrap the amounts sent for recycling were reported by the
on-site waste contractor. When it was possible, points to recover value were estimated
by calculating losses that could occur during the use/consumption of raw materials.
3.3.6 Analysis stage
This stage was structured to discuss the most relevant issues on data collection and
uncertainties encountered during the analysis, study the resource use/consumption from
the perspective of waste generation and define key questions to address in future with
regard to the assessment of flow of materials from use to waste generation. Conclusions
addressed the potential for MFA to improve raw materials use in a refinery and
recommendations for future use as a tool for raw materials and waste management
assessment.
3.4 Oily sludge treatment
The treatment of oily sludge from different sources, as seen in Section 2.6, is an
environmental problem worldwide and an improvement condition of the EA
Environmental Permit of the Refinery. The methodology shown in Figure 3.9 is aimed
to assist the Refinery in assessing and selecting sustainable technology solutions for the
treatment of oily sludge with a view to general application at other refineries.
Chapter 3- Methodology
141
Literature review of treatment methods and tools available
for technology selection
Review of oily sludge produced in England
and Wales oil refineries over 2008-
2012
Review of costs for the treatment of oily sludge generated in
Valero Refinery, Pembroke over 2008-
2012
Figure 3.9. Methodology to determine technology solutions for the treatment of oily
sludge
The methodology shown in the figure comprises three elements. The first element,
already covered in Section 2.6, involved the literature review of the current methods
available for the treatment of oily sludge, the main technical aspects of the different
options and an overview of the existing tools for the selection of these technologies.
To estimate the incentives for refineries to select alternative technology solutions, the
analysis of oily sludge produced at all refineries in England and Wales was proposed as
in the figure as the shaded element. The period 2008-2012 and refineries were selected
based on data availability obtained from pollution inventory figures provided by the EA
under Special Licence Non-Commercial Agreement A2787 (EA, 2014a).
The third element of the methodology aimed to review treatment costs of oily sludge
over the same period, also as an incentive for the Refinery (costs data of other refineries
were not available) for either recovering value from oily sludge or finding less
expensive treatment options.
3.4.1 Review of oily sludge pollution from oil refineries of England and Wales
From the EA data of oily sludge waste production (EA, 2014b) an MS Excel
spreadsheet was constructed which contained:
• the number of the EA EP for each facility;
• the name and full post code of the facility;
Chapter 3- Methodology
142
• the route of waste released by the site, i.e. disposed or recycled;
• the type of waste released, i.e. Hazardous or Non-Hazardous;
• the quantity of waste discarded in kg, EWC code and description; and
• the year when the waste was released.
All data was then compiled in a different MS Excel workbook and sorted by postal
code, refinery, total waste produced and quantity of sludge generated. When applicable,
observations were made for each refinery to highlight information such as processing
capabilities (e.g. distillation, reforming and/or conversion) or shutdown events.
Individual summaries were also done to show the sources of oily sludge for each
refinery. It was identified in Section 2.6 that either the quantity of sludge produced or
the source of generation are factors which determine to a large extent the type of
treatment to be carried out.
Once the data was compiled and sorted, an analysis followed which comprised:
• the total oily sludge production in oil refineries located in England and Wales
compared to all other type of waste; and
• the amount of oily sludge production for each refinery over 2008-2012.
The first point aimed to show the extent of the problem of oily sludge production in
these refineries from a waste management perspective and the second to compare the
performance of individual refineries and provide data for possible future use by
refineries worldwide.
3.5 Methodology and results chapters: links and significance
As mentioned in Section 3.1, the proposed methodologies aimed to achieve Objectives
3 and 4 of this Thesis. In order to provide links and demonstrate significance, Table 3.4
shows the relationship between Chapters 3 (Methodology) and 4 (Results) with these
objectives in mind.
Chapter 3- Methodology
143
Table 3.4. Specific objectives in relation to Methodology and Results and discussion
chapters: links and significance
Objective Chapter
(Sections) Significance
3. To identify, classify
and quantify the
amount and treatment
costs of waste
produced by a UK oil
refinery (Valero
Refinery, Pembroke)
3 (3.2)
A methodology was proposed to review waste in three different
periods of time as an improved waste management practice of Valero
Refinery, Pembroke (see Figure 2.17) involving the classification,
quantification of the amount of waste, treatment costs and development
of KPIs in order to assess performance and ultimately progress towards
sustainable development.
4 (4.2-4.5)
The methodology proposed in Section 3.2 is aimed to be applied in
Sections 4.2-4.5 to demonstrate suitability and provide guidance for
future continuous reviews. By presenting these results it is expected
that Objective 3 will be fully achieved.
4. To define a
methodology to assess
performance in both
areas, namely raw
materials and waste
management
3 (3.3)
A methodology was proposed to assess performance in the
management of raw materials and waste based on MFA methodologies
and aimed to achieve Objective 4. The motivation relied on the fact
that an optimum management of materials is essential for the
sustainability of the oil refining industry, particularly from an
environmental perspective.
4 (4.6)
The methodology proposed in Section 3.3 is aimed to be applied in
Section 4.6 also to demonstrate appropriateness and for complete
achievement of Objective 4. A turnaround was identified as a relevant
event of the Refinery for application of this methodology because of
the large quantity of materials being managed and their types, which in
some cases, are not encountered during normal operations.
It is important to mention that although Objective 5 of this Thesis was achieved at the
end of Chapter 2, it was identified an opportunity to aid the Refinery to comply with the
improvement condition of its EP relating to the management of oily sludge. A
methodology to determine technology solutions for the treatment of this waste as seen
in Figure 3.9 included the review of oily sludge produced in England and Wales oil
refineries over 2008-2012. This review is presented and discussed in Section 4.7.
Chapter 4- Results and discussion
144
4 RESULTS AND DISCUSSION
4.1 Introduction
This Chapter applies the methodologies proposed in Chapter 3 and presents the results
for fully achievement of Objectives 3 and 4 which are associated with identifying,
classifying and quantifying oil refinery waste and defying a methodology for assessing
performance in raw materials usage and waste management. Results to aid the Refinery
comply with the improvement condition of its EP relating to the management of oily
sludge are also presented in this chapter.
Chapter 4 comprises eight sections. Section 4.1 introduces the Chapter and outlines the
contents of Sections 4.2-4.8.
Sections 4.2, 4.4 and 4.5 present the results of the review of waste produced at the
Refinery and costs of treatment over three different periods of time:
• 2007-2011 for the 5-Year Waste Review (i.e. long-term element);
• 2013 for the yearly monitoring of waste (i.e. medium-term) element; and
• 2013 for the monthly waste control (i.e. short-term element).
Specifically, Section 4.2 provides the results of the 5-Year Waste Review involving the
trends in the production and costs of treatment of wastes classified by type and
treatment method. In Sub-section 4.2.9, Refinery waste and cost KPIs are calculated as
proposed in Sub-section 3.2.1.5. As periods of time selected for the continuous review,
monitoring and control of waste shown above excluded 2012, Section 4.3 presents the
results of a review of waste and costs of treatment for this year separately, allowing
continuity and completion of records over the full period 2007-2013. Section 4.4
presents the results of the yearly waste monitoring of the Refinery in 2013 using the
“2013 Detailed Waste Database PI”. These results detail on-site work and off-site
waste costs, specify waste streams most generated and costliest and show waste
ownership (i.e. waste performance at a business unit level). Section 4.5 shows the
“Waste in Brief Monthly Bulletin” of December 2013 for monthly waste control.
Chapter 4- Results and discussion
145
Section 4.6 reports the results of the MFA carried out in the context of the 2012
Refinery Turnaround (TA). Results are presented for each type of raw material and
related waste stream.
Section 4.7 shows the results of the review of oily sludge produced by the oil refineries
of England and Wales over 2008-2012, the period for which data was available, to aid
the Refinery to comply with the improvement condition of its EP relating to the
management of oily sludge.
Section 4.8 presents specific findings and concluding remarks of the analysis carried out
in Chapter 4.
4.2 Five-Year Waste Review
4.2.1 Collection of data over 2007-2011
Before presenting and discussing the results it is important to mention some issues
encountered with the collection of data. These deficiencies require attention in order to
facilitate future analysis and minimise data uncertainties. They result from the way
information is reported on the Waste Contract Reports, i.e. one of the four sources of
information used in this thesis (see Sub-section 3.2.1.2). They are detailed as follows,
with recommendations on practical changes to improve data compilation:
• Waste streams were not identified in ways consistent with the European Waste
Catalogue (EWC) so that identification of the waste and the correct EWC code
is difficult. Additional fields should be added to the reports indicating EWC
description and code.
• Wastes such as sludge from different sources, grit blasting materials, spent filter
clays, soil and stones containing dangerous substances, oil spills and aqueous
liquid wastes containing dangerous substances were reported with different
EWC codes; for instance 19.05.05* and 05.01.09* were used interchangeably
throughout some reports. A EWC code list should be added to the reports to help
the user.
• Disposal and recycling codes were not indicated. These codes should be
specified to ensure that the waste is correctly treated off-site.
Chapter 4- Results and discussion
146
• The type and costs of unallocated on-site work were not detailed on the reports.
As these activities represent an important part of the expenses, it is essential to
specify the type of activity and location on-site, with a breakdown of costs and
the amount of waste generated/collected.
4.2.2 Overall trends in total waste generated and costs in the period 2007-2011
Detailed data on waste generated and costs in the Refinery over 2007-2011 are
presented in Tables I-1 and I-2 of Appendix I. Table 4.1 presents a summary of these
data including unallocated on-site work costs.
The table shows that waste production and treatment costs increased over 2007-2011:
the total waste generated rose by 7.1 kt to 29 kt, i.e. an increment of 33% in five years.
With regard to costs for the management of waste, the Refinery spent £2.1 M more in
2011 compared to 2007, i.e. an increase of 104%.
In terms of type of waste, Table 4.1 shows that Hazardous Waste (HW) was the largest
and the costliest to treat. Its production increased by 7.4 kt to 21.9 kt over 2007-2011,
i.e. an increment of 50.6%. HW cost the Refinery £0.94 M more in 2011 compared to
2007, representing a rise of 60%. However, the generation of Non-Hazardous Waste
(NHW) varied throughout 2007-2011 without any pattern and much less was produced.
NHW costs also varied with a non-defined trend. From Table 4.1 it can be deduced that
the increase in treatment costs for HW was comparable to the total cost for NHW.
Unallocated on-site work costs also increased over 2007-2011. In 2011 the Refinery
spent five times more on this category (i.e. £1.2 M) than it did in 2007, i.e. the year
when these costs were considerably lower compared to the rest of the period.
With regard to the type of treatment, the majority of HW was disposed (>95%) while
most NHW was recycled (>88%) over 2007-2011. These proportions remained
relatively constant for both of these wastes throughout the period as seen in Figure 4.1.
It is noticeable in the figure that the quantity of HW Disposed (HWD) was similar over
2007-2008 but then increased at a rate of about 2.6 kt/y, corresponding to an increment
of 7.8 kt over 2008-2011, i.e. 57%. With regard to NHW Recycled (NHWR), the figure
highlights that there was little variation in its production, i.e. up to a maximum of 5%.
Chapter 4- Results and discussion
147
Table 4.1. Summary of total waste generated in the Refinery and costs over 2007-2011
2007 2008 2009 2010 2011
Waste description Amount Cost Amount Cost Amount Cost Amount Cost Amount Cost
(kt) (£k) (kt) (£k) (kt) (£k) (kt) (£k) (kt) (£k)
Hazardous Waste (HW)
HW Disposed 14.59 1,552 13.87 1,813 16.36 2,280 18.42 2,133 21.75 2,499
HW Recycled 0.013 10.89 0.48 4.4 0.93 112 0.36 16.0 0.24 3.48
Total HW 14.61 1,563 14.35 1,818 17.28 2,393 18.78 2,149 21.99 2,502
Non-Hazardous Waste
(NHW)
NHW Disposed 0.28 31.89 0.44 63.88 0.35 32.41 0.69 61.96 0.36 35.04
NHW Recycled 7.01 159 6.21 139 6.26 128 5.30 125 6.69 169
Total NHW 7.29 191 6.65 203 6.61 160 6.00 187 7.05 204
Total waste (HW+NHW) 21.9 1,754 21.00 2,021 23.9 2,553 24.8 2,337 29.0 2,706
Unallocated on-site work
costs N/A 270 N/A 1,065 N/A 553 N/A 834 N/A 1,425
TOTAL 21.9 2,024 21.0 3,086 23.9 3,106 24.8 3,171 29.0 4,131
Chapter 4- Results and discussion
148
Figure 4.1. Amount of HW and NHW Disposed and Recycled in the Refinery over
2007-2011
In the same manner, for HW and NHW, detailed disposed and recycling costs over
2007-2011 are illustrated in Figure 4.2.
This figure similarly shows that the highest costs are also associated with the treatment
of HWD which increased in the period by £0.95 M to £2.5 M in 2011, i.e. an increment
of 61%.
Figure 4.2. Costs of HW and NHW Disposed and Recycled in the Refinery over 2007-
2011
99.9% D 97% D
95% D
98% D
99% D
96% R 93% R 95% R 88% R
95% R
0
5
10
15
20
25
HW NHW HW NHW HW NHW HW NHW HW NHW
2007 2008 2009 2010 2011
Pro
du
cti
on
(k
t)
Disposed (D)
Recycled (R)
99.3% D
99.8% D
95.3% D
99.3% D 99.9% D
83% R 69% R 80% R 67% R 83% R
0
500
1,000
1,500
2,000
2,500
HW NHW HW NHW HW NHW HW NHW HW NHW
2007 2008 2009 2010 2011
Co
sts
(£
k)
Disposed (D)
Recycled (R)
Chapter 4- Results and discussion
149
In the case of NHW, the figure shows that although its costs remained roughly constant
over 2007-2011 (i.e. on average £0.19 M/y), the distribution of these costs varied
between NHW Disposed (NHWD) and NHW Recycled (NHWR). A high proportion of
NHW costs were due to its recycling.
Before presenting and discussing detailed breakdown of waste in Sub-section 4.2.4, the
following Sub-section specifies the amount of waste generated according to the type of
disposal or recycling operations in the period 2007-2011. This is relevant as discussions
later will refer to specific treatments of waste.
4.2.3 Disposal and recycling operations and total quantity of HW and NHW treated
Figure 4.3 Figure 4.4 present the detailed disposal and recycling operations used to treat
HW and NHW over the total five year period 2007-2011 and the quantities and costs of
treatment by each process respectively. Further descriptions of these operations are
given in Appendix D where numbers are added to disposal (D) and recovery (recycling)
(R) codes to identify the type of treatment. As seen in the Appendix, disposal operations
are numbered to 1 to 15 and recycling to 1 to 13. The figure also describes the type of
operations and between brackets their codes according to Tables D-1 and D-2 of
Appendix D.
Both figures show that the largest quantity and costliest of HW was disposed by
physicochemical treatment (D9). This type of treatment aims to reduce the hazardous
character of wastes prior to final disposal through any of the operations numbered D1 to
D12 in Table D-1 of Appendix D (e.g. special engineered landfill, incineration on land,
etc). The final quantities of HWD left following physicochemical treatment and then
disposed through these operations were not determined. According to Figure 4.3,
incineration on land (D10) was also used to treat HWD. Although the quantity disposed
by D10 was approximately ten times lower than the amount treated by D9, costs were
considerable, i.e. one third of the total refinery waste treatment costs. This highlights the
importance of waste treated by incineration which ultimately needs to be reduced at
source or treated by less expensive methodologies.
Chapter 4- Results and discussion
150
Recycling operations
Disposal operations
Especially engineered landfill (D5)
Physico-chemical treatment (D9)
Incineration on land (D10)
Blending or mixing prior to submission
to any of the operations numbered D1
to D12 (D13)
Recycling/reclamation of organic
substances which are not used as
solvents (R3)
Recycling/reclamation of metals and
metal compounds (R4)
Recycling/reclamation of other
inorganic materials (R5)
Use of wastes obtained from any of the
operations numbered R1 to R10 (R11)
73.2 kt
2.5 kt
2.1 kt
7.6 kt
0.003 kt
1.7 kt
0.5 kt
0.7 kt
7.4 kt
1.5 kt
19.5 kt
3.9 kt
HW
NHW
120.6 kt
87 kt
33.6 kt
Refinery waste
2.1%
1.7%
61%
6.3%
0.003%
1.4%
0.4%
0.6%
6.1%
1.2%
16%
3.3%
72%
28%
Figure 4.3. Quantity of total refinery waste treated over the five year period of 2007-2011
Chapter 4- Results and discussion
151
Figure 4.4. Costs of total refinery waste treated over the five year period of 2007-2011
Recycling operations
Disposal operations
Especially engineered landfill (D5)
Physico-chemical treatment (D9)
Incineration on land (D10)
Blending or mixing prior to submission
to any of the operations numbered D1
to D12 (D13)
Recycling/reclamation of organic
substances which are not used as
solvents (R3)
Recycling/reclamation of metals and
metal compounds (R4)
Recycling/reclamation of other
inorganic materials (R5)
Use of wastes obtained from any of the
operations numbered R1 to R10 (R11)
HW
NHW
£10,425 k
£6,246 k
£3,673 k
£303 k
£225 k
£0.439 k
£122 k
£25 k
£77 k
£5.4 k
£266 k
£373 k
Refinery waste
£947 k
£11,372 k
£56 k91.7%
8.3%
2.6%
2%
55%
32.3%
0.004%
0.5%
1.1%
0.7%
0.055%
0.2%
2.3%
3.2%
Chapter 4- Results and discussion
152
In the case of NHW, 80% was treated through the recycling and reclamation of
inorganic materials53
(R5) and recycling/reclamation of metals and metals compounds
(R4). The figure shows that 3.8% of the total Refinery waste was disposed by specially
engineered landfill (D5).
4.2.4 Detailed breakdown of HW and NHW Disposed and Recycled over 2007-2011:
amount generated and costs
Proportional breakdowns of the quantity of waste generated and the costs of treatment
per type of waste are aggregated for the five year 2007-2011 in Figure 4.5 and Figure
4.6 respectively. It was not possible to provide a breakdown of unallocated on-site work
costs since over 2007-2009 the Waste Contract Reports did not provide sufficient
details. Both figures show that the Refinery generated a total of 58 different types of
wastes, of which 39 were HW and 19 NHW over the five year period.
By far, the largest quantities of HW sent for disposal were fluoridic caustic54
at 71.8 kt,
oily sludge from different sources (3.2 kt), phenolic caustic (2.4 kt), waste blasting
materials containing dangerous substances (1.7 kt) and soil and stones containing
dangerous substances (1.6 kt) comprised other significant amounts. The total production
of these wastes, i.e. 80.7 kt, accounted for 93% of the HW generated at the Refinery and
67% w/w of the total waste produced. These wastes were disposed of through the
operations shown in Table 4.2.
With regard to the detailed costs of HW, Figure 4.6 shows that fluoridic caustic was the
waste that cost the most to treat (£6.8 M) while oily sludge from different sources and
phenolic caustic were also expensive, i.e. £1.44 M and £0.91 M respectively, but much
less than fluoridic caustic. The total costs of these three waste streams accounted for
88% of the HW costs and 59% of the total Refinery waste costs in the five year period.
With regard to NHW, Figure 4.5 shows that spent FCCU catalyst is the largest
component, representing more than half of the NHW generated in the period (18 kt total
in 2007-2011). Metals (7.4 kt), mixed municipal waste (5.2 kt) and other alumina and
molecular sieve materials (1.4 kt) were also significant constituents. The total
53
Inorganic materials recovered in R5 operations refer to those components which can be used or re-used
in the construction sector. R5 also includes operations to recover contaminated soils.
54 Described by the EWC as wastes from cleaning fuels with bases, code 05.01.11*.
Chapter 4- Results and discussion
153
production of these four wastes accounted for 95% of the NHW generated and 27% of
the total Refinery waste produced. Spent FCCU Catalyst, metals, mixed municipal
waste (25%) and other alumina and molecular sieve materials were recycled through the
treatment operations shown in Table 4.3.
Chapter 4- Results and discussion
154
Figure 4.5. Distribution of waste generated in the Refinery over 2007-2011
1.7%2.1 kt
Waste
Hazardous Waste (HW) Non-Hazardous Waste (NHW)
HW Disposed (HWD) HW Recycled (HWR) NHW Disposed (NHWD) NHW Recycled (NHWR)
HWD
Fluoridic Caustic
HWD Without
Fluoridic Caustic
HWR
Spent HDS Catalyst
HWR Without
Spent HDS Catalyst
NHWR
Spent FCCU
Catalyst
HWR Without
Spent FCCU
Catalyst
100<t<3600 t<100
Wastes from cleaning of fuels with bases
(phenolic caustic) (2.0%/2.4 kt)
Waste blasting material containing dangerous
substances (grit blast) (1.3%/1.7 kt)
Soil and stones containing dangerous substances
(1.2%/1.6 kt)
Aqueous liquid wastes containing dangerous
substances (amine water, etc) (1.1%/1.3 kt)
Tank bottom sludges (1.0%/1.2 kt)
Sludges from physicochemical treatment
containing dangerous substances (0.9%/1 kt)
Wastes containing dangerous substances (0.6%/
0.7 kt)
Oily sludges from maintenance operations of the
plant or equipment (0.6%/0.7 kt)
Spent filter clays (merox clay and salts) (0.5%/
0.6 kt)
Discarded organic chemicals consisting of or
containing dangerous substances (0.4%/0.5 kt)
Absorbents, filter materials, wipping cloths and
protective clothing (PPE) contaminated with
dangerous substances (0.3%/0.3 kt)
Sludges from on-site effluent treatment
containing dangerous substances (WWTP
centrifugated cake, etc) (0.2%/0.2 kt)
Construction materials containing asbestos
(0.2%/0.2 kt)
Oil spills (0.08%/0.1 kt)
Organic wastes containig dangerous substances
(coke, benzene, etc) (0.08%/0.1 kt)
Packaging containing residues of or contaminated by
dangerous substances (paint tins, broken glass,
aerosals, etc) (0.08%/94 t)
Spent catalyst contaminated with dangerous
substances (0.07%/85 t)
Other wastes containing dangerous substances
(alkylation black tank effluent) (0.05%/55 t)
Other solvents and solvent mixtures (0.04%/49 t)
Oil fly ash and boiler dust (0.02%/25 t)
Laboratory chemicals, consisting of or containing
dangerous substances (ferric sulphite) (0.02%/24 t)
Sludges from paint or varnish containing organic
solvents or other substances (0.01%/12 t)
Other halogenated solvents and solvent mixtures
(propylene dichloride, etc) (0.01%/12 t)
Desalter sludge (0.006%/7 t)
Linings and refractories from non-metallurgical process
containing dangerous substances (0.002%/3 t)
Acid Alkyl sludges (0.002%/2 t)
Other tars (fuel oil samples) (0.0009%/1 t)
Other fuels (waste fuel sample bottles) (0.0008 %/1 t)
Gases in pressure containers (empty aerosals, etc)
(0.0008%/1 t)
Spent activated carbon from flue-gas treatment
(0.0008%/1 t)
Inorganic wastes containing dangerous substances
(sodium bisulphite, etc) (0.0004%/1 t)
Oil filters (0.0002%/0.2 t)
Metals (6.1%/7.4 kt)
Mixed municipal waste (3.3%/3.9 kt)
Alumina and molecular sieve materials not from FCCU but
also classified as Spent FCCU Catalyst (1.2%/1.4 kt)
Wooden packaging (0.4%/0.5 kt)
Paper and cardboard (0.1%/0.12 kt)
Spent catalysts containing transition metals or trans. metal
compounds not specified (SNAMS mol sieves/alumina
catalyst) (0.08%/0.1 kt)
Waste alumina (coke from FCCU shutdown, molecular sieve)
(0.04%/47 t)
Gypsum-based construction materials (0.01%/18 t)
End-of-life tyres (0.01%/17 t)
Edible oil and fat (0.01 %/8 t)
Absorbents, filter materials, wipping cloths and protective
clothing (alumina absorbent, etc) (0.01 %/8 t)
Plastics (0.002%/3 t)
Spent filter clays (merox clay and salts)
(0.4%/0.5 kt)
Discarded electrical and electronic
equipment (WEEE) (0.03%/34 t)
Organic wastes containig dangerous
substances (VBU Coke) (0.02%/26 t)
Waste printing toner containing dangerous
substances (0.008%/10 t)
Fluorescent tubes and other mercury-
containing waste (0.001%/2 t)
Mixed municipal waste (1.1%/1.3 kt)
Biodegradable kitchen and canteen waste (0.7%/
0.8 kt)
Waste blasting material (grit blast) (0.03%/38 t)
Glass (0.002%/3 t)
Inorganic wastes (perlite, etc) (0.0003%/0.4 t)
Organic wastes (graphite) (0.0002%/0.2 t)
100%120.6 kt
72%87 kt
28%33.6 kt
70.3%84.9 kt
59.5%71.8 kt
10.8%13.1 kt
10.5%12.7 kt
0.3%0.4 kt
1.2%1.5 kt
0.5%0.6 kt
1.8%2.1 kt
26.2%31.6 kt
14.9%18 kt
11.3%13.6 kt
Legend:
kt: kilotonnes
t: tonnes
Chapter 4- Results and discussion
155
Figure 4.6. Distribution of the costs of waste in the Refinery over 2007-2011
0.97%£0.15 M
Waste
Hazardous Waste (HW) Non-Hazardous Waste (NHW)
HW Disposed (HWD) HW Recycled (HWR) NHW Disposed (NHWD) NHW Recycled (NHWR)
HWD
Fluoridic Caustic
HWD Without
Fluoridic Caustic
HWR
Spent HDS Catalyst
HWR Without
Spent HDS Catalyst
NHWR
Spent FCCU
Catalyst
NHWR Without
Spent FCCU
Catalyst
100<t<3600 t<100
Wastes from cleaning of fuels with bases (phenolic
caustic) (5.9%/£0.91 M)
Sludges from physicochemical treatment containing
dangerous substances (4.8%/£0.74 M)
Oily sludges from maintenance operations of the plant
or equipment (3.3%/£0.52 M)
Discarded organic chemicals consisting of or containing
dangerous substances (1.7%/£0.26 M)
Aqueous liquid wastes containing dangerous
substances (amine water, etc) (1%/£0.16 M)
Tank bottom sludges (1%/£0.15 M)
Waste blasting material containing dangerous
substances (grit blast) (0.9%/£0.14 M)
Spent filter clays (merox clay and salts) (0.6%/£98 k)
Wastes containing dangerous substances (0.6%/£89 k)
Oil spills (0.5%/£77 k)
Construction materials containing asbestos (0.4%/£63
k)
Absorbents, filter materials, wipping cloths and
protective clothing (PPE) contaminated with dangerous
substances (0.37%/£58 k)
Soil and stones containing dangerous substances
(0.36%/£56 k)
Sludges from on-site effluent treatment containing
dangerous substances (WWTP centrifugated cake, etc)
(0.19%/£30 k)
Organic wastes containig dangerous substances (coke,
benzene, etc) (0.01%/£2 k)
Packaging containing residues of or contaminated by
dangerous substances (paint tins, broken glass, aerosals,
etc) (0.4%/£62 k)
Other halogenated solvents and solvent mixtures
(propylene dichloride, etc) (0.16%/£25.2 k)
Spent catalyst contaminated with dangerous substances
(0.15%/£24.7 k)
Laboratory chemicals, consisting of or containing dangerous
substances (ferric sulphite) (0.10%/£15.8 k)
Other solvents and solvent mixtures (0.093%/£14.5 k)
Other wastes containing dangerous substances (alkylation
black tank effluent) (0.06%/£9.4 k)%
Sludges from paint or varnish containing organic solvents or
other substances (0.05%/£7.6 k)
Oil fly ash and boiler dust (0.02%/£3.2 k)
Acid Alkyl sludges (0.006%/£1 k)
Linings and refractories from non-metallurgical process
containing dangerous substances (0.006%/£0.92 k)
Gases in pressure containers (empty aerosals, etc)
(0.004%/£0.56 k)
Spent activated carbon from flue-gas treatment (0.004%/
£0.56 k)
Other tars (fuel oil samples) (0.003%/£0.55 k)
Other fuels (waste fuel sample bottles) (0.003%/£0.5 k)
Inorganic wastes containing dangerous substances (sodium
bisulphite, etc) (0.002%/£0.28 k)
Oil filters (0.001%/£0.12 k)
Desalter sludge (not reported)
Mixed municipal waste (2.4%/£0.37 M)
Alumina and molecular sieve materials not from FCCU but
also classified as Spent FCCU Catalyst (1.6%/£0.23 M)
Wooden packaging (0.36%/£56 k)
Spent catalysts containing transition metals or trans. Metal
compounds not specified (SNAMS mol sieves/alumina
catalyst) (0.17%/£27 k)
Waste alumina (coke from FCCU shutdown, molecular
sieve) (0.061%/£9.4 k)
Paper and cardboard (0.045%/£6.9 k)
Metals (0.035%/£5.4 k)
End-of-life tyres (0.03%/£4.2 k)
Absorbents, filter materials, wipping cloths and protective
clothing (alumina absorbent, etc) (0.015%/£2.3 k)
Gypsum-based construction materials (0.012%/£1.9 k)
Plastics (0.004%/£0.6 k)
Edible oil and fat (0%/£0 k)
Spent filter clays (merox clay and salts)
(0.76%/£0.12 M)
Discarded electrical and electronic
equipment (WEEE) (0.14%/£21.4 k)
Organic wastes containig dangerous
substances (VBU Coke) (0.025%/£3.9 k)
Fluorescent tubes and other mercury-
containing waste (0.025%/£3.9 k)
Waste printing toner containing dangerous
substances (0.017%/£2.7 k)
Mixed municipal waste (0.77%/£0.12 M)
Biodegradable kitchen and canteen waste
(0.6%/£93 k)
Waste blasting material (grit blast) (0.05%/£7.3
k)
Inorganic wastes (perlite, etc) (0.0015%/£0.23
k)
Organic wastes (graphite) (0.0007%/£0.11 k)
Glass (0.0006%/£0.1 k)
100%£15.52 M
67.2%£10.43 M
6.1%£0.94 M
66.2%£10.28 M
43.5%£6.75 M
22.7%£3.53 M
21.6%£3.36 M
1.1%£0.17 M
0%£0 M
0.97%£0.15 M
1.4%£0.22 M
4.7%£0.72 M
0%£0 M
4.7%£0.72 M
Disposal and recycling costs Unallocated on-site work73.3%
£11.37 M26.7%
£4.15 M
Legend:
t: tonnes
Chapter 4 – Results and discussion
156
Table 4.2. Treatments used for the disposal of the major constituents of the HW
produced in the Refinery over 2007-2011
HW description Disposal Disposal code
Fluoridic caustic Physicochemical treatment D9
Oily sludge from different
sources Incineration on land D10
Phenolic caustic Incineration on land D10
Waste blasting materials Specially engineered landfill D5
Soil and stones containing
dangerous substances
Blending or mixing prior to submission
to any of the operations numbered D 1
to D 12
D13
Table 4.3. Treatment operations used for the recycling of NHW most largely produced
in the Refinery over 2007-2011
NHW description Recycling operation Recycling
operation code
Spent FCCU Catalyst Recycling/reclamation of other
inorganic materials R5
Metals Recycling/reclamation of metals and
metal compounds R4
Mixed municipal waste (75%) Use of wastes obtained from any of
the operations numbered R1 to R10 R11
Alumina and molecular sieve
materials not from FCCU (also
classified by the EWC as Spent
FCCU Catalyst)
Recycling/reclamation of other
inorganic materials R5
The Refinery incurred no charges for the recycling of spent FCCU Catalyst and metals.
The constituents of NHW whose treatment was most expensive were mixed municipal
waste (£0.49 M) and alumina and molecular sieve materials other than FCCU (£0.23
M). The added costs of these waste streams represented 77% of NHW expenditure and
5% of the total Refinery waste costs in the period.
HW and NHW generated in minor amounts and less expensive to treat represented 6%
the total Refinery waste produced, i.e. 7.2 kt, and 9% of the total costs, i.e. £1.39 M.
Within this category the most representative HW included Spent HDS Catalyst, aqueous
Chapter 4 – Results and discussion
157
liquid wastes containing dangerous substances and spent filter clays while NHW
comprised primarily wooden pallets and packaging.
Unallocated on-site work costs represented the remaining 27% of the total Refinery
expenditure over the five year period, i.e. £4.15 M.
To provide basis for discussion with regard to trends in production and costs of major
constituents of HW and NHW in sub-sections 4.2.6-4.2.8, the following Sub-section
presents the TA and maintenance operation (MO) events that took place in the Refinery
in the period 2007-2011 that influenced the generation of waste.
4.2.5 Refinery TA and MO events that generated wastes over 2007-2011
The most relevant TA and MO events that took place at the Refinery over 2007-2011
are shown in Table 4.4. This table also includes some details about the activity
performed.
Table 4.4 highlights that:
• the catalyst of the Hydrotreating Unit 2 (HTU-2) was changed in 2007;
• a big TA took place in the Cracking and Olefins (C&O) area in 2008 involving
the Alkylation Unit (AlkyU) and Fluidized Catalytic Cracking Unit (FCCU);
• in 2009 different MO were carried out in the Black Oils (BOs) area;
• in 2010 there was a catalyst change out on Hydrotreating Unit 1 (HTU-1); and
• in 2011 the Sulphur Recovery Unit (SRU) had a catalyst changeout.
Other relevant MO carried out at Refinery areas that also generated waste over 2007-
2011 are presented in Table 4.5.
For trends in the costs of waste discussed later it is important to mention that in the
period 2007-2011 two different waste contractors were employed at the Refinery and
from January 2007 to July 2009 unallocated on-site work was distributed between them.
After this period only one waste contractor continued on site to the end of 2011.
Chapter 4 – Results and discussion
158
Table 4.4. Most relevant turnaround (TA) and maintenance operation (MO) activities
performed on the Refinery business units over 2007-2011
Year Business Unit TA/MO
2007 Visbreaking Unit (VBU) (TA)
Hydrotreating Unit 2 (HTU-2) (catalyst change out) (TA)
2008
Fluidized Catalytic Cracking Unit (FCCU), Butamer, Alkylation
Unit (AlkyU), Amine Recovery Unit (ARU), Sulphur Recovery
Unit (SRU), Ultra Low Sulphur Gasoline (ULSG), Merox Units,
Blending and Shipping (B&S), Utility Systems and Isomerisation
Unit (Isom) (TA)
2009
Hydrotreating Unit 1 (HTU-1) (TA)
Hydrogen Recovery Unit (HRU) (fractionators outage) (TA)
Unifiner (catalyst skimming) (MO)
Catalytic Reforming Unit (CCR/CRU) (screen cleaning) (MO)
Visbreaking Unit (VBU) (chemical cleaning) (MO)
Vacuum Distillation Unit (VDU) (heater decoking) (MO)
Vacuum Distillation Unit (VDU) (exchanger cleaning) (MO)
Crude Distillation Unit (CDU) (desalter repair) (MO)
Kerosene Merox Unit (KMU) (new vessel installation, catalyst
and clay inspection and change at Phase 1) (MO)
Visbreaking Unit (VBU) (fractionator corrosion repairs) (MO)
Crude Distillation Unit (CDU) (Sour Water Stripper repairs)
(MO)
Kerosene Merox Unit (KMU) (new vessel installation, catalyst
and clay inspection and change at Phase 2) (MO)
2010
Catalytic Reforming Unit (CCR/CRU) (screen cleaning) (MO)
Hydrotreating Unit 1 (HTU-1) (catalyst changeout) (MO)
Vacuum Distillation Unit (VDU) (decoking) (MO)
Unifiner (skimming) (MO)
2011
Amine Recovery Unit (ARU) (TA)
Sulphur Recovery Unit (SRU) (catalyst change out) (TA)
Crude Distillation Unit (CDU) (heat exchangers decoking) (MO)
Chapter 4 – Results and discussion
159
Table 4.5. Other relevant maintenance operation (MO) activities, costs, amount and type
of waste generated at the Refinery over 2007-2011
Year Refinery
Area Unallocated on-site work
Unallocated
on-site
work costs
(£M)
Amount of
waste
generated
(t)
Type of waste
2007 Blending
and
Shipping
(B&S)
Cleaning of the Refinery Slop
Tank 62
Not
available 450
Tank bottom sludge
EWC: 05.01.03*
2008 Cleaning of the Refinery Fuel
Oil Tank 404
Not
available 249
2008 WWTP Off Test and Storm Ponds
desludge (WWTP)
Not
available 696
615 t of Sludges from
physicochemical
treatment containing
dangerous substances
(19.02.05*) and 81 t of
Sludges from on-site
effluent treatment
containing dangerous
substances (05.01.09*)
2009
Grit
Blast
Yard
Cleaning campaign on a
Refinery area designated before
2009 to temporarily store grit
blasting materials. Some of this
material was transferred to a
different Refinery area (i.e. Grit
Blast Yard) with less capacity
and the exceeding material was
sent off-site for treatment.
Not
available 889*
Grit blasting materials
containing dangerous
substances
(EWC: 12.01.16*)
2011
Blending
and
Shipping
(B&S)
Use of the Technique COWS
for cleaning of Tank 8 (crude oil
tank)
0.45 386 Tank bottom sludges
(EWC: 05.01.03*)
(*) This quantity comprises the exceeding grit blasting materials due to the site cleaning and the
generated by business areas both sent for off-site treatment in 2009.
Chapter 4 – Results and discussion
160
4.2.6 Trends in production and costs of fluoridic caustic and all other wastes
Figure 4.7 presents the trend in the total waste production over 2007-2011 compared to
the production of fluoridic caustic. Fluoridic caustic was presented here separately and
further discussed in Sub-section 4.2.6.1 due to the quantity produced and its treatment
costs.
Figure 4.7. Total waste produced in the Refinery over 2007-2011 compared to fluoridic
caustic
The figure shows that the trend in the total waste production was markedly influenced
by the generation of fluoridic caustic which remained relatively unchanged over 2007-
2008 and then increased by 10 kt to 20.4 kt from 2008 to 2011, i.e. an increment of 96%
in four years.
Average production of all other wastes was 10.8 kt/y over 2007-2009 and then
decreased by about 3 kt in 2010 and 2011, i.e. a reduction of 28%. In terms of costs,
Figure 4.8 illustrates the trends of fluoridic caustic compared to the rest of the Refinery
waste.
0
5
10
15
20
25
30
2007 2008 2009 2010 2011
Pro
du
cti
on
(k
t)
Total waste Fluoridic caustic
Chapter 4 – Results and discussion
161
Figure 4.8. Refinery waste costs over 2007-2011
As seen in the figure, the Refinery’s total costs varied throughout three well defined
periods, i.e. 2007, 2008-2010 and 2011. In 2008 total costs rose by £1.1 M compared to
2007, i.e. an increase of 52%, remained relatively constant over 2008-2010 at £3.1 M/y
on average, and then rose by £0.96 Mt in 2011 compared to 2010, i.e. an increase of
30% over 2010-2011.
In summary Figure 4.8 highlights that:
• The annual cost of treating fluoridic caustic increased by about £0.41 M per
year from 2008 to 2011, i.e. an increment of £1.2 M in three years;
• The total of all other waste treatment costs decreased by £0.72 M to £0.67M in
2010 compared to 2009; and
• Unallocated on-site work costs were more than £1 M in 2008 and 2011,
whereas in 2007 the corresponding expenditure was only 19% of that in 2011.
4.2.6.1 Production and costs of fluoridic caustic (EWC code 05.01.11*)
Although the reasons why the production and resultant costs of fluoridic caustic
increased over the period (see Figure 4.7 and Figure 4.8) were not addressed by this
research, operating aspects which may be relevant are indicated below in other to guide
further studies on this matter. It is important to note that the production of fluoridic
caustic in the Refinery was extensively studied by Weston et al. (2008) and
improvements were subsequently introduced in the Alkylation Unit (AlkyU) which
were intended to reduce waste generation.
0.0
1.0
2.0
3.0
4.0
5.0
2007 2008 2009 2010 2011C
osts
(£
M)
Fluoridic caustic All wastes other than fluoridic caustic
Unallocated on-site work costs
Chapter 4 – Results and discussion
162
In the AlkyU, hydrofluoric acid (HF) is the catalyst used to promote the reaction
between olefins and iso-butane to produce alkylate. As HF is not totally consumed in
the reaction, some quantities of HF inevitably remain over the processing life-time of
the unit. This residual HF can be entrained by product streams or by a heavy
hydrocarbon waste stream called acid soluble oil (ASO). HF in the ASO stream is
neutralised with sodium hydroxide (NaOH) forming sodium fluoride (NaF) and water
which, together with the unreacted NaOH, forms the stream known as fluoridic caustic.
Fluoridic caustic also contains a number of other impurities including mercaptans
(Weston, et al., 2008).
Some likely changes at the operational level that could increase the production of ASO
(and in consequence increase entrained HF and production of fluoridic caustic) after
2008 together with some questions that need to be answered over these possible
disturbances follow:
1. Increase of sulphur content in the olefins feed. Was the Merox Unit upstream
AlkyU working properly? Were there any upsets reported over the period?
2. Increase of moisture (water) content in the iso-butane feed. Were the iso-butane
driers operating correctly?
3. Increase of butadiene (diolefins) content in the olefins feed. Did the
Hydroisomerisation Unit reach the targets required for this contaminant in the
period of study? and
4. An increase in ethane content in the olefins feed resulted in a poor De-ethaniser
operation?
4.2.7 Trends in production and costs of HW other than fluoridic caustic
Figure 4.9 presents the trends in (a) production and (b) costs over 2007-2011 of the
main constituents of HW other than fluoridic caustic.
Figure 4.9 (a) shows that the quantity of non-fluoridic HW varied without any pattern
over the five year period while costs of treatment presented in Figure 4.9 (b) are
dependent on the production. The costs of waste blasting materials and soil and stones
containing dangerous substances in 2008 and 2009 were not available.
The salient points revealed by Figure 4.9 (a) are:
Chapter 4 – Results and discussion
163
• The total production of oily sludge has reduced considerably since 2007 and
2008, i.e. now less than half;
• There was large production of phenolic caustic waste in 2007 and 2009; after
2009, the production decreased five-fold;
• The amount of waste blasting materials containing dangerous substances was
notably high in 2009 compared to the other years of the period, i.e. eight times
higher compared to 2011; and
• The generation of soil and stones containing dangerous substances consistently
decreased over 2007-2011, i.e. a total reduction of 0.8 kt in four years.
From Figure 4.9 (b), it can be seen that the average costs of treating oily sludge and
phenolic caustic were £432/t and £353/t respectively, whereas waste blasting materials
and soil and stones containing dangerous substances were much cheaper at £173/t and
£135/t respectively.
Sub-sections 4.2.7.1-4.2.7.4 discuss the trends in production and costs presented here by
main constituents of HW other than fluoridic caustic.
4.2.7.1 Production and costs of oily sludge from different sources
Table 4.6 presents oily sludge generated at the Refinery, indicates its sources (i.e. areas
and business units) and specifies the EWC code used to classify it.
Figure 4.10 shows detailed trends in production and treatment costs over 2007-2011.
Desalter sludge and acid alkyl sludges were not included as they were not regularly
generated and were produced in the period in smaller amounts than the rest of the
sludges (see Table I-1 of Appendix I).
Chapter 4 – Results and discussion
164
(a)
(b)
Figure 4.9. Production (a) and costs (b) of most significant HW generated at the
Refinery over 2007-2011 excluding fluoridic caustic
Table 4.6. Oily sludge generated at the Refinery over 2007-2011
Description Refinery Area (Business Unit) EWC
code
Desalter sludge BOs (CDU) 05.01.02*
Tank bottom sludge B&S (In-Shore Tank Farm) 05.01.03*
Acid alkyl sludges General On-Site Facilities/C&O (Chemical
Storage Area) 05.01.04*
Oily sludge from maintenance
operations of the plant or equipment
General On-Site Facilities (Bundle Cleaning
Area) 05.01.06*
Sludge from on-site effluent treatment
containing dangerous substances
Utility Systems (WWTP) and B&S (In-Shore
Tank Farm) 05.01.09*
∆
Sludge from physicochemical treatment
containing dangerous substances Utility Systems/WWTP 19.02.05*
□
∆This code was used in some particular cases over 2008-2010 to describe sludge generated at the WWTP and also centrifuged cake
produced during tank cleaning operations.
□According to the EWC wastes described with this code are generated as a result of Off-Site WWTP operations.
0.0
0.4
0.8
1.2
1.6
2007 2008 2009 2010 2011
Prd
ucti
on
(k
t)
Oily sludge from different sources
Wastes from cleaning of fuels with bases (phenolic caustic)
Waste blasting material containing dangerous substances (grit blast)
Soil and stones containing dangerous substances
0
200
400
600
800
2007 2008 2009 2010 2011
Co
sts
(£
k)
Oily sludge from different sources
Wastes from cleaning of fuels with bases (phenolic caustic)
Waste blasting material containing dangerous substances (grit blast)
Soil and stones containing dangerous substances
Chapter 4 – Results and discussion
165
Figure 4.10. Production and costs of oily sludge produced in the Refinery over 2007-
2011
Overall, the figure highlights that (see Table 4.5 for maintenance operations that
generated oily sludge):
• Sludges from physicochemical treatment containing dangerous substances (i.e.
sludge generated at the WWTP) were only produced in 2007 and 2008 and
accounted for one third of the total quantity of oily sludge over 2007-2011;
• The generation of oily sludges from maintenance operations varied without a
clear pattern and was particularly high in 2008 and 2009; in 2009 the generation
was approximately six times higher than in 2011; and
• Tank bottom sludges were not generated in 2009 and low in 2010.
As can be seen in Table I-1 of Appendix I, oily sludge from all sources was incinerated.
The costs of treatment, shown in Figure 4.10, varied with the production; however it can
be estimated that costs decreased dramatically from 2009 to 2010, i.e. a reduction of
£233/t or 42%.
Although, as seen in Figure 4.10, the production of oily sludge from different sources
varied without any pattern throughout the period, some variations for specific types of
sludge are explained as follows.
0.0
0.2
0.4
0.6
0.8
0.0
0.4
0.8
1.2
1.6
2007 2008 2009 2010 2011
Co
sts
(£
M)
Pro
du
cti
on
(k
t)
Production of sludges from on-site effluent treatment containing dangeroussubstances (05.01.09*)
Production of tank bottom sludges (05.01.03*)
Production of oily sludges from maintenance operations of the plant or equipment(05.01.06*)
Production of sludges from physicochemical treatment containing dangeroussubstances (19.02.05*)
Total costs of treatment
Chapter 4 – Results and discussion
166
Sludges from effluent treatment containing dangerous substance (EWC codes 19.05.05*
and 05.01.09*)
The production of these sludges in 2008 was particularly affected by desludging
activities at the WWTP (see Table 4.5). The Surge, Off-Test and Storm Ponds were
cleaned, generating oily and biological sludges and sediment which were incinerated.
Biological sludge and sediments from the off-test and storm ponds (mentioned in the
previous sentence) were incinerated because they failed the WAC test and in
consequence were classified as hazardous waste.
Oily sludge from maintenance operations of the plant or equipment (EWC code
05.01.06*)
Increases in 2008 and 2009 of this sludge oily sludge resulted from operations such as
chemical cleaning of vessels, heat exchangers and spillage clean ups. In 2008, C&O
turnaround (TA) (see Table 4.4) influenced the generation of this type of sludge.
In 2009, sludge mostly resulted from cleaning the VBU and decoking the heaters. Over
2007-2011, there were two procedures in place to collect and dispose of this type of
sludge. Depending on the quantity produced, it could be either put into drums and sent
to incineration or collected in tanks and discharged into the surge pond of the WWTP.
During TA events, the second procedure was used and the sludge was mixed with the
liquid effluents from different units, temporarily stored and discharged to the WWTP
when the TA cleaning phase finished.
Tank bottom sludge (EWC code 05.01.03*)
The production of tank bottom sludge (which was incinerated off-site) varied in the
period as seen in Figure 4.10. Different tanks were in service but those which were
expected to produce more sludge were cleaned in 2007, 2008 and 2011. In 2007 one
slop tank was serviced (Tank 62) which generated 450 t of sludge. In 2008 a fuel oil
tank (Tank 404) was cleaned and generated 249 t of oily sludge and in 2011 a crude oil
tank (Tank 8) generated 386 t of sludge (see Table 4.5).
This research could not explore the impacts on sludge production caused by the number
of tanks in service and the type of material stored due to limited information in the
waste contract reports. In consequence, a diary of tank cleaning events and type of
Chapter 4 – Results and discussion
167
material stored should be kept in future. In order to relate the quality of the products
stored with the production of sludge, some characterisation data such as product origin,
API gravity, density, viscosity, sulphur and nitrogen content, etc. should also be
gathered and analysed.
It should be noted that, according to the Waste Contract Reports, tank bottom sludge
was not produced in 2009. This is impossible because a number of tanks were in
service, as indicated by the Tank Risk Based Inspection (RBI) programme which
establishes a schedule of regular tank servicing every year in order to comply with
statutory tank tests. Missing or misleading data when reporting the EWC code will need
to be further investigated and/or more details provided in future waste contract reports
regarding tanks in service and quantity of sludge produced.
In terms of costs of treatment, they varied with production as seen in the figure. The
significant reduction per tonne incinerated seen from 2009 to 2010 could be influenced
by incentives introduced by the Waste Contractor to the Refinery when a new service
contract was discussed in 2009 and treatment was proposed at lower costs.
4.2.7.2 Production and costs of phenolic caustic (EWC code 05.01.11*)
In the Refinery, phenolic caustic is produced in the Merox Units after removal of
mercaptans and other sulphur compounds from light hydrocarbons with a caustic
solution. The spent caustic solution can be treated at the WWTP but treatment is limited
by process conditions, specifically the content of mercaptans, sulphides and phenols.
The production of phenolic caustic waste shown in Figure 4.9 (a) corresponds to the
quantity that could not be processed at the WWTP and was sent off-site for incineration.
Hence to determine the actual production of phenolic caustic over 2007-2011, further
investigation will need to be carried out to quantify generation at source and determine
possible upsets at the Merox Units, in particular in 2007 and 2009, i.e. the years when
the production was higher than the rest of the period.
Here the use of KPIs may be particularly useful for analysis, monitoring and control of
the Merox Units’ performance. For instance, one KPI could be developed based on the
sulphides content in the Merox feed/t of phenolic caustic produced.
Chapter 4 – Results and discussion
168
4.2.7.3 Production and costs of waste blasting materials (EWC code 12.01.16*)
As seen in Figure 4.9 (a), the production of this waste (a.k.a. grit blast) increased in
2009 in contrast to the rest of the period. This rise occurred as the spent material
temporarily stored in the Refinery was transferred from one site to another with less
capacity and a cleaning campaign took place to remediate the site (see Table 4.5). As
this material was disposed together with the spent grit blast produced due to the 2009
Refinery-wide cleaning activities, individual amounts could not be determined. In the
context of this research, the production of grit blast could not be related to specific
process units, equipment or tanks so these aspects could be considered in further work.
As grit blast is used site-wide all year round, an opportunity to improve management of
this waste should be considered using partial or total decontamination and re-use on-
site. Here also a KPI could help to monitor performance and promote environmental
stewardship at a process unit level.
4.2.7.4 Production and costs of soil and stones containing dangerous substances (EWC
code 17.05.03*)
The generation of this waste consistently decreased over 2007-2011, as seen in Figure
4.9 (a). This may be the result of the implementation at the Refinery of a prevention
system which, among other objectives, aimed to minimise the occurrence of loss of
containment causing tank bund spillages, drains flooding, etc. It may be useful to add
comments on the Waste Contract Reports about incidents reported on this prevention
system regarding loss of containment in order to understand future trends in the
production of this waste.
4.2.8 NHW production and costs
Figure 4.11 presents the trends in the quantity produced and costs of the most
significant constituents of NHW over 2007-2011.
Chapter 4 – Results and discussion
169
Figure 4.11. Production and costs of NHW over 2007-2011
The figure shows that:
• Less spent FCCU Catalyst was produced over 2008-2010 compared to 2007 and
2011; on average the quantity generated over 2008-2010 was 3.2 kt/y, i.e. 0.7 kt
or 22% w/w less than the amount produced in 2011;
• The production of metals varied over the period; the maximum year-on-year
variation was 0.5 kt between 2009 and 2010, the years when production was
highest and lowest respectively;
• The generation of mixed municipal waste increased by 0.6 kt to 1.3 kt in 2011
compared to 2007, i.e. a rise of more than 90% over 2007-2011 excluding 2008
when the production was similar to 2011;
• The production of alumina and molecular sieve materials other than FCCU
declined by 0.3 kt in 2009 compared to 2008 (i.e. a reduction of 62% w/w) and
then remained relatively stable over 2009-2011;
• The refinery incurred no charges for the recycling of spent FCCU catalyst and
metals;
• Although costs of mixed municipal waste varied with waste production over the
period, a decrease occurred over 2008-2009; from the figure, the cost of treating
this waste decreased by £25/t in 2009, i.e. a decline of 23% compared to 2008;
this reduction remained in 2010 and 2011; and
• Over 2009-2011 costs of alumina and molecular sieve materials other than
FCCU increased independently of their production, i.e. £192/t, £260/t and £286/t
respectively each year.
0
50
100
150
200
250
300
350
400
0.0
0.5
1.0
1.5
2.0
2.5
3.0
3.5
4.0
4.5
2007 2008 2009 2010 2011
Co
sts
(£
k)
Pro
du
cti
on
(k
t)
Spent FCCU catalyst production
Metals production
Mixed municipal waste production
Production of alumina and molecularsieve materials not from FCCU
Mixed municipal waste costs
Costs of alumina and molecular sievematerials not from FCCU
Chapter 4 – Results and discussion
170
The following sub-sections discuss the main issues with regard to the production and
costs of the main constituents of NHW.
4.2.8.1 Spent FCCU catalyst (EWC code 16.08.04)
The decrease of this waste seen in 2008 (Figure 4.11) resulted from the TA of this unit
as presented in Table 4.4, but the reasons why waste production also declined in 2010
could not be identified from the data available. This waste is generated in the form of
fines which must be withdrawn from the unit and replaced with fresh catalyst. The
analysis of the production and control of catalyst fines has been studied in the Refinery
intensively, although from the waste management perspective the development of KPIs
such as quantity of fines generated per amount and type of feed processed would be of
help to analyse the situation retrospectively.
4.2.8.2 Metals (EWC code 16.08.04)
Metals (a.k.a. scrap metals) are not continuous waste streams. They depend not only on
the type of activity taking place at the Refinery (e.g. TA) but also on the number of
metallic materials and equipment items to be discarded due to mechanical failures or
because they have reached the end of their certified life. As seen in Figure 4.11, metal
waste production varied within a narrow range in the whole period. In 2007 the highest
production was reached as some quantities produced in the 2006 Black Oils (BOs) TA
remained at the Scrap Yard until 2007 and were sent for recycling together with the
production of 2007. It was not possible to differentiate between the two loads of metals.
In terms of costs and according to the Waste Contract Reports, no charges applied for
their recycling within this period.
To improve scrap metals segregation, different measures in the Refinery have included
higher number of dedicated and labelled skips across the site and personnel awareness
campaigns. Other measures could also include an inventory of metals per business unit
involving quantity, type and grade of metal to facilitate future analysis of materials
flows and forecast the production of this waste.
Chapter 4 – Results and discussion
171
4.2.8.3 Mixed municipal waste (EWC code 20.01.03)
The generation of mixed municipal waste, or everyday rubbish, was expected to
increase during activities such as TAs when the number of personnel on-site rose. As
seen in Figure 4.11, the production of this waste was relatively stable in the period with
slight increases in 2008 and 2011 when TAs took place in the Cracking and Olefins area
and Amine and Sulphur Recovery Units (i.e. ARU and SRU respectively) (see Table
4.4).
This waste stream has been of particular interest in the Refinery where special
campaigns have been mounted to improve its segregation and thereby minimise the
amount sent to landfill. Over the period covered by this research, the fraction recycled
remained at 75%, although the waste contractor proposed especial campaigns to
increase this proportion to 80%. In terms of costs per tonne, lower costs of treatment
seen at the end of the period were due to incentives introduced by the waste contractor.
4.2.8.4 Spent FCCU catalyst (EWC code 16.08.04) not from FCCU
This waste classified with the same EWC as Spent FCCU catalyst results from the site-
wide use of the similar alumina and molecular sieve materials in processes such as
drying, separation and purification of liquids and gases to meet specifications for
feedstocks or final products. Such materials are normally regenerated on-site and used
many times before recycling into the cement industry. The life-span is determined
mainly by the severity of the operating conditions (e.g. amount of contaminants in the
feed) which can vary especially during process units upsets.
According to the results shown in Figure 4.11, the highest production was reached in
2008 when a TA took place in the C&O area and different absorbers and guard beds
were in service. This research did not investigate the production of this waste from
specific business units. Thus there is an opportunity to analyse the production of this
waste from such operations and the extent to which units upsets and sorbents
regeneration cycles influence the life-span of the raw alumina and molecular sieve
materials.
On the Waste Contract Reports, no charges were made for the recycling of this waste in
2008 and the reasons why costs per tonne increased after 2009 could not be identified.
Chapter 4 – Results and discussion
172
Future research could include identification of the different sites where this waste was
recycled and the terms and conditions that applied to the services contracts.
Additionally it would be useful to perform cost-benefit analysis on new materials with
better dehydration properties and higher resistance to contaminants.
4.2.9 Refinery Waste and Cost KPIs over 2007-2011
To obtain an overall perspective of the Refinery’s waste performance and provide
feedback to business units, the Waste and Cost KPIs (defined in Table 3.1) were
calculated over 2007-2011 (Figure 4.12). The quantity of crude oil processed over
2007-2011 used for the calculation of the Refinery Waste KPI is presented in Appendix
J. This Appendix also reports the amount of alkylate produced over 2007-2011 used to
calculate the Alkylate Waste KPI shown in Figure 4.13. Waste and Cost KPIs per type
of waste are reported in Appendix K.
Figure 4.12. Refinery Waste and Cost KPIs over 2007-2011
As seen in Figure 4.12, the quantity of waste produced at the Refinery increased
independently of the quantity of crude oil processed, suggesting that precursors of waste
were those raw materials such as chemicals, catalysts, etc. The figure also shows that
increments in waste generation took place every two years at rates of 0.3 and 0.4 kg
0
20
40
60
80
100
120
140
160
0
1
2
3
4
5
6
2006 2007 2008 2009 2010 2011 2012
No
rma
lise
d C
ost
(£/t
wa
ste
)
No
rma
lise
d T
ota
l W
aste
(k
g w
aste
/t
cru
de
)
Normalised Amount of Total Waste KPI Normalised Cost per Total Waste KPI
Chapter 4 – Results and discussion
173
waste/t crude oil processed over 2008-2009 and 2010-2011 respectively. However the
figure also shows variations in the Cost KPI over the period. It shows a usually low
value in 2007 compared to the rest of the period, i.e. 50% lower than the average value
over 2008-2011, and a reduction of £17/t waste in 2009 compared to 2008 despite the
rise in the amount of waste generated. This trend behaviour could be related to
incentives introduced by the waste contractor in 2009 when a new contract was agreed
and special cleaning campaigns involving mobilisation of equipment and personnel and
therefore associated with extra costs (see Table 4.5).
In order to further analyse the production of fluoridic caustic, a KPI was calculated
based on the quantity of this waste normalised with alkylate production. Figure 4.13
reports the values over 2007-2011. As seen, the production of fluoridic caustic
increased steadily over 2007-2011, independently of the amount of alkylate produced.
Figure 4.13. Normalised Amount of Alkylate Waste in the Refinery over 2007-2011
4.3 Refinery waste production and costs in 2012
Continuing on from the five year review over 2007-2011, the amount of Refinery waste
generated, off-site treatment and unallocated on-site work costs in 2012 are summarised
in Table 4.7.
As seen in the table, waste production and costs in 2012 decreased compared to 2011
(see Table 4.1), i.e. 30% less (8.7 kt) in the quantity produced and 25% (£678 k) less in
the costs of treatment. Unallocated on-site work costs in 2012 also continued to
represent important expenses for the Refinery, i.e. 59% of the total waste costs. For this
0
4
8
12
16
20
2006 2007 2008 2009 2010 2011 2012
No
rma
lise
d A
mo
un
t o
f A
lkyla
te
Wa
ste
(K
g f
luo
rid
ic c
au
sti
c/t
alk
yla
te p
rod
uce
d)
Chapter 4 – Results and discussion
174
category there was an increase of £1.52 M, i.e. an increment of more than 100%
compared to the expenditure in 2011.
HW Disposed continued to account for the largest waste stream generated in the
Refinery, i.e. 75.6% w/w, and the costliest, i.e. 91% of the total HW and NHW costs.
However, it is notable that compared to 2011 (see Table 4.1) the production of HWD in
2012 dropped by 6.35 kt, i.e. a decline of 29% w/w, and the treatment costs decreased
by £652 k. On the other hand, NHW in 2012 was mostly recycled but also produced in
lower amounts compared to 2011, i.e. 2.19 kt less. In terms of costs, the Refinery paid
£35.3 k less in 2012 for the recycling of NHW compared to 2011.
Table 4.7. Refinery waste production and costs in 2012
2012
Waste description Amount Cost
(kt) (£k)
Hazardous Waste (HW)
HW Disposed 15.4 1,847
HW Recycled 0.068 16.7
Total HW 15.5 1,864
Non-Hazardous Waste (NHW)
NHW Disposed 0.298 30.2
NHW Recycled 4.5 133.7
Total NHW 4.8 163.9
Total waste (HW+NHW) 20.3 2,028
Unallocated on-site work costs N/A 2,943
TOTAL 20.3 4,971
Detailed breakdowns of the quantity produced and off-site costs per type of waste are
presented in Appendix M. Table 4.8 presents the largest HWD and NHWR generated in
2012 and costs of their treatment.
Chapter 4 – Results and discussion
175
Table 4.8. Most significant HWD and NHWR generated in the Refinery in 2012
Waste description Disposed/Recycled
code
Amount Costs
(kt) (£k)
Hazardous Waste
Wastes from cleaning fuels with bases (fluoridic caustic) D9 13.08 1,206
Oily sludges from different sources D10 1,77 451.5
Mixed municipal waste D5 0.25 20.7
Waste blasting material containing dangerous substances D5 0.23 32.9
Non-Hazardous Waste
FCCU catalyst. E-cat and fines exported R5 2.73 0
Metals R4 0.79 0
Mixed municipal waste R11 0.74 62.12
Spent Fluid Catalytic Cracking Catalyst (except 16.08.07)
not from FCCU R5 0.24 69.8
As seen in the table, the main components of HWD and NHWR were the same as over
the period 2007-2011.
The reductions in waste production and costs of treatment in 2012 compared to 2011
were mainly influenced by the decline in the production of fluoridic caustic (the largest
component of HWD). Two events influenced this reduction:
• The 2012 Refinery TA that took place in the BOs area required (for economic
reasons) the AlkyU to shut down for two months.
• Changes in the temperature conditions of the re-run column of the AlkyU
reduced the production of ASO, entrained HF and (in consequence) fluoridic
caustic waste.
On the other hand the reduction in the production and costs of Non-Hazardous Waste
Recycled (NHWR) (the type of NHW most generated) was due to the decline in the
generation of Spent FCCU catalyst, not produced for two months during the Black Oils’
(BOs) TA as the FCCU was also shut down, and the recycling of the majority of metals
generated in the 2012 Refinery TA in 2013.
Unallocated on-site work costs rose considerably in 2012, due to desludging activities at
the Surge Pond of the WWTP, which cost £1.04 M, and some TA general cleaning
activities performed by the on-site Waste Contractor, which cost £0.91 M. In 2012,
these costs were not well detailed on the Waste Contract Reports. Full reporting is
recommended in future, to enable control and minimisation of these costs.
Chapter 4 – Results and discussion
176
There are some relevant aspects in particular with regard to the management of fluoridic
caustic identified in 2012 not analysed in the Five-Year Waste Review. These are
explained as follows.
Fluoridic caustic waste in the Refinery is temporarily stored in the AlkyU Settling Pond
which also collects an alkylation heavy waste stream called acid soluble oil (ASO).
Three phases separate inside the tank:
• at the bottom, fluoridic caustic sludge with more than 5% w/w of solids;
• in the middle, fluoridic caustic with less than 5% w/w of solids; and
• at the top, ASO which is normally withdrawn from the tank and recycled
through the Refinery Slop System.
Solid content is important because it defines the cost of treatment. The logistics for the
collection of fluoridic caustic involves the daily hiring of tankers with a capacity of
approximately 21 t. On average four tankers per day are hired but as the production of
fluoridic caustic varies; there is sometimes insufficient waste to fill completely all the
tankers hired. On these occasions, the Refinery has to pay £918.4 for each tanker
cancelled if the cancellation is made with at least 24 hrs notice or £978 if the tanker is
cancelled when it arrives at the Refinery. However, since the treatment costs depend on
the amount of solids in the fluoridic caustic, if a load is sent off-site as fluoridic caustic
and after analysis has more than 5% of solids (i.e. a non-conformed load), it is classified
as fluoridic caustic sludge. In 2012 the extra costs of this sludge compared to fluoridic
caustic was £102.2/t from January to July which increased to £115.76 from July.
In 2012 the Refinery cancelled a total of 67 tankers representing an unnecessary cost of
£61.5 k. There was only one non-conformed load with an associated extra treatment
cost of £2.4 k.
4.4 Yearly Waste Monitoring
The 2013 Detailed Waste Database PI developed for the Yearly Waste Monitoring was
available on a HES Refinery network by December 2013. This database allowed to
record, sort and report detailed waste data for the analysis of Refinery performance in
2013 and is intended to be used in the subsequent years as complementary to the TR548
database (see Sub-section 2.4.4.3). The following sub-sections present and discuss the
Chapter 4 – Results and discussion
177
results of the Refinery performance on the management of waste on and off-site in
2013.
4.4.1 Overall Refinery waste performance
Figure 4.14 presents the results of the overall Refinery performance in terms of waste
production and costs in 2013 excluding metals. The production of metals, a NHWR, and
their rebate55
are reported separately.
Figure 4.14. Total Refinery waste production and costs in 2013 excluding metals
Overall, it can be seen from the figure that waste production and costs reduced in 4Q of
the year following a peak in 2Q. Off-site waste cost the Refinery £1.89 M in 2013 and
accounted for 70% of the total expenditure for waste management throughout the year.
On-site work accounted for the remaining 30% of costs, i.e. £0.83 M total, and did not
vary significantly from month to month. The figure highlights that off-site waste
treatment cost £113 k more in June, i.e. an increase of 80% compared to January, and
then decreased by 70% to December, i.e. £177 k less than the expenditure in June. The
figure also illustrates that monthly waste production varied in parallel with off-site
waste costs: it increased by 236 t per month from January to June but then declined by
1266 t per month to December. The total waste production in 2013 was 21.99 kt
55
Rebate benefits are those costs partially recovered by the Refinery from selling scrap ferrous and non-
ferrous metals to a recycling facility. The Refinery waste contractor coordinates the collection and
transportation of this material from site to the recycling facility. Transport costs are normally discounted
from the rebate costs.
0.0
0.5
1.0
1.5
2.0
2.5
0
50
100
150
200
250
300
350
400
Jan Feb Mar Apr May Jun Jul AugSep Oct Nov Dec
Pro
du
cti
on
(k
t)
Co
sts
(£
k)
Off-site waste costs On-site work costs
Waste production
Chapter 4 – Results and discussion
178
excluding metals. Table 4.9 presents the generation of metals (i.e. ferrous and non-
ferrous) and rebate costs in 2013.
Table 4.9. Production of metallic waste and rebate costs in 2013
Metals Production
(kt)
Rebate costs
(£k)
Ferrous 1.80 278.4
Non-ferrous 0.066 86
As seen in the table, the majority of metallic waste generated on-site was ferrous, but
the Refinery could recover more rebate per tonne from non-ferrous metals: non-ferrous
metals were sold at £1,303/t on average, compared with £155/t for ferrous waste. Later
in this section, further details are provided with regard to the type, quantity and rebate
received for ferrous and non-ferrous metals. As mentioned previously, metals in the
Refinery are not produced and sent for recycling frequently. Once they are generated at
business units they are transported to the Scrap Yard where they are temporarily stored.
This means that metallic waste of the Refinery recycled off-site is a mixture of scrap
generated site wide and therefore, the origin and ownership cannot be attributed. The
waste contractor reports metals from the Scrap Yard as “scrap metals”.
Figure 4.15 shows how the Refinery performed in terms of type of waste generated, i.e.
HW and NHW, and treatment, i.e. disposed and recycled.
(a) (b)
Figure 4.15. Refinery waste production (a) and off-site costs (b) by type of waste in
2013
17.6 kt
0.68 kt
0.19 kt
3.52 kt
HW Disposed HW Recycled
NHW Disposed NHW Recyled
£1,645 k
£139 k
£18.5 k £84.3 k
HW Disposed HW Recycled
NHW Disposed NHW Recyled
Chapter 4 – Results and discussion
179
The figure illustrates that HWD represented the largest stream, i.e. 80% of total waste in
2013, and the costliest to treat, i.e. 87% of total off-site waste costs. It also shows that
although HWR was generated in minor amounts, it was the second most expensive
waste to treat, i.e. 7% of the total off-site costs. Similar to Figure 4.3 for the period
2007-2011, Figure 4.16 indicates for 2013 that the Refinery disposed and recycled
waste through six different methods.
Figure 4.16. Refinery waste production in 2013 per treatment method
The figure highlights the following aspects:
• the Refinery treated the largest amount of waste, i.e. HWD, by physico-chemical
treatment;
• the second largest amount of waste generated at the Refinery, in particular
NHW, was treated through the recycling and reclamation of inorganic materials;
• incineration was used mainly to treat HW;
D10: Incineration on land (4%)
883 t HW/1 t NHW£369 k
D9: Physico-chemical treatment not specified elsewhere which results
in final compounds or mixtures which are
disposed of by any of the operations
numbered D1 to D12 (76%)
16,591 t (HW)£1,251 k
D5: Specially engineered landfill (e.g. placement into lined discrete cells which are capped and
isolated from one another and the environment, etc
(1%)125 t HW/185 t NHW
£44.2 k
R3: Recycling/reclamation of
organic substances which are not used as
solvents (including composting and other
biological transformation
processes)(2%)
429 t HW/85 t NHW£95.2 k
R5: Recycling/reclamation of
other inorganic materials
(15%) 189 t HW/2989 t NHW
£77.8 k
R11:Use of wastes obtained from any of
the operations numbered R1 to R10
(2%)60 t HW/456 t NHW
£50.5 k
Chapter 4 – Results and discussion
180
• landfill was the least preferable option to treat waste; compared to the period
2007-2011 (Figure 4.3) the amount of waste disposed by this method was
reduced significantly, i.e. from 3.8% to 1%;
• it can be estimated from the figure that incineration was the method most
expensive to treat waste, i.e. £417/t followed by recycling/reclamation of
organic substances, i.e. £185/t; and
• recycling/reclamation of other inorganic materials was the cheapest method to
treat waste.
Appendix N presents the detailed data on a monthly basis of the quantity of waste
produced and off-site costs per treatment method and EWC codes in 2013. It also lists
the off-site disposal and recycling facilities and their location the Refinery used to treat
its waste.
The production and off-site costs in 2013 showed that May and June were the months
with the largest amount of waste generated and highest expenses. Three events
influenced these trends: the desludging campaign that took place at the Settling Pond of
the AlkyU, which generated additional amounts of fluoridic caustic filter cake, the
removal of soil contaminated on the E-track pipe (B&S area) due to an oil spill and the
production of phenolic caustic which could not be treated at the WWTP these months.
For this latter, a KPI could be developed to inform about upsets in the Merox Units
which made phenolic caustic outside specifications to be treated at the WWTP. After
this period, both production and off-site treatment costs declined, mainly because the
generation of fluoridic caustic dropped. This resulted from new adjustments to the
AlkyU temperature conditions which significantly reduced production of ASO. On-site
work costs (previously named as unallocated on-site work costs) also influenced the
overall performance of the Refinery in terms of its expenses as they declined after June.
This type of costs is discussed in the following Sub-section.
With regard to the production of metals, ferrous waste accounted for the majority
recycled but was the type for which the Refinery received least rebate revenue. The total
amount generated in 2013 included metals produced during the 2012 Refinery TA: the
increase of 1.08 kt compared to 2012 occurred for this reason. Since it was not possible
to determine/assign ownership, in particular for ferrous metals which are mixed at the
Chapter 4 – Results and discussion
181
Refinery Scrap Yard and not allocated to business units in the Waste Contract Reports,
it is recommended to compile the following information in future:
• waste producers and estimated quantity generated as reported on the Refinery
TR548 Waste Database; and
• actual figures of metals recycled including rebate costs as reported on the Scrap
Metals Monthly Reports produced by the Refinery Main Stores.
In terms of type of waste (i.e. HWD, HWR, NHWD and NHWR), performance in 2013
remained the same as over the previous six years: HWD was the largest and costliest
followed by NHWR. Similarly the main components of HWD were fluoridic caustic,
oily sludges from different sources and phenolic caustic while the principal elements of
NHWR were Spent FCCU catalyst, spent alumina and molecular sieve materials also
classified as Spent FCCU catalyst and mixed municipal waste.
Although in the case of HWD it is expected that this trend will continue until the raw
materials which promote its production can be substituted by less hazardous materials,
alternative treatment methods could be implemented to reduce the production of these
wastes. In the case of fluoridic caustic, the Refinery has already carried out cost-benefit
analysis of alternative treatment options but oily sludge has been less studied; therefore
it represents an opportunity for improvement. Studies are also in hand on spent FCCU
catalyst, not only to reduce fines generation but also to identify different catalytic
materials with better attrition resistance. With regard to mixed municipal waste,
segregation measures on-site already implemented have resulted in considerable
reductions in the amount sent to landfill compared to the period 2007-2011.
The waste treatment methods employed in 2013 were the same as those used in the
previous six years, although reduction in the quantity of oily sludge generated and also
its treatment through a method other than incineration could reduce off-site waste costs.
4.4.2 Detailed on-site work and off-site waste costs
The total Refinery expenditure for waste management comprised on-site work and off-
site costs as indicated and described in Sub-section 3.2.2. Breakdowns of these costs are
shown in Figure 4.17.
Chapter 4 – Results and discussion
182
Figure 4.17. Detailed Refinery on-site work costs in 2013
As seen in the figure, track labour was the most expensive component of the on-site
work costs, followed by vacuum trucks, i.e. £337 k and £209 k. They accounted for
66% of the total on-site work costs. The figure also shows that overall on-site work
costs decreased after June, i.e. an expenditure of 40% or £32 k less in December
compared to June. On-site work cost the Refinery £0.83 M total in 2013.
The trends in off-site costs are seen in Figure 4.18. Overall, a peak in these costs was
seen in 2Q. Costs of consignment notes and transport kept stable throughout 2013 while
waste treatment costs increased over January-June by £118 k and then decreased to
December by £146 k. Waste treatment was the costliest element of off-site waste costs;
it represented 56% of this type of cost, i.e. £1.06 M total 2013. Waste transport cost
£0.78 M in 2013 while consignment notes £46 k.
Figure 4.18. Detailed Refinery off-site waste costs in 2013
0
20
40
60
80
100
Jan Feb Mar Apr May Jun Jul Aug Sep Oct Nov DecC
os
ts (£
k)
Machinery and other rentals Monthly management fee
Non-hazardous other costs Track labour
Vacuum trucks
0
40
80
120
160
200
240
280
Jan Feb Mar Apr May Jun Jul Aug Sep Oct Nov Dec
Co
sts
(£
k)
Waste treatment Waste consignment notes Waste transport
Chapter 4 – Results and discussion
183
From the five elements which comprise on-site work costs, reductions in vacuum truck
and non-hazardous other costs after June are notable. The reductions resulted from
control measures implemented at the Refinery which included:
• monthly review of the number of vacuum trucks hired and the number
effectively used;
• analysis of the number of journeys and collections carried out;
• estimations of the quantity of waste to be collected from drains and sumps; and
• incentives introduced by the Waste Contractor on the purchase of materials such
as cardboard and steel drums, stickers for labelling, etc.
Variations in off-site waste costs were influenced mainly by the increase in costs of
treatment which at the same time were affected by the rise in waste production, in
particular in May and June. It is important to emphasise that transport costs remained
the same in the period, with a slight decrease after August due to the reduction in the
production of fluoridic caustic and the introduction of new collection measures which
included the use of bigger tankers. The use of tankers with more capacity increased the
amount of fluoridic caustic collected and transported per trip and reduced the number of
loads sent off-site for treatment.
4.4.3 Most significant waste streams in 2013
Appendix N details all type of waste generated and off-site costs throughout 2013.
Figure 4.19 presents the quantity and costs of the most significant wastes.
Figure 4.19. Production and costs of most significant wastes in 2013
0
20
40
60
80
100
120
140
160
0.0
0.5
1.0
1.5
2.0
2.5
Jan Feb Mar Apr May Jun Jul Aug Sep Oct Nov Dec
Co
sts
(£
k)
Pro
du
cti
on
(k
t)
Production of fluoridics
Production of Spent FCCU catalyst
Production of all other wastes
Off-site costs of all other wastes
Off-site costs of fluoridics
Chapter 4 – Results and discussion
184
As can be seen and estimated from the figure, fluoridic caustic, a HWD, was the most
produced and costliest waste in 2013 at 16.6 t and £1.25 M total; its production
accounted for 75% w/w of the total Refinery waste and 65% of the total off-site costs.
The figure shows that over the second half of the year the production of fluoridic caustic
declined, i.e. a decrease in 802 t in December compared to July, which represented a
reduction of 45%; as this production decreased so did the off-site costs. The Refinery
paid £50.5 k less in December compared to July for the treatment of this waste, which
represented a reduction of 44%. Specifically on the management of fluoridic caustic, the
Refinery paid the Waste Contractor the following expenses:
• £14.7 k for late cancellation of 16 tankers;
• £14 k for hiring 14 tankers which arrived the Refinery but no loads of
fluoridic caustic were available to collect; and
• £5.6 k for one non-conformed load, i.e. a load sent off-site as fluoridic caustic
and a sample analysis at the treatment facility indicated it was sludge as
contained more than 5% solids.
Figure 4.19 also shows that another significant waste was Spent FCCU catalyst, a
NHWR. The quantity produced was 2.86 kt in 2013 which accounted for 13% of total
Refinery waste; no charges applied for the recycling of Spent FCCU catalyst overseas
except in August and October when samples of it were sent to local recycling and
charges applied. The amount of Spent FCCU catalyst produced in December was not
available at the moment of the collection of data.
All other wastes accounted for the remaining 12% of the total, i.e. 2.6 kt. Table 4.10
lists the most produced and expensive to treat within this proportion.
In the case of the production of metals (a NHWR), Appendix O details the quantity
produced and rebate costs in 2013 on a monthly basis. As an occasional waste, the
production of metals varied without any pattern throughout the year. Figure 4.20 (a) and
Figure 4.20 (b) illustrates the total production by type of ferrous and non-ferrous metals.
Chapter 4 – Results and discussion
185
Table 4.10. Production and costs of less significant wastes in 2013
Type of waste Treatment Waste description Amount
(t)
Costs
(£k)
HW
Disposed
Oily sludge from
different sources* 315 128
Spent filter clays 224 90.9
Wastes from cleaning
of fuels with bases
(Phenolic caustic)
218 84.8
Recycled
Soil and stones
containing dangerous
substances
402 80.8
Spent filter clays 115 22.6
NHW
Disposed/Recycled Mixed municipal waste 601** 51.3**
Recycled
Spent FCCU catalyst 2,861*** 4,151****
Spent fluid catalytic
cracking catalysts
(except 16.08.07*) (not
from FCCU)
110 29.3
(*) Include the wastes described in Table 4.6
(**) 75% was recycled
(***) 99.5% recycled overseas and no charges applied to the Refinery
(****) Charges due to local recycling of samples
As seen in the figure, carbon steel accounted for 88.2% of the total metals and stainless
steel was the second most common proportion at 8.3%. Within the remaining 3.5 %,
brass was higher than hastelloy. In terms of rebate costs, the Refinery recovered more
by selling hastelloy and monel, at £4.2 k/t and £3.8 k/t respectively. Carbon steel was
sold at £0.13 k/t.
As seen previously, waste streams most generated and costliest in 2013 included
fluoridic caustic and metallic waste. Here relevant aspects of their management are
highlighted in order to explain savings in 2013 compared to 2012 in the management of
fluoridic caustic and make some recommendations to forecast production of metallic
waste.
The management of fluoridic caustic has represented a challenge to the Refinery not
only from an environmental perspective but also due to the high costs. It was seen in
Chapter 4 – Results and discussion
186
Section 4.3 that collection of fluoridic caustic represented important expenses to the
Refinery in 2012, i.e. a total of £63.9 k which included cancelled and non-conformed
loads.
(a) (b)
Figure 4.20. Ferrous (a) and non-ferrous (b) metals produced in the Refinery in 2013
In 2013 the Refinery introduced improvements in logistics involving more accurate
estimations of the quantity of fluoridic caustic to be collected before hiring the tankers.
Additionally the cleanup of the settling pond also helped to reduce uncertainties in
predicting these amounts. As a result of these measures, the number of cancelled loads
was reduced by more than 50%, from 67 to 30, which represented savings to the
Refinery of £32.9 k compared to 2012.
In terms of metals, trends are discussed for the whole year and not on a monthly basis as
most of these materials were accumulated for unknown periods of time at the Scrap
Yard in 2013 and then sent together for recycling. In fact the majority of metals
generated in the 2012 Refinery TA were recycled in 2013 and reported as 2013 scrap.
As seen in Figure 4.20 (a), the type of metal most generated was carbon steel followed
by stainless steel. These results were expected as generally in oil refineries the majority
of pipelines, process unit equipment and storage tanks are built from carbon steel except
those which are subjected to highly corrosive environments such as the Alkylation Unit
(where HF circulates throughout the plant) and sour gas systems. Special metals such Ni
alloys (monel) are largely restricted to use in some parts of reflux drums, condensers
and reboilers.
1.65 kt£208 k
0.16 kt£70 k
Carbon steel
Stainless steel
Aluminium
3 t£1.8 k
Brass
28 t£55.3 kChrome
20 t£3.2 k
Copper
9 t£6.5 k
Hastelloy
2 t£7.3 k
Monel
3 t£11.9 k
Chapter 4 – Results and discussion
187
Although the production of scrap metals is foreseeable in the short term as the
equipment and pipework construction materials are known, it may be productive to
determine if more long-term forecasting is possible by studying the relationship
between the type and frequency of scrap metals production with the number of repairs
and replacements historically performed. It also may be informative to analyse
corrosion rates associated with the quality of feedstocks and products.
4.4.4 Refinery waste ownership and performance at a business unit level in 2013
One of the main features of the 2013 Detailed Waste Database PI developed for the
Yearly Waste Monitoring is the ability to report and inform about waste performance at
business areas and units levels. In 2013 waste streams were generated at Blending and
Shipping (B&S), Black Oils (BOs), Cracking and Olefins (C&O), General on-site
facilities (Gral)56
, Utilities (Utls) and White Oils (WOs). However, since AlkyU and
FCCU from C&O produced fluoridic caustic and Spent FCCU catalyst respectively
have been already discussed, they are not included here.
Figure 4.21 shows the business areas which produced the largest quantities of waste in
2013.
Figure 4.21. Refinery waste production at the BOs, B&S and Gral areas in 2013
56
Table B-4 of Appendix B shows the business units comprised within the General On-Site Facilities
area.
60 t
217 t
13 t
140 t
88 t
7 t
0
50
100
150
200
250
300
350
Jan Feb Mar Apr May Jun Jul Aug Sep Oct Nov Dec
Pro
du
cti
on
(t)
BOs
B&S
Gral
Chapter 4 – Results and discussion
188
The figure highlights that Gral area generated the most waste over 2013, i.e. 1.12 kt
compared to 0.53 kt and 0.36 kt from B&S and BOs respectively. Production was kept
relatively stable throughout the period except in May when it increased by 135 t.
Figure 4.21 also shows that generation of waste at the BOs area was not constant
throughout the year and the maximum amount of waste produced was reached in
September, 75 t more compared to February, the month with the lowest production.
During March and April B&S generated the highest amount of waste in 2013. In March
36.5 t of scale contaminated with oil was generated due to the cleaning of an
atmospheric residue tank. In April a gasoline tank was also cleaned producing 25.6 t of
oily sludge.
Additionally, during this month, 113.4 t of contaminated soil were incinerated off-site.
This contaminated soil had been temporarily stored at the Refinery since 2012; it
resulted from a loss of containment in the bundle washing area during the 2012 TA
affecting the bund of an atmospheric residue tank.
The majority of waste streams generated in the BOs and B&S areas were incinerated
and had similar costs of treatment per tonne. However, wastes produced by the Gral
area cost less, as seen in Table 4.11.
Table 4.11. Normalised costs of waste treated from BOs, B&S and Gral Refinery areas
during 2013
Refinery area Costs
(£/t)
BOs 338
B&S 322
Gral 143
In the Utls and WOs areas, waste streams were less significant than those from BOs and
B&S, as seen in Figure 4.22.
Chapter 4 – Results and discussion
189
Figure 4.22. Refinery waste production in 2013 at the areas: Utls and WOs
The analysis of waste performance per business areas and units was carried out to
inform and promote waste stewardship at this level, which has been highlighted by this
thesis as essential for an improved environmental performance.
In the case of General on-site facilities (see Figure 4.21), a significant rise in waste
production was seen in May, due to an overflow in a sump which spilt oily wastes onto
the surrounding land. As a result, contaminated soil had to be removed and treated in an
off-site washing facility. In the BOs area in September, partial change of the Merox
Clay took place in the Kerosene Merox Unit, generating an extra amount of wastes. As
expected, B&S generated more waste in March as a VGO tank was in service and scale
contaminated with oil was generated.
The results of waste produced in the WOs and utility areas (Figure 4.22) indicated that
alumina and molecular sieve from the Unifiner, Isom and CCR/CRU were generated but
no information was available in terms of the specific driers that were in service. Here is
a further instance where the development of KPIs is appropriate to analyse performance
at a process unit level. For instance, the production of activated alumina contaminated
with hydrocarbon may be related to upsets in the unit such as increases in the water
content in the feed, losses of entrained hydrocarbons, etc.
Unifiner/IsomActivatedalumina
contaminated with
hydrocarbon
£5.6 k
£0.6 k £0.6 k
£12.8 k
£1.8 k£1.4 k
£12.6 k
0
10
20
30
40
50
Jan Feb Mar Apr May Jun Jul Aug Sep Oct Nov Dec
Pro
du
cti
on
(t)
Utls WOs
WWTPCentrifuged
cake
WWTPBiomass
Centrifuged cake
CCR/CRUActivatedalumina
contaminated with
hydrocarbon
Chapter 4 – Results and discussion
190
4.4.5 Relevant aspects of the 2013 Detailed Waste Database PI
The review of waste in 2013 using the 2013 Detailed Waste Database PI facilitated the
recording, sorting, reporting and analysis of waste production and costs on a monthly
basis. This database allowed:
• to detail on-site work activities and costs;
• to further analyse off-site treatment costs by waste treatment process (e.g. costs
of incineration, landfilling, recycling, etc), transportation from site to the off-site
treatment facility and consignment notes for the transfer of HW;
• to analyse the production of fluoridic caustic by type (i.e. fluoridic caustic and
sludge) and costs including expenses for the treatment, transportation, non-
conformed loads and cancelled loads of fluoridic caustic and sludge;
• to analyse the production and rebate costs of metals by type;
• to analyse, report and inform the production and costs of waste by business
areas and units promoting waste ownership; and
• to provide information on the treatment method and the location of the off-site
waste treatment facilities. This aspect is expected to be particularly useful for the
Refinery if the carbon footprint of the management of waste is to be calculated
in future.
4.5 Monthly waste control
Monthly waste control was performed through the development of the “Waste in Brief”
Monthly Bulletin as outlined in Figure 3.6.
Figure 4.23 shows the December 2013 bulletin. Trends shown in each section of the
bulletin were already explained in Section 4.4. As seen in the figure, Refinery waste
performance was summarised and relevant aspects pointed out. The first part of the
Bulletin, which reports the Refinery overall performance, indicated that in terms of
production and off-site costs, waste deteriorated whereas over July-December both
parameters markedly decreased. It was already seen and discussed in Section 4.4 that
fluoridic caustic mainly influenced this trend and why. In any case, this is confirmed in
the second part of the Bulletin, dedicated to performance at a business unit level. In
terms of on-site costs, the trend remained similar throughout the year, indicating that no
Chapter 4 – Results and discussion
191
major works occurred at the Refinery. In total, the Refinery spent £2.72 M of which
almost 70% was due to off-site treatment. This leads to the question of how these costs
can be reduced and the necessity to carry out further research on alternative treatment
options. With regard to on-site costs, track labour and vacuum trucks represented 66%.
In terms of environmental compliance and the waste hierarchy it is seen that there is still
room for improvement, in particular to reduce the quantity of waste disposed by
physicochemical treatment and move towards recycling methodologies.
For environmental stewardship, wastes per business areas were compared. Fluoridic
caustic and spent FCCU catalyst (wastes associated with the Cracking and Olefins
Area) were compared with all other wastes as they were the Hazardous Waste Disposed
(HWD) and Non Hazardous Waste Recycled generated in large quantities respectively.
It is noticeable that the generation of spent FCCU catalyst persisted throughout the year.
As this quantity is reported in the following month, and the project in Valero Refinery,
Pembroke finished in December 2013, it was not possible to include the amount of
spent FCCU catalyst generated in this month.
In summary, it can be said that the Waste in Brief Monthly Bulletin allows to:
• monitor and control all on-site waste;
• detect opportunities to recover value when managing waste on-site/off-site;
• identify necessary mitigation measures to prevent/reduce waste;
• promote environmental stewardship at a process unit level; and
• inform about environmental performance and compliance.
In terms of the audience, this Bulletin is suitable to management teams such as Refinery
HES, HE and Business Units, site process engineers, on-site waste contractors and the
EA.
Chapter 4 – Results and discussion
192
Figure 4.23. Refinery Waste in brief monthly bulletin December 2013
December, 2013
HES Pembroke Refinery
Waste in brief
1.9 kt of scrap metals not included in the figure were produced and
recycled in 2013 (96.5% w/w ferrous) from which the Refinery recovered £364.5 k.
£2.72 M
£1.22 M
Fluoridic caustic
0.0
0.5
1.0
1.5
2.0
2.5
0
50
100
150
200
250
300
350
400
Pro
du
cti
on
(k
t)
Co
sts
(£
k)
Total Refinery waste without metals
Off-site costs On-site work costs
Waste production
Off-site£1.89 M
On-site£0.83 M
£104 k
£100 k
£81 k£337 k
£209 k
Total Refinery on-site work costs 2013
Machinery and other rentals
Monthly management fee
Non-hazardous other costs
Track labour
Vacuum trucks
£46 k
£779 k£1,062 k
Total Refinery off-site costs 2013
Waste consignment notes
Waste transport
Waste treatment
0
20
40
60
80
100
120
140
160
0.0
0.5
1.0
1.5
2.0
2.5
Ja
nF
eb
Ma
rA
pr
Ma
yJu
nJu
lA
ug
Se
pO
ct
No
vD
ec
Co
sts
(£
k)
Pro
du
cti
on
(k
t)
Refinery wastes more generated and costliest in 2013
Production of all other wastes
Production of Spent FCCU catalyst
Production of fluoridic caustic
Off-site costs of all other wastes
Off-site costs of fluoridics
Over May-Jul desludge activities took place in the AlkyUsettling pond;In Jul operating conditions of the re-run column of the AlkyU were adjusted to reduce the production of fluoridiccaustic;No charges applied for the recycling overseas of 99.9% w/w of Spent FCCU catalyst. December figures are not included;Expensive wastes (above £400/t) were produced over Mar-Jun. Specifically they were phenolic caustic and tank bottom sludges (also generated in Oct).
£1.78 M
92% HWD 82% HWR
£0.102 M
Recycling by different methods-19% w/wPhysicochemical treatment-76% w/wIncineration on land- 4% w/wLandfill – 1% w/w
17.6 kt80%
0.68 kt3%
0.19 kt1%
3,5 kt16%
Hazardous and Non-Hazardous waste disposed and recycled
HWD
HWR
NHWD
NHWR
Total 2013Utls/WWTP (61 t of cent cake)Wos/Unif/Isom/CCR/(57 t of alumina c/wHC)
0
50
100
150
200
250
300
350
Ja
nF
eb
Ma
rA
pr
Ma
yJ
un
Ju
lA
ug
Se
pO
ct
No
vD
ec
Pro
du
cti
on
(t)
Refinery BOs, B&S and Gral waste production in 2013
Bos/KMU generated 88t of
spent filter clays in Sep
B&S in March and Apr tanks 417 and
116 generated 36.5 t and 25.6 t of scale and sludge
Gral area/pipe track generated in
May 135t of contaminated soil due to an oil spilt
Chapter 4 – Results and discussion
193
4.6 MFA applied to the Refinery TA
A complementary assessment of flows from raw materials to waste was performed in
the context of the 2012 Refinery TA, as mentioned in Section 3.3. The TA involved
shutting down, isolating, conducting preventive/corrective maintenance, partial change
of catalysts and restarting units across the entire Refinery over October-November
2012. The business units in the TA scope were CDU, VDU, CCR/CRU, Unifiner, Isom,
LPGRU, HTU-2 Steam Generation (limited mechanical works), Flare Systems
(specifically the sweet flare) and the B&S area where pipe line repairs were carried out.
HTU-1 was shutdown for mechanical works but these were limited so this Unit was not
considered as part of the TA.
The C&O area was shutdown during the TA as the CCR/CRU which produces the
hydrogen needed for low sulphur gasoline (petrol) was included in the TA and it was
estimated that importing relatively expensive FCCU feed to keep the C&O operating
would make processing during the TA uneconomic (Valero Energy Ltd., 2012).
Personnel on-site increased by approximately 1,500 people, mainly due to short-term
contractors, which increased the total workforce to almost 3000 over the period.
Many raw materials were used and/or consumed in the TA and therefore generated
waste, but only those reported by the waste contractor as “TA waste” have been
analysed here. Spent catalysts generated at the CCR/CRU, Unifiner and HTU-2
managed directly by the Refinery were also accounted as TA waste. Mixed municipal
waste was not included in the analysis as no specific raw materials were associated with
its production although it was expected that the quantities would be increased due to the
increased number of people working on-site.
4.6.1 Raw materials and waste streams used/produced in the 2012 Refinery TA
Table 4.12 lists the raw materials used and associated wastes produced during the 2012
Refinery TA.
The following sub-sections present the MFA of the materials streams shown in the
table.
Chapter 4 – Results and discussion
194
Table 4.12. Raw materials used and waste streams produced during the 2012 Refinery
TA
Raw material Waste EWC
code
Fresh Unifiner and HTU-2
catalysts, top grading and bedding
materials
Spent Unifiner and HTU-2 catalysts,
top grading and bedding materials 16.08.02*
Fresh CCR/CRU (reforming)
catalyst and bedding materials
Contaminated CCR/CRU (reforming)
catalyst unloaded including a fraction
of fines and heel catalyst
16.08.02*
Fresh blasting materials Waste blasting materials containing
dangerous substances 12.01.16*
Insulation materials
Insulation materials other than those
mentioned in 17.06.01* (asbestos)
and 17.06.03* (contaminated
insulation)
17.06.04
Absorbents, filter materials
(including oil filters not otherwise
specified), wiping cloths and
protective clothing∆
Absorbents, filter materials
(including oil filters not otherwise
specified), wiping cloths, protective
clothing contaminated by dangerous
substances
15.02.02*
Linings and refractories from non-
metallurgical process∆∆
Linings and refractories from non-
metallurgical process containing
dangerous substances
16.11.05*
Metals Metals (scrap ferrous and non-
ferrous) 20.01.40
(∆) At the Refinery these materials are called Personal Protective Equipment (PPE) and the contaminated waste “oily
PPE”.
(∆∆) They are known at the Refinery as refractory materials and the contaminated waste “refractory waste”.
4.6.1.1 Unifiner and HTU-2 catalysts
The Diesel and Naphtha Hydrotreaters Unifiner and HTU-2 respectively were shutdown
during the TA. The total inventory of HTU-2 catalyst was replaced (reactors 12-F-200,
12-F-201 and 12-F-202) and only the catalyst of train A (reactor 4-C-1A) of the
Unifiner was fully changed. Catalyst bids took place and the vendors selected for the
fresh hydrotreating catalyst were Haldor Topsoe for the Unifiner and AXENS for the
HTU-2. The spent catalysts unloaded/removed from the Unifiner and HTU-2 were
originally manufactured and delivered by Haldor Topsoe and Grace respectively. Spent
catalysts from both units were planned to be sold under a “Multi-Site Contract for sale
of Materials” and were temporarily stored at the BP bund area before shipping to EG
Chapter 4 – Results and discussion
195
Metal Corporation in South Korea, where final treatment was reported as “Recycling
Process for Spent Catalyst”.
Figure 4.24 shows a material flow diagram of the Unifiner and HTU-2 for the 2012
Refinery TA.
The following aspects which emerge from the figure are worth noting:
1. The topping material TK25 (also known as grading material, an inert solid with
very high void fraction used to trap large particulates, saturate olefins and
mitigate future pressure drop) loaded to the Unifiner cost £16.9/kg whereas the
different types of hydrotreating catalysts were much less expensive from £7.1/kg
(TK437 the cheapest) to £13.96/kg (TK709 the costliest).
2. The total amount of topping material plus hydrotreating catalyst delivered by
Haldor Topsoe to the Unifiner was higher than the amount loaded into the
reactor 4-C-1A by 310 kg (2.3% excess) excluding ceramic balls57
.
3. The material loaded into the HTU-2 reactors had low value, i.e. £8.4/kg for HR
626 main CoMo hydrotreating catalyst.
4. The total amount of grading materials plus hydrotreating catalysts delivered by
AXENS to HTU-2 was higher than the amount loaded into HTU-2 reactors by
15,850 kg (9.4% excess) excluding ceramic balls.
5. The final inventory of AXENS materials at SNAMS was not available at the
time of this research although it was reported that all the remaining fresh grading
materials and hydrotreating catalysts were sent back to this company and their
costs recovered by the Refinery at the end of the TA.
6. Catalyst removed from both units were stored in composite containers designed
specifically for national and international transportation.
7. It was reported that 100% of spent materials were sent for recycling and not for
metal reclamation due to the low cost of Ni, Mo and Co by the end of 2012; for
further reference historical pricing data of metals is available for purchase at
London Metal Exchange (LME) website (LME, 2014).
57
Ceramic balls are used to increase the distribution of gas and liquid in the reactor and support and
protect the catalyst.
Chapter 4 – Results and discussion
196
8. The estimated costs for the recycling of spent/removed materials were £147.2 k
although this figure was subject to change as by the end of 2013 the spent
catalysts and grading materials were still at the Refinery.
9. The Refinery spent in total £1.75 M for the catalyst changeout, including costs
of fresh catalytic and grading materials, storage containers and estimated
recycling costs, excluding the costs of ceramic balls and catalyst sulphiding.
As seen in the results, for the Unifiner the topping materials, used to guarantee good
performance of the hydrotreating catalyst, were more expensive than the hydrotreating
catalyst itself, suggesting an opportunity to source less expensive materials for these
purposes.
Purchasing of Unifiner catalyst was particularly accurately executed as very low excess
of material remained after loading the reactors. This aspect reveals that MFA can
inform about performance also from a management point of view.
With regard to the selection of the waste (spent materials) treatment option, there was
no evidence that environmental aspects were taken into account.
4.6.1.2 CCR/CRU catalyst
The platinum based reforming catalyst from the CCR/CRU was partially replaced
during the TA. A top-up of fresh catalyst was required to compensate losses as fines and
heel catalysts; heel catalyst is a fraction which contains large amounts of coke and is
collected from the bottom and the walls of the reactor during normal operations.
As the CCR/CRU was originally loaded with an UOP catalyst, the same vendor and
type of catalyst was recommended for the top-up. Since the quantity of fines and heel
catalyst to be unloaded were unknown, UOP recommended the Refinery to order 15%
of the total load of the reactor. Fresh catalyst not loaded after the TA was planned to be
stored dry and used later as fines top-up. All the catalyst was unloaded during the TA,
segregated and stored in flow bins. This type of container provided reliable, safe,
efficient and environmentally sound storage whilst some other activities were being
carried out at the unit.
Chapter 4 – Results and discussion
197
UnifinerReactor 4-C-1A
HTU-2Reactor 12-F-200
HTU-2Reactor 12-F-201
HTU-2Reactor 12-F-202
Collection
“Packgen”
catalyst
containers
£25,392
Storageat the Refinery BP
bund
Recycling at EG Metal
Corporation, South Korea
Costs breakdown
Shipment: £27,731
Recovery: £47,539
Storage: £71,308?
Administrative: £595
Total: £147,173
HR 626 (CoMo) high
act ivity hydrotreat ing
catalyst
£1,370, 156
164,000
kg
kgCeramic balls
£
ACT-069 inert grading material
£14,606 1670 kg
ACT-077 inert grading material
£12,181 1000 kg
ACT-935 (NiMo) act ive grading
material
£12,628 1000 kg
ACT-955 (NiMo) smooth
hydrotreating of C= and C==
£12,186
1170 kg
1,362 kg
TK15 Topsoe Topping
Inert Material
£15,723
816 kg
TK25 Topsoe Topping
Inert Material
£13,815
794 kg
TK709 (Mo) Topsoe
Hydrotreating
Catalyst (rings)
£11,089
1,080 kg
TK437 (NiMo) Topsoe
Hydrotreating Catalyst
(rings)
£13,500
1,360 kg
TK437 (NiMo) Topsoe
Hydrotreating Catalyst
(quadralobes)
£9,675
8,160 kg
TK527 (NiMo) Topsoe
Hydrotreating Catalyst
(quadralobes)
£87,612
Sto
rag
e a
t S
NA
MS
955 kgTK15
674 kgTK25
642 kgTK709
482 kgTK437 (rings)
834 kgTK437
(quadralobes)
9,675 kg
TK527
(quadralobes)
kg
Ceramic balls
“Denstone”
£
Total costs
£151,414*
1,541 kgCeramic balls
“Denstone”
(*) Do not include the
sulphiding costs which
were £21,569 and the
unknown costs of ceramic
balls
Total costs
£1,421,757**
7,548 kg
6,453 kg
640 kgTK10
596 kgTK709
360 kgTK437
448 kgTK437 (rings)
684 kgTK437
(quadralobes)
12,561 kg
TK559
(quadralobes)
1,661 kg Ceramic balls
14,803 kg13,572 kg TotalTotal
41,068 kg
41,068 kgHR 626
HR 626 66,750 kg
ACT-069 1,381 kg
863 kg
ACT-935 824 kg
ACT-955 1,036 kg
ACT-077
Ceramic
balls
HR 626
168,840
kgTotal
173,444
kg
-Init ial stock: Unknown
-Final stock: Unknown
6,453 kg
Ceramic
balls
Ceramic
balls
Total
2,271 kg
2,178 kg
1,134 kg
2,777 kg
67,796 kg
9,324 kg
1,048 kg
907 kg
42,467 kg
6,954 kg
907 kg
Collection
16,950 kg
185,859
kg
GSK-19
GSK-9
GSK-6A
ART AT405
ART 420DX
Denstone
balls
GSK-19
ART AT505
ART NDXI
Denstone
balls
42,467 kg
ART AT505
ART NDXI
Denstone
balls5,629 kg
185,859
kgTotal
202,809
kg
16,950 kgTotal
Fresh hydrotreat ing
catalyst, top grading and
bedding materials
manufactured and
delivered by Haldor
Topsoe
Fresh hydrotreat ing
catalyst, top grading and
bedding materials
manufactured by Haldor
Topsoe and loaded into
the Reactor 4-C-1A
Spent hydrotreating
catalyst, top grading and
bedding materials
manufactured by Haldor
Topsoe and removed
from the Reactor 4-C-1A
Fresh hydrotreat ing
catalyst, top grading and
bedding materials
manufactured and
delivered by AXENS
Fresh hydrotreat ing
catalyst, top grading and
bedding materials
manufactured by AXENS
and loaded into the HTU-2
reactors
Spent hydrotreating catalyst, top
grading and bedding materials
manufactured by Grace and
removed from the HTU-2
reactors
Storage at SNAMS
-Init ial stock: Unknown
-Final stock: Unknown
Storage at SNAMS
Delivered by Haldor Topsoe
Delivered by AXENS
+ the unknown amount of
ceramics balls
+ the unknown amount of
ceramics balls.
(**) Do not include
sulphiding and ceramic
balls costs and the as the
information was not
availableSystem Boundary “The Refinery”
Legend
Process
Mass flow
Unknown
flow
Estimated
flow
Figure 4.24. Hydrotreating catalysts material flow diagram for the 2012 Refinery TA
Chapter 4 – Results and discussion
198
Figure 4.25 shows the CCR/CRU catalyst material flow diagram for the 2012 Refinery
TA.
As seen in the figure four fractions of catalyst were obtained from unloading the
CCR/CRU:
1) used non-contaminated;
2) used contaminated;
3) heel and fines (free flowing catalyst fraction unloaded by gravity); and
4) fines including unknown amount of bedding materials.
The first material was loaded back into the reactor, the second sent to Porocel (Catalyst
Recovery Europe) in Rodange, Luxembourg for density grading and the third and fourth
to metal reclamation. At Porocel, contaminated catalyst was screened and stripped (light
burned) to remove fines less than 1410 microns and to desorb benzene respectively.
Subsequently the remaining fraction was density graded.
From the figure it can be estimated that 83% w/w of the unloaded reforming catalyst
was reloaded into the reactor while the remaining fraction, i.e. 20,541 kg, was treated as
follows:
1) 76.5% sent for metal reclamation;
2) 19% re-used as reforming catalyst; and
3) 4.5% lost in the form of dust and fines.
It can also be calculated from the figure that the fresh reforming catalysts cost the
Refinery £18.8/kg, i.e. this Pt-containing catalyst is more expensive than the
hydrotreating catalysts. The costs of metal reclamation from heel and fines catalysts and
the heavy fraction obtained from density grading at Porocel were not available at the
moment of study. For this reason it was not possible to determine how much the
Refinery could recover through these two operations. The possible re-use of the light
fraction of catalysts obtained by density grading could represent savings to the Refinery
of £73.78 k if calculated at the price of fresh catalyst. The Refinery spent in total £0.48
M for the reforming catalyst changeout.
Chapter 4 – Results and discussion
199
Storage at SNAMS
-Init ial stock: 3,240 kg of fresh reforming catalyst+ 0 kg of bedding materials-Final stock: 0 kg
21,000 kg
Freshreforming
catalyst R-264 (Pt)
£395,560 Screening and stripping at
Porocel, Luxenbourg
System Boundary “The Refinery”
Delivery charges
£920
Delivered by UOP
24,240 kg119,367
kg534 kg
Used reforming catalyst
(contaminated+non-contaminated)
including fines, heel catalyst and
bedding materials
Fresh reforming catalyst
CCR/CRU
-Init ial stock: 116,904 kg of used reforming catalys+unknown quantity of used bedding materials-Final stock: 123,066 kg of reforming catalyst (fresh+used)+1,250 kg of bedding materials
“CHEP”flow bins catalyst
containers for temporarily
storageEstimated costs of
delivery and rental £11,763
Dust and fines (loss of
inventory)
98,826 kg
12,578 kg
(1) Used non-contaminated reforming catalyst
(4) Catalyst fines (include unknown quantity of bedding materials)
Catalyst segregation
and temporarily
storage
2,588 kg
(2) Used contaminated reforming catalyst
Density gradingat Porocel,
Luxenbourg
12,044 kg
3,914 kg
Light fraction for reuse as
reforming catalyst
394 kg7,736 kg
Heavy fraction for metal reclamation
Costs of density grading£74,989
5,375 kg
1,250 kg
Beddingmaterials
(3) Heel catalyst and fines (include unknown quantity
of bedding materials)
1,250 kg
Bedding materials
(i.e. ceramic balls)
Delivered from Refinery stores
Dust and fines (loss of
inventory)
Metal Reclamation
Costs for customs purposes£1,400
Legend
Process Mass flowUnknown
flow
Estimated
flow
Figure 4.25. Reforming catalyst material flow diagram for the 2012 Refinery TA
Chapter 4 – Results and discussion
200
The most significant result from applying MFA to the management of reforming
catalyst and waste during the TA was the possibility to provide more information on
recycling, reusing and disposal of waste. As seen in the results, the majority of used
catalyst was recycled through metal reclamation followed by re-use as reforming
catalyst. In terms of costs, the MFA identified a potential saving of £73.78 k by re-using
the light fraction of spent catalyst after density grading.
4.6.1.3 Blasting materials
All TA blasting activities (also called grit and bed blasting) were performed by Wardle
Painters Ltd. The costs of fresh blasting materials were included in the contract as well
as expenses due to labour, mobilisation and demobilisation of all associated equipment.
Figure 4.26 shows a material flow diagram from the delivery of fresh grit to waste
blasting materials resulting from the cleaning of tanks, vessels and heat exchanger
bundles during the TA.
Unfortunately no information was available about losses of blasting materials at the Grit
Blast Yard and Business Units. Losses of spent material mainly occurred by wind
dispersion when blasting the outsides of pipes and tanks and during collection in open
top skips. As blasting activities involve the removal of solid contaminants from the
walls of vessels and equipment admixed with the spent blasting material, the amount of
final waste is expected to be larger than the fresh material used. As seen in the figure,
waste generated at 191 t was 40 t less than the fresh material which suggests that at least
this quantity was lost during blasting and collection. Spent blasting materials are
classified as hazardous materials therefore special attention should be paid in
controlling losses by wind blowing which can result in air, land and water
contamination in the longer term.
In terms of costs, the Refinery paid £373/t for the fresh material and £133/t, for
subsequent washing and landfilling of the all blasting waste.
Chapter 4 – Results and discussion
201
Collection
231 t
System Boundary “The Refinery”
Fresh blasting
materials £86,140Delivering of fresh
blasting materials Wardle (painters) Ltd.
(TA supplier)
Blasting at Business
Units
Waste blasting materials washing and landfilling at
Terramundo, Middlesbrough, UK
Storage at the Refinery
Recycling Facility
191 tWaste
blasting materials
Blasting at the Grit Blast
Yard
Collection
Waste blasting
materials
Waste blasting
materials
Waste blasting
materials
Waste blasting materials
Losses
Losses
Waste blasting
materials
Waste blasting materials
Fresh blasting
materials
Fresh blasting
materials
Cost of disposal£25,310
Legend
ProcessMass
flow
Unknown
flow
Estimated
flow
Open topskips
Open topskips
Figure 4.26. Blasting materials flow diagram over the 2012 Refinery TA
Chapter 4 – Results and discussion
202
Applying MFA to blasting materials helped to identify a potential environmental
problem involving contamination of air, land and water by wind dispersion of waste
blasting materials. Here, MFA can be considered as a tool to aid decision making
concerning waste management. Treating the waste cost less than half the raw material,
although washing and landfilling were the disposal operations, which are at the bottom
of the waste management hierarchy as indicated by WFD. This also provides an
opportunity for improvement by identifying more environmentally friendly treatment
options.
4.6.1.4 Insulation materials
Three contractors provided thermal insulation materials for the TA, viz. Hertel, Kitsons
Ltd. and AIS Insulation Supplies Ltd. Three different brands of insulation materials
were used: Rockwool, Paroc and Superwool which are synthetic fibres formed of
calcium-magnesium silicates (also known as stone wools) and considered non-
hazardous materials. Figure 4.27 shows the insulation materials flow diagram for the
2012 Refinery TA. There were no distinctions made between the different materials,
which were too similar to permit segregation.
As illustrated in the figure, the amount of this waste generated at the TA was not
determined. At the business units, the different wastes were mixed, collected in
transparent plastic bags and transported to the on-site Recycling Facility in open top
skips for temporarily storage. Since the waste was disposed of as municipal (general)
waste and reported by the Waste Contractor with the EWC code 20.03.01 instead of
17.06.04 as the catalogue indicates, it was not possible to determine the amount
generated.
All insulation waste was sent off-site to the TBS Transfer Station in Haverfordwest
where it was disposed of to a non-hazardous landfill. Recycling was not viable through
the different insulation producers (i.e. Rockwool and Paroc) as they only accept
returned materials originally manufactured by them. Such waste cost the Refinery
£81/kg for disposal.
Chapter 4 – Results and discussion
203
Insulation waste
collection
Lagging at Business Units
Insulation waste
Recycling at TBS Transfer Station
Haverfordwest, UK
Non-hazardous Landfill
System Boundary “The Refinery”
29,386 kg
Deliveringof insulation materials by a TA contractors(Hertel, Kitsons Ltd. and AIS Insulation
Supplies Ltd)
Insulation materials£58,544
Temporary storage at the Refinery
Recycling FacilityṁStock: Unknwon
Insulation waste
Insulation waste sent for disposal as general waste
Insulation waste disposed as
general waste
Legend
ProcessMass
flow
Unknown
flow
Estimated
flow
Transparent plastic bags and open top
skips
Figure 4.27. Insulation materials flow diagram over the 2012 Refinery TA
Chapter 4 – Results and discussion
204
The MFA in this case has revealed that segregation of insulation waste would be
essential for its recycling, playing then an important a role in aiding decision making on
waste management.
4.6.1.5 Personal Protective Equipment (PPE)
PPE is equipment used by personnel to prevent or minimise health and safety risks in
the workplace. According to the Health and Safety Executive (HSE, 2014), PPE has
been classified according to the body area protected, i.e. eyes, head and neck, ears,
hands and arms, feet and legs, lungs and the whole body. Examples of PPE are safety
spectacles, goggles, face screens and shields, helmets, earplugs, earmuffs, gloves, safety
boots, face dust and gas masks, conventional or disposable overalls, etc. In the Refinery,
battery powered equipment such as monitors for toxic, flammable and explosive
atmospheres were considered PPE, along with materials for spill control such as sand
bags, booms, sorbent pillows and pads. In terms of waste generated, classified with the
EWC code 15.02.02*, battery powered equipment was excluded.
Figure 4.28 shows the PPE material flow diagram for the 2012 Refinery TA. As seen in
the figure, PPE was provided by regular suppliers and TA contractors. A detailed
breakdown between the business units could not be carried out as the data were not
provided in the Refinery TA work contracts.
The figure illustrates that contaminated PPE was collected at the business units and
transported to the on-site Recycling Facility in steel drums and wheelie bins. PPE from
wheelie bins was further drummed and, together with the oily PPE originally collected
in steel drums, was sent for disposal at Ellesmere Port near Liverpool. At this treatment
facility, oily PPE and steel drums were shredded and incinerated. The total amount of
drummed oily PPE disposed was 12 t and cost the Refinery £7,304.
Chapter 4 – Results and discussion
205
System Boundary “The Refinery”
Delivering of PPE by TA contractors
Use at Business
Units
Incineration of contaminated PPE at
Elllesmere Port, Liverpool, UK
12 t
Contaminated PPE sent to incineration
£4,824
Collection
Drummed of PPE contained in wheelie bins and temporary
storage at the Refinery Recycling
Facility and
Deliveringof PPE by Refinery regular suppliers
Storage at the Refinery Main
Stores
ṁStock:Unknown
Unused PPE
PPE
PPE
Contaminated PPE
Contaminated PPE
Unused PPE
PPE£338,024
Legend
ProcessMass
flow
Unknown
flow
Estimated
flow
Steel drums
Steel drums
Wheelie bins
124 steel drums used in total
Estimated costs £2,480
Figure 4.28. PPE material flow diagram over the 2012 Refinery TA
Chapter 4 – Results and discussion
206
Following these results the Refinery Environmental Engineering staff and the on-site
waste contractor estimated that by substituting steel drums with cardboard drums to
collect, transport and dispose of oily PPE it would be possible58
:
• to save approximately £12 for each drum;
• to reduce the loading weight of lorries by 10 kg/drum during transportation from
on-site to the off-site treatment facility; and
• to reduce costs of incineration by £30/t due to less severe operating conditions of
the incinerator.
It was therefore estimated that by 2013 £19.5 k could be saved by the Refinery by using
cardboard instead of steel drums for treating oily PPE (Valero Energy Ltd., 2013d).
In summary, the salient benefits of applying MFA to PPE material has enabled:
• the identification of cost saving opportunities in the management of waste by
replacing steel drums by cardboard drums, although no relationship between the
raw material and waste production was possible;
• potential reduction of environmental impacts by reducing transport movements
from the Refinery to the disposal site; and
• less severe incineration conditions to dispose cardboard drums.
Future research is recommended considering the impact of using raw materials for the
manufacture of cardboard drums and steel and other type of materials.
4.6.1.6 Metals
Metals (ferrous and non-ferrous) are one of the assets of an oil refinery, in particular
steel which is a material of high importance in economies not only as a raw material but
also in the form of scrap. The recycling of scrap steel has constituted a vital treatment
process to reduce the environmental impacts of steel production as generation from
scrap consumes much less energy and also produces considerably less emissions and
wastes than primary production (Davies et al., 2007).
58
Based on drums of 205 L of capacity.
Chapter 4 – Results and discussion
207
The flow of metals entering a refinery and the scrap produced depend on different
factors which relate to each process unit’s unique operational history and performance
in terms of mechanical reliability. For this reason MFA in this application over a short
period of time is of particular interest.
In Valero Refinery, recycling of scrap metal is one of the top priorities for waste
management. In fact, important resources have been dedicated to the establishment,
maintenance and general management of the Refinery Scrap Yard, aiming to improve
the segregation and collection of all site scrap and to maximise the value recovered
through rebate costs.
Figure 4.29 presents the TA metals flow diagram for the 2012 Refinery TA.
As seen in the figure six types of metal - of which three were steel - were added to the
Refinery assets and also produced as scrap. Carbon steel was most common scrap metal
but the least expensive per tonne sold, i.e. £133.6/t compared to £833.4/t and £3755/t
for stainless steel and monel respectively. According to the figure, there is reasonable
agreement between the estimates from the business units and the actual amounts of
scrap generated. As the waste contractor did not report any alloy steel as TA scrap, it is
possible that this material was sent for recycling as carbon steel or remained at the
Refinery Scrap Yard until the end of 2013. In the case of scrap monel and inconel (very
corrosion resistance nickel alloys), there is also a possibility that they were disposed
together or at least reported by the Waste Contractor as scrap monel. Brass was not
reported as scrap for recycling by the end of 2013.
It should be noted that the actual amounts of raw materials could not be determined as
there was limited information in the procurement and finance systems in terms of metal
grades, weights and manufacturing and transportation costs.
Chapter 4 – Results and discussion
208
System Boundary “The Refinery”
Meta
l re
cyclin
g a
t S
IMS
meta
l m
anag
em
en
t fa
cili
ty, U
K
£88,561
£66,842
571 t
Carbon steel
85.5 t
Stainless steel
30 t
Alloy steel
2.2 t
Inconel
1.2 t
Monel
48 t
Brass
Carbon steel
Stainless steel
Alloy steel
Inconel
Monel
Brass
663 t
Carbon steel
80.2 t
Stainless steel
Alloy steel
Inconel
2.4 t
Monel
Brass
Busin
ess
unit
s
ṁA
ssets
:
Raw metals
Scrap metalsQuantities estimated by Business Units process
engineers
Scrap metalsQuantities reported by the Refinery on-
site Waste Contractor
Scra
p m
eta
l hand
ling
,segre
gatio
n a
nd s
tora
ge
“Scra
p Y
ard
”
ṁS
tock
:
Delive
ring
of
ferr
ous a
nd n
on
-fer
rou
s m
eta
ls in
th
e fo
rm h
eat
exchan
ger'
s s
hells a
nd b
un
dle
s, vessels
, p
ipes, fl
anges
, elb
ow
s,
valv
es, stu
ds, etc
.
£9,012
Legend
ProcessMass
flow
Unknown
flow
Estimated
flow
Figure 4.29. Metals flow diagram over the 2012 Refinery TA
Chapter 4 – Results and discussion
209
An attempt to apply a MFA methodology for metals managed at the Refinery TA was
unsuccessful as lack of detailed information did not allow a proper analysis of the
management of these materials during the period of study. One of the main aspects
revealed by the MFA is that accurate information is essential with regard to the initial
stocks of materials on-site, materials replaced, purchasing of new materials and waste
disposed. Segregation and reporting, currently not carried out in sufficient detail, were
also identified as relevant for this particular MFA.
4.7 Review of oily sludge produced by England and Wales oil refineries over
2008-2012
The review of oily sludge produced in England and Wales oil refineries over 2008-2012
presented here was proposed in Section 3.4 as part of the elements of the methodology
to determine technology solutions for the treatment of oily sludge.
Figure 4.30 shows the total quantity of oily sludge generated by the oil refineries in
England and Wales over 2008-2012 compared to the production of all other wastes.
Appendix P details the production of each refinery59
by type of oily sludge according to
the EWC and disposal and recycling codes.
Figure 4.30. Oil refineries total waste production in England and Wales over 2008-2012
59
England and Wales oil refineries in operation in the period 2008-2012 were Phillips 66 (UK)-
Killingholme, Essar-Stanlow, Total (UK)-Lindsey, Coryton-Essex (shut down in 2012), Valero-
Pembroke, Murco-Mildford Haven, Esso-Fawley, Eastham Refinery Ltd.-Eastham and Petrochem
Carless-Harwich.
19%
20%
21%
12%
16%
0
20
40
60
80
100
120
140
2008 2009 2010 2011 2012
Wa
ste
pro
du
cti
on
(k
t)
Oily s ludge
All other wastes
Chapter 4 – Results and discussion
210
The main points that emerge from the figure are that the total waste produced averages
100 kt/y, of which oily sludge represents between 12 and 21%.
Figure 4.31 shows the production of oily sludge per refinery over 2008-2012.
Petrochem Carless-Harwich and Eastman Ltd-Eastman were not included due to the
very low amount of sludge produced; figures for these two refineries are presented in
Tables P-7 to P-9 of Appendix P.
Figure 4.31. Oily sludge production of main oil refineries in England and Wales over
2008-2012
Various notable aspects emerge from the figure. The first is that oily sludge production
varied with a downward trend. Over the period the total production decreased in 6.9 kt
in 2012 compared to 2008. Philips 66 was a consistently high producer and Essar-
Stanlow was the largest producer in 2008. There was no sludge reported by Coryton
Refinery in 2012 since it was shut down this year.
Variations in production are normally expected since the activities that mainly generate
this waste on-site (as discussed previously) are carried out on a non-regular basis.
Maintenance intervals of tanks, vessels and heat exchangers for instance, are normally
determined by equipment risk-based inspection programs or when their performance
has declined considerably, e.g. loss of heat transfer capacity of heat exchangers.
0
3
6
9
12
15
18
21
24
2008 2009 2010 2011 2012
Oily s
lud
ge
pro
du
cti
on
(k
t)
Coryton-Essex
Esso-Fawley
Murco-Mildford Haven
Valero-Pembroke
Total (UK)-Lindsey
Essar-Stanlow
Phillips 66 (UK)-Killingholme
Chapter 4 – Results and discussion
211
Another point to highlight from the figure refers to the lack of a quantitative
relationship between the production of oily sludge and the processing capacities of
different refineries. For instance, according to Figure 1.4, Esso-Fawley had the largest
processing capacity (25.7 Mt) in 2012 but generated 14 kt, i.e. 9 kt less than Valero-
Pembroke and Essar-Stanlow. Another example can be drawn from Phillips 66 (UK)-
Killingholme which consistently generated large amounts of oily sludge over the period
although its processing capacity was 6 Mt less than Esso-Fawley; in fact, the oily sludge
generated by Phillips 66 (UK) accounted for 60% w/w of the total oily sludge produced
by all England and Wales refineries over 2008-2012. It is important to mention that
although processing capacities do not normally equal the actual amounts of feedstocks
processed every year, in these cases it was assumed that they did not differ
significantly60
.
The last aspect to discuss with regard to oily sludge production refers to the amounts
generated by Petrochem Carless and Eastman Ltd refineries (see Tables P-7 and P-8 of
Appendix P). Petrochem Carless produced the least amount of this waste in the period,
i.e. 0.022 kt, which can be explained as this Refinery only has distillation capabilities
and did not store, blend and process crude oil and other heavy feedstocks (i.e. important
precursors of oily sludge) over 2008-2012. On the other hand Eastham Ltd. over the
whole period for instance generated the half amount of oily sludge produced by Murco-
Mildford Haven, i.e. 1.47 kt, having a processing capacity eight times less. Eastham
Ltd. has only distillation capabilities but processed crude oil and other heavy feedstocks
over 2008-2012.
The review of oily sludge produced in England and Wales Refineries, as part of the
methodology proposed to the aid the Refinery with its environmental improvement
condition of the environmental permit, allowed various aspects to be identified. The
first is that it is definitely a persistent problem that needs to be addressed and represents
up to 20% of total waste produced by oil refineries. It was identified that the production
depends on the processing capabilities of the site and type of feedstocks processed;
therefore future research may well conclude that there will be individual treatment
solutions appropriate to different sites.
60
For information about the total amount of primary oil transformed in UK oil refineries see DECC
DUKES reports over 2009-2013.
Chapter 4 – Results and discussion
212
4.8 Findings and concluding remarks
The present chapter has applied the methodologies proposed in Chapter 3, specifically
in sections 3.2 and 3.3. It has presented and discussed the results for fully achievement
of Objectives 3 and 4 of this Thesis. The results of the review of oily sludge produced
by England and Wales oil refineries over 2008-2012 were also presented to aid the
refinery comply with the improvement condition of its EP related to the management of
oily sludge as explained in Section 2.4 and Sub-section 2.7.3.
The following sub-sections present specific findings and concluding remarks of the
analysis carried out in Chapter 4.
4.8.1 Five-Year Waste Review
The Five-Year Waste Review allowed testing the methodology proposed to identify,
classify and quantify the amount and treatment costs of waste produced by a UK oil
refinery (Valero Refinery, Pembroke). It can be said that at the end of this review
Objective 3 of this Thesis was fully achieved. It can also be claimed that this
methodology could be applied to other refineries with similar processing capabilities
and therefore analogous type and quantity of waste streams.
From the collection of data to the analysis of results and discussion made in Section 4.2,
relevant findings in priority order and recommendations follow for the period 2007-
2011.
• Correct reporting and description of EWC and disposal and recycling codes is
essential to waste producers to identify and quantify the type, amount and costs
of waste generated; this information is also relevant to the Environmental
Engineering and Waste Contractor to select the most appropriate route of
treatment;
• As unallocated on-site work represented important expenses to the Refinery, a
breakdown of it by type of activity and location on-site is recommended for a
better control and possible reduction; this Thesis developed a detailed waste
database as it will be seen in Sub-section 4.8.2, to record and control this type of
activity and associated costs;
Chapter 4 – Results and discussion
213
• Waste production increased in the Refinery in 7.1 kt to 29 kt and cost £2.1 M
more in 2011 compared to 2007;
• HW was the largest and costliest to treat, i.e. 76% of the total waste generated in
2011 and cost the Refinery £0.94 M more in 2011 compared to 2007;
• NHW was much less produced and varied with a non-defined trend;
• NHW cost the Refinery in the five-year period a similar amount that the
increment in HW from 2007-2011;
• the Refinery generated a total of 58 different types of wastes, of which 39 were
HW and 19 NHW;
• Unallocated on-site work cost five times more in 2011 than it did in 2007, i.e. a
total of £1.2 M;
• >95% of HW was the fraction regularly disposed (HWD) and >88% was the
proportion on NHW recycled (NHWR);
• The majority of HWD was disposed by Physicochemical treatment and 80% of
NHWR was treated through the recycling and reclamation of inorganic
materials;
• Fluoridic caustic was the largest and costliest component of HWD at 71.8 kt and
£6.8 M;
• The production and costs of fluoridic caustic increased from 2008 to 2011, i.e.
by 10 kt to 20.4 kt by about £0.41 M per year;
• It is suggested that operational upsets in Merox, driers and hydroisomerisation
units upstream AlkyU could influence the production of fluoridic caustic; for
this it is recommended an in-depth performance analysis of these units to
identify and control possible entrainment of contaminants such as sulphur
compounds, water and diolefins;
• Other important components of HWD produced at significant amounts and
expensive to treat were phenolic caustic (2.4 kt/£0.91 M), and oily sludge from
different sources (1.6 kt/£1.44 M);
• The production of phenolic caustic reported was the quantity that could not be
processed at the WWTP due to the high content of sulphur compounds; further
investigations could involve performance analysis of Merox units and the
development of the KPI: sulphides content in the Merox feed/t of phenolic
caustic produced to aid the Refinery in forecasting increases in production;
Chapter 4 – Results and discussion
214
• The production of oily sludge from different sources varied depending on the
area and the type of cleaning operation that took place in the Refinery;
• Oily sludge costs varied according to the amount generated and all was
incinerated in the period;
• Sludges from physicochemical treatment containing dangerous substances (i.e.
oily sludge generated at the WWTP) accounted for one third of the total quantity
produced;
• It was difficult to allocate all oily sludge generated from tank bottom cleaning
operations and other areas as this information was not specified on the Waste
Contract Reports; a diary of tank cleaning events and type of material stored is
recommended to keep in future including some characterisation data such as
product origin, API gravity, density, viscosity, sulphur and nitrogen content, etc.
This information would be of much to determine alterative solutions in the
treatment of oily sludge;
• Main constituents of NHW were FCCU catalyst (which represented more than
half of NHW generated in the period) at 18 kt and no costs involved for its
recycling, Metals at 7.4 kt and also no costs for recycling and mixed municipal
waste (5.2 kt) of which 75% was recycled and the remaining disposed of a non-
hazardous landfill;
• The production of FCCU catalyst has been studied intensively in the Refinery
although for the management of waste the development of a KPI such as
quantity of fines generated per amount and type of feed processed would be of
help to analyse effects on the resistance to abrasion of the catalyst, etc;
• Allocation by process unit of scrap metals was not possible as all was collected,
mixed and temporarily stored in the Refinery scrap yard;
• To aid the Refinery in forecasting scrap metal production, it is recommended to
keep an inventory of metals per business unit including weight, type and grade.
• The segregation of mixed municipal waste has improved over the years in the
Refinery; its recycling remained at 75% over 2007-2011 although it was
expected to increase to 80%f by special campaigns introduced by the waste
contractor;
• The development of the waste KPI: Normalised Amount of Total Waste was
relevant to show that the amount of waste produced over the period did not
depend on the quantity of crude oil processed by the refinery suggesting that
Chapter 4 – Results and discussion
215
precursors of waste were chemicals, catalysts and other type of raw materials;
the development of KPIs at a process unit level may be of help in the future to
investigate how to reduce particular waste streams, e.g. FCCU catalyst fines;
• A waste cost KPI indicated that variations depended on costs of treatment
agreed between the waste contractor and the Refinery and extra costs due to
especial cleaning campaigns; and
• A KPI developed to analyse performance of the AlkyU indicated that alkylate
production did not influenced the rise in the fluoridic caustic production
suggesting the carryover of contaminants and upsets from other units as
mentioned previously.
4.8.2 Refinery waste production and costs analysis in 2012
Continuing on from the five year review over 2007-2011, the main findings and
recommendations in priority order of the review in 2012 are:
• Total waste and costs reduced in 8.7 kt and £678 k compared to 2011
respectively;
• HWD remained as the largest and costliest waste generated, however 29% less
produced and £652 k less expensive compared to 2011;
• The main components of HWD and NHWR were the same as over the period
2007-2011 indicating that fluoridic caustic, oily sludge from different sources
and FCCU catalyst remained as the most important waste streams from
production and costs perspectives;
• The production of fluoridic caustic particularly decreased in 2012 due to
changes in the temperature conditions of the re-run column of the AlkyU
reducing the production of ASO and entrained HF;
• Extra costs related to the collection and treatment of fluoridic caustic included
£61.5 k due to the late cancellation of tankers and £2.4 k for the off
specification of fluoridic caustic sent to treatment; quantification of fluoridic
caustic available in the settling pond in advance, e.g. by level, would be of help
to plan in advance the collection;
• Unallocated on-site work rose due to desludging of ponds in the WWTP and
expenses for general TA cleaning activities; and
Chapter 4 – Results and discussion
216
• Detailed unallocated on-site activities, amount of waste generated and costs are
essential for further control and cost reductions.
4.8.3 Yearly Waste Monitoring
The Yearly Waste Monitoring made through the development of the 2013 Detailed
Waste Database PI, which intends to be used in the subsequent years as complementary
to the TR548 database, facilitated the analysis of waste performance and management in
2013 as specified in Sub-section 4.4.5.
Specifically with regard to the production of waste, costs and management it was found
and recommended the following in priority order:
• Total waste production in 2013 was 21.99 kt plus 1.866 kt of metals and cost
(also called metallic waste);
• The Refinery spent £2.72 M of which 70% was due to off-site waste costs and
the remaining fraction for on-site works costs;
• The Refinery recovered £360.8 k through the recycling off-site of metallic
waste;
• The metals most generated were carbon steel (88.2%) followed by stainless steel
(8.3%);
• The production of scrap metals was foreseeable in the short terms although for
the long-term it may be productive studying the relationship between the type
and frequency of scrap metals production with the number of repairs and
replacements historically performed in the units and associated corrosion rates;
• Recycling and disposal trends remained similar to the previous six years;
• 80% of total waste was HWD and cost 87% of total off-site waste costs;
• A break down per treatment method indicated that physico-chemical treatment
was the most used method to dispose HW and the amount of waste disposed
onto landfill was reduced significantly compared to the period 2007-2011, i.e.
from 3.8% to 1%. Better segregation of mixed municipal waste has particularly
improved this proportion which shows that the Refinery has moved away from
the least preferable option of the Waste Management Hierarchy;
• Incineration was the most expensive method to treat waste, i.e. £417/t;
Chapter 4 – Results and discussion
217
• Production and off-site waste costs were particularly high in May and June as
special desludging campaigns took place in the settling pond of AlkyU, E-track
pipe (B&S area) and off-spec phenolic caustic not treated in the WWTP;
• Production the subsequent months decline mainly due to the reduction of
fluoridic caustic and adjustment in the conditions of the re-run column;
• By type of waste, fluoridic caustic and oily sludge from different sources
remained as the largest and costliest produced followed by Spent FCCU catalyst,
a NHWR;
• The reduction in the quantity of oily sludge generated and also its treatment
through a method other than incineration could reduce off-site waste costs which
could be an area of research in future;
• With regard to detailed on-site work costs, track labour represented the highest
costs (£337 k) followed by vacuum trucks (£209 k);
• Planning measures with regard to the management of vacuum trucks reduced
costs in December compared to January of £10 k;
• A breakdown of off-site waste costs indicated that waste treatment accounted for
56% of the total costs (£1.06 M) followed by 41.2% of transport (£0.78 M);
• A decline in off-site costs after the second semester of the year was due to
measures to optimise the use of lorries, trucks and tankers off-site;
• Measures included more quantity of waste transported per load, e.g. use of 23 kL
fluoridic caustic tankers instead of 21 kL and use of cardboard drums to
transport oily PPE instead of steel drums; and
• The management of the collection of fluoridic caustic improved considerably
compared to 2012 and costs reduced, i.e. £32.9 k less;
• Gral area (which includes mixed municipal waste and contaminated earth due to
oil spills) across the year generated the largest amount of waste followed by
B&S, which included the oily sludge from tank bottoms, and BOs influenced by
the production of merox clay waste;
• Large production of waste from WWTP in March and October influenced the
Utls area followed by activated alumina contaminated with hydrocarbon in
January and October; and
• At a business area level, the development of KPIs may appropriate to analyse
performance and further investigate causes of increase in waste production, e.g.
Chapter 4 – Results and discussion
218
amount of activated alumina contaminated with hydrocarbons/quantity of water
(or entrained hydrocarbons) content in the feed.
4.8.4 Monthly Waste Control
The development of Waste in Brief Monthly Bulletin was proposed to perform monthly
control of waste in the Refinery as explained and discussed in Section 4.5.
From the Monthly Waste Control was identified the following. In some cases questions
are suggested that may be answered in future.
• Flurodic caustic influenced the overall trend of the Refinery in terms of
production and costs each month; however both costs and production decreased
in the second half of the year mainly influenced by the desludging of the settling
pond in the AlkyU and planning measures in the collection and transportation;
• Off-site costs represented the highest expenditure for the Refinery pointing out
to look at alternative ways of waste treatment;
• HWD cost £1.78 M, i.e. 92% of the total treatment costs;
• Physico-chemical treatment was the most used option to treat waste and landfill
the least preferred; Is it possible to reduce landfill to cero and move up in the
Waste Management Hierarchy? and
• Gral and B&s areas generated large amount of waste; were the events that
caused spills could be prevented? Alternative cleaning techniques for tank
bottoms can reduce the amount of oily sludge produced?
4.8.5 MFA applied to the Refinery TA
Material Flow Analysis proved to be a suitable tool for the analysis of the use of raw
materials and production of waste during a turnaround event in Valero Refinery,
Pembroke.
Findings and recommendations of the analysis performed with the materials listed in
Table 4.12 follow.
Chapter 4 – Results and discussion
219
Hydrotreating catalysts
• In the case of the Unifiner there is an opportunity to research/identify less
expensive topping materials as, by the moment of the analysis, were £9.8/kg
more expensive than the hydrotreating catalyst;
• Accurate estimation of the required amount of the fresh catalyst (including the
topping materials) led to a very low excess of materials after loading, i.e. 2.3%
in the case of the Unifiner and 9.4% in the HTU-2;
• With regard to the management of waste (spent) materials, the decision was
made in terms of costs but there was no evidence that environmental aspects
were taken into account; and
• In future recycling of the hydrotreating catalyst through other methodologies
could be analysed;
CCR/CRU catalyst
• Potential savings of £73.78 k were identified in the re-use of light fraction of
catalysts resulted from density grading, if calculated at the rate of fresh catalyst.
Blasting materials
• Potential environmental contamination was identified by waste blasting
materials blowing during collection, transportation and storage; and
• There is an opportunity to investigate alternative treatment methods to washing
and landfilling in order to move away from the least preferable option of the
Waste Management Hierarchy.
Insulation materials
• The segregation of insulation waste was essential for its recycling; and
• Avoiding disposal through landfill would have save the Refinery £81/kg.
Personal Protective Equipment
• For the collection of PPE it was identified and recommended the use cardboard
drums instead of drums;
Chapter 4 – Results and discussion
220
• From an environmental perspective, the incineration process could be run at less
severe conditions saving also approximately £30/t incinerated;
• It was also identified that loading weight of lorries could also be reduce in 10
kg/drum, allowing on this way reductions in transport movements; and
• Further research could involve a comparative MFA for the manufacturing of
steel and cardboard drums to estimate environmental impacts.
Metals
• MFA was unsuccessful due to lack of accurate information with regard to the
initial stocks of materials on-site, materials replaced, purchasing of new
materials and waste disposed; and
• Segregation and reporting was also inaccurate therefore the MFA.
4.8.6 Review of oily sludge produced by England and Wales oil refineries over 2008-
2012
The review of oily sludge produced in England and Wales oil refineries over 2008-2012
revealed that:
• The production of oily sludge is a persisting problem facing the oil refineries of
the sector that needs to be attended;
• Represents an important fraction of total waste produced by refineries, i.e. a
maximum of 20%;
• Its production depends on the processing capabilities of the site and type of
feedstocks processed; and
• Future research may indicate that there will be individual treatment solutions per
site.
Chapter 5 – Conclusions and recommendations
221
5 CONCLUSIONS AND RECOMMENDATIONS
This study has aimed to identify more sustainable solutions for the oil refining industry
regarding the efficiency of use of raw materials and production of waste, according to
the five specific objectives established in Section 1.4. From the work performed at
Valero Refinery, Pembroke, it can be concluded that:
1) Under EU and UK legislation, the minimum standards for managing raw
materials and waste at UK oil refineries are specified by the Environment
Agency in England and Natural Resources Wales (Section 2.3). These regulatory
bodies are required to evaluate the environmental impacts of refineries'
operations and to establish conditions which the refineries must meet to continue
operating, detailed in their individual Environmental Permits (Sub-section
2.4.3.) (Objective 1);
2) The amount of waste produced and the costs of its treatment at Valero Refinery
have not decreased since 2007. Although variable, the annual amount of total
waste produced over 2007-13 has shown an increasing trend from about 21 kt to
24 kt with a peak of 29 kt in 2011 associated with special tank cleaning and
pond desludging programmes. Similarly, the total annual costs of waste
treatment have increased from about £2.0 M to £5.0 M (Sub-section 4.2.2,
Section 4.3 and Sub-section 4.4.1) (Objective 3);
3) Hazardous waste at the Valero Refinery is the largest (about 75 % by weight)
and costliest (about 70 % of total) waste to treat, composed mainly of fluoridic
caustic (about 85 %) but with significant contributions from phenolic caustic and
oily sludge. Almost all of this hazardous waste is disposed of by
physicochemical treatment (about 98 %) but non-hazardous waste is mostly
recycled with reclamation of inorganic materials (about 94 %).(Objective 3);
4) Although Valero Pembroke Refinery has implemented the Corporation's
Environmental Management System (Sub-section 2.4.2), which is stewarded
centrally within the company to ensure that the Refinery satisfies the conditions
of its Environmental Permit (Sub-section 2.4.4.3), current practices at the
Chapter 5 – Conclusions and recommendations
222
Refinery are not providing a sustained systemic reduction in the amount of waste
produced and cost of its treatment. There has been an absence of frequent review
and analysis of raw materials use and waste production and a lack of regular
monitoring of key performance indicators at both process unit and refinery
levels (Sub-section 2.4.5) (Objective 2);
5) Methodologies have been defined (Section 3.2) and implemented to bring about
improvements in the management of waste. Increased monitoring has been
carried out in the form of newly defined KPIs (Sub-section 4.2.9), whilst
monthly bulletins highlighting the performance of individual process units have
been created and given refinery-wide circulation (Section 4.5) and a detailed
annual report prepared for management stewardship purposes (Appendix L);
6) Material flow analysis, generally well established elsewhere for routine
operations (Sub-section 2.5.2), has been uniquely applied in this research to an
event: the 2012 Refinery Turnaround (Section 4.6). This was an intensive and
detailed exercise that analysed the use of raw materials and production of waste
during a refinery-wide shut-down for maintenance and project purposes.
Although incomplete in parts due to lack of information and extended time
boundaries, significant potential cost savings were identified for future events
(Objective 4);
7) From a review of oily sludge data from all the refineries in England and Wales
over 2008-12 (Section 4.7), it is concluded that the management of oily sludge is
a widespread and persistent industry problem and that Valero Refinery is typical
of other UK refineries in this respect (Objectives 3 and 5). Although data were
collected and reviewed regarding the production of oily sludge (Section 4.7 and
Appendix P), there was insufficient time to investigate the causes and possible
options for treatment;
8) Whilst satisfying all appropriate legal requirements, refineries operate according
to corporate strategy and local interests (see Conclusion 1). In a very
competitive environment (closure of some UK refineries, e.g. Murco, Milford
Haven, and change of ownership of others e.g. Chevron - Valero, Pembroke)
Chapter 5 – Conclusions and recommendations
223
(Sub-section 1.2.1), refineries focus on staying in business rather than on
progressing discretionary projects including those regarding some sustainability
matters;
9) Tools and techniques such as LCA, EIA and CSR for sustainability assessment
are applied in the oil industry by specialists in central support rather than by
refinery personnel. More could be done at the local level but this is currently
constrained by restrictions on staff resources.
The following recommendations are made for possible further work:
1) Material flow analysis
Having explored the benefits of MFA as a tool to assess performance in raw materials
and waste management and to identify potential cost savings in both areas during a
refinery turnaround event, further analysis and practical trials are recommended into the
use of MFA methodologies within periods of normal and routine maintenance
operations. This would provide insights about depletion of materials and environmental
impacts through their life whole cycles and would aid the Refinery with the design of
plans and strategies for improved environmental management;
2) Oily sludge
The variety of factors affecting the production of refinery oily sludge worldwide
suggest that future research is required to investigate the problem specifically and
through its whole life cycle. This study has provided background about the main aspects
to consider when analysing the treatment of oily sludge and has shown the potential for
the use of MCDA in the technology selection process; however, more comprehensive
and detailed analysis will need to be carried out in future.
This Thesis set out to identify more sustainable solutions for the oil refining industry
which allow the important sustainability issues of raw materials consumption and waste
production to be assessed holistically for potential improvement. However, if
improvements in environmental performance are to be made in EU and UK refineries
(and the industry in general) as part of their progress towards sustainability, this study
Chapter 5 – Conclusions and recommendations
224
has revealed that additional stimuli are required from shareholders, general public, the
law and regulatory bodies.
Oil CEOs ahead of the UN climate change summit meeting in Paris in December,
announced their commitment to reduce emissions:
"Our shared ambition is for a 2°C future. It is a challenge for the whole of society. We
are committed to playing our part. Over the coming years we will collectively
strengthen our actions and investments to contribute to reducing the GHG intensity of
the global energy mix. Our companies will collaborate in a number of areas, with the
aim of going beyond the sum of our individual efforts" (TCE, 2015).
Although received with criticism, this could have significance if it inhibits refinery
closures in the UK and Europe and discourages export of environmental issues to
developing countries with more lax regulations.
References
225
REFERENCES
Abrishamian, R., Kabrick, R. and Swett, G. (1992). Two On Site Treatment Methods to
Reduce Sludge Waste Quantities. Oil and Gas Journal, (90), p 51.
Alberti, M., Marzluff, M., Shulenberger, E., Bradley, G., Ryan, C. (2003). Integrating
Humans into Ecology: Opportunities and Challenges for Studying Urban
Ecosystems. Bioscience, 53 (12), pp 1169-1179.
Allenby, B. (1998). Context is Everything. Journal of Industrial Ecology, 2 (2), p 6-8.
Doi:10.1162/jiec.1998.2.2.6.
Allenby, B. (1999). Culture and Industrial Ecology. Journal of Industrial Ecology, 3 (1),
p. 2-4. Doi:10.1162/108819899569340.
Al-Mutairi, N., Bufarsan, A. and Al-Rukaibi, F. (2008). Ecorisk evaluation and
treatability potential of soils contaminated with petroleum hydrocarbon-based
fuels. Chemosphere, 74 (1), pp 142-148.
Doi:http://dx.doi.org/10.1016/j.chemosphere.2008.08.020.
Alshammari, J., Gad, F., Elgibaly, A. and Khan, A. (2008). Solid Waste Management in
Petroleum Refineries. American Journal of Environmental Sciences, 4 (4), pp 353-
361.
API (1983). Land Treatment Practice in the Petroleum Industry, prepared by
Environmental Research & Technology Inc.
Assefa,G., Björklund,A., Eriksson,O. and Frostell,B. (2005). ORWARE: an aid to
environmental technology chain assessment. Journal of Cleaner Production, 13 (3),
pp 265-274. Doi:http://dx.doi.org/10.1016/j.jclepro.2004.02.019.
Augean Land Resources (2014). Landfill. Available at:
http://www.augeanplc.com/landfill/ (Accessed 6th
March 2014).
Ayres, R.U. and Simonis, U.E. (1994). Industrial metabolism: restructuring for
sustainable development. United Nations University Press, Tokyo.
Audit Commission (2013). Local quality of life indicators - supporting local
communities to become sustainable. Available at: http://archive.audit-
commission.gov.uk/auditcommission/nationalstudies/localgov/Pages/localqualityof
lifeindicators.aspx.html (Accessed: 2nd
February 2014).
Azapagic, A., Perdan, S. and Clift, R. (2004). Sustainable Development in Practice :
Case Studies for Engineers and Scientists. Chichester, West Sussex, England: John
Wiley & Sons.
Azapagic, A. and Perdan, S. (2011). Sustainable Development in Practice: Case Studies
for Engineers and Scientists. 2nd
ed. Chichester, West Sussex, England: John Wiley
& Sons.
References
226
Babbie, E. (2007). The practice of social research. 11th
ed. Belmont, CA: Thomson
Higher Education.
Ball, A. S., Stewart, R. J. and Schliephake K. (2012). A review of the current options
for the treatment and safe disposal of drill cuttings. Waste Management Research,
30(5), pp 457-473. Doi: 10.1177/0734242X11419892.
Bartzokas, A. and Yarime, M. (1997). Technology Trends in Pollution-Intensive
Industries: A Review of Sectoral Trends. United Nations University, Institute for
New Technologies, Keizer Karelplein 19, 6211, TC Maastricht, the Netherlands.
Available at: file:///C:/Users/rotzeri/Downloads/9706.pdf (Accessed 15th
February
2014).
Basel Convention (2011). Overview. Available at:
http://www.basel.int/TheConvention/Overview/tabid/1271/Default.aspx (Accessed
3rd
March 2014).
Basson, L. (2004). Context, Compensation and Uncertainty in Environmental Decision
Making. Department of Chemical Engineering. Syndey, Australia, University of
Sydney. PhD Thesis.
Basson, L. (2010). Introduction to Life Cycle Assessment. Centre for Environmental
Strategy, University of Surrey. Basic Version.
BBC (2011). Pembroke oil refinery sold to Valero Energy Corporation. BBC news, 1st
August 2011. Available at: http://www.bbc.com/news/uk-wales-14366341
(Accessed 22nd
January 2015).
Binder, C.R., Van Der Voet, E. and Rosselot, K.S. (2009). Implementing the Results of
Material Flow Analysis. Journal of Industrial Ecology, 13 (5), pp 643-649.
Doi:10.1111/j.1530-9290.2009.00182.x.
Bleischwitz,R. (2011). Resource Efficiency. Journal of Industrial Ecology, 15 (5), pp
644-646. Doi:10.1111/j.1530-9290.2011.00384.x.
Bonazzi, M. (1999). Sustainable development in the Mediterranean: prospects for the
olive industry; Thesis: Volume 1. University of Surrey, School of Engineering in
the Environment.
BP (2013). Energy Outlook 2030. Available at:
http://www.bp.com/content/dam/bp/pdf/statistical-
review/BP_World_Energy_Outlook_booklet_2013.pdf (Accessed: 13th
May 2013).
BP (2013a). Managing our impact on the environment. Available at:
http://www.bp.com/en/global/corporate/sustainability/environment/managing-our-
impact-on-the-environment.html (Accessed 25th
September 2013).
BP (2014). Conversion factors. Available at: http://www.bp.com/conversionfactors.jsp
(Accessed, 24th
January 2014).
References
227
Bringezu, S. and Moriguchi, Y. (2002). Material flow analysis. In: Ayres, R., Ayres
L.M. editors. A handbook of industrial ecology. Cheltenham, UK: Edward Elgar.
Bringezu, S., Schütz, H. and Moll, S. (2003). Rationale for and Interpretation of
Economy-Wide Materials Flow Analysis and Derived Indicators. Journal of
Industrial Ecology, 7 (2), pp 43-64. Doi:10.1162/108819803322564343.
Brunner, P. and Rechberger, H. (2004). Practical Handbook of Material Flow Analysis.
First edition edn. Boca Raton, FLA.; London: Lewis Publishers.
BSI (1996). The European Standard EN ISO 14001: Guidelines for Environmental
Auditing General Principles. Published (in English).
BSI (2009). Environmental management systems – Requirements with guidance use.
BS en ISO 14001:2004, incorporating corrigendum.
Cai, Q., Mo, C., Wu, Q., Zeng, Q., Katsoyiannis, A. and Férard, J. (2007).
Bioremediation of polycyclic aromatic hydrocarbons (PAHs)-contaminated sewage
sludge by different composting processes. Journal of Hazardous Materials, 142 (1–
2), pp 535-542. Doi:http://dx.doi.org/10.1016/j.jhazmat.2006.08.062.
Carroll, B. and Turpin, T. (2009). Environmental impact assessment handbook: A
practical guide for planners, developers and communities. Thomas Telford, 2nd
edn.
Castaldi, F. (2003). Tank-based bioremediation of petroleum waste sludges.
Environmental Progress and Sustainable Energy, 22 (1), pp 25-36. Doi:
10.1002/ep.670220114.
Chang, C., Shie, J., Lin, J., Wu, C., Lee, D. and Chang, C. (2000). Major Products
Obtained from the Pyrolysis of Oil Sludge. Energy & Fuels, (14), p 1176. Doi:-
10.1021/ef0000532.
Cheremisinoff, N.P. (2006). Environmental Management Systems Handbook for
Refineries - Pollution Prevention through ISO 14001. Gulf Publishing Company.
Available at:
http://www.knovel.com/web/portal/browse/display?_EXT_KNOVEL_DISPLAY_
bookid=1481&VerticalID=0 (Accessed 5th
December 2013).
Chevron (2008). IPPC Improvement programme requirements. No. IPPC-IC6. Internal
document. Communication submitted to the EA with reference to the Pembroke
Refinery permit QP3033LW.
Chevron (2010). Operational Excellence Management System: an overview of the
OEMS. Available at:
http://www.chevron.com/documents/pdf/OEMS_Overview.pdf (Accessed 18th
February 2014).
Chevron (2010a). IPPC Improvement programme requirements. No. IPPC-IC6 update.
Communication submitted to the EA with reference to the Pembroke Refinery
permit QP3033LW.
References
228
Clift, R. (1995). The Challenge For Manufacturing. Engineering for Sustainable
Development. J. McQuaid. London, Royal Academy of Engineering, pp 82 - 87.
Clift, R. and Longley, A. J.(1995a). Introduction to clean technology. In Kirkwood,
R.C., Longley, A. J. (Eds.), Clean Technology and the Environment. Blackie
Academic and Profesional, Glasgow, pp 174-198 (Chapter 6).
Clift, R., Doig, A. and Finnveden, G. (2000). The Application of life cycle to integrated
solid waste management-Part 1: Methodology. Institution of Chemical Engineers
(IChemE), Vol. 78, part B.
Clift, R. (2006). Sustainable development and its implications for chemical engineering,
Chemical Engineering Science, 61 (13), pp 4179-4187.
doi:http://dx.doi.org/10.1016/j.ces.2005.10.017.
Clift, R. (2010). Interview with the Chemical Engineering Progress Magazine (CEP).
Available at: http://www.youtube.com/watch?v=TrAdMMtINGc (Accessed 5th
March 2014).
Clift,R. (2011). Sustainable Consumption and Supportable Investment. Journal of
Industrial Ecology, 15 (5), pp 648-650. Doi:10.1111/j.1530-9290.2011.00396.x.
Clift, R. (2013). In: Harrison Royal, R. M. (Ed.), System Approaches: Life Cycle
Assessment and Industrial Ecology: Pollution: Causes Effects and Control, fifth ed.
Society of Chemistry, London (Chapter 17).
CONCAWE (2011). The potential for CO2 capture and storage in EU oil refineries.
CONCAWE Review 20 (2). Available at:
https://www.concawe.eu/content/default.asp?PageID=560 Accessed 23rd
January
2013.
Conner, J. and Hoeffner, S. (1998). A Critical Review of Stabilization/Solidification
Technology. Critical Reviews in Environmental Science and Technology, 28 (4),
pp 397-462.
Dahlström, K.; Ekins, P.,He, J.; Davis, J. and Clift, R. (2004). Iron, Steel and
Aluminium in the UK: materials flows and their economic dimensions. CES
Working Paper 03/04. Centre for Environmental Strategy, University of Surrey,
UK. Available at:
http://www.surrey.ac.uk/ces/files/pdf/0304_WP_Biffaward_Steel_Al-Final.pdf
(Accessed 13th
May 2014).
Da Silva, J., Alves, C. and De França, F.(2012). A review of the technological solutions
for the treatment of oily sludges from petroleum refineries. Waste Management &
Research, 30 (10), pp 1016-1030. Doi:10.1177/0734242X12448517.
Davies, J., Geyer, R., Ley, J., He, J., Clift, R., Kwan, A., Sansom, M., Jackson, T.
(2007). Time-dependent material flow analysis of iron and steel in the UK, Part 2.
Scrap generation and recycling. Resources, Conservation and Recycling, Volume
51, pp 118–140.
References
229
De Bakker, F., Groenewegen, P. and Den Hond, F. (2005). A Bibliometric Analysis of
30 Years of Research and Theory on Corporate Social Responsibility and
Corporate Social Performance. Business & Society, 44(3), pp 283-317.
DECC (2013). Digest of United Kingdom Energy Statistics (DUKES) 2013. Available
at:
https://www.gov.uk/government/uploads/system/uploads/attachment_data/file/2250
67/DUKES_2013_published_version.pdf (Accessed 15th
January 2014).
DECC (2013a). Energy and Climate Change Committee: "Written Evidence Submitted
by Essar Oil UK Limited". Available at:
http://www.publications.parliament.uk/pa/cm201314/cmselect/cmenergy/340/340w
e10.htm (Accessed 30th
August 2013).
DECC (2014). Statistics: Quarterly UK greenhouse gas emissions, data tables.
Available at: https://www.gov.uk/government/publications/quarterly-uk-emissions-
estimates (Accessed: 20th
January 2014).
DEFRA (2005). Securing the future: delivering UK sustainable development strategy.
Available at: https://www.gov.uk/government/publications/securing-the-future-
delivering-uk-sustainable-development-strategy (Accessed: 2nd
January 2014).
DEFRA (2013). Sustainable Development Indicators. Available at:
https://www.gov.uk/government/publications/sustainable-development-indicators-
sdis (Accessed 30th
January 2014).
DEFRA (2014). Industrial Emissions Directive: Background. Available at:
http://www.defra.gov.uk/industrial-emissions/eu-international/industrial-emissions-
directive/ (Accessed 25th
February 2014).
Dodds, R. and Venables, R. (2005). Engineering for Sustainable Development: Guiding
Principles. The Royal Academy of Engineering, 29 Great Peter Street, London,
SW1P 3LW.
DTI (2003). Our Energy Future – creating a low carbon economy. Energy White Paper,
TSO, Norwich, United Kingdom. Available at:
http://webarchive.nationalarchives.gov.uk/+/http://www.dti.gov.uk/files/file10719.
pdf (Accessed: 22nd
January 2014).
Du, S. and Vieira, E (Jr) (2012). Striving for Legitimacy through Corporate Social
Responsibility: Insights from Oil Companies. Journal of Business Ethics, No.
110, pp 413-427. DOI 10.1007/s10551-012-1490-4.
EA (2005). Guidance for the Gasification, Liquefaction and Refining Sector. IPPC
S1.02, Draft Version 04. Available at: http://cdn.environment-
agency.gov.uk/LIT_8503_17871a.pdf (Accessed 11th
March 2014).
EA (2011). Record keeping: A guide to the Hazardous Waste Regulations 05 (HWR05).
Available at: http://a0768b4a8a31e106d8b0-
References
230
50dc802554eb38a24458b98ff72d550b.r19.cf3.rackcdn.com/geho0611btuv-e-e.pdf
(Accessed 3rd
December 2013).
EA (2012). Pollution Inventory Reporting Codes. Available at:
http://www.environment-
agency.gov.uk/static/documents/Business/PI_Reporting_Codes_v10.2.pdf
(Accessed 23rd
December, 2012).
EA (2012a). Pollution inventory reporting - general guidance notes. Available at:
http://a0768b4a8a31e106d8b0-
50dc802554eb38a24458b98ff72d550b.r19.cf3.rackcdn.com/LIT_7665_3febc9.pdf
(Accessed 12th
March 2014).
EA (2013). The Environment Agency: What we do. Available at:
http://www.environment-agency.gov.uk/aboutus/default.aspx (Accessed: 23rd
September 2013).
EA (2013a). How to comply with your environmental permit. Document 433_11
(Version 6 - June 2013). Available at: http://a0768b4a8a31e106d8b0-
50dc802554eb38a24458b98ff72d550b.r19.cf3.rackcdn.com/LIT_7123_79744e.pdf
(Accessed 30th
November 2013).
EA (2013b). Environmental Permits (Industrial Installations): Valero Energy Ltd permit
QP3033LW. Available upon request at: http://epr.environment-
agency.gov.uk/ePRInternet/SearchRegisters.aspx (Accessed 30th
January 2014).
EA (2013c). General pollution inventory and resource efficiency guidance: Pollution
inventory reporting codes document. Available at: http://www.environment-
agency.gov.uk/business/topics/pollution/101829.aspx (Accessed: 25th February
2014).
EA (2014). Safe water. Available at: http://www.environment-
agency.gov.uk/homeandleisure/beinggreen/117266.aspx (Accessed 6th
February
2014).
EA (2014a). Special Licence Non-Commercial Agreement for re-use of Agency
Content. Reference No. A2787. England, UK.
EA (2014b). Pollution Inventory data of England and Wales oil refineries over 2008-
2012 provided under the Special Licence Non-Commercial Agreement A2787.
EC (1985). Council Directive of 27 June 1985 on the assessment of the effects of
certain public and private projects on the environment (85/337/EEC). OJ L175,
5.7.85, pp 40. Available at: http://eur-lex.europa.eu/legal-
content/EN/TXT/PDF/?uri=CELEX:31985L0337&from=EN (Accessed 29th
April
2014).
EC (1994). Commission Decision of 20 of December 1993 establishing a list of waste
pursuant to article 1 (a) of Council Directive 75/442/EEC on waste (94/3/EC). OJ
L5, 7.1.1994, pp 15. Available at: http://eur-
References
231
lex.europa.eu/LexUriServ/LexUriServ.do?uri=OJ:L:1994:005:0015:0033:EN:PDF
(Accessed 5th
July 2013).
EC (1997). Council Directive 97/1 1/EC of 3 March 1997 amending Directive
85/337/EEC on the assessment of the effects of certain public and private projects
on the environment. OJ L73, 14.3.97, p 5. Available at: http://eur-
lex.europa.eu/legal-content/EN/TXT/PDF/?uri=CELEX:31997L0011&from=EN
(Accessed 29th
April 2014).
EC (1999). Council Directive 1999/31/EC of 26 April 1999 on the landfill of waste. OJ
L182, 16.07.1999, p 1. Available at: http://eur-
lex.europa.eu/LexUriServ/LexUriServ.do?uri=OJ:L:1999:182:0001:0019:EN:PDF
Accessed 15th
February 2014.
EC (2000). Commission Decision on the European List of Waste (COM 2000/532/EC)
of 3 May 2000 replacing Decision 94/3/EC establishing a list of wastes pursuant to
Article 1(a) of Council Directive 75/442/EEC on waste and Council Decision
94/904/EC establishing a list of hazardous waste pursuant to Article 1(4) of
Council Directive 91/689/EEC on hazardous waste. OJ L 226, 6.9.2000, pp 3.
Available at: http://eur-
lex.europa.eu/LexUriServ/LexUriServ.do?uri=CONSLEG:2000D0532:20020101:E
N:PDF (Accessed 5th
January 2014).
EC (2003). Directive 2003/35/EC of the European Parliament and of the Council of 26
May 2003 providing for public participation in respect of the drawing up of certain
plans and programmes relating to the environment and amending with regard to
public participation and access to justice Council Directives 85/337/EEC and
96/61/EC. OJ L 156, 25.6.2003, pp 17. Available at: http://eur-
lex.europa.eu/resource.html?uri=cellar:4a80a6c9-cdb3-4e27-a721-
d5df1a0535bc.0004.02/DOC_1&format=PDF (Accessed 29th
April 2014).
EC (2003a). Integrated Pollution Prevention and Control (IPPC): Reference Document
on Best Available Techniques for Mineral Oil and Gas Refineries.
EC (2005). Communication from the Commission to the European Parliament, the
Council, the European Economic and Social Committee and the Committee of the
Regions. Taking sustainable use of resources forward: A Thematic Strategy on the
prevention and recycling of waste. COM (2005) 666 final. Available at: http://eur-
lex.europa.eu/LexUriServ/LexUriServ.do?uri=COM:2005:0666:FIN:EN:PDF
(Accessed: 30th
January 2014).
EC (2006). Annex of the Reviewed EU Sustainable Development Strategy (EU SDS).
10917/06, Brussels. Available at:
http://register.consilium.europa.eu/doc/srv?l=EN&t=PDF&gc=true&sc=false&f=S
T%2010917%202006%20INIT&r=http%3A%2F%2Fregister.consilium.europa.eu
%2Fpd%2Fen%2F06%2Fst10%2Fst10917.en06.pdf (Accessed: 3rd
January 2014).
EC (2006a). Regulation (EC) No 1013/2006 of the European Parliament and of the
Council of 14 June 2006 on shipments of waste. OJ L190, 12.07.2006, pp 1.
Available at: http://eur-
References
232
lex.europa.eu/LexUriServ/LexUriServ.do?uri=OJ:L:2006:190:0001:0098:EN:PDF
(Accessed 5th
January 2014).
EC (2008). Communication from the Commission to the European Parliament, the
Council, the European Economic and Social Committee and the Committee of the
Regions on the Sustainable Consumption and Production and Sustainable Industrial
Policy Action Plan. COM(2008) 397 final. Available at: http://eur-
lex.europa.eu/LexUriServ/LexUriServ.do?uri=COM:2008:0397:FIN:EN:PDF
(Accessed 23rd
January 2014).
EC (2008a). Directive 2008/98/EC of the European Parliament and of the Council of 19
November 2008 on waste and repealing certain Directives. OJ L312, 22.11.2008, p
3. Available at: http://eur-
lex.europa.eu/LexUriServ/LexUriServ.do?uri=OJ:L:2008:312:0003:0030:EN:PDF
(Accessed 23rd
January 2014).
EC (2008b). Communication from the Commission to the European Parliament and the
Council: The raw materials initiative — meeting our critical needs for growth and
jobs in Europe. COM(2008) 699 final. Available at:
http://www.tasmanmetals.com/i/pdf/COM_208_699_EC_Raw_Materials_Initiative
.pdf (Accessed 23rd
January 2014).
EC (2008c). Directive 2008/1/EC of the European Parliament and of the Council of 15
January 2008 concerning integrated pollution prevention and control (Codified
version). OJ L24, 29.01.2008, p 8. Available at: http://eur-
lex.europa.eu/LexUriServ/LexUriServ.do?uri=OJ:L:2008:024:0008:0029:EN:PDF
(Accessed 5th
July 2013).
EC (2009). Communication from the Commission to the European Parliament, the
Council, the European Economic and Social Committee and the Committee of the
Regions. Mainstreaming sustainable development into EU policies: 2009 Review
of the European Union Strategy for Sustainable Development. COM(2009) 400
final. Available at: http://eur-
lex.europa.eu/LexUriServ/LexUriServ.do?uri=COM:2009:0400:FIN:EN:PDF
(Accessed: 5th
January 2014).
EC (2009a). Directive 2009/29/EC of the European Parliament and of the Council of
23 April 2009 amending Directive 2003/87/EC so as to improve and extend the
greenhouse gas emission allowance trading scheme of the Community. OJ L140,
5.6.2009, p 63. Available at: http://eur-
lex.europa.eu/LexUriServ/LexUriServ.do?uri=OJ:L:2009:140:0063:0087:en:PDF
(Accessed 23rd
January 2014).
EC (2009b). Directive 2009/31/EC of the European Parliament and of the Council of
23 April 2009 on the geological storage of carbon dioxide and amending Council
Directive 85/337/EEC, European Parliament and Council Directives 2000/60/EC,
2001/80/EC, 2004/35/EC, 2006/12/EC, 2008/1/EC and Regulation (EC)
No 1013/2006. OJ L140, 5.6.2009, p 114.
References
233
EC (2009c). Directive 2009/28/EC of the European Parliament and of the Council of
23 April 2009 on the promotion of the use of energy from renewable sources and
amending and subsequently repealing Directives 2001/77/EC and 2003/30/EC. OJ
L140, 5.6.2009, p 16. Available at: http://eur-
lex.europa.eu/LexUriServ/LexUriServ.do?uri=Oj:L:2009:140:0016:0062:en:PDF
(Accessed: 25th
January 2014).
EC (2009d). Directive 2009/30/EC of the European Parliament and of the Council of
23 April 2009 amending Directive 98/70/EC as regards the specification of petrol,
diesel and gas-oil and introducing a mechanism to monitor and reduce greenhouse
gas emissions and amending Council Directive 1999/32/EC as regards the
specification of fuel used by inland waterway vessels and repealing Directive
93/12/EEC. Available at: http://eur-lex.europa.eu/legal-
content/EN/TXT/PDF/?uri=CELEX:32009L0030&from=EN (Accessed: 28th
April
2014).
EC (2010). Consolidated Version of The Treaty on European Union. C 83/13. The
Official Journal. Available at: http://eur-
lex.europa.eu/LexUriServ/LexUriServ.do?uri=OJ:C:2010:083:0013:0046:en:PDF
(Accessed: 3rd
January 2014).
EC (2010a). Consolidated Version of The Treaty on the Functioning of The European
Union. C 83/47. The Official Journal. Available at: http://eur-
lex.europa.eu/LexUriServ/LexUriServ.do?uri=OJ:C:2010:083:0047:0200:en:PDF
(Accessed: 6th
January 2014).
EC (2010b). Life Cycle Thinking and Assessment for Waste Management. Available at:
http://ec.europa.eu/enterprise/policies/innovation/policy/lead-market-
initiative/files/waste_mng_leaflet_en.pdf (Accessed 5th
January 2014).
EC (2010c). Directive 2010/75/EU of the European Parliament and of the Council of
24 November 2010 on industrial emissions (integrated pollution prevention and
control). OJ L334, 17.12.2010, pp 17. Available at: http://eur-
lex.europa.eu/LexUriServ/LexUriServ.do?uri=OJ:L:2010:334:0017:0119:EN:PDF
(Accessed 5th
January 2014).
EC (2010d). Making sustainable consumption and production a reality: A guide for
business and policy makers to Life Cycle Thinking and Assessment. Available at:
http://ec.europa.eu/environment/pubs/pdf/sustainable.pdf (Accessed 20th
September
2013).
EC (2011). Communication from the Commission to the European parliament, the
Council, the European Economic and Social Committee and the Committee of the
Regions. Roadmap to a Resource Efficient Europe. Brussels, 20.9.2011.
COM(2011) 571 final. Available at: http://eur-
lex.europa.eu/LexUriServ/LexUriServ.do?uri=COM:2011:0571:FIN:EN:PDF
(Accessed: 25th
January 2014).
EC (2011a). Directive 2011/92/EU of the European Parliament and of the Council of 13
December 2011 on the assessment of the effects of certain public and private
References
234
projects on the environment. OJ L 26, 28.1.2012, pp 1. Available at: http://eur-
lex.europa.eu/LexUriServ/LexUriServ.do?uri=OJ:L:2012:026:0001:0021:EN:PDF
(Accessed 29th
April 2014).
EC (2011b). Communication from the Commission to the European parliament, the
Council, the European Economic and Social Committee and the Committee of the
Regions. A renewed EU strategy 2011-14 for Corporate Social Responsibility.
COM(2011) 681 final. Available at: http://eur-
lex.europa.eu/LexUriServ/LexUriServ.do?uri=COM:2011:0681:FIN:EN:PDF
(Accessed: 30th
January 2014).
EC (2011c). Communication from the Commission to the European Parliament, the
Council, the European Economic and Social Committee of the Regions: A
resource-efficient Europe – Flagship initiative under the Europe 2020 Strategy.
COM(2011) 21. Available at: http://ec.europa.eu/resource-efficient-
europe/pdf/resource_efficient_europe_en.pdf (Accessed 5th
March 2014).
EC (2012). Consolidated versions of the Treaty on European Union and the Treaty on
the Functioning of the European Union. OJ C326, 26.10.2012, pp 1. Article 288.
Available at: http://eur-
lex.europa.eu/LexUriServ/LexUriServ.do?uri=OJ:C:2012:326:FULL:EN:PDF
(Accessed 30th
January 2014).
EC (2012a). European Commission, Environment, Waste, EU Waste Legislation.
Available at: http://ec.europa.eu/environment/waste/framework/index.htm
(Accessed: 17th
September 2013).
EC (2013). Best Available Techniques (BAT) Reference Document for the Refining of
Mineral Oil and Gas, Final Draft. Available at:
http://eippcb.jrc.ec.europa.eu/reference/BREF/FD_REF_July_2013online.pdf
(Accessed: 23rd
January 2014).
EC (2013a). Europe 2020. Available at: http://ec.europa.eu/europe2020/index_en.htm
(Accessed: 26th
April 2013).
EC (2013b). Eurostat: Indicators for monitoring the EU Sustainable Development
Strategy. Available at:
http://epp.eurostat.ec.europa.eu/portal/page/portal/sdi/context (Accessed: 20th
January 2014).
EC (2013c). Enterprise and Industry: Corporate Social Responsibility. European Policy
on CSR. Available at: http://ec.europa.eu/enterprise/policies/sustainable-
business/corporate-social-responsibility/index_en.htm (Accessed: 30th
January
2014).
EC (2013d). Best Available Techniques (BAT) Reference Document for the Refining of
Mineral Oil and Gas (formal draft). Available at:
http://eippcb.jrc.ec.europa.eu/reference/BREF/FD_REF_July_2013online.pdf
(Accessed 17th
February 2013).
References
235
EC (2014). The EU Emissions Trading System (EU ETS). Available at:
http://ec.europa.eu/clima/policies/ets/index_en.htm (Accessed 28th
April 2014).
EC (2014a). The 2020 climate and energy package. Available at:
http://ec.europa.eu/clima/policies/package/ (Accessed: 2nd
February 2014).
EC (2014b). About EMAS. Avaliable at:
http://ec.europa.eu/environment/emas/about/index_en.htm (Accessed: 26th
January
2014).
EC (2014c). European Platform on Life Cycle Assessment (LCA): Use of LCA in
business and policy making. Available at:
http://ec.europa.eu/environment/ipp/lca.htm (Accessed 30th
January 2014).
EC (2014d). The Industrial Emissions Directive: Summary of Directive 2010/75/EU on
industrial emissions (integrated pollution prevention and control). Available at:
http://ec.europa.eu/environment/air/pollutants/stationary/ied/legislation.htm
(Accessed 14th
February 2014).
EEA (2014). The European Pollutant Release and Transfer Register (E-PRTR).
Elshorbagya, W. and Alkamalib, A. (2005). Solid waste generation from oil and gas
industries in United Arab Emirates. Journal of Hazardous Materials, B120, pp 89–
99.
Energy Intelligence Group (2010). UK Vulnerable to Refining Shakeout. Petroleum
Intelligence Weekly, March 22, 2010, Vol. 49, p 4.
Entec (2006). Pembroke Refinery Permit Application Document. No. 15428 Chevron
PPC project. Internal document.
EPA (1991). Safe, Environmentally Acceptable Resources Recovery from Oil Refinery
Sludge. Available at:
http://cfpub.epa.gov/ncer_abstracts/index.cfm/fuseaction/display.abstractDetail/abs
tract/1557/report/0 (Accessed 3rd
September 2013).
EPA (2005). Everyday choices: Opportunities for environmental stewardship. Report to
Stephen L. Johnson, administrator of the U.S. Environmental Protection Agency.
Available at: http://www.epa.gov/osem/pdf/rpt2admin.pdf (Accessed 6th
March
2012).
EPA (2010). Available and emerging technologies for reducing greenhouse gas
emissions from the petroleum refining industry. Prepared by the Sector Policies and
Programs Division Office of Air Quality Planning and Standards U.S.
Environmental Protection Agency Research Triangle Park, North Carolina 27711.
EPA (2014). Summary of the National Environmental Policy Act. 42 U.S.C. §4321 et
seq. (1969). Available at: http://www2.epa.gov/laws-regulations/summary-
national-environmental-policy-act (Accessed 29th
April 2014).
References
236
ESSAR (2013). Environment. Available at:
http://www.essarenergy.com/sustainability/environment.aspx (Accessed 25th
September 2013).
Essien, O. E. and John, I. A. (2010). Impact of Crude-Oil Spillage Pollution and
Chemical Remediation on Agricultural Soil Properties and Crop Growth. Journal of
Applied Science in Environmental Management, 14 (4), pp 147-154.
Europia (2012). How an oil refinery works. Available at:
https://www.europia.eu/content/default.asp?PageID=412&DocID=13974
(Accessed: 5th
February 2012).
Eurostat (2014). European Commission Statistics: Waste statistics – Waste streams.
Available at:
http://epp.eurostat.ec.europa.eu/portal/page/portal/environment/data/main_tables
(Accessed: 2nd
February 2014).
Evangelisti, S., Lettieri, P. and Clift, R. (2013). Life Cycle assessment of energy from
waste via anaerobic digestion: A UK case study. Waste Management, article in
press.
Evans, S., Bergendahl, M., Gregory, M. and Ryan, C. (2009) Towards a sustainable
industrial system: accelerating the contribution of education and research.
University of Cambridge, Institute for Manufacturing and Crandfield University.
Great Britain.
ExxonMobil (2012). A simple guide to oil refining. Available at:
http://www.exxonmobil.co.uk/UK-English/files/simpleguideoilrefining.pdf
(Accessed: 3rd
June 2012).
ExxonMobil (2013). Safety and Environment: Environmental Performance. Available
at: http://www.exxonmobil.co.uk/Corporate/safety_env.aspx (Accessed 25th
September 2013).
ExxonMobil (2013a). About us: How we operate. Available at:
http://www.exxonmobil.co.uk/Lubes/about_how.aspx (Accessed 29th
September
2013).
ExxonMobil (2013b). A news letter from Fawley Site. No. 32. Available at:
http://www.fawleyonline.org.uk/Esso-
Refinery/community_matters/PDF_files/issue-32.pdf (Accessed 6th
March 2014).
Fang, C. S., Chang, B. K. L., Lai, P. M. C. and Klaila, W. J. (1988). Microwave
demulsification. Chemical Engineering Communications, 73 (1), pp 227-239.
Doi:10.1080/00986448808940444.
Fischer-Kowalski, M., Krausmann, F., Giljum, S., Lutter, S., Mayer, A., Bringezu, S.,
Moriguchi, Y., Schutz , H., Schandl, H. and Weisz, H. (2011). Methodology and
Indicators of Economy-wide Material Flow Accounting: State of the Art and
References
237
Reliability Across Sources. Journal of Industrial Ecology, Volume 15, Issue 6, pp
855-876.
Geyer, R., Davis, J., Ley, J., He, J., Clift, R., Kwan, A., Sansom, M. and Jackson, T.
(2007). Time-dependent material flow analysis of iron and steel in the UK Part 1:
Production and consumption trends 1970–2000. Resources, Conservation and
Recycling, 51, pp 101–117.
Ghosh, A. K., Ray, S., Basu, J. K. (2000). To study and develop a process for the
removal of oil from oily sludge. M.Tech. Thesis, Department of Chemical
Engineering, Indian Institute of Technology, Kharagpur, India.
Graedel, TE (2002). The contemporary European copper cycle: introduction. Ecological
Economics, Vol. 42 (1,2), pp 5-7.
Grant, R. (2013). The Development of Knowledge management in the oil and Gas
Industry. Universia Business Review. Cuarto trimestre 2013. ISSN: 1698-5117.
Available at:
http://ubr.universia.net/pdfs_revistas/articulo_352_1381330772384.pdf (Accessed
19th
February 2014).
GRI (2013). G4 Sustainability reporting guidelines. Available at:
https://www.globalreporting.org/resourcelibrary/GRIG4-Part1-Reporting-
Principles-and-Standard-Disclosures.pdf (Accessed 3rd
February 2014).
Hart, A., Clift, R., Riddlestone, S. and Buntin, J. (2005). Use of life cycle assessment to
develop industrial ecologies-A case study: graphics paper. Trans IChermE, part B.
Process Safety and Environmental Protection, 83 (B4), pp 359-363.
Hedergaar, C. (2014). Roadmap for moving to a low-carbon economy in 2050.
Available at: http://ec.europa.eu/clima/policies/roadmap/index_en.htm (Accessed:
25th
January 2014).
HIS Purvin & Gertz (2013). The role and future of the UK Refining Sector in the supply
of petroleum products and its value to the UK economy. Available at:
http://www.ukpia.com/files/pdf/therolefutureoftheukrefiningsector.pdf (Accessed
28th
April 2014).
Hjorth, P. and Bagheri, A. (2006). Navigating towards sustainable development: A
system dynamics approach. Futures, Volume 38, Issue 1, pp 74-92. ISSN 0016-
3287.
HM Revenue & Customs (2013). Carbon Price Floor. Available at:
http://www.hmrc.gov.uk/climate-change-levy/carbon-pf.htm (Accessed 28th
April
2014).
HSE (2014). Personal Protective Equipment. Available at:
http://www.hse.gov.uk/toolbox/ppe.htm (Accessed 6th
May 2014).
References
238
Hu, G., Li, J. and Zeng, G. (2013). Recent development in the treatment of oily sludge
from petroleum industry: A review. Journal of Hazardous Materials, 261 (0), pp
470-490. Doi:http://dx.doi.org/10.1016/j.jhazmat.2013.07.069.
Huang, C., Vause, J., Ma, H. and Yu, C. (2012). Using material/substance flow analysis
to support sustainable development assessment: A literature review and outlook.
Resources, Conservation and Recycling, 68 (0), pp 104-116.
Doi:10.1016/j.resconrec.2012.08.012.
IChemE (2014). The sustainability metrics. Available at:
http://www.icheme.org/communities/special-interest-
groups/sustainability/~/media/Documents/Subject%20Groups/Sustainability/Newsl
etters/Sustainability%20Metrics.ashx (Accessed 15th
January 2014).
IEA (2012). World Energy Outlook 2012 Factsheet: How will global energy markets
evolve to 2035?. Available at:
http://www.worldenergyoutlook.org/media/weowebsite/2012/factsheets.pdf
(Accessed: 13th
May 2013).
IEMA (2011). The State of Environmental Impact Assessment Practice in the UK.
Available at: http://www.iema.net/state-environmental-impact-assessment-eia-
practice-uk (Accessed 15th
May 2013).
IEMA (2014). EIA case studies. Available at: http://www.iema.net/case-studies
(Accessed 12th
February 2014).
IISD (2013). Corporate Social Responsibility. Available at:
http://www.iisd.org/business/issues/sr.aspx (Accessed 10th
February 2014).
ILO (2006). Tripartite declaration of principles concerning multinational enterprises and
social policy (MNE Declaration). 4th Edition. Available at:
http://www.ilo.org/empent/Publications/WCMS_094386/lang--en/index.htm
(Accessed 29th April 2014).
Ineos (2007). Refining: ISO. Available at: http://www.ineosrefining.com/81-ISO.htm
(Accessed 29th
September 2013).
IPCC (2013). Climate Change 2013: The Physical Science Basis. Available at:
http://www.ipcc.ch/report/ar5/wg1/#.UoiZ49LwkYM. Accessed: 11th
November
2013.
ISO (1997). Environmental management-life cycle assessment-principles and
framework. ISO 14040, International Organisation for Standardisation, Geneva.
ISO (2010). ISO 26000: Social Responsibility. Available at:
http://www.iso.org/iso/home/standards/iso26000.htm (Accessed 12th
February
2014).
References
239
Jean, D. S., Lee, D. J. and Wu, J. C. S. (1999). Separation of oil from oily sludge by
freezing and thawing. Water Research, 33 (7), pp 1756-1759.
Doi:http://dx.doi.org/10.1016/S0043-1354(99)00005-6.
Jelinski, L.W., Graedel, T.E., Laudise, R.A., McCall, D.W. and Patel, C.K. (1992).
Industrial ecology: concepts and approaches. Proceedings of the National Academy
of Sciences, 89 (3), pp. 793-797. Doi:10.1073/pnas.89.3.793.
Jing, G., Luan, M. and Chen, T. (2011). Prospects for Development of Oily Sludge
Treatment. Chemistry and Technology of Fuels and Oils, 47 (4), pp 312-326. Doi:-
10.1007/s10553-011-0301-4.
Jing, G., Luan, M., Du, M., Han, C. (2012). Treatment of oily sludge by advanced
oxidation process. Environmental Earth Sciences, 67 (8), pp 2217-2221.
Johnston, P., Everard, M., D. Santillo and K.-H. Robèrt (2007). Reclaiming the
Definition of Sustainability. Environmental Science Pollution Research 14 (1), pp
60 - 66.
Joseph, P.J. and Joseph, A. (2009). Microbial enhanced separation of oil from a
petroleum refinery sludge. Journal of Hazardous Materials, 161 (1), pp 522-525.
Doi:http://dx.doi.org/10.1016/j.jhazmat.2008.03.131.
Khan, M. I. and Islam, M. R. (eds.) (2004). Petroleum Engineering Handbook -
Sustainable Operations.Gulf Publishing Company.
Kanji, G.K. (1990). Total Quality Management: The Second Industrial Revolution.
Total Quality Management, 1 (1), pp 3-12.
Karayildirim, T., Yanik, J., Yuksel, M. and Bockhorn, H. (2006). Characterisation of
products from pyrolysis of waste sludges. Fuel, 85, pp 1498-1508. Doi:
10.1016/j.fuel.2005.12.002.
Kriipsalu, M., Marques, M. and Maastik, A. (2008). Characterization of oily sludge
from a wastewater treatment plant flocculation-flotation unit in a petroleum
refinery and its treatment implications. The Journal of Material Cycles and Waste
Management, 10 (1), pp 79-86. Doi:http://dx.doi.org/10.1007/s10163-007-0188-7.
Lam, S. and Chase, H. A (2012). Review on Waste to Energy Processes Using
Microwave Pyrolysis. Energies, 5 (10), pp 4209-4232. Available at:
http://www.mdpi.com/1996-1073/5/10/4209 (Accessed 6th
March 2014).
Lawrence, G. (2012). Cost estimating for turnarounds. Digital Refining : Processing,
Operations and Maintenance. PTQ Q1 2012. Available at:
http://www.digitalrefining.com/data/articles/file/505364611.pdf (Accessed 1st June
2014).
Lazarevic, D., Buclet, N. and Brandt, N. (2012). The application of life cycle thinking
in the context of European waste policy. Journal of Cleaner Production, 29-30
(2012), pp 199-207.
References
240
Legislation.gov.uk (1990). Environmental Protection Act 1990. Available at:
http://www.legislation.gov.uk/ukpga/1990/43/introduction (Accessed 3rd
March
2014).
Legislation.gov.uk (1999). The Town and Country Planning (Environmental Impact
Assessment) (England and Wales) Regulations 1999 No 293. Available at:
http://www.legislation.gov.uk/uksi/1999/293/made (Accessed 29th April 2014).
Legislation.gov.uk (ed.) (2010). The Environmental Permitting (England and Wales)
Regulations 2010. Draft edn. Available at:
http://www.legislation.gov.uk/ukdsi/2010/9780111491423/pdfs/ukdsi_9780111491
423_en.pdf (Accessed 15th
February 2014).
Leonard, S. A. and Stegemann, J. A. (2010). Stabilization/solidification of petroleum
drill cuttings: Leaching studies. Journal of hazardous materials, 174 (1–3), pp 484-
491. Doi:http://dx.doi.org/10.1016/j.jhazmat.2009.09.078.
Ley, J. (2003). An environmental and material flow analysis of the UK steel
construction sector. Doctor of Engineering. Cardiff University. Available at:
http://ethos.bl.uk/SearchResults.do (Accessed 20th
November 2013).
Li, B., Zeng, F., Ma, W., Dong, Q., Fan, H. and Deng, C. (2011). Vertical Pollution
Characteristics of PAHs around an Oil Sludge Storage Site of Jianghan Oil Field of
China. Procedia Environmental Sciences, 11, Part C, pp 1285-1290.
Doi:http://dx.doi.org/10.1016/j.proenv.2011.12.192.
Liu,Q., Jiang,P., Zhao,J., Zhang,B., Bian,H. and Qian, G. (2011). Life cycle assessment
of an industrial symbiosis based on energy recovery from dried sludge and used oil.
Journal of Cleaner Production, 19 (15), pp. 1700-1708.
doi:http://dx.doi.org/10.1016/j.jclepro.2011.06.013.
LME (2014). London Metal Exchange. Historical Data. Available at:
http://www.lme.com/metals/reports/averages/ (Accessed, 15th
April 2014).
Maga, S., Goetz, F. and Durlak, E. (2003). Operational Test Report: On-site
Degradation of oily sludge in a Ten-Thousand gallon Sequencing Batch Reactor at
Navsta Pearl Harbor, HI. Naval Facilities Engineering Command, Port Hueneme,
California. Available at:
http://oai.dtic.mil/oai/oai?verb=getRecord&metadataPrefix=html&identifier=ADA
423275 (Accessed 6th
March 2014),
Mandal, A. J., Sarma, P. M., Singh, B., Jeyaseeelan, C. P., Channashettar, V. A., Lal, B.
and Datta, J. (2011). Bioremediation: A sustainable Eco-Friendly Biotechnological
Solution for Environmental Pollution in Oil Industries. Journal of Sustainable
Development and Environmental Protection, 1 (3), pp 5-23.
Maon, F., Swaen, V. And Lindgreen, A. (2008). Mainstreaming the corporate social
responsibility agenda: A model grounded in theory and practice. Université
catholique de Louvain, Louvain School of Management Working Papers Series,
paper 08/22. Available at:
References
241
https://www.uclouvain.be/cps/ucl/doc/iag/documents/WP_22_Maon_Swaen_Lindg
reen.pdf (Accessed 5th
February 2014).
Mazlova, E. A. and Meshcheryakov, S. V. (1999). Ecological Characteristics of Oily
Sludge. Chemistry and Technology of Fuels and Oils, 35 (1), pp 49-53.
McCormick, J. (1991). Reclaiming Paradise: The Global Environmental Movement.1st
ed. edn. United States of America: Indiana University Press.
McDonough, D. (2011). Presentation made to Orielton FSC. Pembroke Refinery.
Internal document.
McDonough, D. (2012). Waste management in Pembroke Refinery. Monthly HES team
meetings. Internal document.
McDonough, D. (2012a). Pembroke Refinery 2012 Turnaround Environmental Plan.
Internal document.
McKenna, J. (2015). Refined Capacity : the future of UK refineries. Process
Engineering. Available at : http://processengineering.theengineer.co.uk/oil-and-
gas/refined-capacity-the-future-of-uk-refineries/1019675.article (Accessed 23rd
November 2015).
Minciardi, R., Paolucci, M., Robba, M. and Sacile, R. (2007). Multi-objective
optimisation of solid waste flows: Environmentally sustainable strategies for
municipalities. Waste Management, 28, pp 2202-2212.
Mishra, S. (1986). Separation process for treatment of oily sludge.US 4851123 A.
Nahmad, D.G. (ed.) (2012). Method to recover crude oil from sludge or emulsion. US
8197667 B2 edn.
Ness, B., Urbel-Piirsalu, E., Anderberg, S. and Olsson, L. (2007). Categorising tools for
sustainability assessment. Ecological Economics, 60 (3), pp. 498-508. doi:
http://dx.doi.org/10.1016/j.ecolecon.2006.07.023.
NRW (2013). Natural Resources Wales: Our work, about us. Available at:
http://naturalresourceswales.gov.uk/our-work/about-us/?lang=en (Accessed: 23rd
September 2013).
OECD (2008). Key Environmental Indicators. Environment Directorate Paris, France.
OECD (2008a). Measuring material flows and resource productivity. The OECD Guide,
Volume I. Paris, France.
OECD (2011). Guidelines for Multinational Enterprises. 2011 edn. Available at:
http://www.oecd.org/daf/inv/mne/48004323.pdf (Accessed: 13th
February 2014).
Ondeo (2013). CentriChem: Innovation to treat oily sludge, recover oil, minimise waste,
and reduce disposal costs. Available at:
References
242
file:///C:/Users/rotzeri/Downloads/CentriCHEM_FINAL.pdf (Accessed 6th March
2014).
Oppelt, E.T. (1987). Incineration Of Hazardous Waste. Journal of Air Pollution Control
Association, 37 (5), pp 558-586. Doi:10.1080/08940630.1987.10466245.
ORECO (ed.) (2002). Choosing a safe and environment friendly tank cleaning method.
Available at:
http://www.oreco.com/Admin/Public/DWSDownload.aspx?File=Files%2FFiles%2
FGlobal%2FPDF%2FCases-ruhr-environ-uk.pdf (Accessed 18th
October 2013).
O’Rourke, D. and Connolly, S. (2003). Just oil? The distribution of environmental and
social impacts of oil production and consumption. Annual Review of Environment
and Resources, Vol. 28, pp 587-617.
Pinheiro, B. C. A. & Holanda, J. N. F. (2013). Obtainment of porcelain floor tiles added
with petroleum oily sludge. Ceramics International, 39 (1), pp 57-63.
Doi:http://dx.doi.org/10.1016/j.ceramint.2012.05.092.
Poche, L., Derby, R. and Wagner D. (1991). Solvent Extaction of refinery wastes rates
EPA BDAT. Oil and Gas Journal. Available at:
http://www.ogj.com/articles/print/volume-89/issue-1/in-this-issue/refining/solvent-
extraction-of-refinery-wastes-rates-epa-bdat.html (Accessed 19th
October 2013).
Ramachandran, V. (2010). Development of an innovative and environmentally
sustainable solid waste stream treatment process. Robert Gordon University,
Aberdeen, UK.
Ramaswamy, B., Kar, D. D. and De, S. (2007). A study on recovery of oil from sludge
containing oil using froth flotation. Journal of environmental management, 85 (1),
pp 150-154. Doi:http://dx.doi.org/10.1016/j.jenvman.2006.08.009.
Rashmi, R. S. and Deka, S. (2013). Removal of hydrocarbon from refinery tank bottom
sludge employing microbial culture. Environmental Science and Pollution
Research, 20 (12), pp 9026-9033.Doi: 10.1007/s11356-013-1888-2.
Rincón, L., Castell, A., Pérez, G., Solé, C. and Boer, D. (2013). Evaluation of the
environmental impacts of experimental buildings with different constructive
systems using Material Flow Analysis and Life Cycle Assessment. Applied Energy,
109 (0), pp 544-552. Doi:http://dx.doi.org/10.1016/j.apenergy.2013.02.038.
Robèrt, K.-H. (2000). Tools and concepts for sustainable development, how do they
relate to a general framework for sustainable development, and to each other?.
Journal of Cleaner Production. Volume 8, pp 243 - 254
Robèrt, K.-H., Schmidt-Bleek, B., Aloisi de Larderel, J., Basile G., J.L. Jansen, R.
Kuehr, P. Price Thomas, M. Suzuki, P. Hawken, M. Wackernagel (2002). Strategic
sustainable development — selection, design and synergies of applied tools,
Journal of Cleaner Production, Volume 10, Issue 3, June 2002, Pages 197-214,
ISSN 0959-6526.
References
243
Robertson, S. J., McGill, W. B., Massicotte, H. B. and Rutherford, P. M. (2007).
Petroleum hydrocarbon contamination in boreal forest soils: a mycorrhizal
ecosystems perspective. Biological Reviews, 82 (2), pp 213-240.
Doi:10.1111/j.1469-185X.2007.00012.x.
Sadler, B. (1996). International Study of the Effectiveness of Environmental
Assessment: Final Report. Available at: http://www.ceaa-
acee.gc.ca/Content/2/B/7/2B7834CA-7D9A-410B-A4ED-
FF78AB625BDB/iaia8_e.pdf (Accessed 24th
May 2013).
Sankaran, S., Pandey, S. and Sumathy, K. (1998). Experimental investigation on waste
heat recovery by refinery oil sludge incineration using fluidised‐bed technique.
Journal of Environmental Science and Health, Part A, 33 (5), pp 829-845.
Doi:10.1080/10934529809376764.
Saurat, M. (2006). Material Flow Analysis and Environmental Impact Assessment
Related to Current and Future Use of PGM in Europe. Master of Science Thesis in
the Master Degree Programme, Industrial Ecology. Department of Energy and
Environment, Division of Physical Resource Theory, Chalmers University of
Technology, Goteborg, Sweeden.
Schlumberger (2007). Production Waste Management: Converting oily sludge, slop oil
and off-spec crude oil from an environmental liability to income. Available at:
http://www.slb.com/~/media/Files/miswaco/brochures/Production_Waste_Mgmt.p
df (Accessed 13th
September 2013).
Schlumberger (2013). Refinery and Terminal Oil Storage Tank Cleaning and Sludge
Management Services. Available at:
http://www.slb.com/~/media/Files/miswaco/brochures/idrabel_tank_cleaning.pdf
(Accessed 13th
September 2012).
Schmidt-Bleek, F. (1993). The Fossil Makers. MIPS: A New Ecological Measure.
Chapter III. Factor 10 Institute (France) and the Factor 10 Club. Available at:
http://www.factor10-institute.org/publications.html#factor10_1993_1995
(Accessed 30th
January 2014).
Scientific Software Group (2013). Enviro data software. Available at:
http://www.scisoftware.com/environmental_software/product_info.php?cPath=24&
products_id=72&sessid=8dd203b8a7c29eafcc9ff58f999ae39d (Accessed 30th
November 2013).
Sheate, W. (2010). Tools, Techniques & Approaches for Sustainability: Collected
writings in Environmental Assessment Policy and Management. Singapore: World
Scientific Publishing Co. Pte. Ltd.
Sinclair, P., Cowell, S., Löfstedt, R. and Clift, R. (2007). A case study in participatory
environmental systems assessment with the use of multimedia materials and
quantitative LCA. Journal of Environmental Assessment, Planning and
Management, 9 (4), pp 399-421.
References
244
Solomon Associates Inc. (2012). Available at: http://solomononline.com/ (Accessed 1st
April 2012).
Spangler, I. and Pompper, D. (2011). Corporate social responsibility and the oil
industry: Theory and perspective fuel a longitudinal view. Public Relations Review
37, pp 217- 225.
Speight, J. G. and Arjoon, K. K. (2012). Energy and Environment : Bioremediation of
Petroleum and Petroleum Products. Somerset, NJ, USA: Wiley.
Splainex (2012). Large-scale pyrolysis plant. Available at:
http://www.splainex.com/pyrolysis_video_photo.htm#pyrolysis_photo (Accessed
13th
September 2013).
Steurer, R. and Berger, G. (2010). The Lisbon Strategy and sustainable development
trategies across Europe: How different governance arrangements shape the
European coherence of policy documents. Institute of Forest, Environmental and
Natural Resource Policy. Available at:
http://www.wiso.boku.ac.at/fileadmin/data/H03000/H73000/H73200/InFER_Discu
ssion_Papers/InFER_DP_10_1_Lisbon_Strategy___SDS.pdf (Accessed 28th
April
2014).
Stiller, H. (1999). Materials Intensity of Advanced Composite Materials: Results of a
study for the Verbundwerkstofflabor Bremen e.V. Available at:
http://epub.wupperinst.org/frontdoor/index/index/docId/926 (Accessed: 30th
August
2013).
Suchman, M. (1995). Managing Legitimacy: Strategic and institutional Approaches.
Academy of Management Review, Vol. 20, No. 3, pp 571-610.
Tachibana, J., Hirota, K., Goto, N. and Fujie, K. (2008). A method for regional-scale
material flow and decoupling analysis: a demonstration case study of Aichi
prefecture, Japan. Resources Conservation and Recycling, Volume 52, Issue 12, pp
1382-1390.
Taha, R., Mohamedzein, Y., Al-Rawas, A. and Al-Suleimani Y. (2010). Solidification
of Tank Bottom Sludge. Geotechnical and Geological Engineering, 28 (1), pp 15-
25. Available at: http://link.springer.com/article/10.1007%2Fs10706-009-9273-0
(Accessed 5th
September 2013).
Taiwo, E. A. and Otolorin, J. A. (2009). Oil Recovery from Petroleum Sludge by
Solvent Extraction. Petroleum Science and Technology, 27 (8), pp 836-844.
Doi:10.1080/10916460802455582.
Tan, W., Yang, X. and Tan, X. (2007). Study on Demulsification of Crude Oil
Emulsions by Microwave Chemical Method. Separation Science and Technology,
42 (6), pp 1367-1377. Doi:10.1080/01496390701193736.
TCE (2015). Oil CEOs commit to climate change action. International News, the
chemical engineer, Issue 893, November 2015.
References
245
TODAYINSCI (2013). Science Quotes by Baron William Thomson Kelvin. Available
at: http://www.todayinsci.com/K/Kelvin_Lord/KelvinLord-Quotations.htm
(Accessed: 1st January 2014).
Total (2013). Total Environmental Management. Available at:
http://www.uk.total.com/activities/environment_onshore.asp (Accessed 29th
September 2013).
Triantaphyllou, E., Shu, B., Sanchez, N. and Ray, T. (1998). Multi-Crietria Decision
Making: An Operations Research Approach. Encyclopedia of Electrical and
Electronic Engineering, 15, pp 175-186. John Wiley & Sons. New York, NY.
Tromans, S. (2012). Environmental Impact Assessment. 2nd
edition, Bloomsbury
Professional Ltd. 175.
UK Government (2014). CRC Energy Efficiency Scheme. Available at:
https://www.gov.uk/government/policies/reducing-demand-for-energy-from-
industry-businesses-and-the-public-sector--2/supporting-pages/crc-energy-
efficiency-scheme (Accessed 28th
April 2014).
UK Governement (2013). Landfill Tax. Available at:
http://customs.hmrc.gov.uk/channelsPortalWebApp/channelsPortalWebApp.portal?
_nfpb=true&_pageLabel=pageExcise_ShowContent&id=HMCE_CL_001206&pro
pertyType=document (Accessed 30th
November 2013).
UK Parliament (2013). Energy and Climate Change Committee: Written evidence
submitted by the Environment Agency. Available at:
http://www.publications.parliament.uk/pa/cm201314/cmselect/cmenergy/340/340w
e15.htm (Accessed 29th
August 2013).
UKPIA (2013). A Question of Balance. Available at:
http://www.ukpia.com/files/pdf/aquestionofbalancea4.pdf (Accessed 5th
May
2013).
UN CSD (2002). Implementing Agenda 21: Report of the Secretary-General,
Commission on Sustainable Development acting as the preparatory committee for
the World Summit on Sustainable Development, Second preparatory session 28
January - 8 February 2002. Available at:
http://iefworld.org/wssd_sg.htm#II.%20MAJOR%20TRENDS%20AND%20DEV
ELOPMENTS%20SINCE%20UNCED (Accessed: 1st February 2014).
UN CSD (2007). Indicators of Sustainable Development: Guidelines and
Methodologies. 3rd
edition, The Department of Economic and Social Affairs,
United Nations, New York.
UN Global Compact (2014). The Ten Principles. Available at:
http://www.unglobalcompact.org/AboutTheGC/TheTenPrinciples/index.html
(Accessed 29th
April 2014).
References
246
UNEP (2009). Guidelines for social life cycle assessment of products. ISBN: 978-92-
807-3021-0. Available at:
http://www.unep.fr/shared/publications/pdf/DTIx1164xPA-guidelines_sLCA.pdf
(Accessed 11th
February 2014).
Vaaland, T. and Heide, M. 2007. Managing corporate social responsibility: lessons from
the oil industry. Corporate Communications: An International Journal, Vol. 13, No.
2, pp 212-225.
Valero Energy Ltd. (2012). Pembroke Refinery: 2012 pollution inventory data.
Available at internal refinery network or at the Environment Agency upon request.
Valero Energy Ltd. (2012a). Pembroke Refinery EMS Manual: ISO 14001-2004.
Internal document No. PP-ENV-MAN-0001.
Valero Energy Ltd. (2012b). Health, Environment and Safety Policy. Internal document
in Pembroke Refinery EMS Manual: ISO 14001-2004.
Valero Energy Ltd. (2012c). Pembroke Refinery EMS Procedure: Index. Internal
document No. PP-ENV-ISO-0001 in Pembroke Refinery EMS Manual: ISO
14001-2004.
Valero Energy Ltd. (2012d). Commitment to Excellence Management System. Internal
document.
Valero Energy Ltd. (2012e). Environmental aspects and impacts register. Internal
document in Pembroke Refinery EMS Manual: ISO 14001-2004.
Valero Energy Ltd. (2012f). Pembroke Refinery: Overview. Available at:
http://www.valero.com/OurBusiness/OurLocations/Refineries/Pages/Pembroke.asp
x (Accessed 31st August 2012).
Valero Energy Ltd. (2012g). Pembroke Refinery simplified block diagram. Available at
internal refinery network administrated by the Refining area.
Valero Energy Ltd. (2012h). Development Maintenance and Review of Register of
environmental impacts. Pembroke Refinery EMS Primary Procedure No. PP-ENV-
ISO-1005.
Valero Energy Ltd. (2012i). Completing an electronic TR548. Pembroke Refinery EMS
Secondary Procedure No. PP-ENV-ISO-2025.
Valero Energy Ltd. (2012j). Proposal: Support of Landfarm License Surrender at the
Valero Pembroke Refinery. Internal Communication Report.
Valero Energy Ltd. (2012k). 4Q2012 Refining Turnaround Plan Communication
Sessions. Internal Presentation.
Valero Energy Ltd. (2012l). Planning and executing for a safe Pembroke turnaround.
Available at internal Refinery website portal.
References
247
Valero Energy Ltd. (2013). 2012 Social Responsibility Report. Available at:
http://www.valero.com/Environment_Safety/Pages/Home.aspx (Accessed: 13th
October 2013).
Valero Energy Ltd. (2013a). Legal Register - Valero Pembroke Plant - . Internal
document. Access to the Greenspace website (managed by Waterman
Environmental) limited to Refinery staff and selected stakeholders.
Valero Energy Ltd. (2013b). 2013 Pollution Inventory. Internal document available on
the Health, Environment and Safety Department network of Pembroke Refinery
(controlled access).
Valero Energy Ltd. (2013c). Pembroke Refinery work process to coordinate and
manage waste. No. PKB 0021. Internal document.
Valero Energy Ltd. (2013d). Waste Handling and Vacuum Truck Expenses. 2013 Costs
Saving Projects. Internal Communication.
Valero Energy Ltd. (2014). Our Business. Available at:
http://www.valero.com/OurBusiness/Pages/Home.aspx (Accessed 28th
April 2014).
Veolia Environmental Services (2013). Solid Separation Services. Available at:
http://www.veoliaes.com/en/services/enterprise/waste/solids-separation.html
(Accessed 6th
March 2014).
Veolia Water (2014). Sludge and Biosolids. Available at:
http://www.veoliawaterst.com/municipalities/sludge-biosolids/ (Accessed 6th
March 2014).
Villiers, C. and van Staden, C. (2011). Where firms choose to disclose voluntary
environmental information. Journal of Accountability and Public Policy, Vol. 30,
No. 6, pp 504-525.
Ward, O. and Singh, A. (2003). Biodegradation of oil sludge. US 6652752 B2.
Available at: http://www.google.nl/patents/US6652752 (Accessed 6th
March 2014).
Waterman (2013). Legal register management. Available at:
https://www.legalregister.co.uk/ (Accessed: 31st January 2014).
WBCSD (2014). About: Overview. Available at: http://www.wbcsd.org/about.aspx
(Accessed 2nd
January 2014).
WCED. (1987) Our Common Future. Oxford University Press, pp 89.
Welford, R. (1997). Environmental Strategy and Sustainable Development: The
Corporate Challenge for the first century. Routledge, 11 New Fetter Lane, London.
Weston, N., Clift, R., Basson, L., Pouton,A. and White, N. (2008). Assessment of
cleaner process options: A case study from petroleum refining. The Canadian
Journal of Chemical Engineering, 86 (3), pp 302-315. doi:10.1002/cjce.20051.
References
248
Weston, N. (2011) Identifying more sustainable technological solutions for the Oil
Refining Industry. Vol.1 University of Surrey. Faculty of Engineering and Physical
Sciences. Centre for Environmental Strategy.
Weston, N., Clift, R., Holmes, P., Basson, L. and White, N. (2011a) Streamlined Life
Cycle Approaches for Use at Oil Refineries and Other Large Industrial Facilities.
Industrial & Engineering Chemistry Research, 50, pp 1624-1636.
Wuppertal (2013). Wuppertal Institute for Climate, Environment and Energy. Material
intensity factors. Available at: http://wupperinst.org/en/info/details/wi/a/s/ad/365/
(Accessed 2nd
February 2014).
Yan, P., Lu, M., Yang, Q., Zhang, H.and Zhang, Z. (2012). Oil recovery from refinery
oily sludge using a rhamnolipid biosurfactant-producing Pseudomonas.
Bioresource technology, 116 (0), pp 24-28.
Doi:http://dx.doi.org/10.1016/j.biortech.2012.04.024.
Yang, L., Nakhla, G. and Bassi, A. (2005). Electro-kinetic dewatering of oily sludges.
Journal of Hazardous Materials, 125 (1–3), pp 130-140.
Doi:http://dx.doi.org/10.1016/j.jhazmat.2005.05.040.
Zbicinski, I., Stavenuiter, J., Kozlowska, B. and van de Coevering, H. (2007).
Environmental Management, Book 3. Product Design and Life Cycle Assessment.
Baltic University Press, 2007. ISBN: 91-975526-2-3. Available at:
http://www.balticuniv.uu.se/index.php/boll-online-library/828-em-3-product-
design-and-life-cycle-assessment- (Accessed 10th
February 2014).
Zhou Li-kun (ed.) (2011). Oil sludge pure physical treatment process and parameter
Optimization. Changchun, China: International Conference on Transportation,
Mechanical, and Electrical Engineering (TMEE) December 16-18.
Zubaidy, E. A. H. and Abouelnasr, D. M. (2010). Fuel recovery from waste oily sludge
using solvent extraction. Process Safety and Environmental Protection, 88 (5), pp
318-326. Doi:http://dx.doi.org/10.1016/j.psep.2010.04.001.
Appendix
249
APPENDIX
Appendix A EMS elements based on ISO-14001:2004 at glance
Appendix B Refinery areas, business units and waste streams
Appendix C List of Waste (LoW)
Appendix D Waste Framework Directive: disposal and recovery (recycling) codes
Appendix E Waste collection vehicles and containers most used in Valero Refinery,
Pembroke
Appendix F Main waste streams, handling and storage areas in Valero Refinery,
Pembroke, and Off-site Treatment Facilities
Appendix G Work process PKB-0021-Coordinate and Manage Waste of Valero
Refinery, Pembroke
Appendix H Criteria for determining best available techniques
Appendix I Wastes generated in Valero Refinery, Pembroke, over 2007-2011
Appendix J Crude oil processed and alkylate produced over 2007-2011 in Valero
Refinery, Pembroke
Appendix K Waste and Cost KPIs per type of waste of Valero Refinery, Pembroke,
over 2007-2011
Appendix L Five-Year Waste Review Executive Summary of Valero Refinery,
Pembroke
Appendix M Waste production and off-site costs per type of waste in 2012 of Valero
Refinery, Pembroke
Appendix N Waste production and off-site costs per treatment method and EWC
codes in 2013 of Valero Refinery, Pembroke
Appendix O Detailed metals production and rebate costs in 2013 of Valero Refinery,
Pembroke
Appendix P Detailed oily sludge production of England and Wales oil refineries over
2008-2012
Appendix
250
Appendix A. EMS elements based on ISO-14001:2004 at glance
Figure A-1 shows the most relevant elements of an environmental management system based on ISO 14001:2004.
Figure A-1. EMS elements based ISO 14001:2004 at a glance (Source: adapted from BSI, 2009 and Cheremisinoff, 2006)
Is the statement through which companies make a firm commitment to comply with relevant environmental legislations and regulations. It provides a framework for setting and reviewing goals aiming to protect the environment (pollution prevention). It can vary from company to company: “there are no boiler plates to policy statements” (Cheremisinoff, 2006, pp 56). Key requirements: the environmental policy should be documented, well maintained, implemented and communicated to workforce and other interested parties (BSI, 2009, pp 4).
This stage involves the identification of environmental
aspects (i.e. activities, products or services which interact in a way or another to the environment), the impacts they produce and the design of plans to minimise them (improvement plans). It is advisable that prioritisation should be given to the environmental
aspects according to a set of criteria including risks of the impacts (i.e. high, medium, low), consequences (i.e. short, medium and long terms) and probability of occurrence (i.e. highly unlikely, unlikely, likely). The planning stage also indicates that the organisation shall
establish and maintain procedures to identify and access all the legal requirements and to point out how they are related to the environmental aspects. Objectives, targets and programs should also be established at this stage to maximise pollution
prevention.
At this stage improvement plans are put into action to correct or change those aspects which adversely affect the environment. Others actions should be carried out such as the appropriate management and deployment of resources to guarantee that the EMS objectives can be achieved, the assignment of roles and responsibilities to establish, implement and maintain the EMS, the promotion of workforce environmental awareness through competence and training programs and the communication (internally and externally) of those aspects affecting the environmental performance including incidents and investigations, water, emissions and air quality reports. Also part of this stage are the documentation of policies and objectives, on-site procedures and other process which should be appropriately registered, stored and controlled to ensure its adequacy, applicability and validity. Operational control at this stage aims to ensure that planned activities at stage 2 are carried out under specified conditions. Emergency preparedness and response procedures are essential to implementation and operation. This element seeks to identify, prevent and mitigate all possible environmental accidents which can put at risk the preservation of the environment. Emergency preparednesand response procedures should be reviewed and test periodically.
Checking and corrective actions include all the
procedures in place to monitor, measure, control and record performance of process and activities which have the potential of causing
environmental harm. Following evaluation of compliance procedures are mandatory as well
as keeping records of evaluation results. Non-conformities, corrective and prevention actions procedures should define how to identify and
investigate non-compliances, evaluate and implement actions to correct/prevent
deviations and review the effectiveness of actions taken. Records of compliance with the EMS should be kept documented, legible and
available. Checking and corrective actions stage also indicates that internal audits should be
performed periodically to assess the EMS effectiveness and identify opportunities for improvement.
Management review should be carried out to the EMS in order to ensure “its continuing suitability, adequacy and effectiveness” (BSI, 2009, pp 9) aligned with the environmental objectives of the company. Changes to the EMS will be based on information ranging from internal audits, environmental performance, follow-up actions from previous reviews, new regulatory frameworks, etc. The results obtained from this review can result in changes on all the stages of the EMS from 1 to 4.
Environmental policy
(1)
Planning(2)
Implementation and operation
(3)
Checking and corrective
actions
(4)
Management review
(5) Continual improvement
Appendix
251
Appendix B. Refinery areas, business units and waste streams
The Valero Energy Ltd., Pembroke Plant, Wales has the capacity to refine a total of
270,000 barrels per day, including 220,000 barrels per day of crude plus 50,000 barrels
per day of other feedstocks. “Valero acquired the Pembroke Refinery in southwest
Wales in 2011, marking Valero’s entry in the European refining market. It makes
products including gasoline, diesel fuel, kerosene, liquefied petroleum gas and
petrochemical feedstocks. About 44% of Pembroke’s products are gasolines, including
ultra-low sulphur gasoline, and about 40 percent of products are distillates” (Valero
Energy Ltd. 2012f).
Figure B-1 presents the overall refinery flow schematic. It is important to notice that
although some units are not presented in the diagram they are named after as sources of
waste.
Appendix
252
Figure B-1. Simplified block diagram of Pembroke Refinery (Source: Valero Energy Ltd., 2012g)
Imports Sales
Crude
Butane
Russian
Gasoil
LSAR
VGO
Crude Unit
215
MBPD
[1]
Naphtha
Stabiliser[1]
Tartan
LPG Splitter
[1]
Kerosene Merox30 MBPD
[5]
Naphtha Hydrotreater
48 MBPD
[4]
Naphtha
Splitter[4]
Isomerisation Unit15 MBPD
[14]
Reformer / CCR35 MBPD
[7]
Hydrotreater 227 MBPD
[12]
Hydrotreater 1
35 MBPD
[3]
Vaccum Unit
96 MBPD
[01]
FCCU
90 MBPD
[02]
Visbreaker
27 MBPD
[6]
FCN
Splitter[02]
CDHydro40 MBPD
(ULSG)
[05]
CDHDS+
31 MBPD(ULSG)
[05]
Alkylation
32.5 MBPDAlkylateProduct
[04]
DIB
45 MBPD
[06]
LPG
Mogas
Kero/Jet
Fuel Oil
CarbonBlack
Diesel
Gasoil
LCGO
Alkylate
ReformateSplitter
27 MBPD
[7]
BenzeneH/Cut
CDU Overheads
Kerosene
Light Diesel
Heavy Diesel
VGO
LCGO
VDUDiesel
Atmos Residue
Vac Residue
Vis Tar BFO
LCGO
HCGO
LCN
HCN
HHCN
DSLN
DSHN
Fuel Gas
H2
H2
H2
H2
H2
VBGO
Visbreaker Gasoil
VBU LPG
LPG Unit
1856 knm3/d [10]
HTU 2 Rundown
HTU 1 Rundown
Fuel GasPropane
Butane
Naphtha
Fuel Gas
Fuel Gas
HCN
Alkylate
Propane
C3 & C4 Olefins
Iso ButaneBlend Butane
Heavy Naphtha
Light Reformate
Light Naphtha Isomerate
Benzene
Heavy Reformate
LCGO
HCGO
HCGO
VBU Gasoil
VBU Naphtha
HydroIsom26 MBPD
[04]H2
Butamer
20 MBPD
[06]
Sulphur Recovery160 tonne/day
[16]Sulphur
Sulphur
LCGO
LVGO
HVGO
HTU 1 Rundown
HWO
HWO
HHCN
Black Oils
White Oils
Cracking and
Olefins
Appendix
253
The operations in the Refinery are classified in five main areas: Black Oils (BOs),
Blending and Shipping (B&S), Cracking and Olefins (C&O), General On-Site
Facilities, Utility Areas and White Oils (WOs).
The BOs units process the raw crude and other feedstocks which are imported to the
Refinery to provide either final products to sales or feedstocks to other process units on
site within C&O and WOs areas. The business units that belong to BOs are the Crude
Distillation Unit (CDU), the Kerosene Merox Unit (KMU), the Visbreaking Unit (VBU)
and the Vacuum Distillation Unit (VDU). The Naphtha Stabiliser and the Depropaniser
LPG Splitter -or Tartan- Units are considered part of the CDU.
B&S covers the import, export and storage of all products and feed stocks to the units.
This can be broken down into two main areas, in-shore which covers Tankage and
Product Blending and the Jetty which covers the eight berth marine facilities for import
and export of the majority of feed stocks and products.
C&O are split into two main units: the Fluid Catalytic Cracking Unit (FCCU), which
uses a heavy complex hydrocarbon feed to produce lighter more profitable liquefied
petroleum gas (LPG) and petrol fractions and the Alkylation Unit (AlkyU) which
utilises light-end products to produce high octane products for gasoline blending. The
Amine Recovery Unit (ARU), the Butamer Unit (C4 isomerisation), the C&O Merox
Units (naphtha, butane and olefins), the Sulphur Recovery Unit (SRU) and the Ultra
Low Sulphur Gasoline (ULSG) Unit are also units assigned to the C&O area.
The General On-Site Facilities consist of the areas where waste can also be generated as
a result of storage and/or handling activities. These are the Asbestos Compound, the
Bundle Cleaning Area, the Crushed Concrete Compound, the Grit Blast Yard, the
Laboratory, the Recycling Facility and the Scrap Metal Compound. Office buildings,
control rooms, the canteen, the storage areas (main storage shack and SNAMS) and
workshops have also been classified in General On-Site Facilities.
The Utility Areas include the facilities used to provide the Refinery with water (process,
boiler feed, cooling, potable, fire and utility) as well as steam, air, fuel gas and nitrogen.
They comprise the Air System, the Condensate Return, the Cooling Towers, the Flare
Appendix
254
Systems, the Fuel Oil System, the Nitrogen Plant, the Raw Water Treatment Plant, the
Steam Generation Unit and the Waste Water Treatment Plant (WWTP).
WOs covers the hydrotreating and processing units which improve the quality and
profitability of light products enabling the Refinery to meet product specifications and
standards. The BU assigned to the WOs are Catalytic Reforming Unit (CCR/CRU),
Diesel Hydrotreater One (HTU-1), Diesel Hydrotreater Two (HTU-2), Hydrogen
Recovery Unit (HRU), Isomerisation Unit (light naphtha isomerisation), Liquid
Petroleum Gas Recovery Unit (LPGRU) and the Naphtha Hydrotreater (the Unifiner).
Tables B-1 to B-6 present a brief description of the Refinery areas, BU and the most
important waste streams they generate. The types of waste presented in this report were
fully defined according to the EU Commission Decision on List of Waste (LoW)
(Appendix C) and the Waste Framework Directive: disposal and recovery (recycling)
codes (Appendix D).
Appendix
255
Table B-1. Business units and waste streams in the BOs area
Area Business unit / waste producer Purpose of the Unit Waste streams
Bla
ck
Oil
s (
BO
s)
Crude Distillation Unit (CDU)
At atmospheric distillation, crude oil is subjected to a separation process which is based on the boiling point of its components. The heavier products from the CDU are subject to a further distillation under vacuum conditions to increase gas oil yield. Crude oil is pumped from tankage to the CDU where it passes through heat exchangers, desalters and fired heaters before going into the CDU column. The purpose of a crude oil desalter in an oil refinery is to remove water and to eliminate undesirable contaminants from the crude oil feedstock before it is refined to prevent fouling, corrosion and catalyst deactivation in downstream conversion process. These contaminants can be either water-soluble salts (i.e. magnesium, calcium and sodium chlorides) or sediments as clay, rust, sand, silt and asphaltenes.
As many process heaters are present in the CDU it is expected the production of coke is on a non-regular basis (only during TAs). Although heavy metals such as nickel and vanadium can accumulate in the coke, they are not considered waste streams but contaminants of the coke as sulphur. Insulation materials as asbestos can be still produced at the CDU as it is one of the oldest process unit of the Refinery and these materials were extensively used at the time the CDU was constructed. Other insulation (lagging) materials such as man-made fibres (rockwool and padock) can be generated during routine maintenance. Refractory materials are generated as wastes from flue gas ducting. Scrap metal is produced mostly during TAs. Desalting produces clays, salts and other suspended solids. These materials are removed by hot water washing and electrostatic separation. The solid fraction produced at a crude desalter is commonly called “desalter sludge” (a typical waste stream from the CDU).
Kerosene Merox Unit (KMU)
Treatments are used in the Refinery to meet certain product specifications. Some intermediate and final streams that are produced in the Refinery need to be treated to remove or reduce their content of water, hydrogen sulphide, acids and mercaptans (sulphur organic compounds). To remove mercaptans, the Refinery has four Merox Units (a.k.a. Mercaptan Oxidation Units) which treat the kerosene produced in the CDU, the heavy naphtha generated in the FCCU when ULSG is by-passed, the C3-C4 olefins produced in the FCCU and the butane from refrigerated storage and CDU.
The waste streams generated in the Merox Unit are the oxidation catalyst (cobalt phthalocyanine sulfonate impregnated on activated carbon), phenolic caustic (produced in the pre-wash unit and in the reactor), merox salt filter which removes any entrained water and in consequence reduces the levels of moisture in the product and merox clay filter which removes any oil-soluble substances, organometallic compounds (especially copper) and particulate matter.
Visbreaking Unit (VBU) Visbreaking is a well established thermal process that converts atmospheric or vacuum residues to gas, naphtha and distillates. An important feature of this process is the reduction of viscosity of the vacuum residue.
Waste streams produced in the VBU mainly come from the cleaning and TA of the Unit. Coke, insulation materials (asbestos, rockwool and padock) and scrap metal are the largest waste streams produced in the VBU.
Vacuum Distillation Unit (VDU)
The VDU processes the residuum from the CDU. The VDU is operated under vacuum to help recovery of light material from the heavy atmospheric residuum stream. It is designed to recover gas oil to feed the FCCU. The Unit also recovers diesel that was not done during atmospheric distillation. The vacuum residuum is normally sent directly to the Visbreaking Unit (VBU) as a hot feed, or cooled and blended with VBU bottoms and routed to storage.
The VDU produces coke from the process heaters on a non-regular basis (mostly during TA’s). Asbestos, rockwool and padock can also be produced in this Unit under similar conditions as the CDU. Scrap metal and refractory materials mainly are generated during TAs from ducting that conducts flue gases to stack.
Table B-2. Business units and waste streams in the B&S area
Area Business unit / waste producer Purpose of the Unit Waste streams
Ble
nd
ing
an
d S
hip
pin
g (
B&
S)
In-Shore Tank Farm
In the Refinery the Tank Farm Area (off-site) consists of 141 different tanks (of which 11 are for crude oil and two for Refinery slops) and pump stations which provide the Refinery with a storage capacity of 10.5 million barrels and blending facilities of feed and products. B&S also maintain the Butane Refrigeration Unit and the Gasoline Blender area which blends up to 16 different feedstocks to produce gasoline products.
In general, tanks accumulate sediments contained in the products stored and from corrosion. These products form a sludge that normally is considered a hazardous waste. It is common that tanks that generate more quantity of sludge are those which store heavy products such as crude oil, atmospheric residues, fuel oil and slops. Over 2007-2011 in the Refinery it was established per tank a 15-Year period for cleaning and inspection which resulted approximately in a total of nine tanks in service per year within this period. After 2011 the tank inspection programme was based on risk (i.e. Risk Inspection Programme) resulting in approximately seven tanks in service per year. Tank bottom sludge with high solid content is centrifuged to produce a centrifuged cake and then it is pressed to recover oil. The centrifuged cake is commonly sent to incineration (EPA, 1996) and the oil is sent back to slops. During TAs and depending on the scope of work, it is expected that B&S In-shore Tank Farm Area to generate a high amount of scrap metal as there is an important quantity of pipes (mileage) which carry products around site and to the unit feeds. Grit blast is also generated as a result of tank cleaning operations. Tank servicing is one of the largest sources of grit blast generation. Soil and stones containing dangerous substances can also be produced as a waste stream in the area by occasional spillages. Kerosene salt-based driers and activated carbon adsorbents (to remove traces of benzene from products) can also be produced as waste streams on a non-regular basis.
The Jetty
The Refinery has eight marine berths. All crude oil and feedstocks are imported in to the Refinery by sea, with an average of ten crude ships per month, which ensure that there is an uninterrupted supply of crude oil to feed the CDU. Crude imports account for 90% of the imports in to the Refinery; other imports include fuel oil, LPG, refrigerated butane and blend stocks for gasoline and diesel, such as biodiesel and gas to liquid product.
From the Jetty oily Personal Protective Equipment, absorbents, filter materials and wiping clothes contaminated by dangerous substances are wastes that can be generated as a result of normal operations. International catering waste (food waste) is generated with the same frequency as the ships dock in the Jetty.
Appendix
256
Table B-3. Business units and waste streams in the C&O area
Area Business unit / waste producer Purpose of the Unit Waste streams
Cra
ck
ing
an
d O
lefi
ns (
C&
O)
Alkylation Unit (AlkyU)
The purpose of alkylation is to yield high-quality motor fuel blending known as “Alkylate”. A reaction between short chain olefins from the FCCU and isobutane takes place under low temperatures. In the Refinery the reaction is conducted in the presence of hydrofluoric acid (HF). The olefin feed to the AlkyU is first sweetened (sulphur removal) in the Olefin Merox Unit and its quality is further improved by hydro-isomerisation and distillation to remove light ends and water before entering the AlkyU.
The major waste stream generated in Alky is spent fluoridic caustic as a result of neutralisation of the hydrofluoric acid losses (catalyst) with sodium hydroxide. Some other wastes are generated such as dissolved polymerization products (a.k.a. acid soluble oils) removed from the acid as thick dark oil, inorganic fluorides (NaF) and chlorides from treatment stages. Activated alumina, and aluminium fluoride from defluorinators contaminated with HF can also be produced as a waste stream. In the hydroisomerisation unit the selective hydrogenation of 1,3-butadiene to butenes and the isomerization of 1-butene to 2-butene take place on a palladium based catalyst which when spent is considered as a waste stream. An alumina guard bed with lead oxide (also considered as a waste stream) precedes the hydroisomerisation reactor to remove potential carbonyl sulphur compounds in the feed. Both spent palladium based catalyst and alumina from the guard bed are generated as waste streams. Other waste streams such as potassium fluoride and potassium hydroxide (KOH) sludge are produced in the propane and butane KOH treaters which remove entrained water and traces of HF from the propane and n-butane also produced in the AlkyU.
Amine Recovery Unit (ARU)
The purpose of the ARU is to regenerate diethanolamine (DEA) rich in hydrogen sulphide (H2S) to produce regenerated or lean amine. H2S is produced in a number of units throughout the Refinery and it is removed by absorbing the gas in a solution of DEA in the ARU. The amine containing H2S (a.k.a. rich amine), returns to the ARU where the H2S is separated and routed to the Sulphur Recovery Unit (SRU).
The main waste stream produced in this unit is low strength DEA (a.k.a. in the Refinery as amine water). This waste stream is only generated during abnormal process conditions that can cause amine contamination or when the Unit is shutdown during a TA.
Butamer (C4 isomerisation)
The Butamer Unit is specifically designed for the conversion of n-butane (nC4) to isobutane (iC4), for use as feedstock in the AlkyU. The initial feed consists of feedstock from the Merox Unit, and contains a mixture of field butane from storage and butane from the CDU. The secondary feedstock is a mixed butane stream from the Catalytic Reforming Unit. This feed is a mixture of C3, nC4, and C5 and is fed directly to the de-isobutaniser tower (DIB) which produces three outlet streams: overheads which consist of iC4 rich stream stored as an Alkylation feed, side draw off which passes through the Butamer reaction section, in which the butane is dried, reacted (mixed with hydrogen) and stabilised, and bottoms comprising nC4 and pentanes (C5), which are routed to storage and used as a gasoline blending stock.
Two waste streams are generated in this Unit, spent platinum based catalyst and molecular sieve driers (C4 and hydrogen driers). Some other waste streams can be generated as ceramic balls commonly used on the Refinery as catalyst support in fixed bed systems.
C&O Merox Units (Naphtha, Butane and Olefins)
See KMU. See KMU.
Fluid Catalytic Cracking Unit (FCCU)
Catalytic cracking converts heavy distillates (from CDU and VDU) to compounds with lower boiling points. This process is conducted in a fluidised bed reactor with a regenerator to continuously reactivate the catalyst. Zeolites (alumina silicates) are for the cracking catalyst. Due to the abrasive nature of the process, catalyst losses occur in the form of fines which are balanced by the addition of fresh catalyst. Since deactivation of the catalyst may also occur by different reasons the spent catalyst must be periodically withdrawn from the unit.
Waste streams of concern in this process are FCCU Activated Alumina Catalyst fines (annual production), coke and iron scale produced by removal of exchangers bundle, pyrophoric materials, fines and sediments from storage of catalytic cracking products and solids from the bottom fractions.
Sulphur Recovery Unit (SRU)
The unit is designed to receive acid gas (basically H2S) from the ARU to convert it into liquid sulphur and tail gas. The elemental sulphur produced is then shipped off-site to be used by third parties to produce sulphuric acid and as an additive for lubricants. The process consists of a thermal conversion and a catalytic conversion.
From the thermal conversion stage the principal waste stream produced is refractory possibly contaminated with sulphur. This material is generated during TAs. Spent activated alumina catalyst used to be a waste stream in the Unit before 2012. Currently it is expected that spent titanium-based alumina catalyst be generated in the Unit during TAs after 2012. Ceramic support balls are also generated as waste streams.
Ultra Low Sulphur Gasoline (ULSG) Unit
The function of the ULSG Unit is to reduce the sulphur content of the following naphtha streams produced in the FCCU while minimising the amount of olefin saturation: light catalytic naphtha (LCN), heavy catalytic naphtha (HCN), heavy/heavy catalytic naphtha (HHCN). European legislation is targeted to reduce the sulphur content of gasoline. The FCCU Naphtha’s LCN, HCN & HHCN have a major impact on the site gasoline sulphur, being approximately 50% of the gasoline pool. The sulphur content of these streams, which can be up to 2800 ppm, will be reduced to less than 50 ppm in the ULSG plant. The ULSG Unit consists of two units: CDHYDRO (selective hydrogenation of diolefins, hydroisomerisation of C5 olefin and thioetherification of diolefins) and CDHDS (Hydrodesulphurisation of olefins).
Paladium catalyst on alumina support (CDHydro Unit), nickel-based catalyst on alumina support from CDHydro Unit and cobalt molybdenum (CoMo) based catalyst on alumina support from the CDHDS reactor are the main waste streams in the ULSG Unit.
Appendix
257
Table B-4. Business units and waste streams in the General On-Site Facilities
Area Business unit / waste producer Purpose of the Unit Waste streams
Ge
nera
l O
n-S
ite
Fa
cil
itie
s
Asbestos Compound
Asbestos was extensively used at the Refinery during the time of construction. Although asbestos used for piping insulation and concrete support has been being replaced over the last 5 years, there is still some to be removed. The Asbestos Compound has been designated in the Refinery for temporary storage and is provided with enclosed skips for safety handling.
Insulation material containing asbestos.
Buildings (catalysts, adsorbents and bulk chemicals storage, control rooms, the canteen, the health centre, the admin building, workshops, warehouses, contractors work site, etc)
Various. Waste generated from these areas are mostly recyclates such as paper and cardboard, plastics, glass, wooden packaging and WEEE. Another common waste streams across the site is municipal general waste which is 75% recycled.
Bundle Cleaning Area It has been designated to decontaminate heat exchanger bundles. A jetting process is in place and detergents are used. As a result of the activities different waste streams are produced.
Sodium hypochlorite, citrus cleaner, sodium carbonate, oily rags & PPE, iron oxide scale & coke, sediment contaminated with oil and sludge are the waste streams most commonly produced in this area.
C&O Chemical Storage Area, Settling Basin and Mixing Ponds
Chemical Area to store HF and caustic solutions. Ponds designated to contain fluoridic caustic, sludge and acid soluble oil (ASO) generated at the Alkylation Unit. ASO is recycle in the Refinery through the slop system.
Acid alkyl sludges, Fluoridic caustic and sludge
Crushed Concrete Compound
This area stores crushed of common building waste material. Concrete refractory from high temperature process lines and vessels is also managed in this area. Some of these materials are re-used at the Refinery and some are sent to landfill or to the cement industry. The final use will depend on the contamination level of the material. Some structures may contain rebar metal wiring.
Refractory and building demolition waste.
Grit Blast Yard Grit blast results from the pressure jetting of vessels with compressed air and abrasive particles of sand. Cleaning of vessels and equipment is performed by using this technique to remove contaminants, paint and anti-fouling agents on surfaces. Tank servicing is one of the largest sources of waste blasting materials.
Waste blasting materials (commonly known at the Refinery as spent grit blast).
Laboratory
The day-to-day activities of the Laboratory typically include measuring, sampling, testing and analysing all raw materials, products and wastes handled and produced at the Refinery. Since a wide range of laboratory equipment and instruments are also being used it is expected that the Laboratory produces glass and WEEE waste.
Organic and inorganic waste, glass, contaminated packaging materials, WEEE and oily PPE.
Main Storage Area This area has been designated to handle and store all the materials required for the Refinery at the different business areas and buildings.
All kind of packaging materials (i.e. cardboard, glass, wood and plastics)
Recycling Facility
The Recycling Facility has been designated in the Refinery for temporary storage of waste from different sources. Solid, liquid and sludge wastes can be handle at the areas designated. The Recycling Facility has been provided with a drum handling bay, covered and bunded bay for oily sludge, recycling material shed and skip and bin storage zone.
Oily PPE, general waste and any spill occurring from storage of waste are the most common streams produced at the Recycling Facility.
Scrap Metal Compound The Scrap metal compound temporarily holds all decontaminated metals produced across the Refinery. Ferrous and non-ferrous scrap metal.
Catalyst, adsorbents and bulk chemicals storage area (SNAMS)
This area is designated to store materials in bulk as catalysts, adsorbents and chemicals. Any waste produced as a result of loss of containment of catalysts, adsorbents and chemicals.
Workshops These areas are designated to perform all the activities which support the business units. General maintenance and repairing of instruments, tools and equipment and also calibration are the principal activities performed in this area.
Oily wastes, contaminated PPE, grit blasting materials, waste paint sludge, aerosol cans, WEEE, scrap metal (e.g. bolts, nuts and fittings) are wastes commonly produced in these areas.
Appendix
258
Table B-5. Business units and waste streams in the Utility Systems61
Area Business unit / waste producer Purpose of the Unit Waste streams
Uti
lity
Syste
ms
Air Systems
Air has two uses on the refinery, is used either as instrument air or plant air. The original system used to be divided into two, but now a single header ring main supplies dry air with a dew point of -40 °C and a pressure of 7 bar to all the Refinery Areas. Instrument air is used to operate control valves, to transmit data such as flow, pressure or level indication in locally mounted instrument loops, to pressurise the air accumulators which provide emergency back-up to put certain valves to their ‘air fail safe’ position, to provide combustion air for the flame front generators used to ignite the flare stack pilot burners. It is also used for powering air motorised portable pumps, winches and hand tools and to clean equipment by air blowing (e.g. cleaning pump parts and filter elements before re-assembly). In total there are four air compressors on site.
Oily filters, scrap metals, charcoal and paper filters are the most common waste produced at the Air Systems.
Condensate Return Condensate formed in the circuit by the use of steam as a heating media is returned to the Raw Water Treatment Plant. Since condensate is a high quality source of water it can be used again as boiler feed water providing the Refinery with energy savings. Condensate is only to deaerated in the Raw Water Treatment Plant.
Only general waste streams such as scrap metals and grit blasting materials can be assigned to this particular utility system produced during maintenance activities. The oxygen scavenger waste that can be generated during deaeration of condensate is assigned to the Raw Water Treatment Plant.
Cooling Towers
There are two sets of cooling towers, which fall into the utilities remit: the Alkylation and General Cooling Towers. The separate cooling tower attached to the Alkylation Unit is to prevent contamination of the Refinery’s cooling water if there is a leaking exchanger on AlkyU. The General Cooling Tower provides cooling water to the other units. The cooling towers are of the induced draft type and comprise pump basins, cooling water pumps and water treating facilities. Each tower consists of three cells sharing basin, each cell has its own fan. The Cooling Towers are designed to provide intimate air/ water contact. Provide cooling by evaporation of the cooling water. There is some sensible heat loss (direct cooling of the water by the air), but this is only a minor portion of the heat rejection. The cooling towers in the Refinery are made of timber frames and corrugated metal outer shells.
Copper Chrome Arsenic (CCA) timber, cooling tower sludge and debris are the most common wastes produced.
Flare System The Gas Flare System in the Refinery is designed to collect and process the vent gases and entrained condensates from all over the plant during emergency situations or upsets on the process units. The system consists of three elevated stacks and knock out drums in different process areas with "blocking in" facilities to allow maintenance during TA events.
Particular waste streams can be found at the Flare System such as soil contaminated with oil in flare bunds as a result of spillage and contaminated water from tank washings.
Fuel Gas System
When crude oil is processed to produce refined oil products, a portion of the crude feed is converted into incondensable light gas such as hydrogen, methane and ethane. This gas is called off-gas and is combined and used as fuel gas in the fired heaters and boilers of the process units. The fuel gas system collects all the off-gas streams and distributes the gas to consumers across the refinery. The off gases from the units have different compositions and calorific values. For good combustion at the heater and boiler burners the off-gas needs to be processed and combined. The processing occurs in the LPGRU and the mixing occurs in the static mixer.
No particular waste stream is produced at this Unit other than common waste streams such as scrap metals, oily PPE, insulation and grit blasting materials.
Fuel Oil System Fuel oil is burnt in the boilers and the CDU and VDU heaters to make a balance between the demand for steam and available fuel gas. When fuel gas is in short supply, which may be a consequence of problems on one of the process units, the boilers and heaters can be fired on oil. Fuel oil is also used as seal oil for pumps in the Black Oils area.
No particular waste stream is produced at this Unit other than common waste streams such as scrap metals, oily PPE, insulation and grit blasting materials.
Nitrogen Plant
The inert properties of nitrogen mean the gas is widely used in the Refinery for inerting, blanketing, and purging pipe lines and vessels to suppress flammability by reducing oxygen levels to a point below which combustion is possible. The Nitrogen Plant in the Refinery consists of a generator and a number of vaporisers. The plant generator is capable of producing a 1000m3/h of N2. If the demand exceeds this quantity the header pressure will fall and the vaporisers will allow vaporisation from the storage tanks.
Perlite for insulation purposes is considered a waste stream from this unit.
Raw Water Treatment Plant
The required degree of water purity depends on its particular use. The Raw Water Treatment Plant at the Refinery provides water that meets specifications for its use as process water, boiler feed water, cooling water, potable water, fire water and utility water. In this Unit raw water treatment is performed in three stages. Filtering is the first stage and aims to reduce turbidity. At the Refinery the water is filtered in five pressure sand parallel filters. The second stage is softening which reduces hardness (scale-forming impurities) considered to be the primary source of scale formation in heat exchangers and pipelines. The third stage is deaeration. Dissolved gases present in water cause corrosion problems so the deaerator removes particularly oxygen and carbon dioxide with the aid of a chemical oxygen scavenger.
Spent sand and gravel filter materials, spent sodium zeolite softener (a.k.a. amberlite) and sodium bisulphite (oxygen scavenger) are wastes generated at this Unit. Since the raw water treatment creates non-oily sludge, these streams can also be considered as wastes.
The Steam Generation System Once de-aeration of raw water has been achieved, the treated water is fed to the boiler system where steam is generated. The high demand of steam across the Refinery requires very effective insulation of equipment and pipes for efficient use of energy.
Soot (flue ash) from boiler firebox and superheater ducting, grit and mud contaminated with oil from site drains and such as scrap metals, oily PPE, insulation and grit blasting materials.
61
Continued on next page
Appendix
259
Table B-5. Continued (1). Business units and waste streams in the Utility Systems
Area Business Unit / waste producer Purpose of the Unit Waste streams
Uti
lity
Syste
ms
Waste Water Treatment Plant (WWTP)
The Waste Water Treatment Plant (WWTP) treats the following streams: ballast water (discharged from trading tankers at the Jetty); process water (used by the operating units that may become heavily contaminated with oils, phenols, ammonia and sulphides); surface water (mostly rainwater that has been collected in storm drains along with water pumped from the West Reservoir); product tankage (any water accumulation drawn off from product tanks located in the Tank Farm) and sanitary system effluent (waste water from the toilet facilities). The WWTP consists of the following stages:1) Preliminary or pre-treatment screening and grit removal in order to eliminate roots, bags, cans, large debris, sand and gravel consisting of the Primary Diversion Box (PDB) and the Surge Pond. The PDB mixes the streams from different sources and the Surge Pond comprises the rope mops to remove any free oil. 2) Primary treatment consists of a gravity separator (API Separator) and two dissolved air flotation units (DAFs). In the API separator heavier materials settle below lighter liquids. Hydrocarbons that float on the surface are skimmed off, while the sludge that settles to the bottom is removed periodically. The material from the sludge sump of the API separator occasionally is sent to a centrifugation unit to extract the oil and form a cake. The oil recovered is sent back to the API separator and the cake is sent to incineration. The DAF units further reduce the oil and solids content of the water from the API separators. A flocculant is added to allow agglomeration of the oil and solids, part of the effluent is recycled and saturated with air and mixed with the feed and subsequently released into the flotation tank. The rising gas bubbles attach themselves to oil droplets and solid particles forming a sludge blanket which floats to the surface is skimmed off and pumped to a centrifugation unit. 3) Secondary treatment involves biological oxidation of organic matter. It starts at the neutralisation lanes and ends at clarifiers. Microorganisms (the bugs) use the colloidal and dissolved organics in the effluent wastewater as a "food" supply. They digest the waste material and the biological matter is subsequently separated from the wastewater in the clarifiers. To promote biological activity, both chemical and mechanical means are used and tightly controlled to ensure the process function properly. The process parameters to control at this stage are pH, alkalinity, temperature and the flow of oxygen, nitrogen and phosphorus. The oxidized biomass is then separated from the water in two clarifiers, transferred to the sludge sumps and pumped back to the beginning of the aeration lanes. However, if the Mixed Liquor Suspended Solids (MLSS) are greater than 5000 ppm then the oxidized biomass is stored in a holding tank where it will be also centrifuged. The effluent from the aeration basin outlet channels flows in to the two clarifiers. 4) Clarification involving clarifiers which are circular flat-bottomed concrete structure having a centre section, which incorporates the waste water inlet, sludge outlet and support for the rotating half bridge scraper. The half bridge scraper is used for the removal of the sludge accumulation at the clarifier floor. The rotating half bridge also contains a skimmer blade located at the water surface. This blade is used to direct any floating scum to the outer edge and into a small scum collection box. The water then flows over a weir and into the Clarified Water Sump (CWS). The weir has dragon’s teeth which catch any solids. 5) Collection of treated water at the CWS: from the CWS, the treated water flows over a weird into the Off Test Pond which is used to allow any solids that remain in the water to settle out before flowing into the Storm Pond. 6) Discharge of treated water into the Milford Estuary. After pumping for a period of one hour the water must be tested to ensure it falls within the specification set by the Environment Agency.
API separator sludge, primary and secondary sludge generated when solids from various process equipment such as tanks and process units, enter the process wastewater system and are removed prior to entering the API separators. Secondary sludge is generated after flocculants are added to an oil/water emulsion following primary treatment to aid in the further separation of oil, water, and solids from the waste stream.
Appendix
260
Table B-6. Business units and waste streams in the WOs area
Area Business unit / waste producer Purpose of the Unit Waste streams
Wh
ite O
ils (
WO
s)
Catalytic Reforming Unit (CCR/CRU) (a.k.a. Platformer)
Catalytic reforming upgrades naphtha from the hydrotreating units for use as a gasoline blendstock. The principal products of this unit are “reformate”, which has increased octane number and hydrogen, which is used for desulphuration of products. The catalyst used contains platinum, which is very expensive. Spent catalyst is listed as the main waste stream generated which is normally changed every ten years. Spent promoted alumina adsorbents used as chloride guards and spent molecular sieve dryer adsorbents are common solid wastes generated by this Unit on a more regular basis.
CCR/CRU spent catalysts and spent alumina and molecular sieve materials from the HCL adsobers and driers
Diesel Hydrotreater One (HTU-1)
HTU1 can run in one of two modes, diesel or gasoil. In diesel mode, HTU1 produces ultra-low sulphur diesel (ULSD), which has very low sulphur content and low density. In gasoil mode, the product is allowed to have higher sulphur levels and a higher density. The feed to HTU1 comes primarily from the CDU, but cracked stocks (from the FCCU) are also mixed to lower the density of the product. Similarly to the Unifiner, the feed to HTU1 is injected with hydrogen and passed over a catalyst (in this case cobalt-molybdenum) to convert sulphur compounds to H2S. The resulting product is cooled and goes to storage. Cobalt-molybdenum catalyst on alumina support contaminated with coke, sulphur, metal oxides and light
hydrocarbons is the main waste stream produced in this Unit during TAs. Normally catalyst life is from two to three years and the inventory is around 210 m3.
HTU-1 is designed to remove impurities from kerosene, diesel, light cycle gas oil (LCGO), heavy heavy cracked naphtha (H.H.C.N.), hot well slop oil and visbreaker gas oil. Hydrotreating removes sulphur, nitrogen, oxygen and metals and partially saturates aromatics and olefins (hydrogenation). The catalyst typically is based on a combination of nickel, molybdenum and cobalt. Spent catalyst replaced during a turnaround is listed as the major waste stream of this unit.
Diesel Hydrotreater Two (HTU-2)
HTU-2 is designed to remove impurities such as sulphur, nitrogen, chlorine, oxygen and trace metals from kerosene, diesel and light gas oil because they have an adverse effect on engines and heaters. The feed is heated and mixed with hot hydrogen rich gas before it passes through the first, second and third catalyst beds in the reactor.
Nickel-molybdenum on alumina support is the main waste stream.
Hydrogen Recovery Unit (HRU)
This is a relatively new unit. Its purpose is to recover hydrogen from the CCR/CRU LPG offgas and LPGRU tail gas, which contain 70-80 mol% hydrogen. 99 % pure hydrogen is recovered using a pressure swing adsorption system (PSA). LP gas is compressed and passed through the PSA section of the HRU. The adsorbent traps the carbon containing components of the gas stream leaving a very pure hydrogen product which supplements the sites hydrogen header.
Activated carbon from the absorbers is the main waste stream.
Isomerisation Unit (light naphtha isomerisation) (Isom)
The objective of the Isomerisation Unit is to process light naphtha and light reformate to convert C5 and C6 straight fractions into their respective isomers. This unit provides an improved feedstock for gasoline blending. The process consists of sulphur removal, make-up gas and naphtha feed drying, reaction, distillation and gas scrubbing. The reactions occur in the presence of hydrogen and catalyst. Hydrogen is mainly used to reduce carbon deposition on the catalyst. Hence the hydrogen consumption is very low. The catalyst is a chlorinated alumina containing platinum which requires the addition of very small amounts of organic chlorides (perchloroethylene) to avoid catalyst deactivation.
The waste streams generated in this unit are molecular sieve from the make-up gas driers, the light naphtha feed driers and the sulphur guard bed. The chloride promoted alumina catalyst containing platinum and can be considered as another waste stream from this unit.
Liquid Petroleum Gas Recovery Unit (LPGRU)
The LPGRU takes gaseous light hydrocarbons streams from several process units, and separates out any propane and butane by cooling and compression. Lighter components are burnt as fuel gas, whilst propane and butane are sold as valuable products. The system is designed to accept feed from up to thirteen feed gas streams from various areas of the Refinery. The LPG recovery plant can be divided into four sections: Pre-treatment (provides knockout facilities for liquid carryover, sweetening of sour gas and some cooling), Low Temperature LPG Recovery (provides gas drying facilities, heat exchange equipment and LPG recovery), LPG Fractionation (consists of LPG distillation, deethanising and depropanising) and Refrigeration/Utilities (consists of utilities and the refrigeration package).
Activated alumina from the HCl removal vessel and molecular sieve from the gas driers and propane treaters are the waste streams assigned to the process. As a refrigeration process takes place in this unit, another waste expected is perlite, an insulation material from the cold boxes.
The Naphtha Hydrotreater (Unifiner)
The Unifiner is designed to treat sour full range naphtha from the CDU. The purpose of this unit is to provide sweet, dry heavy naphtha feed to the CCR/CRU and light sweet naphtha to the Isomerisation Unit. During normal operations the catalyst coke deposition increases and in consequence the activity decreases. When the catalyst activity decreases, the reactor inlet temperature has to be increased in order to keep the same conversion rate. Unfortunately, there is also an increase in coke lay down on the catalyst and increased pressure drop. When the temperature in the reactor and the differential pressure reach a limit the reactor has to be shut down and the catalyst regenerated or replaced. Nowadays it is more economic, convenient and efficient to replace the catalyst rather than to regenerate it in-situ. Since the catalyst is relatively unaffected by most components in the charge stock which are known poisons in other catalytic refining process, this Unit also removes contaminants such as arsenic, lead and metallo-organic compounds. There are two absorption towers which remove H2S and water from CDU propane. The propane is sent to storage.
The main waste streams from this Unit are the spent nickel-molybdenum bimetallic catalyst on alumina support and contaminated ceramic balls used as catalyst support. Molecular sieve from the absorption towers it is also generated as a waste stream.
Appendix
261
In addition to the business area and units classification the Refinery coded the latest with
numbers. This coding system is available at the Refinery Intranet Home Site and it is
described as “Plant Numbers”. Table B-7 summarises the Refinery business areas, units
and numbers as described at this site. As the description of business units on this site
slightly differ from the reported on Tables B-1 to B-6 both are presented on Table B-7.
Table B-7. Refinery business areas, plants and numbers
Business
area Business units as described in Tables B-1 to B-6
Business units as
described in the
Refinery Intranet
Home Site
Plant
number
(No.)
B&S
Off-site piping (not explained in Table B-2) Off-site piping 21
In-Shore Tank Farm Tankage 20
The Jetty The Jetty 22
BOs
CDU CDU 1
Chemical Handling (not explained in Table B-1) Chemical Handling 25
KMU KMU 5
VBU VBU 6
VDU VDU 01
C&O
ARU ARU 17
SRU SRU 16
ULSG ULSG 05
Butamer (C4 isomerisation) Butamer 06
AlkyU Alky 04
C&O Chemical Storage Area, Settling Basin and Mixing Ponds (reported as General On-Site Facility)
Chemical tankage 47
FCCU FCCU 02
C&O Merox Units (Naphtha, Butane and Olefins) Light & heavy cat
naphtha Merox 08
Gral
Asbestos Compound, Buildings (catalysts, adsorbents and bulk chemicals storage, control rooms, the canteen, the health centre, the admin building, workshops,
warehouses, contractors work site, etc), Bundle Cleaning Area, Crushed Concrete
Compound, Grit Blast Yard, Laboratory, Main Storage Area, Recycling Facility, Scrap Metal Compound, Catalyst, adsorbents and bulk chemicals storage area
(SNAMS), Workshops
Buildings 41
Off-site 81
Site 00
Flare System (reported as utility system) Flares 19
Stacks (not explained in Table B-4) Stacks 26
Utls
Nitrogen Plant Nitrogen facility 38
Raw Water Treatment Plant Boiler feed water 36
Air Systems, Fuel Gas System and Fuel Oil System Air, Gas and Fuel Oil
Facilities 35
The Steam Generation System Steam Plant 31
WWTP WWTP 37
Utility water (not explained in Table B-5) Utility water 32
WOs
CCR/CRU CCR/CRU 7
HTU-1 HTU-1 3
Isom Isom 14
Unifiner Unifiner 4
HTU-2 HTU-2 12
HRU HRU 11
LPGRU LPGRU 10
Appendix
262
Appendix C. List of Waste (LoW)
In the EU and the UK wastes are classified and described according to the European
List of Waste (LoW) (Commission Decision 2000/532/EC). As this list derives from the
European Waste Catalogue (EWC), in the context of the present thesis codes to classify
individual waste are named “EWC codes”.
According to this decision individual waste is given a six-digit code (XX.YY.ZZ) and a
waste description. The first two digits of the code (XX) correspond to one of the twenty
chapters that refer to the process that has produced the waste. Description of some of
these chapters is shown in Table C-1.
Table C-1. Examples of the first two digits of EWC codes.
XX Description
05. Wastes from petroleum refining, natural gas purification and pyrolytic
treatment of coal.
15. Waste packaging; absorbents, wiping cloths, filter materials and protective
clothing not otherwise specified.
20. Municipal wastes and similar commercial, industrial and institutional wastes
including separately collected fractions
The second two digits (YY) refer to the more specific generation and nature of the
waste as shown in Table C-2.
Table C-2. Examples of the second two digits of EWC codes.
XX YY Description
05. 01. Wastes from petroleum refining
15. 01. Packaging
20. 01. Separately collected fractions
The last two digits (ZZ) give information about the main component of the waste as
shown in Table C-3.
Appendix
263
Table C-3. Examples of the last two digits of EWC codes.
XX YY ZZ Description
05. 01. 02. Desalter sludge
15. 01. 10. Packaging containing residues of or contaminated by dangerous
substances
20. 01. 02. Glass
Some of the six-digit codes in the EWC have an asterisk next to them indicating that the
wastes are hazardous; wastes without an asterisk are non-hazardous (Table C-4).
Table C-4. Examples of some EWC codes of HW and NHW.
XX YY ZZ HW NHW Description
05. 01. 02. * √ Desalter sludge
15. 01. 10. * √ Packaging containing residues of or contaminated by
dangerous substances
20. 01. 02. √ Glass
Table C-5 presents the EWC codes most commonly used at the Refinery over 2007-2011
and their description.
Appendix
264
Table C-5. Selected EWC codes for waste most commonly produced at the Refinery (Source:
EA, 2013c)62
.
EWC Description
05. WASTES FROM PETROLEUM REFINING, NATURAL GAS PURIFICATION AND PYROLYTIC TREATMENT OF COAL
05.01. Wastes from petroleum refining
05.01.02* Desalter sludges
05.01.03* Tank bottom sludges
05.01.04* Acid alkyl sludges
05.01.05* Oil spills
05.01.06* Oily sludges from maintenance operations of the plant or equipment
05.01.08* Other tars
05.01.09* Sludges from on-site effluent treatment containing dangerous substances
05.01.10 Sludges from on-site effluent treatment other than those mentioned in 05.01.09
05.01.11* Wastes from cleaning of fuels with bases. Alkylation settling pond sludge cake
05.01.11* Wastes from cleaning of fuels with bases. Fluoridic caustic
05.01.11* Wastes from cleaning of fuels with bases. Fluoridic caustic sludge
05.01.11* Wastes from cleaning of fuels with bases. Fluoridic caustic non-conformed loads
05.01.11* Wastes from cleaning of fuels with bases. Phenolic caustic
05.01.15* Spent filter clays
05.01.16 Sulphur-containing wastes from petroleum desulphurisation
06. WASTES FROM INORGANIC CHEMICAL PROCESSES
06.13. Wastes from other inorganic chemical processes not otherwise specified
06.13.02* Spent activated carbon (except 06.07.02*: activated carbon from chlorine production)
08. WASTES FROM THE MANUFACTURE, FORMULATION, SUPPLY AND USE (MFSU) OF COATINGS (PAINTS, VARNISHES AND VITREOUS ENAMELS), ADHESIVES, SEALANTS AND PRINTING INKS
08.01. Wastes from MFSU and removal of paint and varnish
08.01.11* Waste paint and varnish containing organic solvents or other dangerous substances
08.01.13* Sludges from paint or varnish containing organic solvents or other dangerous substances
08.03. Wastes from MFSU of printing inks
08.03.17* Wastes from paint or varnish removal containing organic solvents or other dangerous substances
08.03.18 Waste printing toner other than those mentioned in 08.03.17*
10. WASTES FROM THERMAL PROCESSES
10.01. Wastes from power stations and other combustions plants (except 19.)
10.01.01 Bottom ash, slag and boiler dust (excluding boiler dust mentioned in 10.01.04*)
10.01.04* Oil fly ash and boiler dust
10.03. Wastes from aluminium thermal metallurgy
10.03.05 Waste alumina
* Indicates a hazardous waste
62
Continued on next page.
Appendix
265
Table C-5. Continued (1). Selected EWC codes for waste most commonly produced at the
Refinery (Source: EA, 2013c)63
.
EWC Description
11. WASTES FROM CHEMICAL SURFACE TREATMENT AND COATING OF METALS AND OTHER MATERIALS; NON-FERROUS HYDROMETALLURGY
11.01. Wastes from chemical surface treatment and coating of metals and other materials (e.g. galvanic processes, zinc coating processes, pickling processes, etching, phosphating, alkaline degreasing, anodising)
11.01.98* Other wastes containing dangerous substances
12. WASTES FROM SHAPING AND PHYSICAL AND MECHANICAL SURFACE TREATMENT OF METALS AND PLASTICS
12.01. Wastes from shaping and physical and mechanical surface treatment of metals and plastics
12.01.16* Waste blasting material containing dangerous substances
12.01.17 Waste blasting material other than those mentioned in 12.01.16*
13. OIL WASTES AND WASTES OF LIQUID FUELS (EXCEPT EDIBLE OILS AND THOSE IN CHAPTERS 05., 12. AND 19.)
13.07. Wastes of liquids fuels
13.07.03* Other fuels (including mixtures)
14. WASTE ORGANIC SOLVENTS, REFRIGERANTS AND PROPELLANTS (except 07. and 08.)
14.06. Waste organic solvents, refrigerants and foam/aerosol propellants
14.06.02* Other halogenated solvents and solvent mixtures
14.06.03* Other solvents and solvent mixtures
15. WASTE PACKAGING; ABSORBENTS, WIPING CLOTHS, FILTER MATERIALS AND PROTECTIVE CLOTHING NOT OTHERWISE SPECIFIED
15.01. Packaging (including separately collected municipal packaging waste)
15.01.01 Paper and cardboard packaging
15.01.02 Plastic packaging
15.01.03 Wooden packaging
15.01.05 Composite packaging
15.01.10* Packaging containing residues of or contaminated by dangerous substances
15.02. Absorbents, filter materials, wiping cloths and protective clothing
15.02.02* Absorbents, filter materials (including oil filters not otherwise specified), wiping cloths, protective clothing contaminated by dangerous substances
15.02.03 Absorbents, filter materials, wiping cloths and protective clothing other than those mentioned in 15.02.02*
63
Continued on next page.
Appendix
266
Table C-5. Continued (2). Selected EWC codes for waste most commonly produced at the
Refinery (Source: EA, 2013c)64
.
EWC Description
16. WASTES NOT OTHERWISE SPECIFIED IN THE LIST
16.01. End-of-life vehicles from different means of transport (including off-road machinery) and waste from dismantling of end-of-life vehicles and vehicle maintenance (except 13., 14., 16.06., and 16.08.)
16.01.03 End-of-life tyres
16.01.07* Oil filters
16.02. Wastes from electrical and electronic equipment
16.02.11* Discarded equipment containing chlorofluorocarbons, HCFC, HFC
16.03. Off-specification batches and unused products
16.03.03* Inorganic wastes containing dangerous substances
16.03.04 Inorganic wastes other than those mentioned in 16.03.03*
16.03.05* Organic wastes containing dangerous substances
16.03.06 Organic wastes other than those mentioned in 16.03.05*
16.05. Gases in pressure containers and discarded chemicals
16.05.04* Gases in pressure containers (including halons) containing dangerous substances
16.05.06* Laboratory chemicals, consisting of or containing dangerous substances, including mixtures of laboratory chemicals
16.05.08* Discarded organic chemicals consisting of or containing dangerous substances
16.06. Batteries and accumulators
16.06.04 Alkaline batteries (except 16.06.03*: Mercury-containing batteries)
16.07. Wastes from transport and storage tank and barrel cleaning (except 05. and 13.)
16.07.09* Wastes containing other dangerous substances
16.08. Spent catalysts
16.08.02* Spent catalysts containing dangerous transition metals (1) or dangerous transition metal compounds. HDS catalyst
16.08.03 Spent catalysts containing transition metals or transition metal compounds not otherwise specified
16.08.04 Spent fluid catalytic cracking catalysts (except 16.08.07*) from site (alumina and/or molecular sieve)
16.08.04 Spent fluid catalytic cracking catalysts (except 16.08.07*) from FCCU
16.08.07* Spent catalysts contaminated with dangerous substances
16.10. Aqueous liquid wastes destined for off-site treatment
16.10.01* Aqueous liquid wastes containing dangerous substances
16.11. Waste linings and refractories
16.11.05* Linings and refractories from non-metallurgical processes containing dangerous substances
(1) For the purpose of this entry, transition metals are: scandium, vanadium, manganese, cobalt, copper, yttrium, niobium, hafnium,
tungsten, titanium, chromium, iron, nickel, zinc, zirconium, molybdenum and tantalum. These metals or their compounds are
dangerous if they are classified as dangerous substances. The classification of dangerous substances shall determine which among
those transition metals and which transition metal compounds are hazardous.
64
Continued on next page.
Appendix
267
Table C-5. Continued (3). Selected EWC codes for waste most commonly produced at the
Refinery (Source: EA, 2013c).
EWC Description
17. CONSTRUCTION AND DEMOLITION WASTES (INCLUDING EXCAVATED SOIL FROM CONTAMINATED SITES)
17.05. Soil (including excavated soil from contaminated sites), stones and dredging spoil
17.05.03* Soil and stones containing dangerous substances
17.06. Insulation materials and asbestos-containing construction materials
17.06.01* Insulation materials containing asbestos
17.06.04 Insulation materials (other than those mentioned in 17.06.01* and 17.06.03*:other insulation materials consisting of or containing dangerous substances)
17.06.05* Construction materials containing asbestos (2)
17.08. Gypsum-based construction material
17.08.02 Gypsum-based construction materials (other than those mentioned in 17.08.01*: Gypsum-based construction materials contaminated with dangerous substances)
19. WASTES FROM WASTE MANAGEMENT FACILITIES, OFF-SITE WASTE WATER TREATMENT PLANTS AND THE PREPARATION OF WATER INTENDED FOR HUMAN CONSUMPTION AND WATER FOR INDUSTRIAL USE
19.01. Wastes from incineration or pyrolysis of waste
19.01.10* Spent activated carbon from flue-gas treatment
19.02. Wastes from specific physico/chemical treatments of industrial waste (e.g. Dechromatation, decyanidation, neutralisation)
19.02.05* Sludges from physico/chemical treatment containing dangerous substances
20. MUNICIPAL WASTES (HOUSEHOLD WASTE AND SIMILAR COMMERCIAL, INDUSTRIAL AND INSTITUTIONAL WASTES) INCLUDING SEPARATELY COLLECTED FRACTIONS
20.01. Separately collected fractions (except 15.01.)
20.01.01 Paper and cardboard
20.01.02 Glass
20.01.08 Biodegradable kitchen and canteen waste
20.01.21* Fluorescent tubes and other mercury-containing waste
20.01.23* Discarded equipment containing chlorofluorocarbons
20.01.25 Edible oil and fat
20.01.35* Discarded electrical and electronic equipment other than those mentioned in 20.01.21* and 20.01.23* containing hazardous components (3)
20.01.38 Wood (other than those mentioned in 20.01.37*: Wood containing dangerous substances)
20.01.39 Plastics
20.01.40 Metals
20.03. Other municipal wastes
20.03.01 Mixed municipal waste
(2) As far as the landfilling of waste is concerned, Member States may decide to postpone the entry into force of this entry until the
establishment of appropriate measures for the treatment and disposal of waste from construction material containing asbestos. These
measures are to be established according to the procedure referred to in Article 17 of Council Directive 1999/31/EC on the landfill
of waste (OJ L 182, 16.7.1999, p. 1) and shall be adopted by 16 July 2002 at the latest.
(3) Hazardous components from electrical and electronic equipment may include accumulators and batteries mentioned in 16 06
(batteries and accumulators) and marked as hazardous; mercury switches, glass from cathode ray tubes and other activated glass etc.
Appendix
268
Appendix D. Waste Framework Directive: disposal and recovery (recycling)
codes
Disposal and recovery (recycling) operation codes are defined in Annexes I and II of
Directive 2008/1/EC (EC, 2008c). The EA (2011) also provides these lists extracted
from this Directive and published in the EA Hazardous Waste Regulations 05 (HWR05)
guidelines for record keeping. Tables D-1 and D-2 present disposal and recovery
(recycling) codes as they appear in Directive 2008/1/EC.
Table D-1. Waste disposal codes as defined by the EA (2011, p 10).
Code Description
D1 Deposit into or onto land (e.g. landfill, etc.)
D2 Land treatment (e.g. biodegradation of liquid or sludgy discards in soils, etc.)
D3 Deep injection (e.g. injection of pumpable discards into wells, salt domes or naturally
occurring repositories, etc.)
D4 Surface impoundment (e.g. placement of liquid or sludgy discards into pits, ponds or lagoons, etc.)
D5 Specially engineered landfill (e.g. placement into lined discrete cells which are capped and isolated from one another and the environment, etc)
D6 Release into a water body except seas/oceans
D7 Release into seas/oceans including seabed insertion
D8
Biological treatment not specified elsewhere which results in final compounds or mixtures
which are discarded by means of any of the operations numbered D1 to D12 (e.g. evaporation, drying, calcination, etc.)
D9 Physico-chemical treatment not specified elsewhere which results in final compounds or
mixtures which are disposed of by any of the operations numbered D1 to D12
D10 Incineration on land
D11 Incineration at sea*
D12 Permanent storage (e.g. emplacement of containers in a mine, etc)
D13 Blending or mixing prior to submission to any of the operations numbered D1 to D12**
D14 Repackaging prior to submission to any of the operations numbered D1 to D13
D15 Storage pending any of the operations numbered D1 to D14 (excluding temporary storage,
pending collection on the site where it is produced)***
(*) This operation is prohibited by EU legislation and international conventions.
(**) If there is no other D code appropriate, this can include preliminary operations prior to disposal
including pre-processing such as, inter alia, sorting, crushing, compacting, pelletizing, drying, shredding,
conditioning or separating prior to submission to any of the operations numbered D1 to D12.
(***)Temporary storage means preliminary storage according to point (10) of Article 3 of Directive
2008/1/EC.
Appendix
269
Table D-2. Waste recovery (recycling) codes as defined by the EA (2011, p 10).
Code Description
R1 Use principally as a fuel or other means to generate energy*
R2 Solvent reclamation/regeneration
R3
Recycling/reclamation of organic substances which are not used as
solvents (including composting and other biological transformation processes)**
R4 Recycling/reclamation of metals and metal compounds
R5 Recycling/reclamation of other inorganic materials***
R6 Regeneration of acids or bases
R7 Recovery of components used for pollution abatement
R8 Recovery of components from catalysts
R9 Oil refining or other re-uses of oil
R10 Land treatment resulting in benefit to agriculture or ecological
improvement
R11 Use of wastes obtained from any of the operations numbered R1 to R10
R12 Exchange of wastes for submission to any of the operations numbered R1 to R11****
R13
Storage of wastes pending any of the operations numbered R1 to R12
(excluding temporary storage, pending collection on the site where it is
produced)*****
(*)This includes incineration facilities dedicated to the processing of municipal solid waste only where
their energy efficiency is equal to or above:
— 0.60 for installations in operation and permitted in accordance with applicable Community legislation
before 1 January 2009,
— 0.65 for installations permitted after 31 December 2008,
using the following formula:
Energy efficiency = (Ep - (Ef + Ei))/(0,97 × (Ew + Ef))
In which:
-Ep means annual energy produced as heat or electricity. It is calculated with energy in the form of
electricity being multiplied by 26 and heat produced for commercial use multiplied by 1.1 (GJ/year);
-Ef means annual energy input to the system from fuels contributing to the production of steam (GJ/y);
-Ew means annual energy contained in the treated waste calculated using the net calorific value of the
waste (GJ/y);
-Ei means annual energy imported excluding Ew and Ef (GJ/y);
-0.97 is a factor accounting for energy losses due to bottom ash and radiation.
This formula shall be applied in accordance with the reference document on Best Available Techniques
for waste incineration.
(**) This includes gasification and pyrolysis using the components as chemicals.
(***)This includes soil cleaning resulting in recovery of the soil and recycling of inorganic construction
materials.
(****) If there is no other R code appropriate, this can include preliminary operations prior to recovery
including pre-processing such as, inter alia, dismantling, sorting, crushing, compacting, pelletizing,
drying, shredding, conditioning, repackaging, separating, blending or mixing prior to submission to any
of the operations numbered R1 to R11.
(*****) Temporary storage means preliminary storage according to point (10) of Article 3.
Appendix
270
Appendix E. Waste collection, vehicles and containers most used in Valero
Refinery, Pembroke
Table E- 1 shows the waste collection vehicles, containers and their capacities most used
in Pembroke Refinery.
Table E- 1. Waste collection vehicles and containers most used in Pembroke Refinery.
Transport Name Container Name Capacity Unit of measure
Rear End Loader
(REL)REL skip 10 (7.6) / 14 (10.7) yard3 (m3)
Ro-Ro skip open top 20 (15.3) / 35 (26.8) yard3 (m3)
Ro-Ro skip close top 20 (15.3) / 35 (26.8) yard3 (m3)
Rear End Loader
(REL)Wheelie bin 1100 L
Rear End Loader
(REL)Wheelie bin 360 L
Articulated Lorry
(Artic)Euro bag 1000 kg
Articulated Lorry
(Artic)Drum 205 (45) L (gal)
Articulated Lorry
(Artic)
Intermediate bulk
container (IBC)1000 L
Tanker - - 29000-35000 L
Builder skip 6 (4.6) / 8 () / 12 (9.2) yard3 (m3)
RoRo skip wagon
Skip lorry
Type of material
General waste, scrap metals, refractory materials, bagged lagging, WEEE, etc.
General waste, scrap metals, oily PPE, WEEE, etc.
Tyres (RoRo skip open top) and asbestos (RoRo skip close top)
General waste, cardboard, plastic packaging, oily PPE, etc.
General waste, plastic cups and paper, NiCdbatteries, etc.
Spent catalysts and adsorbents, contaminated earth, refractory materials, spent grit blast, etc.
Oily PPE, spent catalysts and adsorbents, oily and bio s ludge, etc.
Caustics, spent cleaning agents, amine water, etc.
Fluoridic caustic
Appendix
271
Appendix F. Main waste streams, handling and storage areas in Valero Refinery, Pembroke, and Off-Site Treatment Facilities
General waste
Paper, plastic cups and cardboard
Grit blast
Aerosol cans, merox salt/charcoal, oily PPE, glass, oily/bio
sludge
Wood (packaging)
Spent alumina/molecular sieve, FCCU
catalyst fines
Plasteboard
Ferrous and non-ferrous scrap metals
TBS Waste Transfer StationPembrokeshire, Wales
CWM Environmental Ltd. RecyclingCamarthenshire, Wales
Terramundo (Augean) Soil Washing and Landfill Facility
Middlesborough, England
Recycling Facility(temporary storage/
secondary segregation)
Insulation materialscontaining asbestos
and /or ceramic fibers
Ellesmere Port Incineration FacilityCheshire, England
Griffiths Pallets Wood RecyclingSwansea, Wales
JBM (Plasmet) High Alumina Recycling Centre for the Cement Trade
Staffordshire, England
Atlantic RecyclingCardiff, Wales
Bundle Cleaning AreaContaminated?
Scrap Metal Compound(Scrap Yard)
SIMS Scrap Metal Recycling CentreCamarthenshire, Wales
yes
no
Asbestos CompoundCandles Hazardous Landfill
Shropshire, England
Refractory andbuilding demolition
waste
Crushed Concrete Compound
Contaminated?Ellesmere Port Incineration Facility
Cheshire, England
yes
no
Grit blastGrit Blast Area
(Grit Blast Yard)
Terramundo (Augean) Soil Washing and Landfill Facility
Middlesborough, England
Spent Hydrotreating, Reforming and Isomerisation
Catalysts
SNAMS or Other Refinery Areas
Precious Metal Reclamation and Catalyst Recycling Transfrontier Facilities
Lagging Contaminated?Ellesmere Port Incineration Facility
Cheshire, England
TBS Waste Transfer StationPembrokeshire, Wales
yes
no
C&O Settling Basin and Mixing Ponds
Lower Bank View Waste Treatment FacilityLiverpool, England
Fluoridic caustic and sludge
Phenolic caustic (if not treated at the
WWTP)
Lower Bank View Waste Treatment FacilityLiverpool, England
Merox Units
Refinery Off-site Treatment Facilities
Appendix
272
Appendix G. Work process PKB-0021-Coordinate and Manage Waste of
Valero Refinery, Pembroke
Figure G-1 shows the Refinery work process PKB-0021-Coordinate and Manage Waste
as it was on 27th
November 2013.
Figure G-1. Valero Energy Ltd. Pembroke Refinery work process PKB-0021-Coordinate and
Manage Waste as it was on 27th November 2013 (Source: Valero Energy Ltd., 2013c)
Appendix
273
Figure G-1. Continued (1). Valero Energy Ltd. Pembroke Refinery work process PKB-0021-
Coordinate and Manage Waste as it was on 27th November 2013 (Source: Valero Energy Ltd.,
2013c)
Appendix
274
Figure G-1. Continued (2). Valero Energy Ltd. Pembroke Refinery work process PKB-0021-
Coordinate and Manage Waste as it was on 27th November 2013 (Source: Valero Energy Ltd.,
2013c)
Appendix
275
Figure G-1. Continued (3). Valero Energy Ltd. Pembroke Refinery work process PKB-0021-
Coordinate and Manage Waste as it was on 27th November 2013 (Source: Valero Energy Ltd.,
2013c)
Appendix
276
Figure G-1. Continued (4). Valero Energy Ltd. Pembroke Refinery work process PKB-0021-
Coordinate and Manage Waste as it was on 27th November 2013 (Source: Valero Energy Ltd.,
2013c)
Appendix
277
Figure G-1. Continued (5). Valero Energy Ltd. Pembroke Refinery work process PKB-0021-
Coordinate and Manage Waste as it was on 27th November 2013 (Source: Valero Energy Ltd.,
2013c)
Appendix
278
Appendix H. Criteria for determining best available techniques.
As already mentioned all manufacturing facilities under the EC IED are required to hold
an environmental permit to operate. The permit should ensure that activities are carried
out in manners that avoid or reduced environmental impacts to guarantee a high level of
protection. All conditions imposed to these facilities to operate should take into account
best available techniques.
Annex III of the EU IED describes the criteria for determining best available techniques
as follows:
“1. the use of low-waste technology;
2. the use of less hazardous substances;
3. the furthering of recovery and recycling of substances generated and used in the
process and of waste, where appropriate;
4. comparable processes, facilities or methods of operation which have been tried with
success on an industrial scale;
5. technological advances and changes in scientific knowledge and understanding;
6. the nature, effects and volume of the emissions concerned;
7. the commissioning dates for new or existing installations;
8. the length of time needed to introduce the best available technique;
9. the consumption and nature of raw materials (including water) used in the process
and energy efficiency;
10. the need to prevent or reduce to a minimum the overall impact of the emissions on
the environment and the risks to it;
11. the need to prevent accidents and to minimise the consequences for the
environment;
12. information published by public international organisations.” (EC, 2010c).
Appendix
279
Appendix I. Wastes generated in Valero Refinery, Pembroke, over 2007-2011
Tables I.1 and I.2 present a detailed breakdown of the quantities and costs of disposal
and recycling of HW and NHW generated in the Refinery in the period 2007-2011. The
data is sorted by quantity produced (largest first). Table I.3 presents the same data but
sorted by EWC codes. Blanks in tables mean that quantities of waste and costs were not
reported in the Waste Contract Reports.
Waste quantities and costs of treatment were amounted according to the EWC codes
reported on the Waste Contract Reports. Description used was the proposed by the
EWC (i.e. LoW of the EU Directive 2000/532/EC of Appendix C).
Appendix
280
Table I-1. Hazardous Waste generated in the Refinery over 2007-2011 sorted by amount
2007 2008 2009 2010 2011
Waste Description EWC Disposal/Recycling
code
Amount Cost Amount Cost Amount Cost Amount Cost Amount Cost
(t) (£) (t) (£) (t) (£) (t) (£) (t) (£)
Hazardous Waste (HW)
Wastes from cleaning of fuels with bases (fluoridic caustic) 05.01.11* D9 10,937 918,760 10,417 907,990 13,043 1,157,147 16,976 1,664,073 20,446 2,106,948
Wastes from cleaning of fuels with bases (phenolic caustic) 05.01.11* D10 674 149,026 68 15,059 1,011 450,506 490 213,704 194 85,272
Waste blasting material containing dangerous substances (grit blast) 12.01.16* D5 368 314 889 111,397 49 9,822 107 20,721
Soil and stones containing dangerous substances 17.05.03* D13 910 394 0.00 0.00 273 49,501 74 6,525
Aqueous liquid wastes containing dangerous substances (amine water, etc) 16.10.01* D9 477 59,577 866 97,321 0.00 0.00 0.00 0.00 0.00 0.00
Tank bottom sludges 05.01.03* D10 450 249 0.00 0.00 96 36,094 387 112,284
Sludges from physicochemical treatment containing dangerous substances (WWTP sludges, filter press cake, etc)
19.02.05* D10 394 346,060 661 391,548 0.00 0.00 0.00 0.00 0.00 0.00
Wastes containing dangerous substances 16.07.09* D10 0.00 0.00 0.00 0.00 541 64,615 187 24,144 0.00 0.00
Oily sludges from maintenance operations of the plant or equipment 05.01.06* D10 60 23,799 203 265,294 238 147,520 161 61,465 43 22,249
Spent filter clays (merox clay and salts) 05.01.15* D5 60 5,106 357 54,558 0.00 0.00 0.00 0.00 185 38,033
Discarded organic chemicals consisting of or containing dangerous substances 16.05.08* D10 0.00 0.00 0.00 0.00 451 264,296 0.00 0.00 0.00 0.00
Absorbents, filter materials, wiping cloths and protective clothing (PPE) contaminated with dangerous substances
15.02.02* D10 136 8,761 47 35,588 5.54 740 9.85 5,417 20 7,911
Sludges from on-site effluent treatment containing dangerous substances (WWTP centrifuged cake, etc)
05.01.09* D10 0.00 0.00 81 52 15,277 85 14,625 0.00 0.00
Construction materials containing asbestos 17.06.05* D5 63 18,082 31 10,638 16 6,885 23 10,248 51 17,552
Oil spills 05.01.05* D10 0.00 0.00 0.00 0.00 38 35,743 0.00 0.00 138 41,514
Organic wastes containing dangerous substances (coke, benzene, etc) 16.03.05* D10 0.00 0.00 112 0.00 0.00 2.17 1,849 0.30 172
Packaging containing residues of or contaminated by dangerous substances (paint tins, broken glass, aerosols, etc)
15.01.10* D10 15 23,060 7.22 2,823 18 5,027 23 13,603 31 17,150
Spent catalyst contaminated with dangerous substances 16.08.07* D10 49 0.00 0.00 0.00 0.00 37 24,693 0.00 0.00
Other wastes containing dangerous substances (alkylation black tank effluent) 11.01.98* D9 0.00 0.00 55 9,451 0.00 0.00 0.00 0.00 0.00 0.00
Other solvents and solvent mixtures 14.06.03* D10 0.00 0.00 0.00 0.00 0.00 0.00 0.00 0.00 49 14,538
Oil fly ash and boiler dust 10.01.04* D10 0.00 0.00 0.00 0.00 22 1,742 0.20 109 2.30 1,297
Laboratory chemicals, consisting of or containing dangerous substances (ferric sulphite)
16.05.06* D10 0.00 0.00 0.00 0.00 19 13,139 0.00 0.00 4.56 2,640
Sludges from paint or varnish containing organic solvents or other substances 08.01.13* D10 0.00 0.00 0.00 0.00 6.00 4,062 4.34 2,377 2.10 1,184
Other halogenated solvents and solvent mixtures (propylene dichloride, etc) 14.06.02* D10 0.00 0.00 8.20 23,079 2.20 1,447 0.00 0.00 1.20 685
Desalter sludge 05.01.02* D10 0.00 0.00 0.00 0.00 0.00 0.00 0.00 0.00 7.00
Linings and refractories from non-metallurgical process containing dangerous substances
16.11.05* D10 0.00 0.00 0.00 0.00 2.62 917 0.00 0.00 0.00 0.00
Acid Alkyl sludges 05.01.04* D10 0.00 0.00 0.00 0.00 0.00 0.00 1.37 678 0.60 338
Other tars (fuel oil samples) 05.01.08* D10 0.00 0.00 0.00 0.00 0.00 0.00 1.10 545 0.00 0.00
Other fuels (waste fuel sample bottles) 13.07.03* D10 0.00 0.00 0.00 0.00 0.00 0.00 1.00 495 0.00 0.00
Gases in pressure containers (empty aerosols, etc) 16.05.04* D10 0.00 0.00 0.00 0.00 0.00 0.00 0.00 0.00 1.00 564
Spent activated carbon from flue-gas treatment 19.01.10* D10 0.00 0.00 0.00 0.00 0.00 0.00 0.00 0.00 1.00 564
Inorganic wastes containing dangerous substances (sodium bisulphite, etc) 16.03.03* D10 0.00 0.00 0.00 0.00 0.00 0.00 0.00 0.00 0.50 282
Oil filters 16.01.07* D10 0.00 0.00 0.00 0.00 0.00 0.00 0.00 0.00 0.20 121
Total HW disposed 14,592 1,552,230 13,869 1,813,350 16,356 2,280,460 18,418 2,133,442 21,747 2,498,543
Spent catalysts containing dangerous transition metals (HDS catalyst to Moomba) 16.08.02* R5 0.00 0.00 473 0.00 450 0.00 313 0.00 236 0.00
Spent filter clays (merox clay and salts) 05.01.15* R3 0.00 0.00 0.00 0.00 439 105,701 39 9,523 0.00 0.00
Discarded electrical and electronic equipment (WEEE) 20.01.35* R5 13 10,892 4.74 4,443 6.02 2,737 6.05 2,848 3.90 458
Organic wastes containing dangerous substances (VBU Coke) 16.03.05* R3 0.00 0.00 0.00 0.00 26 3,956 0.00 0.00 0.00 0.00
Waste printing toner containing dangerous substances 08.03.17* R3 0.00 0.00 0.34 4.72 1.78 1,638 2.67 1,026
Fluorescent tubes and other mercury-containing waste 20.01.21* R5 0.00 0.00 0.00 0.00 0.00 0.00 0.70 1,956 0.97 1,994
Total HW recycled 13 10,892 478 4,443 925 112,394 361 15,965 244 3,478
Total HW 14,605 1,563,122 14,347 1,817,792 17,281 2,392,854 18,780 2,149,406 21,991 2,502,021
Appendix
281
Table I-2. Non Hazardous Waste generated in the Refinery over 2007-2011 sorted by amount
2007 2008 2009 2010 2011
Waste Description EWC Disposal/Recycling
code
Amount Cost Amount Cost Amount Cost Amount Cost Amount Cost
(t) (£) (t) (£) (t) (£) (t) (£) (t) (£)
Non-Hazardous Waste (NHW)
Mixed municipal waste 20.03.01 D5 169 18,266 293 32,179 251 21,155 273 25,206 322 27,402
Biodegradable kitchen and canteen waste 20.01.08 D5 111 13,626 147 31,704 97 11,158 421 36,749 0.00 0.00
Waste blasting material (grit blast) 12.01.17 D5 0.00 0.00 0.00 0.00 0.00 0.00 0.00 0.00 38 7,294
Glass 20.01.02 D10 0.00 0.00 0.00 0.00 2.74 100 0.00 0.00 0.00 0.00
Inorganic wastes (perlite, etc) 16.03.04 D10 0.00 0.00 0.00 0.00 0.00 0.00 0.00 0.00 0.40 226
Organic wastes (graphite) 16.03.06 D10 0.00 0.00 0.00 0.00 0.00 0.00 0.00 0.00 0.20 114
Total NHW disposed 280 31,892 440 63,883 351 32,413 694 61,955 361 35,036
Spent fluid catalytic cracking catalysts (FCCU Catalyst) 16.08.04 R5 4,273 0.00 3,229 0.00 3,435 0.00 3,072 0.00 3,950 0.00
Metals 20.01.40 R4 1,696 0.00 1,353 0.00 1,716 0.00 1,220 0.00 1,417 0.00
Mixed municipal waste 20.03.01 R11 508 54,798 880 96,536 753 63,465 819 75,617 967 82,207
Spent fluid catalytic cracking catalysts (alumina+molecular sieve adsorbents) 16.08.04 R5 350 86,818 455 0.00 173 33,264 164 42,789 251 71,661
Wooden packaging 15.01.03 R3 154 14,905 260 37,500 47 1,757 5.44 520 13 1,424
Paper and cardboard 20.01.01 R3 26 2,526 21 1,779 28 1,505 22 642 22 491
Spent catalysts containing transition metals or trans. Metal compounds not specified (SNAMS mol sieves/alumina catalyst)
16.08.03 R5 0.00 0.00 0.00 0.00 100 27,158 0.00 0.00 0.00 0.00
Waste alumina (coke from FCCU shutdown, molecular sieve) 10.03.05 R3 0.00 0.00 0.00 0.00 0.00 0.00 0.00 0.00 47 9,418
Gypsum-based construction materials 17.08.02 R5 0.00 0.00 0.00 0.00 0.00 0.00 0.00 0.00 18 1,902
End-of-life tyres 16.01.03 R3 0.00 0.00 14 3,440 2.88 756 0.00 0.00 0.00 0.00
Edible oil and fat 20.01.25 R3 1.54 0.00 1.33 0.00 5.20 0.00 0.00 0.00 0.00 0.00
Absorbents, filter materials, wiping cloths and protective clothing (alumina absorbent, etc)
15.02.03 R5 0.00 0.00 0.00 0.00 0.00 0.00 0.00 0.00 8.00 2,287
Plastics 20.01.39 R3 1.82 0.00 0.20 141 0.00 0.00 0.90 446 0.00 0.00
Total NHW recycled 7,012 159,047 6,214 139,395 6,260 127,904 5,304 125,469 6,692 169,390
Total NHW 7,292 190,939 6,654 203,278 6,611 160,318 5,998 187,424 7,053 204,426
Appendix
282
Table I-3. Waste generated in the Refinery over 2007-2011 sorted by EWC codes
2007 2008 2009 2010 2011
EWC code
Disposal/Recycling code
Description Amount Cost Amount Cost Amount Cost Amount Cost Amount Cost
(t) (£) (t) (£) (t) (£) (t) (£) (t) (£)
05. WASTES FROM PETROLEUM REFINING, NATURAL GAS PURIFICATION AND PYROLYTIC TREATMENT OF COAL
05.01. Wastes from petroleum refining
05.01.02* D10 Desalter sludges 0 0 0 0 0 0 0 0 7
05.01.03* D10 Tank bottom sludges 450 249 0 0 96 36,094 387 112,284
05.01.04* D10 Acid alkyl sludges 0 0 0 0 0 0 1 678 1 338
05.01.05* D10 Oil spills 0 0 0 0 38 35,743 0 0 138 41,514
05.01.06* D10 Oily sludges from maintenance operations of the plant or equipment 60 23,799 203 265,294 238 147,520 161 61,465 43 22,249
05.01.08* D10 Other tars 0 0 0 0 0 0 1 545 0 0
05.01.09* D10 Sludges from on-site effluent treatment containing dangerous substances 0 0 81 52 15,277 85 14,625 0 0
05.01.10 Sludges from on-site effluent treatment other than those mentioned in 05.01.09 0 0 0 0 0 0 0 0 0 0
05.01.11* D10 Wastes from cleaning of fuels with bases. Alkylation settling pond sludge cake 0 0 0 0 0 0 0 0 0 0
05.01.11* D9 Wastes from cleaning of fuels with bases. Fluoridic caustic 10,937 918,760 10,417 907,990 13,043 1,157,147 16,976 1,664,073 20,446 2,106,948
05.01.11* D10 Wastes from cleaning of fuels with bases. Fluoridic caustic sludge 0 0 0 0 0 0 0 0 0 0
05.01.11* D10 Wastes from cleaning of fuels with bases. Fluoridic caustic non-conformed loads 0 0 0 0 0 0 0 0 0 0
05.01.11* D10 Wastes from cleaning of fuels with bases. Phenolic caustic 674 149,026 68 15,059 1,011 450,506 490 213,704 194 85,272
05.01.15* D5 Spent filter clays 60 5,106 357 54,558 0 0 0 0 185 38,033
05.01.15* R3 Spent filter clays 0 0 0 0 439 105,701 39 9,523 0 0
05.01.16 Sulphur-containing wastes from petroleum desulphurisation 0 0 0 0 0 0 0 0 0 0
Total 12,180 1,096,690 11,374 1,242,901 14,822 1,911,894 17,849 2,000,707 21,401 2,406,638
06. WASTES FROM INORGANIC CHEMICAL PROCESSES
06.13. Wastes from other inorganic chemical processes not otherwise specified
06.13.02* Spent activated carbon (except 06.07.02*: activated carbon from chlorine production) 0 0 0 0 0 0 0 0 0 0
Total 0 0 0 0 0 0 0 0 0 0
08. WASTES FROM THE MANUFACTURE, FORMULATION, SUPPLY AND USE (MFSU) OF COATINGS (PAINTS, VARNISHES AND VITREOUS ENAMELS), ADHESIVES, SEALANTS AND PRINTING INKS
08.01. Wastes from MFSU and removal of paint and varnish
08.01.11* Waste paint and varnish containing organic solvents or other dangerous substances 0 0 0 0 0 0 0 0 0 0
08.01.13* D10 Sludges from paint or varnish containing organic solvents or other dangerous substances 0 0 0 0 6 4,062 4 2,377 2 1,184
08.03. Wastes from MFSU of printing inks
08.03.17* R3 Wastes from paint or varnish removal containing organic solvents or other dangerous substances 0 0 0 5 2 1,638 3 1,026
08.03.18 Waste printing toner other than those mentioned in 08.03.17* 0 0 0 0 0 0 0 0 0 0
Total 0 0 0 0 11 4,062 6 4,015 5 2,210
10. WASTES FROM THERMAL PROCESSES
10.01. Wastes from power stations and other combustions plants (except 19.)
10.01.01 Bottom ash, slag and boiler dust (excluding boiler dust mentioned in 10.01.04*) 0 0 0 0 0 0 0 0 0 0
10.01.04* D10 Oil fly ash and boiler dust 0 0 0 0 22 1,742 0 109 2 1,297
10.03. Wastes from aluminium thermal metallurgy
10.03.05 R3 Waste alumina 0 0 0 0 0 0 0 0 47 9,418
Total 0 0 0 0 22 1,742 0 109 49 10,715
Appendix
283
Table I-4. Continued (1). Waste generated in the Refinery over 2007-2011 sorted by EWC codes
2007 2008 2009 2010 2011
EWC code
Disposal/Recycling code
Description Amount Cost Amount Cost Amount Cost Amount Cost Amount Cost
(t) (£) (t) (£) (t) (£) (t) (£) (t) (£)
11. WASTES FROM CHEMICAL SURFACE TREATMENT AND COATING OF METALS AND OTHER MATERIALS; NON-FERROUS HYDROMETALLURGY
11.01. Wastes from chemical surface treatment and coating of metals and other materials (e.g. galvanic processes, zinc coating processes, pickling processes, etching, phosphating, alkaline degreasing, anodising)
11.01.98* D9 Other wastes containing dangerous substances 0 0 55 9,451 0 0 0 0 0 0
Total 0 0 55 9,451 0 0 0 0 0 0
12. WASTES FROM SHAPING AND PHYSICAL AND MECHANICAL SURFACE TREATMENT OF METALS AND PLASTICS
12.01. Wastes from shaping and physical and mechanical surface treatment of metals and plastics
12.01.16* D5 Waste blasting material containing dangerous substances 368 314 889 111,397 49 9,822 107 20,721
12.01.17 D5 Waste blasting material other than those mentioned in 12.01.16* 0 0 0 0 0 0 0 0 38 7,294
Total 368 0 314 0 889 111,397 49 9,822 145 28,015
13. OIL WASTES AND WASTES OF LIQUID FUELS (EXCEPT EDIBLE OILS AND THOSE IN CHAPTERS 05., 12. AND 19.)
13.07. Wastes of liquids fuels
13.07.03* D10 Other fuels (including mixtures) 0 0 0 0 0 0 1 495 0 0
Total 0 0 0 0 0 0 1 495 0 0
14. WASTE ORGANIC SOLVENTS, REFRIGERANTS AND PROPELLANTS (except 07. and 08.)
14.06. Waste organic solvents, refrigerants and foam/aerosol propellants
14.06.02* D10 Other halogenated solvents and solvent mixtures 0 0 8 23,079 2 1,447 0 0 1 685
14.06.03* D10 Other solvents and solvent mixtures 0 0 0 0 0 0 0 0 49 14,538
Total 0 0 8 23,079 2 1,447 0 0 50 15,223
15. WASTE PACKAGING; ABSORBENTS, WIPING CLOTHS, FILTER MATERIALS AND PROTECTIVE CLOTHING NOT OTHERWISE SPECIFIED
15.01. Packaging (including separately collected municipal packaging waste)
15.01.01 Paper and cardboard packaging 0 0 0 0 0 0 0 0 0 0
15.01.02 Plastic packaging 0 0 0 0 0 0 0 0 0 0
15.01.03 R3 Wooden packaging 154 14,905 260 37,500 47 1,757 5 520 13 1,424
15.01.05 Composite packaging 0 0 0 0 0 0 0 0 0 0
15.01.10* D10 Packaging containing residues of or contaminated by dangerous substances 15 23,060 7 2,823 18 5,027 23 13,603 31 17,150
15.02. Absorbents, filter materials, wiping cloths and protective clothing
15.02.02* D10 Absorbents, filter materials (including oil filters not otherwise specified), wiping cloths, protective clothing contaminated by dangerous substances
136 8,761 47 35,588 6 740 10 5,417 20 7,911
15.02.03 R5 Absorbents, filter materials, wiping cloths and protective clothing other than those mentioned in 15.02.02*
0 0 0 0 0 0 0 0 8 2,287
Total 305 46,726 313 75,911 71 7,524 39 19,540 72 28,772
Appendix
284
Table I-5. Continued (2). Waste generated in the Refinery over 2007-2011 sorted by EWC codes
2007 2008 2009 2010 2011
EWC code
Disposal/Recycling code
Description Amount Cost Amount Cost Amount Cost Amount Cost Amount Cost
(t) (£) (t) (£) (t) (£) (t) (£) (t) (£)
16. WASTES NOT OTHERWISE SPECIFIED IN THE LIST
16.01. End-of-life vehicles from different means of transport (including off-road machinery) and waste from dismantling of end-of-life vehicles and vehicle maintenance (except 13., 14., 16.06., and 16.08.)
16.01.03 R3 End-of-life tyres 0 0 14 3,440 3 756 0 0 0 0
16.01.07* D10 Oil filters 0 0 0 0 0 0 0 0 0 121
16.02. Wastes from electrical and electronic equipment
16.02.11* Discarded equipment containing chlorofluorocarbons, HCFC, HFC 0 0 0 0 0 0 0 0 0 0
16.03. Off-specification batches and unused products
16.03.03* D10 Inorganic wastes containing dangerous substances 0 0 0 0 0 0 0 0 1 282
16.03.04 D10 Inorganic wastes other than those mentioned in 16.03.03* 0 0 0 0 0 0 0 0 0 226
16.03.05* D10 Organic wastes containing dangerous substances 0 0 112 0 0 2 1,849 0 172
16.03.05* R3 Organic wastes containing dangerous substances 0 0 0 0 26 3,956 0 0 0 0
16.03.06 D10 Organic wastes other than those mentioned in 16.03.05* 0 0 0 0 0 0 0 0 0 114
16.05. Gases in pressure containers and discarded chemicals
16.05.04* D10 Gases in pressure containers (including halons) containing dangerous substances 0 0 0 0 0 0 0 0 1 564
16.05.06* D10 Laboratory chemicals, consisting of or containing dangerous substances, including mixtures of laboratory chemicals
0 0 0 0 19 13,139 0 0 5 2,640
16.05.08* D10 Discarded organic chemicals consisting of or containing dangerous substances 0 0 0 0 451 264,296 0 0 0 0
16.06. Batteries and accumulators
16.06.04 Alkaline batteries (except 16.06.03*: Mercury-containing batteries) 0 0 0 0 0 0 0 0 0 0
16.07. Wastes from transport and storage tank and barrel cleaning (except 05. and 13.)
16.07.09* D10 Wastes containing other dangerous substances 0 0 0 0 541 64,615 187 24,144 0 0
16.08. Spent catalysts
16.08.02* R5 Spent catalysts containing dangerous transition metals * or dangerous transition metal compounds. HDS catalyst
0 0 473 0 450 0 313 0 236 0
16.08.03 R5 Spent catalysts containing transition metals or transition metal compounds not otherwise specified 0 0 0 0 100 27,158 0 0 0 0
16.08.04 R5 Spent fluid catalytic cracking catalysts (except 16.08.07*) (FCCU catalyst) 4,273 0 3,229 0 3,435 0 3,072 0 3,950 0
16.08.04 R5 Spent fluid catalytic cracking catalysts (except 16.08.07*) (Alumina and molecular sieve materials not from FCCU but also classified as Spent fluid catalytic cracking catalyst)
350 86,818 455 0 173 33,264 164 42,789 251 71,661
16.08.07* D10 Spent catalysts contaminated with dangerous substances 49 0 0 0 0 37 24,693 0 0
16.10. Aqueous liquid wastes destined for off-site treatment
16.10.01* D9 Aqueous liquid wastes containing dangerous substances 477 59,577 866 97,321 0 0 0 0 0 0
16.11. Waste linings and refractories
16.11.05* D10 Linings and refractories from non-metallurgical processes containing dangerous substances 0 0 0 0 3 917 0 0 0 0
Total 5,149 146,395 5,149 100,761 5,201 408,100 3,776 93,475 4,444 75,780
(*) For the purpose of this entry, transition metals are: scandium, vanadium, manganese, cobalt, copper, yttrium, niobium, hafnium, tungsten, titanium, chromium, iron, nickel, zinc, zirconium, molybdenum and tantalum. These metals or their compounds are dangerous if they are classified as dangerous substances. The
classification of dangerous substances shall determine which among those transition metals and which transition metal compounds are hazardous.
Appendix
285
Table I-6. Continued (3). Waste generated in the Refinery over 2007-2011 sorted by EWC codes
2007 2008 2009 2010 2011
EWC code
Disposal/Recycling code
Description Amount Cost Amount Cost Amount Cost Amount Cost Amount Cost
(t) (£) (t) (£) (t) (£) (t) (£) (t) (£)
17. CONSTRUCTION AND DEMOLITION WASTES (INCLUDING EXCAVATED SOIL FROM CONTAMINATED SITES)
17.05. Soil (including excavated soil from contaminated sites), stones and dredging spoil
17.05.03* D13 Soil and stones containing dangerous substances 910 394 0 0 273 49,501 74 6,525
17.06. Insulation materials and asbestos-containing construction materials
17.06.01* Insulation materials containing asbestos 0 0 0 0 0 0 0 0 0 0
17.06.04 Insulation materials (other than those mentioned in 17.06.01* and 17.06.03*:other insulation materials consisting of or containing dangerous substances)
0 0 0 0 0 0 0 0 0 0
17.06.05* D5 Construction materials containing asbestos* 63 18,082 31 10,638 16 6,885 23 10,248 51 17,552
17.08. Gypsum-based construction material
17.08.02 R5 Gypsum-based construction materials (other than those mentioned in 17.08.01*: Gypsum-based construction materials contaminated with dangerous substances)
0 0 0 0 0 0 0 0 18 1,902
Total 974 18,082 425 10,638 16 6,885 296 59,750 144 25,978
19. WASTES FROM WASTE MANAGEMENT FACILITIES, OFF-SITE WASTE WATER TREATMENT PLANTS AND THE PREPARATION OF WATER INTENDED FOR HUMAN CONSUMPTION AND WATER FOR INDUSTRIAL USE
19.01. Wastes from incineration or pyrolysis of waste
19.01.10* D10 Spent activated carbon from flue-gas treatment 0 0 0 0 0 0 0 0 1 564
19.02. Wastes from specific physico/chemical treatments of industrial waste (e.g. Dechromatation, decyanidation, neutralisation)
19.02.05* D10 Sludges from physico/chemical treatment containing dangerous substances 394 346,060 661 391,548 0 0 0 0 0 0
Total 394 346,060 661 391,548 0 0 0 0 1 564
20. MUNICIPAL WASTES (HOUSEHOLD WASTE AND SIMILAR COMMERCIAL, INDUSTRIAL AND INSTITUTIONAL WASTES) INCLUDING SEPARATELY COLLECTED FRACTIONS
20.01. Separately collected fractions (except 15.01.)
20.01.01 R3 Paper and cardboard 26 2,526 21 1,779 28 1,505 22 642 22 491
20.01.02 D10 Glass 0 0 0 0 3 100 0 0 0 0
20.01.08 D5 Biodegradable kitchen and canteen waste 111 13,626 147 31,704 97 11,158 421 36,749 0 0
20.01.21* R5 Fluorescent tubes and other mercury-containing waste 0 0 0 0 0 0 1 1,956 1 1,994
20.01.23* Discarded equipment containing chlorofluorocarbons 0 0 0 0 0 0 0 0 0 0
20.01.25 R3 Edible oil and fat 2 0 1 0 5 0 0 0 0 0
20.01.35* R5 Discarded electrical and electronic equipment other than those mentioned in 20.01.21* and 20.01.23* containing hazardous components**
13 10,892 5 4,443 6 2,737 6 2,848 4 458
20.01.38 Wood (other than those mentioned in 20.01.37*: Wood containing dangerous substances) 0 0 0 0 0 0 0 0 0 0
20.01.39 R3 Plastics 2 0 0 141 0 0 1 446 0 0
20.01.40 R4 Metals 1,696 0 1,353 0 1,716 0 1,220 0 1,417 0
20.03. Other municipal wastes
20.03.01 D5 Mixed municipal waste 169 18,266 293 32,179 251 21,155 273 25,206 322 27,402
20.03.01 R11 Mixed municipal waste 508 54,798 880 96,536 753 63,465 819 75,617 967 82,207
Total 2,527 100,108 2,701 166,781 2,859 100,120 2,763 148,920 2,732 112,552
(*) As far as the landfilling of waste is concerned, Member States may decide to postpone the entry into force of this entry until the establishment of appropriate measures for the treatment and disposal of waste from construction material containing asbestos. These measures are to be established according to the procedure
referred to in Article 17 of Council Directive 1999/31/EC on the landfill of waste (OJ L 182, 16.7.1999, p. 1) and shall be adopted by 16 July 2002 at the latest.
(**) Hazardous components from electrical and electronic equipment may include accumulators and batteries mentioned in 16 06 (batteries and accumulators) and marked as hazardous; mercury switches, glass from cathode ray tubes and other activated glass etc.
Appendix
286
Appendix J. Crude oil processed and alkylate produced over 2007-2011 in Valero
Refinery, Pembroke
Table J-1 reports the Refinery crude oil processed and alkylate produced over 2007-2011.
These values were used for the calculation of the Refinery Waste KPIs: Unit of Normalised
Amount of Total Waste and Normalised Amount of Alkylate Waste as described in Table
3.1.
Table J-1. Crude oil processed and alkylate produced in the Refinery over 2007-2011
Plant Information 2007 2008 2009 2010 2011
(Mt/yr)
Crude oil processed 10.5 10.2 10.2 10.4 10.3
Alkylate produced 1.3 0.9 1.3 1.2 1.2
Appendix
287
Appendix K. Waste and Cost KPIs per type of waste of Valero Refinery,
Pembroke, over 2007-2011
Table K-1 presents the Refinery Waste and Cost KPIs per type of waste over 2007-2011
defined in Table 3.1.
Appendix
288
Table K-1. Refinery Waste and Cost KPIs per type of waste over 2007-2011
2007 2008 2009 2010 2011
Waste Description (£/t) (Kg/t) (£/t) (Kg/t) (£/t) (Kg/t) (£/t) (Kg/t) (£/t) (Kg/t)
Hazardous Waste (HW)
107 1.4 127 1.4 138 1.7 114 1.8 114 2.1
HW Disposed 106 1.39 131 1.36 139 1.61 116 1.77 115 2.10
HW Recycled 837 0.001 9 0.047 121 0.091 44 0.035 14 0.024
Non-Hazardous Waste (NHW)
26 0.7 31 0.7 24 0.7 31 0.6 29 0.7
NHW Disposed 114 0.03 145 0.04 92 0.03 89 0.07 97 0.03
NHW Recycled 23 0.67 22 0.61 20 0.62 24 0.51 25 0.65
Appendix
289
Appendix L. Five Year Waste Review Executive Summary of Valero Refinery,
Pembroke
The Refinery Five Year Waste Review Executive Summary is as follows. This report
does not include the tables of results as they are already presented in Table I-1 and I-2 of
Appendix I.
Appendix
291
1. Introduction
The revised Waste Framework Directive (European Commission, 2008), entered into force on 12 December
2008, requires the UK and other member states in the European Union (EU) to keep chronological records of all
type of waste generated. Quantity of waste, nature, origin, destination and treatment method is part of the
information that needs to be registered.
The UK Government has established statutory instruments on waste that are currently regulated by the
Environment Agency (EA) of England and Wales. In the Environmental Permit of Valero Pembroke Refinery
issued in 2006 and reviewed in 2007, the EA has indicated that the Refinery shall review and record at least
every four years its waste generated.
This review presents data on all type of waste generated at Valero Pembroke Refinery from 2007 to 2011. In
future, use will be made of the database TR548 which was created for improved monitoring and control of waste
and posted on the Refinery intranet in April 2011.
Furthermore some specific environmental issues have been highlighted and questions have been made to be
addressed in future. Minimising the production of waste and reducing operational costs are at the core of Valero’s
principles which have set high expectations in achieving excellence on environmental performance and industry-
leading returns.
2. Methodology
Three sets of data were collected. Waste arising data from Waste Contract Reports produced by the Refinery’s
waste contractor, plant information reported on the Refinery intranet system IndX and information about
turnarounds and maintenance operations events that took place at the Refinery over the period of study which
was available at Refinery Directory Networks.
Waste data collected were the type of waste produced, the quantity generated (t/month), the off-site treatment
costs (£/month) and the unallocated on-site work costs (£/month) excluding Value Added Tax (VAT). For the
purposes of the review all this data was aggregated and reported on an annual basis.
The off-site treatment costs included all charges for disposal or recycling waste. The unallocated on-site work
costs comprised expenses such as machinery rentals (equipment, bins and skips), vacuum truck and driver fees,
tank cleaning operations and any other work costs for waste management on-site. Information about TA and MO
events included date and the Refinery business units involved.
The types of waste were fully defined according to the European Waste Catalogue (EWC) and disposal and
recovery (recycling) operations were registered according to Annexes I and II of the European Commission
Directive 2008/1/EC.
Waste was classified into two main categories: Hazardous Waste (HW) and Non-Hazardous Waste (NHW). Then
each main category was sub-categorised into Hazardous Waste Disposed (HWD), Hazardous Waste Recycled
(HWR), Non-Hazardous Waste Disposed (NHWD) and Non-Hazardous Waste Recycled (NHWR).
3. Results
Figure 1 presents the trend in waste production and costs in the Refinery over 2007-2011.
Appendix
292
Figure 1. Waste generated in the Refinery and costs over 2007-2011
An overall view of the Refinery waste production and costs in the figure indicates that they increased over 2007-
2011. The total waste generated, i.e. the added quantity of Hazardous Waste (HW) and Non-Hazardous Waste
(NHW), rose by 7.1 kt to 29 kt, i.e. an increment of 33% in five years. With regard to costs, i.e. the added costs of
HW, NHW and unallocated on-site work, the Refinery spent £2.1 M more in 2011 compared to 2007, i.e. an
increase of 104%.
As seen in the figure the Refinery produced HW and Non-Hazardous Waste NHW in the period of which HW
accounted for >70% of the total waste generated and was the costliest to treat. The production of HW increased
by 7.4 kt to 21.9 kt in 2011, i.e. an increment of 50.6% compared to 2007. HW cost the Refinery £0.94 M more in
2011 with regard to 2007 which represented a rise of 60%. On the other hand NHW was less produced. Its
quantity generated was relatively stable in the period, i.e. an average production of 6.3 kt/y, and its costs
remained approximately constant at an average rate of £189 k/y. From the figure it can be estimated that the
Refinery spent over the whole period the same amount to treat NHW than it did only for the increment on costs of
HW over 2007-2011.
In terms of unallocated on-site work costs the Figure illustrates that they varied without any pattern. In 2011 the
Refinery spent for this concept five times more (i.e. £1.2 M) than it did in 2007, i.e. the year when these costs
were considerably lower in contrast to the rest of the period. Two main issues influenced these trends. In 2011 a
new technique was introduced in the Refinery to maximise the recovery of oil from tank bottom sludge. Tanks 8
(crude oil) and 53 (slop) were in service and cost the Refinery in total £0.56 M to clean this year. On the other
hand there was a lack of details on data of unallocated on-site work costs in particular in 2007 which may
suggest that the reported costs this year could not take into account all the associated expenses.
Figure 2 shows the trends in the production per type of waste and costs over 2007-2011.
0.0
0.5
1.0
1.5
2.0
2.5
3.0
0
5
10
15
20
25
30
35
2007 2008 2009 2010 2011
Costs
(£M
)
Waste
pro
ductio
n (kt)
Non-Hazardous
Waste (NHW)
Hazardous Waste
(HW)
HW costs
NHW costs
Unallocated on-site
work costs
Appendix
293
Figure 2. Production of HW and NHW disposed and recycled and costs in the Refinery over 2007-2011
This figure indicates that the majority of HW was disposed (>95%) and most of NHW was recycled (>88%). It
also illustrates that these proportions kept relatively constant throughout the period for both of these wastes. Per
type of treatment the figure highlights that HW disposed (HWD) was the most generated, i.e. 71% w/w of the total
Refinery waste, and the costliest. HWD accounted for 90% of the total Refinery expenditure for off-site waste
treatment over 2007-2011. Detailed data, i.e. type of HW and NHW, production and costs in the Refinery over
2007-2011 is presented in Table I-1 and I-2 of Appendix I.
Table 1 shows a comparable breakdown of all waste generated in 2011. The main constituent of HWD was
fluoridic caustic (i.e. 95% w/w). Oily sludge from different sources, phenolic caustic and other HWD were much
smaller in quantity and cost, with the latest comprising different streams such as waste blasting materials, oil and
stones containing dangerous substances, spent filter clays and absorbents, filter materials, wiping cloths and
protective clothing (PPE) contaminated with dangerous substances.
99.9% D
£1.5 M
97% D
£1.8 M
95% D
£2.3 M
98% D
£2.1 M
99% D
£2.5 M
96% R
£0.16 M93% R
£0.14 M
95% R
£0.13 M
88% R
£0.13 M
95% R
£0.16 M
0
5
10
15
20
25
HW NHW HW NHW HW NHW HW NHW HW NHW
2007 2008 2009 2010 2011
Pro
ductio
n (kt)
Disposed (D)
Recycled (R)
Appendix
294
Table 1. Summary of total Refinery’s waste and costs in 2011
Waste Amount Costs
(kt) (£M)
Hazardous Waste (HW) 21.9 2.5
HW Disposed (HWD) 21.7 2.4
- Fluoridic caustic 20.5 2.1
- Oily sludge from different sources* 0.43 0.13
- Phenolic caustic 0.19 0.085
- Other HWD 0.58 0.096
HW Recycled (HWR) 0.24 0.0035
Non-Hazardous Waste (NHW) 7.1 0.204
NHW Disposed (NHWD) 0.4 0.035
NHW Recycled (NHWR) 6.7 0.169
Unallocated on-site work costs N/A 1.4
Total 29 4.1
(*) Oily sludge from different sources aggregates: desalter sludge, tank bottom sludges, acid alkyl sludges, Oily sludge from maintenance
operations of the plant or equipment, Sludge from on-site effluent treatment containing dangerous substances and Sludge from physicochemical
treatment containing dangerous substances.
Fluoridic caustic represented 71% w/w of all waste generated and 51% of the total Refinery expenditure. Results
shown in Table I-1 (Appendix I) indicates that the generation of fluoridic caustic increased steadily over the period
and defined the overall trend on Refinery’s waste production. Operational disturbances such us the increase in
contaminants on the Alkylation Unit feed (e.g. sulphur, moisture and diolefins) may be analysed in future
involving Merox, De-isobutaniser and the Hydro-isomerisation Units.
As seen in Table 1 the production of oily sludge from different sources represented 1.5% w/w of total waste
generated and 3.2% of the total expenditure in 2011. Albeit these proportions were considerable low compared to
fluoridic caustic and also to NHW, it represented the HW secondly most generated and expensive to treat in the
Refinery over the whole period. The production and treatment of oily sludge is a problem that goes beyond the
Refinery gates and faced for different industrial sectors worldwide whereby it may be an interesting topic of future
research work.
According to Table I-2 of Appendix I the most NHW generated were spent Fluidized Catalytic Cracking (FCCU)
Catalyst, metals and mixed municipal waste. In the table can be visualised that the first two and 75% w/w of
mixed municipal waste were recycled. The table highlights that no charges applied to the Refinery for the
recycling of Spent FFCU catalyst and metals whereas mixed municipal waste costs accounted for 52% of the
total Refinery expenditure to treat NHW.
4. DATA UNCERTAINTIES
Lack of details and huge variability on unallocated on-site work costs were found in 2007;
In some occasions same EWC codes were assigned to different waste streams such as oily sludge from
different sources, grit blasting materials, spent filter clays, soil and stones containing dangerous
substances, oil spills and aqueous liquid wastes containing dangerous substances;
Appendix
295
Background data to support the decision making on the final treatment of waste (i.e. disposal or
recycling) was not found in the Waste Contract Reports.
5. CONCLUSIONS
The total quantity of waste generated in the Refinery over 2007-2011 increased by 7.1 kt to 29kt which
represented an increase of 33% in five years;
The Refinery spent £2.1 M more in 2011 compared to 2007 to manage waste on-site and treat it off-site.
This represented an increase of 104% in five years;
Over 67% of all waste generated at the Refinery was Hazardous and represented more than 61% of the
total costs;
In 2011 the total amount of waste produced was 29 kt of which fluoridic caustic accounted for 71%. This
year the Refinery spent £4.1 M of which 61% was to treat HW off-site, 34% to manage waste on-site
and 5% to treat NHW off-site; and
Over 95% of HW was disposed and more than 88% of NHW was recycled.
6. RECOMMENDATIONS
To perform in future a root-cause analysis to explain and eliminate the increase in the production of
fluoridic caustic; the Alkylation Unit Engineering Team has been analysing the influence of process
conditions in the increment of fluoridic caustic such as changes in temperature profile of the re-run
column and rises of contaminants concentration in the feed;
To review means to minimise/avoid HW production specifically fluoridic caustic and oily sludge from
different sources. On the other hand HES Department is studying alternative routes for the treatment of
fluoridic caustic to reduce disposal costs;
To determine points of lost value and where it can be recovered by optimising current practices on
waste management on-site/off-site; and
To improve the Waste Contractor reports by detailing information of all on-site work costs.
Appendix
296
Appendix M. Waste production and off-site costs per type of waste in 2012 of
Valero Refinery, Pembroke
Tables M-1 and M-2 present detailed breakdowns of the quantity generated and off-site
costs per type of waste in the Refinery in 2012 sorted by amount.
Appendix
297
Table M-1. Hazardous Waste generated in the Refinery in 2012 sorted by amount
2012
Waste Description EWC Disposal/ Recycling
code
Amount Cost
(t) (£)
Hazardous Waste (HW)
Wastes from cleaning fuels with bases (fluoridic caustic) 05.01.11* D10 13,076 1,206,068
Sludges from physico/chemical treatment containing dangerous substances 19.02.05* D10 1,575 362,195
Waste blasting material containing dangerous substances 12.01.16* D5 229 32,933
Oily sludges from maintenance operations of the plant or equipment 05.01.06* D10 117 61,604
Construction materials containing asbestos 17.06.05* D5 88 37,232
Tank bottom sludges 05.01.03* D10 76 27,650
Spent catalyst contaminated with dangerous substances 16.08.07* D10 52 26,829
Packaging containing residues of or contaminated by dangerous substances 15.01.10* D10 42 21,653
Absorbents, filter materials (including oil filters not otherwise specified),
wiping cloths, protective clothing contaminated by dangerous substances)
(merox charcoal)
15.02.02* D10 42 20,094
Oil spills 05.01.05* D10 39 14,582
Absorbents, filter materials (including oil filters not otherwise specified),
wiping cloths, protective clothing contaminated by dangerous substances)
(oily PPE)
15.02.02* D10 23 9,464
Oil fly ash and boiler dust 10.01.04* D10 11 6,008
Linings and refractories from non-metallurgical processes containing
dangerous substances 16.11.05* D10 8.26 4,352
Organic wastes containing dangerous substances 16.03.05* D10 8.00 2,399
Spent activated carbon (except 06.07.02) 06.13.02* D10 6.22 3,285
Bottom ash, slag and boiler dust from co-incineration containing dangerous
substances 10.01.14* D10 6.10 3,102
Other tars 05.01.08* D10 3.16 1,758
Waste paint and varnish containing organic solvents or other dangerous
substances 08.01.11* D10 3.12 1,731
Laboratory chemicals, consisting of or containing dangerous substances,
including mixtures of laboratory chemicals 16.05.06* D10 1.96 1,140
Spent filter clays 05.01.15* D10 1.48 865
Sludges from paint or vanish containing organic solvents or other dangerous
substances 08.01.13* D10 1.00 528
Other fuels (including mixtures) 13.07.03* D10 0.95 553
Oil filters 16.01.07* D10 0.86 463
Gases in pressure containers (including halons) containing dangerous
substances 16.05.04* D10 0.85 462
Total HW disposed 15,412 1,846,948
Soil and stones containing dangerous substances 17.05.03* R3 58 11,994
Waste painting toner containing dangerous substances 08.03.17* R3 4.00 480
Fluorescent tubes and other mercury-containing waste 20.01.21* R5 3.65 3,845
Discarded equipment containing chlorofluorocarbons, HCFC, HFC 16.02.11* R11 2.86 376
Total HW recycled 68 16,695
Total HW 15,480 1,863,643
Appendix
298
Table M-2. Non-Hazardous Waste generated in the Refinery in 2012 sorted by amount
2012
Waste Description EWC
Disposal/
Recycling
code
Amount Cost
(t) (£)
Non-Hazardous Waste (HW)
Mixed municipal waste 20.03.01 D5 245 20,708
Waste blasting material other than those mentioned in 12.01.16 12.01.17 D5 39 7,761
Absorbents, filter materials, wiping cloths and protective clothing other than
those mentioned in 15.02.02 15.02.03 D10 7.48 787
Insulation materials other than those mentioned in 17.06.01 and 17.06.03 17.06.04 D5 5.52 620
Sulphur-containing wastes from petroleum desulphurisation 05.01.16 D10 0.41 214
Bottom ash, slag and boiler dust (excluding boiler dust mentioned in
10.01.04) 10.01.01 D10 0.21 110
Total NHW disposed 298 30,200
Spent Fluid Catalytic Cracking Catalyst (except 16.08.07) (FCCU catalyst
fines exported) 16.08.04 R5 2,729 0.00
Metals 20.01.40 R4 786 0.00
Mixed municipal waste 20.01.40 R11 736 62,123
Spent Fluid Catalytic Cracking Catalyst (except 16.08.07) (not from FCCU) 16.08.04 R5 244 69,783
Paper and cardboard 20.01.01 R3 13 206
Wood other than that mentioned in 20.01.37 20.01.38 R3 3.26 303
Wooden packaging 15.01.03 R3 2.72 289
Alkaline batteries (except 16.06.03) 16.06.04 R5 2.32 730
Plastics 20.01.39 R3 1.96 187
Waste printing toner other than those mentioned in 08.03.17 08.03.18 R3 0.30 118
Total NHW recycled 4,519 133,738
Total NHW 4,817 163,937
Appendix
299
Appendix N. Waste production and off-site costs per treatment method and
EWC codes in 2013 of Valero Refinery, Pembroke
Table N-1 presents on a monthly basis the quantity of waste produced in 2013 and off-
site costs per type of waste (i.e. HWD, HWR, NHWD and NHWR) and treatment
method according to the WFD codes presented in Appendix D. Table N-2 and Table N-
3 also show the monthly amount of waste generated and off-site costs per type of waste
but according to the EWC codes. Table N-4 lists the off-site facilities and their locations
the Refinery used to dispose and recycled its waste. Blanks in tables mean that data was
not available for the moment of collection and minus numbers represent costs the
Refinery recovered due to charges wrongly made by the Waste Contractor on previous
months.
Appendix
300
Table N-1. Refinery waste production and off-site costs in 2013 per treatment method
Jan Feb Mar Apr May Jun Jul Aug Sep Oct Nov Dec
Waste description Disposal Recycling
codes
Amount Costs Amount Costs Amount Costs Amount Costs Amount Costs Amount Costs Amount Costs Amount Costs Amount Costs Amount Costs Amount Costs Amount Costs
(t) (£) (t) (£) (t) (£) (t) (£) (t) (£) (t) (£) (t) (£) (t) (£) (t) (£) (t) (£) (t) (£) (t) (£)
Hazardous Waste
Disposed
Incineration on land D10 0.64 250 91 40,214 99 49,215 105 45,943 143 62,283 149 54,078 101 39,438 15 7,540 13 3,709 122 44,351 44 21,145 0.00 0.00
Physico-chemical treatment not specified elsewhere which results in final compounds or mixtures which are disposed of by any of the operations numbered D1 to D12
D9 1,677 124,792 1,276 96,283 1,481 120,488 1,242 105,751 1,464 106,143 1,773 183,911 1,785 115,998 1,794 121,744 1,175 80,000 957 65,616 984 64,501 984 65,471
Specially engineered landfill (e.g. placement into lined discrete cells which are capped and isolated from one another and the environment, etc)
D5 4.78 1,321 3.50 1,097 0.00 0.00 2.04 842 8.74 2,568 18 3,648 34 7,245 0.00 0.00 53 9,616 0.00 0.00 0.00 0.00 0.00 0.00
Recycled
Recycling/reclamation of organic substances which are not used as solvents (including composting and other biological transformation processes)
R3 0.00 0.00 0.00 0.00 78 15,067 113 25,194 152 29,776 59 10,751 0.00 0.00 26 4,964 0.00 0.00 0.00 0.00 0.00 0.00 0.00 0.00
Recycling/reclamation of other inorganic materials
R5 0.00 0.00 0.00 0.00 0.00 0.00 0.10 800 0.00 0.00 0.00 0.00 0.00 0.00 27 5,225 89 18,446 46 12,584 0.00 0.00 26 4,794
Use of wastes obtained from any of the operations numbered R1 to R10
R11 2.84 374 0.00 0.00 0.00 0.00 0.00 0.00 0.00 0.00 0.00 0.00 2.70 329 0.00 0.00 0.00 0.00 0.00 0.00 55 10,924 0.00 0.00
Non-Hazardous waste
Disposed
Incineration on land D10 0.00 0.00 0.00 0.00 0.40 210 0.00 0.00 0.00 0.00 0.00 0.00 0.00 0.00 0.00 0.00 0.00 0.00 0.80 415 0.00 0.00 0.00 0.00
Specially engineered landfill (e.g. placement into lined discrete cells which are capped and isolated from one another and the environment, etc)
D5 19 1,587 12 1,028 11 930 11 1,013 12 1,091 13 1,093 13 1,082 16 1,340 15 1,166 21 1,514 11 923 31 5,062
Recycled
Recycling/reclamation of organic substances which are not used as solvents (including composting and other biological transformation processes)
R3 32 5,027 4.46 335 14 1,023 6.38 691 6.52 322 0.00 0.00 0.00 0.00 1.56 - 16.02 0.99 362 6.50 603 7.54 563 5.18 571
Recycling/reclamation of other inorganic materials
R5 320 4,648 258 4,421 195 4,421 292 1,382 312 3,647 306 0.00 315 0.00 276 9,049 204 225 251 4,050 260 4,112 0.00 0.00
Use of wastes obtained from any of the operations numbered R1 to R10
R11 56 4,762 36 3,083 33 2,791 34 3,039 40 3,502 30 2,542 40 3,246 47 4,019 38 3,256 45 3,796 22 1,890 35 2,980
Appendix
301
Table N-2. Hazardous Waste generated in the Refinery according to EWC codes and off-site costs in 2013
Jan Feb Mar Apr May Jun Jul Aug Sep Oct Nov Dec
Waste description EWC
codes
Disposal
Recycling codes
Amount Costs Amount Costs Amount Costs Amount Costs Amount Costs Amount Costs Amount Costs Amount Costs Amount Costs Amount Costs Amount Costs Amount Costs
(t) (£) (t) (£) (t) (£) (t) (£) (t) (£) (t) (£) (t) (£) (t) (£) (t) (£) (t) (£) (t) (£) (t) (£)
Hazardous Waste (HW)
Wastes from cleaning of
fuels with bases (Fluoridics)
05.01.11* D9 1,677 124,792 1,276 96,283 1,481 120,488 1,242 105,751 1,464 106,143 1,773 183,911 1,785 115,998 1,794 121,744 1,175 80,000 957 65,616 984 64,501 984 65,471
Spent filter clays 05.01.15* D10 0.00 0.00 61 24,772 35 14,419 73 29,710 55 22,012 0.00 0.00 0.00 0.00 0.00 0.00 0.00 0.00 0.00 0.00 0.00 0.00 0.00 0.00
Wastes from cleaning of
fuels with bases (Phenolic caustic)
05.01.11* D10 0.00 0.00 0.00 0.00 0.00 0.00 0.00 0.00 86 38,693 79 27,793 52 18,368 0.00 0.00 0.00 0.00 0.00 0.00 0.00 0.00 0.00 0.00
Oily sludges from
maintenance operations of the plant or equipment
05.01.06* D10 0.00 0.00 2.66 1,382 13 7,163 1.75 919 3.06 1,578 8.04 4,112 40 17,306 3.82 1,927 13 3,709 72 20,309 12 6,063 0.00 0.00
Tank bottom sludges 05.01.03* D10 0.00 0.00 4.64 2,410 37 18,429 26 12,767 0.00 0.00 40 10,964 0.00 0.00 4.20 2,118 0.00 0.00 21 10,590 3.62 1,773 0.00 0.00
Waste blasting materials containing dangerous substances
12.01.16* D5 0.00 0.00 0.00 0.00 0.00 0.00 0.00 0.00 0.00 0.00 18 3,648 0.00 0.00 0.00 0.00 53 9,616 0.00 0.00 0.00 0.00 0.00 0.00
Oil spills 05.01.05* D10 0.00 0.00 8.09 4,166 0.00 0.00 1.00 529 0.00 0.00 0.00 0.00 1.47 750 1.81 913 0.00 0.00 22 10,532 19 9,198 0.00 0.00
Soil and stones
containing dangerous substances
17.05.03* D5 0.00 0.00 0.00 0.00 0.00 0.00 0.00 0.00 0.00 0.00 0.00 0.00 29 5,320 0.00 0.00 0.00 0.00 0.00 0.00 0.00 0.00 0.00 0.00
Construction materials containing asbestos
17.06.05* D5 4.78 1,321 3.50 1,097 0.00 0.00 2.04 842 8.74 2,568 0.00 0.00 5.22 1,925 0.00 0.00 0.00 0.00 0.00 0.00 0.00 0.00 0.00 0.00
Packaging containing
residues of or contaminated by
dangerous substances
15.01.10* D10 0.64 250 0.93 521 1.20 631 2.41 1,268 0.00 0.00 3.14 1,982 0.88 449 3.39 1,710 0.00 0.00 3.85 1,996 3.30 1,913 0.00 0.00
Spent catalysts
contaminated with dangerous substances
16.08.07* D10 0.00 0.00 0.00 0.00 0.00 0.00 0.00 0.00 0.00 0.00 16 8,393 0.00 0.00 0.00 0.00 0.00 0.00 0.35 181 0.00 0.00 0.00 0.00
Absorbents, filter
materials (including oil filters not otherwise specified), wiping cloths,
protective clothing contaminated with
dangerous substances
15.02.02* D10 0.00 0.00 0.19 57 0.60 185 0.61 326 0.00 0.00 0.80 328 4.07 1,750 1.12 317 0.00 0.00 2.50 743 5.17 1,720 0.00 0.00
Organic wastes containing dangerous
substances
16.03.05* D10 0.00 0.00 13 6,436 0.00 0.00 0.00 0.00 0.00 0.00 0.80 505 0.00 0.00 0.00 0.00 0.00 0.00 0.00 0.00 0.00 0.00 0.00 0.00
Sludges from on-site effluent treatment
containing dangerous substances
05.01.09* D10 0.00 0.00 0.00 0.00 9.00 4,613 0.00 0.00 0.00 0.00 0.00 0.00 0.00 0.00 0.00 0.00 0.00 0.00 0.00 0.00 0.00 0.00 0.00 0.00
Linings and refractories
from non-metallurgical processes containing dangerous substances
16.11.05* D10 0.00 0.00 0.00 0.00 0.80 425 0.80 424 0.00 0.00 0.00 0.00 0.00 0.00 0.00 0.00 0.00 0.00 0.00 0.00 0.00 0.00 0.00 0.00
Appendix
302
Table N-2. Continued (1) Hazardous Waste generated in the Refinery according to EWC codes and off-site costs in 2013
Jan Feb Mar Apr May Jun Jul Aug Sep Oct Nov Dec
Waste description EWC
codes
Disposal
Recycling codes
Amount Costs Amount Costs Amount Costs Amount Costs Amount Costs Amount Costs Amount Costs Amount Costs Amount Costs Amount Costs Amount Costs Amount Costs
(t) (£) (t) (£) (t) (£) (t) (£) (t) (£) (t) (£) (t) (£) (t) (£) (t) (£) (t) (£) (t) (£) (t) (£)
Grease and oil mixture
from oil/water separation containing
only edible oil and fats
19.08.09* D10 0.00 0.00 0.00 0.00 1.22 2,771 0.00 0.00 0.00 0.00 0.00 0.00 0.00 0.00 0.00 0.00 0.00 0.00 0.00 0.00 0.00 0.00 0.00 0.00
Oil fly ash and boiler dust
10.01.04* D10 0.00 0.00 0.00 0.00 0.00 0.00 0.00 0.00 0.00 0.00 0.00 0.00 1.20 612 0.00 0.00 0.00 0.00 0.00 0.00 0.00 0.00 0.00 0.00
Waste paint and
varnish containing organic solvents or
other dangerous substances
08.01.11* D10 0.00 0.00 0.00 0.00 0.00 0.00 0.00 0.00 0.00 0.00 0.00 0.00 0.00 0.00 1.00 504 0.00 0.00 0.00 0.00 0.00 0.00 0.00 0.00
Waste paint and
varnish containing organic solvents or
other dangerous substances
08.01.11* D10 0.00 0.00 0.92 470 0.00 0.00 0.00 0.00 0.00 0.00 0.00 0.00 0.00 0.00 0.00 0.00 0.00 0.00 0.00 0.00 0.00 0.00 0.00 0.00
Laboratory chemicals, consisting of or containing dangerous
substances, including mixtures of laboratory
chemicals
16.05.06* D10 0.00 0.00 0.00 0.00 0.50 263 0.00 0.00 0.00 0.00 0.00 0.00 0.00 0.00 0.00 0.00 0.00 0.00 0.00 0.00 0.20 98 0.00 0.00
Gases in pressure containers (including halons) containing
dangerous substances
16.05.04* D10 0.00 0.00 0.00 0.00 0.00 0.00 0.00 0.00 0.00 0.00 0.00 0.00 0.00 0.00 0.00 0.00 0.00 0.00 0.00 0.00 0.55 283 0.00 0.00
Other tars 05.01.08* D10 0.00 0.00 0.00 0.00 0.40 210 0.00 0.00 0.00 0.00 0.00 0.00 0.00 0.00 0.00 0.00 0.00 0.00 0.00 0.00 0.00 0.00 0.00 0.00
Spent activated carbon from flue-gas treatment
19.01.10* D10 0.00 0.00 0.00 0.00 0.00 0.00 0.00 0.00 0.00 0.00 0.00 0.00 0.40 204 0.00 0.00 0.00 0.00 0.00 0.00 0.00 0.00 0.00 0.00
Sludges from paint or varnish containing
organic solvents or other dangerous
substances
08.01.11* D10 0.00 0.00 0.00 0.00 0.00 0.00 0.00 0.00 0.00 0.00 0.00 0.00 0.00 0.00 0.00 0.00 0.00 0.00 0.00 0.00 0.20 98 0.00 0.00
Waste adhesives and sealants containing organic solvents or
other dangerous substances
08.04.09* D10 0.00 0.00 0.00 0.00 0.20 106 0.00 0.00 0.00 0.00 0.00 0.00 0.00 0.00 0.00 0.00 0.00 0.00 0.00 0.00 0.00 0.00 0.00 0.00
Aqueous sludges
containing adhesives or sealants containing organic solvents or
other dangerous substances
08.04.13* D10 0.00 0.00 0.00 0.00 0.00 0.00 0.00 0.00 0.00 0.00 0.00 0.00 0.00 0.00 0.10 50 0.00 0.00 0.00 0.00 0.00 0.00 0.00 0.00
Total HW Disposed 1,682 126,363 1,370 137,594 1,580 169,704 1,349 152,536 1,616 170,994 1,940 241,637 1,920 162,681 1,809 129,284 1,241 93,326 1,079 109,967 1,028 85,646 984 65,471
Appendix
303
Table N-2. Continued (2) Hazardous Waste generated in the Refinery according to EWC codes and off-site costs in 2013
Jan Feb Mar Apr May Jun Jul Aug Sep Oct Nov Dec
Waste
description
EWC
codes
Disposal
Recycling codes
Amoun
t Costs
Amoun
t Costs
Amoun
t Costs
Amoun
t Costs
Amoun
t Costs
Amoun
t Costs
Amoun
t Costs
Amoun
t Costs
Amoun
t Costs
Amoun
t Costs
Amoun
t Costs
Amoun
t Costs
(t) (£) (t) (£) (t) (£) (t) (£) (t) (£) (t) (£) (t) (£) (t) (£) (t) (£) (t) (£) (t) (£) (t) (£)
Soil and stones
containing dangerous
substances
17.05.03*
R3 0.00 0.00 0.00 0.00 78 15,067 113 25,194 152 29,776 59 10,751 0.00 0.00 0.00 0.00 0.00 0.00 0.00 0.00 0.00 0.00 0.00 0.00
Spent filter clays 05.01.15
* R5 0.00 0.00 0.00 0.00 0.00 0.00 0.00 0.00 0.00 0.00 0.00 0.00 0.00 0.00 27 5,225 88 17,438 0.00 0.00 0.00 0.00 0.00 0.00
Soil and stones
containing dangerous substances
17.05.03*
R11 0.00 0.00 0.00 0.00 0.00 0.00 0.00 0.00 0.00 0.00 0.00 0.00 0.00 0.00 0.00 0.00 0.00 0.00 0.00 0.00 54 10,781 0.00 0.00
Spent catalysts contaminated with dangerous
substances
16.08.07*
R5 0.00 0.00 0.00 0.00 0.00 0.00 0.00 0.00 0.00 0.00 0.00 0.00 0.00 0.00 0.00 0.00 0.00 0.00 46 12,584 0.00 0.00 0.00 0.00
Waste blasting
materials containing
dangerous substances
12.01.16
* R5 0.00 0.00 0.00 0.00 0.00 0.00 0.00 0.00 0.00 0.00 0.00 0.00 0.00 0.00 0.00 0.00 0.00 0.00 0.00 0.00 0.00 0.00 26 4,794
Oil spills 05.01.05
* R3 0.00 0.00 0.00 0.00 0.00 0.00 0.00 0.00 0.00 0.00 0.00 0.00 0.00 0.00 26 4,964 0.00 0.00 0.00 0.00 0.00 0.00 0.00 0.00
Discarded equipment containing
chlorofluorocarbons, HCFC, HFC
16.02.11
* R11 2.84 374 0.00 0.00 0.00 0.00 0.00 0.00 0.00 0.00 0.00 0.00 2.70 329 0.00 0.00 0.00 0.00 0.00 0.00 1.18 144 0.00 0.00
Lead batteries 16.06.01
* R5 0.00 0.00 0.00 0.00 0.00 0.00 0.00 0.00 0.00 0.00 0.00 0.00 0.00 0.00 0.00 0.00 0.50 146 0.00 0.00 0.00 0.00 0.00 0.00
Ni-Cd batteries 16.06.02
* R5 0.00 0.00 0.00 0.00 0.00 0.00 0.00 0.00 0.00 0.00 0.00 0.00 0.00 0.00 0.00 0.00 0.50 146 0.00 0.00 0.00 0.00 0.00 0.00
Fluorescent tubes and other mercury-containing waste
20.01.21*
R5 0.00 0.00 0.00 0.00 0.00 0.00 0.10 800 0.00 0.00 0.00 0.00 0.00 0.00 0.00 0.00 0.10 717 0.00 0.00 0.00 0.00 0.00 0.00
Total HW Recycled
2.84 374 0.00 0.00 78 15,067 113 25,994 152 29,776 59 10,751 2.70 329 54 10,189 89 18,446 46 12,584 55
10,924 26 4,794
Total HW 1,685
126,736 1,370
137,594 1,658
184,771 1,463
178,529 1,768
200,769 1,999
252,389 1,923
163,010 1,863
139,473 1,331
111,77
2 1,125
122,551 1,083
96,571 1,010
70,265
Appendix
304
Table N-3. Non-Hazardous Waste generated in the Refinery and off-site costs in 2013 according to EWC codes
Jan Feb Mar Apr May Jun Jul Aug Sep Oct Nov Dec
Waste description EWC codes
Disposal Recycling
codes
Amount Costs Amount Costs Amount Costs Amount Costs Amount Costs Amount Costs Amount Costs Amount Costs Amount Costs Amount Costs Amount Costs Amount Costs
(t) (£) (t) (£) (t) (£) (t) (£) (t) (£) (t) (£) (t) (£) (t) (£) (t) (£) (t) (£) (t) (£) (t) (£)
Non-Hazardous Waste (NHW)
Mixed municipal waste 20.03.01 D5 19 1,587 12 1,028 11 930 11 1,013 12 1,091 9.62 819 13 1,082 16 1,340 12 1,049 15 1,265 7.40 630 12 993
Bottom ash, slag and boiler dust (excluding boiler dust mentioned in 10.01.04*)
10.01.01 D5 0.00 0.00 0.00 0.00 0.00 0.00 0.00 0.00 0.00 0.00 0.00 0.00 0.00 0.00 0.00 0.00 0.00 0.00 0.00 0.00 0.00 0.00 16 3,818
Insulation materials other than those mentioned in 17.06.01* and 17.06.03*
17.06.04 D5 0.00 0.00 0.00 0.00 0.00 0.00 0.00 0.00 0.00 0.00 0.00 0.00 0.00 0.00 0.00 0.00 2.98 117 6.34 249 3.44 293 0.00 0.00
Lagging 17.06.04 D5 0.00 0.00 0.00 0.00 0.00 0.00 0.00 0.00 0.00 0.00 3.22 274 0.00 0.00 0.00 0.00 0.00 0.00 0.00 0.00 0.00 0.00 2.94 250
Sulphur-containing wastes from petroleum desulphurisation
05.01.16 D10 0.00 0.00 0.00 0.00 0.00 0.00 0.00 0.00 0.00 0.00 0.00 0.00 0.00 0.00 0.00 0.00 0.00 0.00 0.80 415 0.00 0.00 0.00 0.00
Spent fluid catalytic cracking catalysts (except 16.08.07*)
16.08.04 D10 0.00 0.00 0.00 0.00 0.40 210 0.00 0.00 0.00 0.00 0.00 0.00 0.00 0.00 0.00 0.00 0.00 0.00 0.00 0.00 0.00 0.00 0.00 0.00
Total NHW Disposed 19 1,587 12 1,028 11 1,141 11 1,013 12 1,091 13 1,093 13 1,082 16 1,340 15 1,166 22 1,929 11 923 31 5,062
Appendix
305
Table N-3. Continued (1) Non-Hazardous Waste generated in the Refinery and off-site costs in 2013 according to EWC codes
Jan Feb Mar Apr May Jun Jul Aug Sep Oct Nov Dec
Waste description EWC codes
Disposal Recycling
codes
Amount Costs Amount Costs Amount Costs Amount Costs Amount Costs Amount Costs Amount Costs Amount Costs Amount Costs Amount Costs Amount Costs Amount Costs
(t) (£) (t) (£) (t) (£) (t) (£) (t) (£) (t) (£) (t) (£) (t) (£) (t) (£) (t) (£) (t) (£) (t) (£)
Spent fluid catalytic cracking catalysts (except 16.08.07*)
16.08.04 R5 303 0.00 241 0.00 178 0.00 277 0.00 299 0.00 306 0.00 315 0.00 245 869 204 0.00 248 3,282 245 0.00
0.00
Mixed municipal waste 20.03.01 R11 56 4,762 36 3,083 33 2,791 34 3,039 37 3,274 29 2,457 40 3,246 47 4,019 37 3,147 45 3,796 22 1,890 35 2,980
Spent fluid catalytic cracking catalysts (except 16.08.07*) (not from FCCU)
16.08.04 R5 17 4,498 17 4,421 18 4,421 0.00 0.00 13 3,647 0.00 0.00 0.00 0.00 31 8,180 0.00 0.00 0.00 0.00 15 4,112 0.00 0.00
Wood other than those mentioned in 20.01.37*
20.01.38 R3 25 3,007 4.46 335 14 1,023 4.24 545 0.00 219 0.00 0.00 0.00 0.00 0.00 0.00 0.00 0.00 6.50 603 5.66 582 5.18 571
Gypsum-based construction materials other than those mentioned in 17.08.01*
17.08.02 R5 0.00 0.00 0.00 0.00 0.00 0.00 15 1,382 0.00 0.00 0.00 0.00 0.00 0.00 0.00 0.00 0.00 0.00 0.00 0.00 0.00 0.00 0.00 0.00
Paper and cardboard 20.01.01 R3 0.00 0.00 0.00 0.00 0.00 0.00 1.90 51 6.52 103 0.00 0.00 0.00 0.00 1.56 - 16.02 0.00 0.00 0.00 0.00 1.88 - 19.31 0.00 0.00
End-of-life tyres 16.01.03 R3 6.50 2,020 0.00 0.00 0.00 0.00 0.00 0.00 0.00 0.00 0.00 0.00 0.00 0.00 0.00 0.00 0.00 0.00 0.00 0.00 0.00 0.00 0.00 0.00
Plastic and rubber 19.12.04 R11 0.00 0.00 0.00 0.00 0.00 0.00 0.00 0.00 2.58 228 0.00 0.00 0.00 0.00 0.00 0.00 1.28 109 0.00 0.00 0.00 0.00 0.00 0.00
Spent catalysts containing gold, silver, rhenium, rhodium, palladium, iridium or platinum (except 16.08.07*)
16.08.01 R5 0.00 0.00 0.00 0.00 0.00 0.00 0.00 0.00 0.00 0.00 0.00 0.00 0.00 0.00 0.00 0.00 0.00 0.00 2.82 767 0.00 0.00 0.00 0.00
Waste printing tonner other than those mentioned in 08.03.17*
08.03.18 R3 0.00 0.00 0.00 0.00 0.00 0.00 0.24 95 0.00 0.00 0.00 0.00 0.00 0.00 0.00 0.00 0.99 362 0.00 0.00 0.00 0.00 0.00 0.00
Plastics 20.01.39 R11 0.00 0.00 0.00 0.00 0.00 0.00 0.00 0.00 0.00 0.00 0.90 86 0.00 0.00 0.00 0.00 0.00 0.00 0.00 0.00 0.00 0.00 0.00 0.00
Insulation materials other than those mentioned in 17.06.01* and 17.06.03*
17.06.04 R5 0.34 150 0.00 0.00 0.00 0.00 0.00 0.00 0.00 0.00 0.00 0.00 0.00 0.00 0.00 0.00 0.00 0.00 0.00 0.00 0.00 0.00 0.00 0.00
Gases in pressure containers other than those mentioned in 16.05.04
16.05.05 R5 0.00 0.00 0.00 0.00 0.00 0.00 0.00 0.00 0.00 0.00 0.00 0.00 0.00 0.00 0.00 0.00 0.03 225 0.00 0.00 0.00 0.00 0.00 0.00
Total NHW Recycled 408 14,438 298 7,839 242 8,235 333 5,112 358 7,470 336 2,542 355 3,246 325 13,052 244 3,843 302 8,449 290 6,565 40 3,551
Total NHW 426 16,025 310 8,867 254 9,376 344 6,124 371 8,562 349 3,635 368 4,328 340 14,392 259 5,009 324 10,377 301 7,488 71 8,612
Appendix
306
Table N-4. Off-site disposal and recycling facilities the Refinery used in 2013 to treat its waste
Amount Costs
Treatment site Location Treatment method Code (t) (£)
Atlantic Recycling Cardiff Recycling/reclamation of other inorganic materials R5 15 1,382
Augean Soil Washing Facility Teesside, Middlesbrough
Recycling/reclamation of organic substances which are not used as solvents (including composting and other biological transformation processes) R3 26 4,964
Specially engineered landfill (e.g. placement into lined discrete cells which are capped and isolated from one another and the environment, etc) D5 16 3,818
Use of wastes obtained from any of the operations numbered R1 to R10 R11 54 10,781
Candles Telford, Shropshire Specially engineered landfill (e.g. placement into lined discrete cells which are capped and isolated from one another and the environment, etc) D5 24 7,753
Cardiff Waste Treatment Centre Roath Dock, Cardiff
Physico-chemical treatment not specified elsewhere which results in final compounds or mixtures which are disposed of by any of the operations numbered D1 D9 338 11,713
CWM Carmarthen, Carmarthenshire
Recycling/reclamation of organic substances which are not used as solvents (including composting and other biological transformation processes) R3 12 119
Use of wastes obtained from any of the operations numbered R1 to R10 R11 0.90 86
Ellesmere Port Incinerator Liverpool, Cheshire Incineration on land D10 752 322,630
Fawley Thermal Treatment Centre Hardley, Hythe, Southampton Incineration on land D10 132 46,161
Griffiths Pallets Swansea Recycling/reclamation of organic substances which are not used as solvents (including composting and other biological transformation processes) R3 48 5,129
LAS Recycling Lampeter, Ceredigion Recycling/reclamation of organic substances which are not used as solvents (including composting and other biological transformation processes) R3 6.50 2,020
Plasmet Stafford, Staffordshire Recycling/reclamation of other inorganic materials R5 316 74,238
Port Clarence Soil Washing Facility Stockton-on-Tees
Recycling/reclamation of organic substances which are not used as solvents (including composting and other biological transformation processes) R3 402 80,788
Specially engineered landfill (e.g. placement into lined discrete cells which are capped and isolated from one another and the environment, etc) D5 100 18,584
Prometimpex Germany Recycling/reclamation of other inorganic materials R5 2,845 0.00
Rockwool Pencoed, Bridgend Recycling/reclamation of other inorganic materials R5 0.34 150
SIMS metal management Llanelli, Camarthenshire
Use of wastes obtained from any of the operations numbered R1 to R10 R11 6.72 846
Recycling/reclamation of metals and metal compounds R4 1,866 - 364,489
TBS Haverfordwest, Pembrokeshire
Recycling/reclamation of organic substances which are not used as solvents (including composting and other biological transformation processes) R3 17 1,756
Specially engineered landfill (e.g. placement into lined discrete cells which are capped and isolated from one another and the environment, etc) D5 169 14,011
Use of wastes obtained from any of the operations numbered R1 to R10 R11 455 38,822
VES Empire Works Aldridge, West Midlands
Recycling/reclamation of organic substances which are not used as solvents (including composting and other biological transformation processes) R3 1.23 456
Recycling/reclamation of other inorganic materials R5 1.23 2,033
VES Lower Bank View Liverpool, Cheshire Physico-chemical treatment not specified elsewhere which results in final compounds or mixtures which are disposed of by any of the operations numbered D1 D9 16,089 1,165,453
VES Norwood secondary liquid fuel blending facility Sheffield, Yorkshire Physico-chemical treatment not specified elsewhere which results in final compounds or mixtures which are disposed of by any of the operations numbered D1 D9 164 73,533
Appendix
307
Appendix O. Detailed metals production and rebate costs in 2013 of Valero
Refinery, Pembroke
Table O-1 presents the detailed amount and rebate costs of metals produced by the
Refinery in 2013.
Appendix
308
Table O-1. Detailed Refinery metals production and rebate costs in 2013
Jan Feb Mar Apr May Jun Jul Aug Sep Oct Nov Dec
Amount Costs Amount Costs Amount Costs Amount Costs Amount Costs Amount Costs Amount Costs Amount Costs Amount Costs Amount Costs Amount Costs Amount Costs
(t) (£) (t) (£) (t) (£) (t) (£) (t) (£) (t) (£) (t) (£) (t) (£) (t) (£) (t) (£) (t) (£) (t) (£)
Ferrous
Carbon steel 148 19,854 279 36,432 0 0 0 0 351 55,657 19 2,813 143 18,676 263 30,476 0 0 150 12,386 293 31,788 0 0
Stainless steel 13 10,787 32 27,204 0 0 10 6,940 78 21,009 1 433 0 0 0 0 0 0 0 0 8 3,952 13 0
Non-ferrous
Aluminium 0 0 0 0 0 0 0 0 0 0 0 0 0 0 0 0 3 1,776 0 0 0 0 0 0
Brass 0 0 0 0 0 0 0 0 0 0 0 0 0 0 0 0 1 1,554 0 0 27 53,800 0 0
Chrome 0 0 0 0 0 0 0 0 20 3,257 0 0 0 0 0 0 0 0 0 0 0 0 0 0
Copper 0 0 0 0 0 0 0 0 0 0 0 0 0 0 0 0 0 0 9 6,490 0 0 0 0
Hastalloy 0 0 0 0 0 0 0 0 0 0 0 0 0 0 0 0 0 0 0 0 2 7,308 0 0
Monel 0 0 0 0 0 0 0 0 0 0 2 6,132 0 0 0 0 0 0 0 0 1 5,767 0 0
Appendix
309
Appendix P. Detailed oily sludge production of England and Wales oil
refineries over 2008-2012
Table P-1 to Table P-9 detail the production in tonnes of oily sludge per type according
to EWC and disposal and recycling codes generated at England and Wales oil refineries
over 2008-2012. Although Valero Pembroke figures were already presented in
Appendices I (data over 2007-2011) and M (data of 2012) here is summarised as oily
sludge data over 2008-2012.
Appendix
310
Table P-1. Detailed oily sludge production of Essar-Stanlow Refinery over 2008-2012
2008 2009 2010 2011 2012
Waste description EWC D/R Amount Amount Amount Amount Amount
(t) (t) (t) (t) (t)
Tank bottom sludges 05.01.03* D 3.90 0.00 0.00 0.00 0.00
Tank bottom sludges 05.01.03* R 1,110 0.00 0.00 0.00 0.00
Oily sludges from maintenance operations of the plant or equipment 05.01.06* D 3.30 0.00 0.00 0.00 0.00
Oily sludges from maintenance operations of the plant or equipment 05.01.06* R 2,415 1,521 456 0.00 0.00
Sludges from on-site effluent treatment containing dangerous substances 07.01.11* R 0.00 0.00 225 0.00 0.00
Sludges from oil/water separators 13.05.02* R 2,470 0.00 0.00 0.00 0.00
Interceptor sludges 13.05.03* R 2,148 0.00 0.00 0.00 0.00
Interceptor sludges 13.05.03* D 0.00 183 0.00 0.00 0.00
Sludges from water clarification 19.09.02 R 91 0.00 0.00 0.00 0.00
Sludges from water clarification 19.09.02 D 1,306 1,182 1,028 381 377
Total 9,547 2,886 1,709 381 377
Appendix
311
Table P-2. Detailed oily sludge production of Esso-Fawley Refinery over 2008-2012
2008 2009 2010 2011 2012
Waste description EWC D/R Amount Amount Amount Amount Amount
(t) (t) (t) (t) (t)
Desalter sludges 05.01.02* D 0.00 0.00 0.00 0.00 27
Tank bottom sludges 05.01.03* D 13 246 0.00 40 57
Tank bottom sludges 05.01.03* R 0.00 358 198 0.00 0.00
Oily sludges from maintenance operations of the plant or equipment 05.01.06* R 31 231 0.00 0.00 0.00
Oily sludges from maintenance operations of the plant or equipment 05.01.06* D 78 37 124 74 70
Sludges from on-site effluent treatment containing dangerous substances 05.01.09* D 0.00 0.00 12 0.00 16
Sludges from on-site effluent treatment other than those mentioned in 05.01.09 05.01.10 D 57 0.00 0.00 0.00 0.00
Interceptor sludges 13.05.03* D 0.00 0.00 0.00 0.00 14
Sludges from physico/chemical treatment containing dangerous substances 19.02.05* R 0.00 0.00 22 0.00 0.00
Sludges from water clarification 19.09.02 D 236 0.00 0.00 0.00 0.00
Total 414 872 356 114 183
Appendix
312
Table P-3. Detailed oily sludge production of Total-Lindsey Refinery over 2008-2012
2008 2009 2010 2011 2012
Waste description EWC D/R Amount Amount Amount Amount Amount
(t) (t) (t) (t) (t)
Oily sludges from maintenance operations of the plant or equipment 05.01.06* R 0.00 0.00 0.00 75 0.00
Oily sludges from maintenance operations of the plant or equipment 05.01.06* D 0.00 0.00 0.00 0.00 255
Sludges from on-site effluent treatment containing dangerous substances 05.01.09* D 343 393 0.00 0.00 0.00
Sludges from physico/chemical treatment containing dangerous substances 19.02.05* D 0.00 698 900 0.00 761
Sludges from physico/chemical treatment containing dangerous substances 19.02.05* R 0.00 0.00 1,663 1,288 129
Total 343 1,091 2,563 1,363 1,145
Table P-4. Detailed oily sludge production of Valero-Pembroke Refinery over 2008-2012
2008 2009 2010 2011 2012
Waste description EWC D/R Amount Amount Amount Amount Amount
(t) (t) (t) (t) (t)
Desalter sludge 05.01.02* D 0.00 0.00 0.00 7.00 0.00
Tank bottom sludges 05.01.03* D 249 0.00 96 387 76
Acid Alkyl sludges 05.01.04* D 0.00 0.00 1.37 0.60 0.00
Oily sludges from maintenance operations of the plant or equipment 05.01.06* D 203 238 161 43 117
Sludges from on-site effluent treatment containing dangerous substances
(WWTP centrifuged cake, etc) 05.01.09* D 81 52 85 0.00 0.00
Sludges from physicochemical treatment containing dangerous substances 19.02.05* D 661 0.00 0.00 0.00 1,575
Total 1,193 290 343 437 1,768
Appendix
313
Table P-5. Detailed oily sludge production of Phillips 66 Ltd-Killingholme Refinery over 2008-2012
2008 2009 2010 2011 2012
Waste description EWC D/R Amount Amount Amount Amount Amount
(t) (t) (t) (t) (t)
Desalter sludges 05.01.02* D 0.00 0.00 0.00 8.80 0.10
Tank bottom sludges 05.01.03* D 11 723 618 0.00 0.60
Tank bottom sludges 05.01.03* R 550 1,253 906 471 0.00
Oily sludges from maintenance operations of the plant or equipment 05.01.06* D 25 59 41 33 79
Sludges from on-site effluent treatment containing dangerous substances 05.01.09* D 848 297 458 0.00 1.70
Sludges from on-site effluent treatment containing dangerous substances 05.01.09* R 0.00 0.00 0.00 0.00 991
Sludges from on-site effluent treatment other than those mentioned in 05 01
09* 05.01.10 R 7,871 7,000 12,282 10,737 10,520
Sludges from physico/chemical treatment containing dangerous substances 19.02.05* D 0.00 0.00 0.00 0.00 13
Total 9,305 9,332 14,305 11,249 11,605
Appendix
314
Table P-6. Detailed oily sludge production of Murco-Mildford Haven Refinery over 2008-2012
2008 2009 2010 2011 2012
Waste description EWC D/R Amount Amount Amount Amount Amount
(t) (t) (t) (t) (t)
Tank bottom sludges 05.01.03* D 0.00 0.00 58 132 0.00
Acid alkyl sludges 05.01.04* D 0.00 0.00 0.00 0.00 137
Acid alkyl sludges 05.01.04* R 0.00 112 102 127 0.00
Oily sludges from maintenance operations of the plant or equipment 05.01.06* D 0.00 319 0.00 0.00 0.00
Oily sludges from maintenance operations of the plant or equipment 05.01.06* R 3.00 96 142 0.00 165
Sludges from on-site effluent treatment containing dangerous
substances 05.01.09* D 0.00 0.00 0.00 0.00 200
Sludges and filter cakes containing dangerous substances 11.01.09* R 0.00 0.00 0.00 324 0.00
Sludges from physico/chemical treatment containing dangerous
substances 19.02.05* D 1,686 0.00 15 0.00 0.00
Sludges from physico/chemical treatment containing dangerous
substances 19.02.05* R 0.00 78 37 0.00 0.00
Total 1,689 605 354 583 502
Appendix
315
Table P-7. Detailed oily sludge production of Petrochem Carless-Harwich Refinery over 2008-2012
2008 2009 2010 2011 2012
Waste description EWC D/R Amount Amount Amount Amount Amount
(t) (t) (t) (t) (t)
Tank bottom sludges 05.01.03* D 0.00 0.00 0.00 0.00 3.00
Oily sludges from maintenance operations of the plant or equipment 05.01.06* D 0.00 0.00 0.00 0.00 0.50
Oily sludges from maintenance operations of the plant or equipment 05.01.06* R 0.00 0.00 0.00 3.02 0.00
Interceptor sludges 13.05.03* D 0.00 0.00 0.00 8.48 0.00
Interceptor sludges 13.05.03* R 3.00 0.00 0.00 0.00 0.00
Desalter sludges or emulsions 13.08.01* R 4.00 0.00 0.00 0.00 0.00
Total 7.00 0.00 0.00 12 3.50
Table P-8. Detailed oily sludge production of Eastham Ltd Refinery-Eastham over 2008-2012
2008 2009 2010 2011 2012
Waste description EWC D/R Amount Amount Amount Amount Amount
(t) (t) (t) (t) (t)
Sludges from on-site effluent treatment containing dangerous substances 05.01.09* D 184 262 191 0.00 0.00
Sludges from on-site effluent treatment containing dangerous substances 05.01.09* R 0.00 0.00 0.00 152 681
Total 184 262 191 152 681
Appendix
316
Table P-9. Detailed oily sludge production of Petroplus Coryton Refinery-Essex 2008-2012
2008 2009 2010 2011 2012
Waste description EWC D/R Amount Amount Amount Amount Amount
(t) (t) (t) (t) (t)
Tank bottom sludges 05.01.03* R 0.00 117 0.00 330 nr
Oily sludges from maintenance operations of the plant or equipment 05.01.06* D 0.00 0.00 13 4.88 nr
Sludges from on-site effluent treatment containing dangerous substances 05.01.09* D 494 1,485 766 711 nr
Sludges from physico/chemical treatment other than those mentioned in
19.02.05* 19.02.06 D 0.00 0.00 15 64 nr
Sludges from physico/chemical treatment other than those mentioned in
19.02.05* 19.02.06 R 0.00 35 0.00 0.00 nr
Total 494 1,637 794 1,109 nr
nr: not reported as shutdown