Report EUR 26088 EN 2013 Edited by Camillo De Camillis, Miguel Brandão, Alessandra Zamagni, David Pennington Towards recommendations for policy making and business strategies Sustainability assessment of future-oriented scenarios: a review of data modelling approaches in Life Cycle Assessment
Transcript
Report EUR 26088 EN
2 0 1 3
Edited by
Camillo De Camillis, Miguel Brandão, Alessandra Zamagni, David Pennington
Towards recommendations for policy making and business strategies
Sustainability assessment of future-oriented scenarios: a review of data modelling approaches in Life Cycle Assessment
European Commission
Joint Research Centre
Institute for Environment and Sustainability
Contact information
Camillo De Camillis
Address: Joint Research Centre, Via Enrico Fermi 2749, TP 270, 21027 Ispra (VA), Italy
Reproduction is authorised provided the source and the authors are acknowledged.
Printed in Italy
i
Sustainability assessment of future-oriented scenarios: a review of data modelling approaches in
Life Cycle Assessment Towards recommendations for policy making and business strategies
Cite this publication as: De Camillis, C., Brandão, M., Zamagni, A., Pennington, D. (eds.) 2013 Sustainability assessment of future-oriented scenarios: a review of data modelling approaches in Life Cycle Assessment. Towards recommendations for policy making and business strategies. European Commission, Joint Research Centre, Institute for Environment and Sustainability, Publications Office of the European Union, Luxemburg. Cite a paper in this publication as: Name of the author(s), 2013. Title of the paper, in: De Camillis, C., Brandão, M., Zamagni, A., Pennington, D. (eds.) 2013 Sustainability assessment of future-oriented scenarios: a review of data modelling approaches in Life Cycle Assessment. Towards recommendations for policy making and business strategies. European Commission, Joint Research Centre, Institute for Environment and Sustainability, Publications Office of the European Union, Luxemburg, pp. first page-last page of the paper.
ii
Acknowledgements Special thanks go to Miguel Brandão and Alessandra Zamagni for support in arranging the scientific workshop "Life cycle modelling approaches for environmental assessment of future-oriented scenarios: towards recommendations for policy making and business strategies", organised by the JRC's Sustainability Assessment Unit on December 6th and 7th 2012. Extremely useful and sometimes even illuminating were the comments and suggestions received by both the European Commission's in-house advisory board and the scientific committee. We are also very grateful for the inputs provided during the workshop by the talented scholars and scientific officers of the European Commission (EC) who joined us. Thanks also for the constructive spirit brought by all of them. Below are listed the members of the ad hoc Commission's in-house advisory board, the eminent scholars of the scientific committee, as well as the names of the workshop participants. Many thanks to all of them for their valuable contributions in reviewing this publication and for having made both the scientific workshop and the entire project a success. Last but not least, I thank my colleagues Fulvio Ardente for the minutes of the workshop, Susanna Michelle van Andel and Soledad Dominguez for their administrative support, Gianfranco Di Tullio for his technical support, and Marco Guaita for having created the web page on the workshop.
Camillo De Camillis, PhD European Commission, JRC, project leader
European Commission's in-house advisory board Leen Hordijk (JRC, Modelling Task Force, Brussels, Belgium), Constantin Ciupagea (JRC, Institute for Environment and Sustainability, Ispra, Italy), Michele Galatola (DG Environment, Brussels, Belgium), Rana Pant (JRC, Institute for Environment and Sustainability, Ispra, Italy), Carlo Lavalle (JRC, Institute for Environment and Sustainability, Ispra, Italy), Øyvind Vessia (DG Energy, Brussels, Belgium), Eckehard Rosenbaum (JRC, Institute for Environment and Sustainability, Ispra, Italy), Nathan Pelletier (JRC, Institute for Environment and Sustainability, Ispra, Italy).
Scientific Committee Roland Clift (Surrey University, UK), Bo Weidema (2.-0 LCA consultants, Denmark), Matthias Finkbeiner (TU Berlin, Germany), Jeroen B. Guinée (Leiden University, NL), Anne-Marie Tillman (Chalmers University, Sweden), Paolo Masoni (ENEA, Italy), Pierre Gerber (Food and Agriculture Organization of the United Nations, Italy), Guido Sonnemann (University of Bordeaux, France) Michael Hauschild (Technical University of Denmark), Andrea Raggi (University “G. d’Annunzio”, Italy), Christian Bauer (SIG International Services GmbH, Germany), Henry King (Uniliver, UK), Anthony Halog (University of Queensland, Australia), Maurizio Cellura (University of Palermo, Italy), Pere Fullana (ESCI, Spain), Henrik Wenzel (University of Southern Denmark).
Workshop participants Valeria Andreoni (EC, JRC, Institute for Prospective Technological Studies, Spain), Fulvio Ardente (EC, JRC, Institute for Environment and Sustainability, Italy), Matthew Brander (Ecometrica, UK), Morten Birkved (Technical University of Denmark), Miguel Brandão (International Life Cycle Academy, Spain), Maurizio Cellura (University of Palermo, Italy), Constantin Ciupagea (EC, JRC, Institute for Environment and Sustainability, Italy), Camillo De Camillis (EC, JRC, Institute for Environment and Sustainability, Italy), Thomas Dandres (CIRAIG, Canada), Tomas Ekvall (IVL Swedish Environmental Research Institute, Sweden), Rolf Frischknecht (treeze Ltd., Switzerland), Malgorzata Goralczyk (EC, JRC, Institute for Environment and Sustainability, Italy), Reinout Heijungs (Leiden University, NL), Cristobal Irazoqui (EC, DG Connect, Belgium), Nicole Kalas (Imperial College London, UK), Jan Paul Lindner (Fraunhofer IBP, Germany), Antonino Marvuglia (Public Research Centre Henri Tudor, Luxemburg), Paolo Masoni (ENEA, Italy), Richard Murphy (Imperial College London, UK), Rana Pant (EC, JRC, Institute for Environment and Sustainability, Italy), David W. Pennington (EC, JRC, Institute for Environment and Sustainability, Italy), Eckehard Rosenbaum (EC, JRC, Institute for Environment and Sustainability, Italy), Serenella Sala (EC, JRC, Institute for Environment and Sustainability, Italy), Erwin Schau (EC, JRC, Institute for Environment and Sustainability, Italy), P. Strothmann (United Nations Environment Programme, France), B. Weidema (2.-0 LCA consultants, Denmark), Alessandra Zamagni (ENEA, Italy).
iii
Disclaimer The views expressed in this publication do not necessarily reflect an official position of the European Commission. The designations employed and the presentation of the material in this publication does not imply the expression of any opinion whatsoever on the part of the UNEP/ SETAC Life Cycle Initiative concerning the legal status of any country, territory, city or area or of its authorities, or concerning delimitation of its frontiers or boundaries. Moreover, the views expressed do not necessarily represent the decision or the stated policy of the UNEP/SETAC Life Cycle Initiative, nor does citing of trade names or commercial processes constitute endorsement.
iv
List of terms and abbreviations CEDA Comprehensive environmental data archive CGE Computable general equilibrium COMEXT Eurostat reference database for external trade. It contains both recent and
historical data from the EU Member States and a significant number of third countries covering the value of exports and imports of products
CEPII Centre de recherche français dans le domaine de l’économie internationale Curr Current CPA European classification of products by activity CREEA project European project on compiling and refining environmental and economic
accounts EA Euro area EC European Commission EEIO tables Environmentally-extended input output tables EEIOA Environmentally-extended input output analysis EF Environmental footprint ELCD European reference life cycle database ENVIFOOD Protocol Environmental assessment of food and drink protocol EoL End-of-life EU-25 European Union (twenty-five member states) EU-27 European Union (twenty-seven member states) EU-28 European Union (twenty-eight member states) FAO Food and Agriculture Organization of the United Nations GTAP model Multi-region, multi-sector, computable general equilibrium model, with perfect
competition and constant returns to scale developed by GTAP (Global trade analysis project)
ILCD International reference Life Cycle Data system IO Input output tables JRC Joint Research Centre LCA Life cycle assessment LCI Life cycle inventory LCIA Life cycle impact assessment LCT Life cycle thinking NAMEA National accounting matrix including environmental accounts NACE Classification of economic activities in the EU NAICS North American industry classification system MFA Material flow analysis MRIO database Multi regional input output database MRSUIOT Multi regional Supply Use and Input Output Tables MS Member State OEF Organisation environmental footprint OEFCRs OEF category rules PCRs Product category rules PEF Product environmental footprint PEFCRs PEF category rules PME Partial market equilibrium PRODCOM Classification of goods used for statistics on industrial production in the EU Products Goods and services Pyp Previous Year Prices
v
SETAC Society of environmental toxicology and chemistry SUIOT Supply and use input-output tables SUT Supply and use (input-output) tables TIMESUT Time Series Supply and Use Tables UNEP United Nations Environment Programme WIOD World input output database
2. Scenario types and some approaches for implementation in Life Cycle Assessment (LCA)………….. 6
3. LCA data modelling…………………………………………………………………………………………………………..…….……………. 9
3.1. The attributional approach………………………………………………………………………………………….…………
9
3.2. The consequential approach………………………………………………………………………………………………….
17
3.3. The decisional approach………………………………………………………………………………………………………...
21
4. The Environmental Footprint………………………………………………………………………………..……………………………… 24
5. Bottom-up life cycle-based methodologies……………………………………………………………..………………………… 32
5.1. Macro LCA (M-LCA), the integrated general equilibrium and LCA modelling……….…………….
32
5.2. The integrated partial market equilibrium and LCA modelling (PME-LCA)…………………………
38
5.3. The LCA data modelling approach for backcasting scenario assessments………………………..
42
5.4. Life Cycle indicators for resources, products and waste management……………………………...
45
6. Top-down life cycle-based methodologies…………………………………………………………………………………..……..
49
6.1. Environmentally-extended input-output modelling and analysis……………………………………….
49
7. Life cycle modelling approaches for environmental assessment of future-oriented scenarios: towards recommendations for policy making and business strategies. Minutes of the workshop……………………………………………………………………………………………………………………………….……….
1. INTRODUCTION By Camillo De Camillis and David Pennington
Establishing policy and business long term strategies entails setting up sound environmental long term objectives and targets, assessing implications, and comparing options. For implementation in the context of sustainability assessment, two fundamental ingredients are indispensable in these processes: life cycle thinking and analysis of future-oriented scenarios. It is necessary to consider the whole life cycle of goods and services; supply chains, use, as well as end-of-life waste management. This is necessary to avoid the shifting of problems from one life cycle stage to another, from one geographic area to another and from one environmental medium or protection target to another. Equally, we have to identify plausible long term scenarios to assess the potential implications of business strategies and policy options, as well as for target setting. When it comes to combining the environmental assessment of future-oriented scenarios with life cycle thinking, the following approaches are generally used: process-based LCA and environmentally-extended input output analysis (EEIOA).
1.1. PROCESS-BASED LIFE CYCLE ASSESSMENT
Life cycle assessment (LCA) is a versatile methodology to assess the potential impacts of products along their supply chains, including during use and end-of-life waste management processes. Resources consumed and emissions are tabulated. Indicators of associated burdens are then quantified. At the general level, the methodology is internationally standardised in ISO 14040/44. Given the flexibility of its framework, LCA has been largely implemented in a variety of contexts (e.g. support to decision making, environmental labelling, etc.). Moving forward from the application approaches mentioned in ISO 14040 Annex A, the following two process-based LCA modelling approaches were reiterated in a workshop report by the UNEP/SETAC Life Cycle Initiative (2011). • Attributional approach (also called “accounting” or “descriptive approach”): “system modelling approach
in which inputs and outputs are attributed to the functional unit of a product system by linking and/or partitioning the unit processes of the system according to a normative rule” (ibid.). “The attributional approach attempts to provide information on what portion of global burdens can be associated with a product (and its life cycle). In theory, if one were to conduct attributional LCAs of all final products, one would end up with the total observed environmental burdens worldwide” (ibid.).
• Consequential approach (also called “change-oriented approach”): “system modelling approach in which activities in a product system are linked so that activities are included in the product system to the extent that they are expected to change as a consequence of a change in demand for the functional unit” (ibid.). “The consequential approach attempts to provide information on the environmental burdens that occur, directly or indirectly, as a consequence of a decision (usually represented by changes in demand for a product)” (ibid.).
In addition to these two mainstream practices, this UNEP/SETAC Life Cycle Initiative report also refers to “Decisional LCA”, which is defined as a “System modelling approach in which activities in a product system are linked to anticipated future suppliers with which one may establish financial and contractual relations even if the said suppliers are constrained” (ibid.). Both attributional and consequential approaches are, to varying extents, reflected in the LCA methodological guidelines developed by the European Commission’s Joint Research Centre (JRC) – namely, the International Reference Life Cycle Data System (ILCD) Handbook (EC 2010).
2
In particular, depending on the application context (called “situation” in the ILCD Handbook), a specific data modelling approach is recommended. The intention of these recommendations is to promote consistency across LCAs conducted within homogeneous application contexts: • Situation A guidelines are intended for micro-level decision support studies, typically for product-
related questions. The product system is modelled using an attributional approach (with some exceptions).
• Situation B guidelines provide the basis for studies intended to support decision making at a strategic
level (e.g. raw materials strategies, technology scenarios, policy options, etc). These are generally based on consequential considerations.
Building on, inter alia, the ILCD Situation A guidelines, the JRC has recently developed the Environmental Footprint guides (EC 2013a; EC 2013b). Based on the attributional approach and the need to quantify the business-as-usual situation, the Product Environmental Footprint (PEF) Guide represents the updated view of the European Commission recommended methods for LCA “Situation A” studies. The PEF Guide may also be used to assess baseline scenarios for products when considering e.g. future-oriented options. On the top of the abovementioned LCA data modelling approaches, additional modelling practices have been recently conceptualised and proposed in the scientific literature (Dandres, Gaudreault et al. 2011; Earles 2011; Guinée and Heijungs 2011; Dandres, Gaudreault et al. 2012). In the context of assessing future-orientated scenarios, open questions nevertheless remain. These include how attributional and consequential results relate and what modelling approach best suits to assess future-oriented scenarios in a policy/business strategy contexts. One of the key potential differences may be that attributional approaches tend to rely on models of a specific product supply chains, looking at differences between absolute results amongst scenarios. Consequential approaches usually assess changes at a systems level. These differences in scope and modelling approach, as well as associated assumptions, can result in differences in results when assessing future-orientated scenarios. 1.2. ENVIRONMENTALLY EXTENDED INPUT-OUTPUT ANALYSIS (EEIOA)
Environmentally extended input-output analysis (EEIOA) combines economic information from monetary input-output (IO) tables with environmental data (Leontief 1970; Miller and Blair 1985; Tukker, Huppes et al. 2006; Eurostat 2008; Miller and Blair 2009).
“Briefly stated, monetary input-output (IO) tables give insight into the value of economic transactions between different sectors in an economy, including output for exports, capital formation and final government and private consumption. They allow for calculating the added value that each sector contributes to the final output of an economy.
Such monetary IO tables can be ‘extended’ with environment-related information for each sector, such as its emissions, primary (natural) resource use, land use and other external effects per sector. Environmentally-extended input output tables (EEIO) hence represent the extension of IO tables to environmental information. EEIO tables and models are based on a comprehensive accounting framework covering all economic activities. EEIO tables bring together economic and environmental data in a consistent, related sectoral framework. EEIO models based on them allow for analysing such data via a great variety of cross-sections of the economic system.
The same framework can be used to add other information, for example related to the third pillar of sustainability, regarding social aspects, such as the number and quality of jobs per sector. EEIO tables can be integrated in broader models, such as computable general equilibrium (CGE) models” (Tukker, Huppes et al. 2006). Again, adopting a different modelling approach, scope and assumptions, the results can differ from those of process-based LCAs. These differences were qualitatively analysed in e.g. Reimann, Finkbeiner et al. (2010).
3
1.3. GOALS
Given the proliferation of life cycle thinking-based modelling approaches and the necessity to assess future-orientated scenarios, this review aims at answering the following questions:
• Where do we stand in defining and framing life cycle thinking-based approaches and related modelling approaches? What are the key features of modelling approaches? How and to what extent do they differ between each other? How mature are they?
• What questions are modelling approaches able to answer? o Which approaches are suited to identify hot spots along product life cycles over time? o How can life cycle data modelling approaches be combined with scenario analysis? How to
assess and cross-compare the environmental implications relative to the enforcement of alternative policy options?
o How to assess and compare the environmental implications of long-term business strategies? • To what extent are current modeling approaches able to capture indirect effects and rebounds? • To what extent are different methods practical in current practice? This review is also in support of the following questions: • What is the relationship between using attibutional principles to assess future-orientated scenarios
versus using consequential methods? Is it just a question of absolute vs. change-orientated? • How can Environmental Footprint methodologies best be used to assess future-oriented scenarios? What
is the relationship with consequential modelling results?
This review represents a stepping stone towards recommendations for environmental assessments of future-oriented scenarios in the context of policy making and business strategies. The principal aim of this work is to clearly highlight the key features of life cycle thinking-based modelling approaches to best feed the process to come to such recommendations. No conclusion is thus drawn on the actual appropriativeness of any modelling approach in any specific decision making context.
1.4. METHOD
To have the broadest overview of life cycle thinking-based modelling approaches, an in-depth literature search has been conducted in 2012 by consulting:
• Search engines and scientific databases such as e.g. ScienceDirect, Google Scholar and Scopus; • The proceedings of a number of international conferences and meetings on LCA (e.g. SETAC, LCM,
LCA Food, EcoBalance); • The websites of international partnership initiatives on LCA and footprinting standards (e.g.
UNEP/SETAC Life Cycle Initiative, Product Carbon Footprint World Forum, ISO, US Environmental Protection Agency, World Resource Institute, European Food Sustainable Consumption and Production Round Table, FAO-led Partnership on environmental benchmarking of livestock supply chains, the Sustainability Consortium);
Several modelling practices were found in the literature. To best analyse them also in relation to objectives of this review, how to best address quality issues for future-oriented assessment was discussed. The technical features of modelling approaches were subsequently identified starting from the identification of the needs of policy makers and businesses when setting study objectives to take decisions. To this end, useful were e.g. the outcomes of the seminar jointly arranged in September 2012 by the European Commission's Joint Research Centre (JRC) and Eurostat on the scientific support to EU decision making1.
Once indentified such needs, a number of technical features for modelling approaches were detected and incorporated in a template in the form of characterization criteria. This template was then submitted for compilation to selected experienced researchers holding track record publications in the field. These researchers were asked to fill in the template fields following the sole reference guidelines on each modelling practice, whereas these documents were available. Hence, the contents of the compiled templates (chapters 3 to 6 of this report) do not necessarily reflect the author view on the approach
1 For more information, visit the following web page: http://ipsc.jrc.ec.europa.eu/index.php/Jobs/174/0/
4
analysed. To help the readers of this work better understand the features of each modelling approach, we provide in Annex B a glossary2 including a list of key terms and definitions. On the basis of the compiled templates, a scientific workshop titled "Life cycle modelling approaches for environmental assessment of future-oriented scenarios: towards recommendations for policy making and business strategies" was arranged by the JRC on December 6th and 7th 2012. To this end, both an in-house European Commission's advisory board and a scientific committee were set up and consulted. A number of speakers were invited by the JRC and a broad participation of high quality scholars was ensured in this way. See Annex A for detail on the workshop agenda. Most of the slideshows presented in the workshop are available on the website of JRC's Sustainable Assessment Unit3.
After the workshop, the minutes of the workshop along with the draft of this publication were submitted for review to the in-house European Commission's advisory board and a scientific committee. After having addressed the requests for changes submitted during the six week consultation period, the revised minutes of the workshop were included in this publication as chapter 7. The additional remarks to the minutes are in chapter 8. These remarks were submitted by either those members of the advisory boards who could not make to join the workshop or by those who wanted to share further thoughts on top of those already captured in chapter 7. Workshop participants as well as members of the advisory board and scientific committee were not invited to further comment on this publication after the consultation period. For this reason, the additional remarks were kept separate from the minutes and published in chapter 8. This review also includes the analysis of the state of the art on scenario types and mainstream approaches for implementation in LCA. See chapter 2 for more detail. REFERENCES Dandres, T., C. Gaudreault, et al. (2011) Assessing non-marginal variations with consequential LCA:
Application to European energy sector. Renewable and Sustainable Energy Reviews, 15(6), 3121-3132.
Dandres, T., C. Gaudreault, et al. (2012) Macroanalysis of the economic and environmental impacts of a 2005-2025 European Union bioenergy policy using the GTAP model and life cycle assessment. Renewable and Sustainable Energy Reviews 16(2), 1180-1192.
Earles, J. M. (2011) LCA and Forest Biorefining: Environmental Assessment of a Modified OSB Mill and an Integrated Partial Equilibrium Framework for Policy Analysis. Forest Resources. Orono, The University of Maine.
EC (2010) The International Reference Life Cycle Data System (ILCD) Handbook - General guide for Life Cycle Assessment - Detailed guidance. European Commission, Joint Research Centre. Publications office of the European Union, Luxemburg.
EC (2013a) Organisation Environmental Footprint (OEF) Guide. European Commission (EC), Annex III to the Communication from the Commission to the European Parliament and the Council, Building the Single Market for Green Products Facilitating better information on the environmental performance of products and organisations. COM(2013) 196 final. Brussels, 9.4.2013.
EC (2013b) Product Environmental Footprint (PEF) Guide. European Commission (EC), Annex II to the Communication from the Commission to the European Parliament and the Council, Building the Single Market for Green Products Facilitating better information on the environmental performance of products and organisations. COM(2013) 196 final. Brussels, 9.4.2013.
Eurostat (2008) Eurostat manual of supply, and Input-Output tables. Luxemburg, Office for Official Publications of the European Communities.
Guinée, J. B. and R. Heijungs (2011) Life Cycle Sustainability Analysis. Journal of Industrial Ecology, 15(5), 656-658.
2 The glossary is not formally endorsed by the European Commission.
Leontief, W. (1970) Environmental Repercussions and the Economic Structure: An Input-Output Approach. The Review of Economics and Statistics, 52(3), 262-271.
Miller, R. E. and P. D. Blair (1985) Input-Output Analysis - Foundations and Extensions. Englewood Cliffs, NJ, USA, Prentice-Hall.
Miller, R. E. and P. D. Blair (2009) Input-Output Analysis - Foundations and Extensions. Cambridge, UK, Cambridge University Press.
Reimann, K., Finkbeiner, M., Horwath, A., and Y. Matsuno (2010) Evaluation of environmental life cycle approaches for policy and decision making support in micro and macro level applications. European Commission, Joint Research Centre, Publications office of the European Union, Luxemburg.
Tukker, A., G. Huppes, et al., Eds. (2006) Environmentally extended input-output tables and models for Europe, Publications office of the European Union, Luxemburg.
UNEP/SETAC Life Cycle Initiative (2011) Global Guidance Principles for Life Cycle Assessment Databases - A Basis for Greener Processes and Products. Paris, United Nations Environment Programme.
6
2. SCENARIO TYPES AND SOME APPROACHES FOR IMPLEMENTATION IN LIFE CYCLE ASSESSMENT (LCA)
Tomas Ekvall
IVL Swedish Environmental Research Institute, Gothenburg, Sweden
Abstract This paper discusses what types of questions can be posed about the future and how future-oriented life cycle assessment (LCA) can help responding to them. Predictive scenarios investigate what is likely to happen in the short-to-medium term. To better reflect the near-to-medium term future, LCA can use predictions of environmental performance of the most important technologies and subsystems. Explorative scenarios describe what might happen in the medium-to-long term. An LCA can assess the environmental robustness of technologies in the medium-to-long term by placing them in background systems that are consistent with different external scenarios. Backcasting illuminates what ought to happen in the long term, including changes in societal, economic and/or technological structures. An LCA can contribute to the assessment of the environmental sustainability of a technology by placing it in a background system that is consistent with a sustainable backcasting scenario.
2.1. INTRODUCTION
Höjer et al. (2008) argue that future-oriented life cycle assessment (LCA) is highly relevant since all decisions that are influenced by LCA results take effect after the LCA has been carried through. They point out the fact that most LCAs are still based on input data that where measured several years before the LCA was initiated. Ekvall et al. (2007) indicate that this is an important limitation when the goal of the LCA is to contribute to decisions on strategies and on investments in equipment with a long service life. They argue that a technology that is appropriate today might be incompatible with the long-term sustainability of the society. Nearly a decade ago, a working group within the Society of Environmental Toxicology and Chemistry (SETAC) described and discussed several techniques that potentially could be used for generating future-oriented input data to LCA (Weidema et al. 2004). Börjeson et al. (2006) presented a typology of scenarios, and Höjer et al. (2008) discussed how the different scenario types can be used in LCA. This paper builds and expands on Höjer et al. (2008). It discusses what types of questions can reasonably be posed about the future and how future-oriented LCA can help responding to them.
2.2. QUESTIONS ABOUT THE FUTURE
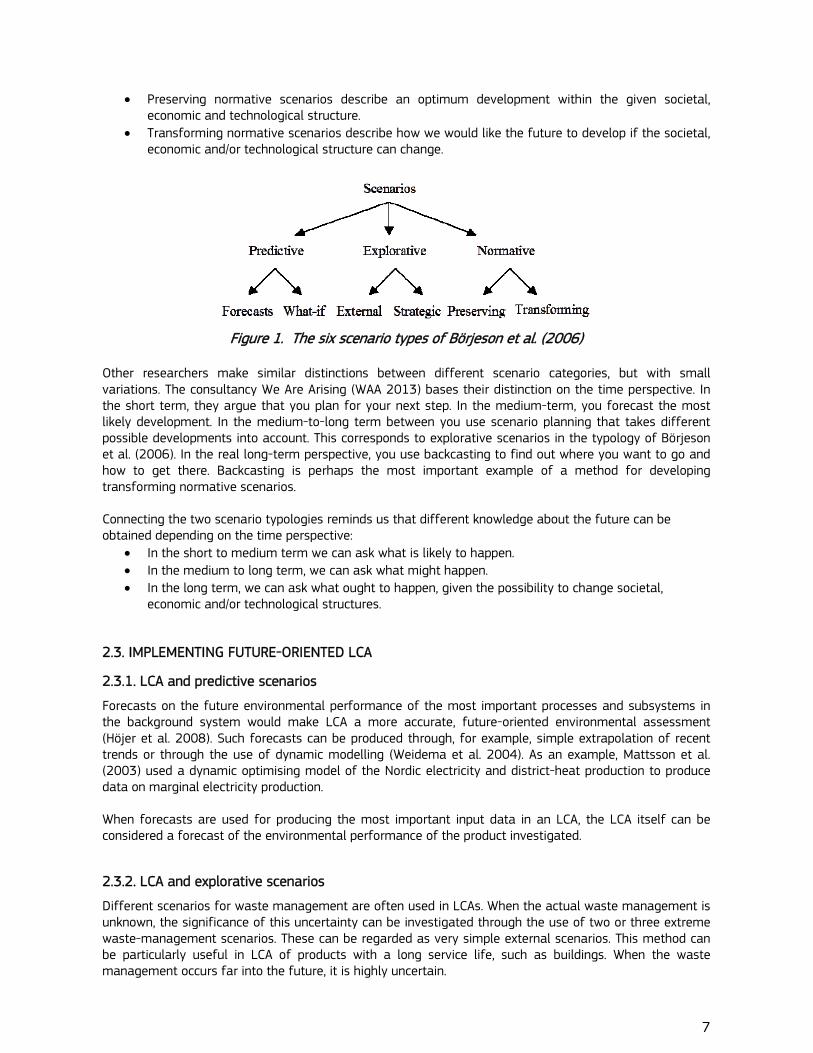
Börjeson et al. (2006) distinguish between predictive, explorative, and normative scenarios. They are defined by the questions they are designed to respond to and, hence, by which knowledge they are designed to generate. Predictive scenarios respond to questions regarding what will happen in the future. Explorative scenarios respond to questions regarding what might happen. Normative scenario respond to questions regarding what ought to happen. For each of the three scenario categories, Börjeson et al. (2006) present two scenario types (see Figure 1), each responding to a different kind of question about the future:
• Forecasts investigate what is likely to happen in the future. • What-if scenarios investigate what is likely to happen in the future on the condition of a specific,
important near-future event. • External scenarios investigate how external factors, i.e. factors beyond our control, can develop. • Strategic scenarios investigate what can happen if we act in a specific way, given different external
scenarios.
7
• Preserving normative scenarios describe an optimum development within the given societal, economic and technological structure.
• Transforming normative scenarios describe how we would like the future to develop if the societal, economic and/or technological structure can change.
Figure 1. The six scenario types of Börjeson et al. (2006) Other researchers make similar distinctions between different scenario categories, but with small variations. The consultancy We Are Arising (WAA 2013) bases their distinction on the time perspective. In the short term, they argue that you plan for your next step. In the medium-term, you forecast the most likely development. In the medium-to-long term between you use scenario planning that takes different possible developments into account. This corresponds to explorative scenarios in the typology of Börjeson et al. (2006). In the real long-term perspective, you use backcasting to find out where you want to go and how to get there. Backcasting is perhaps the most important example of a method for developing transforming normative scenarios. Connecting the two scenario typologies reminds us that different knowledge about the future can be obtained depending on the time perspective:
• In the short to medium term we can ask what is likely to happen. • In the medium to long term, we can ask what might happen. • In the long term, we can ask what ought to happen, given the possibility to change societal,
economic and/or technological structures.
2.3. IMPLEMENTING FUTURE-ORIENTED LCA
2.3.1. LCA and predictive scenarios
Forecasts on the future environmental performance of the most important processes and subsystems in the background system would make LCA a more accurate, future-oriented environmental assessment (Höjer et al. 2008). Such forecasts can be produced through, for example, simple extrapolation of recent trends or through the use of dynamic modelling (Weidema et al. 2004). As an example, Mattsson et al. (2003) used a dynamic optimising model of the Nordic electricity and district-heat production to produce data on marginal electricity production. When forecasts are used for producing the most important input data in an LCA, the LCA itself can be considered a forecast of the environmental performance of the product investigated.
2.3.2. LCA and explorative scenarios
Different scenarios for waste management are often used in LCAs. When the actual waste management is unknown, the significance of this uncertainty can be investigated through the use of two or three extreme waste-management scenarios. These can be regarded as very simple external scenarios. This method can be particularly useful in LCA of products with a long service life, such as buildings. When the waste management occurs far into the future, it is highly uncertain.
8
A more demanding way to link LCA and explorative scenarios is to use full, qualitative external scenarios as basis for the development of input data to the background system. This will result in a set of external-scenario background systems, where each background system corresponds to one of the available external scenarios. The environmental performance of a process or foreground system in a specific external scenario can be investigated through an LCA where the process or foreground system is combined with the corresponding external-scenario background system. By combining them with several different external-scenario background systems, the LCA practitioner will gain knowledge on the robustness of the future environmental performance of the investigated technology or foreground system. In a comparative LCA, the environmental robustness of two or more competing processes can be compared by combining each of them with a set of external-scenario background system. Such a comparative LCA would investigate what can happen if we choose one or the other of these processes in the future. The study as a whole can be considered to be a strategic scenario analysis.
2.3.3. LCA and normative scenarios
An LCA can be part of a backcasting study. Backcasting can also provide a basis for assessing the environmental sustainability of a product, process or system through. In the latter case, a qualitative, sustainable scenario is used as basis for the development of input data to the background system. An LCA where the foreground system of the product life cycle is combined with the corresponding backcasting background system will give information on how well the product will perform environmentally in this sustainable future. The environmental sustainability of different products can be compared by combining the foreground system of each of them with the same sustainable background system. REFERENCES Börjeson L, Höjer M, Dreborg K-H, Ekvall T, Finnveden G (2006). Scenario types and techniques: Towards a
user's guide. Futures, 38, 723-739.
Ekvall T, Assefa G, Björklund A, Eriksson O, Finnveden G (2007) What life-cycle assessment does and does not do in assessments of waste management, Waste Management, 27, 989-996.
Höjer M, Ahlroth S, Dreborg K-H, Ekvall T, Finnveden G, Hjelm O, Hochschorner E, Nilsson M, Palm V (2008) Scenarios in selected tools for environmental systems analysis, Journal of Cleaner Production, 16, 1958-1970.
Mattsson N, Unger T, Ekvall T (2003). Effects of perturbations in a dynamic system – The case of Nordic power production. In: Unger T. Common energy and climate strategies for the Nordic countries – A model analysis. PhD Thesis, Chalmers University of Technology, Gothenburg, Sweden.
WAA (2013). We Are Arising. http://wearearising.org/2009/01/13/backcasting. [Accessed 1 March 2013].
Weidema B, Ekvall T, Pesonen H-L, Rebitzer G, Sonnemann GW, Spielmann M (2004). Scenarios in Life-Cycle Assessment. SETAC Press, Brussels/Pensacola.
9
3. LCA DATA MODELLING
3.1 LCA DATA MODELLING: THE ATTRIBUTIONAL APPROACH
Camillo De Camillis1, Alessandra Zamagni2, Christian Bauer3
1European Commission, DG Joint Research Centre, Institute for Environment and Sustainability (IES), Sustainability Assessment unit, Ispra, Italy 2ENEA (Agenzia nazionale per le nuove tecnologie, l’energia e lo sviluppo economico sostenibile), LCA & Ecodesign Laboratory, Bologna, Italy 3SIG Combibloc, Linnich, Germany
1. Question the approach/ methodology aims to answer (when baseline scenario is assessed)
What is the environmental impact of a certain product system at a given time (to-BaselineA)?
2. Question the approach/ methodology aims to answer (when future-oriented/alternative scenarios are assessed)
What is the environmental impact of a certain product system in a given future scenario (t1) if the product were designed or/and produced or/and consumed or/and managed differently at the end of its life?
3. Description of the data modelling approach
The attributional approach is a “system modelling approach in which inputs and outputs are attributed to the functional unit of a product system by linking and/or partitioning the unit processes of the system according to a normative rule” (UNEP/SETAC Life Cycle Initiative, 2011). The attributional LCA data modeling approach attempts to provide information on what portion of global burdens can be associated with a product (and its life cycle). In theory, if one were to conduct LCAs of all final products with attributional modelling, one would end up with the total observed environmental burdens worldwide (UNEP/SETAC Life Cycle Initiative, 2011).
4. Reference standards/guidelines
- ISO 14040:2006 - ISO 14044:2006 - UNEP/SETAC Life Cycle Initiative, Global Guidance Principles for Life Cycle Assessment databases, 2011 Guidance on LCA in view of attributional modelling in particular is also given (although only to some extent) in the Situation A guidelines of the ILCD Handbook - General Guide for Life Cycle Assessment (EC, 2010), although only to some extent
5. EU policy background
No specific EU policy explicitly refers to the attributional data modelling approach as described in the relevant ISO standards and in the Global Guidance for Life Cycle Assessment databases (UNEP/SETAC Life Cycle Initiative, 2011). However, a few life cycle assessment methodologies, which are to various extent in line with the attributional thinking, are recommended by specific policies (e.g. Annex X of the Renewable Energy Directive 2009/28/EC and the Commission Recommendation 2013/179/EU on the use of common methods to measure and communicate the life cycle environmental performance of products and organisations)
10
6. Reference principles
According to ISO 14040:2006, the following principles of LCA including attributional but also all other modeling approaches are:
- Life cycle perspective “LCA considers the entire life cycle of a product, from raw material extraction and acquisition, through energy and material production and manufacturing, to use and end of life treatment and final disposal. Through such a systematic overview and perspective, the shifting of a potential environmental burden between life cycle stages or individual processes can be identified and possibly avoided.”(ISO 14040:2006, clause 4.1.2)
- Environmental focus “LCA addresses the environmental aspects and impacts of a product system. Economic and social aspects and impacts are, typically, outside the scope of the LCA. Other tools may be combined with LCA for more extensive assessments.” (ISO 14040:2006, clause 4.1.3)
- Relative focus and functional unit “LCA is a relative approach, which is structured around a functional unit. This functional unit defines what is being studied. All subsequent analyses are then relative to that functional unit, as all inputs and outputs in the LCI and consequently the LCIA profile are related to the functional unit.” (ISO 14040:2006, clause 4.1.4)
- Iterative approach “LCA is an iterative technique. The individual phases of an LCA use results of the other phases. The iterative approach within and between the phases contributes to the comprehensiveness and consistency of the study and the reported results.” (ISO 14040:2006, clause 4.1.5)
- Transparency “Due to the inherent complexity in LCA, transparency is an important guiding principle in executing LCAs, in order to ensure a proper interpretation of the results.” (ISO 14040:2006, clause 4.1.6) - Comprehensiveness “LCA considers all attributes or aspects of natural environment, human health and resources. By considering all attributes and aspects within one study in a cross-media perspective, potential trade-offs can be identified and assessed.” (ISO 14040:2006, clause 4.1.7)
- Priority of scientific approach “Decisions within an LCA are preferably based on natural science. If this is not possible, other scientific approaches (e.g. from social and economic sciences) may be used or international conventions may be referred to. If neither a scientific basis exists nor a justification based on other scientific approaches or international conventions is possible, then, as appropriate, decisions may be based on value choices.” (ISO 14040:2006, clause 4.1.8)
7. Object /focus and scale
Product system LCA is in fact a “compilation and evaluation of the inputs, outputs and the potential environmental impacts of a product system throughout its life cycle” (ISO 14040:2006, clause 3.2) where for product system is meant a “collection of unit processes with elementary and product flows, performing one or more defined functions, and which models the life cycle of a product” (ISO 14040:2006, clause 3.28) Despite a clear focus on products, ISO standards explicitly include services.
11
According to ISO standards, in fact, products are both goods and services. The product life cycle goes beyond the product supply chain and includes consumption and product end-of-life. Product systems are assessed in terms of functional unit. Besides these product-specific full LCAs, there are also several LCAs in the scientific literature focussing on e.g. at sectorial level, on consumption patterns, etc. employing attributional modelling coupled with other techniques (e.g. environmentally extended input output analysis).
8. Functional unit 8.1 How is the functional unit framed when baseline scenario is assessed?
The functional unit is a “quantified performance of a product system for use as a reference unit” (ISO 14040:2006, clause 3.20) “The functional unit shall be consistent with the goal and scope of the study. One of the primary purposes of a functional unit is to provide a reference to which the input and output data are normalized (in a mathematical sense). Therefore the functional unit shall be clearly defined and measurable.” (ISO 14044:2006, clause 4.2.3.2)
8.2 How is the functional unit framed when future-oriented scenarios are assessed?
The same as above
9. System boundaries 9.1 How and where system boundaries are set up for modelling baseline scenario
“LCA is conducted by defining product systems as models that describe the key elements of physical systems. The system boundary defines the unit processes to be included in the system. Ideally, the product system should be modelled in such a manner that inputs and outputs at its boundary are elementary flows.” (ISO 14040:2006, clause 5.2.3) According to its definition (ISO 14040:2006, clause 3.28), all product life cycle stages should be included in the system boundaries. Yet, “the selection of the system boundary shall be consistent with the goal of the study.” (ISO 14044:2006, clause 4.2.3.3) Therefore, system boundaries such as from-cradle-to-gate, from-gate-to-gate, and from-gate-to-grave are also possible. “It is helpful to describe the system using a process flow diagram showing the unit processes and their inter-relationships”. (ISO 14044:2006, clause 4.2.3.3.2) Unit processes can be left out the system boundaries in accordance with cut-off criteria (see ISO 14044:2006, clause 4.2.3.3.3)
9.2 How and where system boundaries are set up for modelling future-oriented/alternative scenarios are assessed
Alternative scenarios can be modelled on the basis of the assumptions made by a designer/practitioner on e.g. alternative raw materials chosen, project variants, alternative production processes, consumption patterns, product end-of-life options.
Alternative scenarios are assessed through sensitivity analysis.
System boundaries are set as above.
Usually no indirect effects/rebounds captured.
12
10. Baseline scenario inventory data quality 10.1 Data typology Mainstream practice coherent with ISO 14044 and the UNEP/SETAC Life
Cycle Initiative definition on attributional modelling (see point 3):
- Process-based absolute LCI datasets (according to a strict interpretation of ISO 14044 requirements).
Notes:
- Environmentally Extended Input Output Analyses (EEIOA) (see chapter 6.1.),also follow an attributional although they prefer a top-down approach to a process-based bottom up approach..
- Sectorial data from EEIOA plugged in process-based inventories are used in hybrid process-based data modelling approaches. This data modelling approach may be used for screening purposes in process-based LCA and is particularly suitable to filling data gaps.
Data quality requirements should be specified depending on goal and scope of the study (see ISO 14044:2006, clause 4.2.3.6).
10.2 Data sources Mainstream practice coherent with the UNEP/SETAC Life Cycle Initiative definition on attributional modeling (see point 3):
- As large as possible use of high quality primary data over secondary data (e.g. databases, literature, reports).
Otherwise any, depending on application context defined in the goal and scope of the study (see ISO 14044:2006, clause 4.2.3.6).
10.3 Time-related representativeness
Mainstream practice coherent with UNEP/SETAC Life Cycle Initiative the definition on attributional modelling (see point 3):
- Retrospective. As recent as possible.
Otherwise any, depending on application context defined in the goal and scope of the study (see ISO 14044:2006, clause 4.2.3.6).
10.4 Possible geographical resolution
Mainstream practice coherent with the UNEP/SETAC Life Cycle Initiative definition on attributional modelling (see point 3):
- Primary data shall be as specific as possible (e.g. site specific) - Secondary data the more spatially-resolved possible (e.g. sub-regional, regional, national, continental, world).
Otherwise any, depending on application context defined in the goal and scope of the study (see ISO 14044:2006, clause 4.2.3.6), depending on goal and scope of the study (see ISO 14044:2006, clause 4.2.3.6)
10.5 Technology representativeness
Mainstream practice coherent with the UNEP/SETAC Life Cycle Initiative definition on attributional modelling (see point 3):
- Foreground data system: as specific and detailed as possible - Background data system: average data
Otherwise any, depending on application context defined in the goal and scope of the study (see ISO 14044:2006, clause 4.2.3.6), depending on goal and scope of the study (see ISO 14044:2006, clause 4.2.3.6)
13
10.6 Completeness Mainstream practice coherent with the UNEP/SETAC Life Cycle Initiative definition on attributional modelling (see point 3):
- As complete as possible According to the ILCD Handbook – Recommendations for Life Cycle Impact Assessment in the European Context (EC, 2011), inventory flows should cover 14 – but not limited to - different impact categories (i.e. Climate Change, Ozone Depletion, Ecotoxicity for aquatic fresh water, Human Toxicity - cancer effects, Human Toxicity – non-cancer effects, Particulate Matter/Respiratory Inorganics, Ionising Radiation – human health effects, Photochemical Ozone Formation, Acidification, Eutrophication – terrestrial, Eutrophication – aquatic, Resource Depletion – water, Resource Depletion – mineral, fossil, Land use). Considering the whole life cycle of products as well as the widest range of impact categories possible it is necessary to avoid the shifting of problems from one life cycle stage to another, from one geographic area to another and from one environmental medium or protection target to another.
10.7 Accuracy Low, if indirect effects, rebounds that can be attributed to the product are not captured and are relatively important.
10.8 Precision / uncertainty
Possible very high precision and low uncertainty, depending on data quality requirements set in the goal and scope definition phase (see ISO 14044:2006, clause 4.2) Key sources of uncertainty: life cycle inventory and characterization factors up to characterization step
11. Future-oriented scenario inventory data quality 11.1 Data typology
As for baseline
11.2 Data sources
As for baseline
11.3 Time-related representativeness
As for baseline
11.4 Possible geographical resolution
As for baseline
11.5 Technology representativeness
As for baseline
11.6 Completeness
As for baseline
11.7 Accuracy
As for baseline
11.8 Precision (uncertainty)
As for baseline On the top of that, higher uncertainty because LCI data do not capture technology breakthroughs taking place in the future. In addition, the underpinning variability of results tied to modelling scenarios (see point 18) also contribute to uncertainty.
14
12. Double counting at inventory level
Not allowed
13. Allocation procedure In accordance with ISO 14044:2006, clause 4.3.4.2, the following procedure applies:
“Step 1: Wherever possible, allocation should be avoided by 1) dividing the unit process to be allocated into two or more sub-processes and collecting the input and output data related to these sub-processes, or 2) expanding the product system to include the additional functions related to the co-products, taking into account the requirements of 4.2.3.3.
Step 2: Where allocation cannot be avoided, the inputs and outputs of the system should be partitioned between its different products or functions in a way that reflects the underlying physical relationships between them; i.e. they should reflect the way in which the inputs and outputs are changed by quantitative changes in the products or functions delivered by the system. Step 3: Where physical relationship alone cannot be established or used as the basis for allocation, the inputs should be allocated between the products and functions in a way that reflects other relationships between them. For example, input and output data might be allocated between co-products in proportion to the economic value of the products.”
From the UNEP/SETAC Life Cycle Initiative definition on attributional modelling (see point 3)) it can be deduced that: System expansion technique applies as follows: alter functional unit to include the additional function delivered by the process in question and expand the system boundaries to include this new function and its related processes.
According to the description of the approach by the UNEP/SETAC Life Cycle Initiative (see point 3), assessments refer to products available on the market in a given time period. As the aim is to come up with a snapshot of the impacts as they are, market mechanisms (e.g. substitution) are not captured as they take place over time. For this reason, the substitution technique is not allowed.
14. Crediting of avoided burden (e.g. substitution technique in product end-of-life modelling)
Generally not allowed, otherwise miscounting is possible. If crediting the avoided burden is interpreted as form of distributing burdens among product systems (so, as subdivision technique) rather than being seen as a substitution technique, there is room to acknowledge such technique in attributional modelling.
- Linear emission profiles attached to LCI datasets. - Consequences on the marked are assumed to be linear. Consumption patterns assumed to be constant over time (i.e. no substitution).. - No consequences captured at inventory level (e.g. indirect land use change, rebound effects)
16. Consistency between reference principles (see point 6.) and data modelling approach requirements
High
15
17. Impact categories and assessment methods
To be defined in the goal and scope definition phase (see ISO 14044:2006, clause 4.2). According to the ILCD Handbook – Recommendations for Life Cycle Impact Assessment in the European Context (EC 2011), an LCA should cover 14 different impact categories but not limited to climate change, ozone depletion, ecotoxicity for aquatic fresh water, human toxicity - cancer effects, human toxicity – non-cancer effects, particulate matter/respiratory Inorganics, Ionising Radiation – human health effects, photochemical ozone formation, acidification, eutrophication – terrestrial, eutrophication – aquatic, resource depletion – water, resource depletion – mineral, fossil, land use).
18. Variability of results Variability depends on methodological choices e.g. functional unit, system boundaries, allocation rules, scenario definition, impact assessment methods
19. Maturity 19.1 Development and endorsement status
Compliant with ISO 14040:2006 and ISO 14044:2006 (ISO 2006; ISO 2006) Endorsed by UNEP/SETAC Life Cycle Initiative (UNEP/SETAC Life Cycle Initiative 2011) To various extent, the approach is endorsed in the ILCD Handbook(EC 2010), and in several footprint standards and guidelines (AFNOR-ADEME 2011; BSI 2011; WRI/WBCSD 2011; EC 2013; ISO/DIS 2012)
19.2 Testing and dissemination
Very high dissemination. Data modelling approach tested through several case studies, although often not in a consistent way. Several are those published in the scientific literature
19.3 Good practices Life Cycle Inventory (LCI) datasets in the European reference Life Cycle Database (ELCD)
20. Research gaps/limitations
Allocation - How to go along the allocation procedure for co-products. - How to model the following life cycle stages in a coherent manner across product systems: virgin material extraction and product end-of-life.
Data availability Life cycle inventory data are lacking.
Impact assessment - Some impact categories lack assessment method in LCA or some of the ones available have limited relevance due to data gaps (e.g. biodiversity loss, noise, landscape disruption, toxicity, etc).
Interpretation - More efforts should be spent on sensitivity: it should become routine practice, due to the influence of choices to final LCA results.
16
REFERENCES AFNOR-ADEME (2011) BP X 30-323 General principles for an environmental communication on mass
market products. Part 0 : General principles and methodological framework, AFNOR, La Plaine Saint-Denis Cedex, France.
BSI (2011) PAS 2050:2011 - Specification for the assessment of the life cycle greenhouse gas emissions of goods and services, British Standards Institution (BSI), London, United Kingdom.
EC (2010) The International Reference Life Cycle Data System (ILCD) Handbook - General guide for Life Cycle Assessment - Detailed guidance. European Commission (EC), Joint Research Centre, Publications office of the European Union, Luxemburg.
EC (2011) The International Reference Life Cycle Data System (ILCD) Handbook - Recommendations for Life Cycle Impact Assessment in the European context. European Commission (EC), Joint Research Centre, Publications office of the European Union, Luxemburg.
EC (2013) Product Environmental Footprint (PEF) Guide. Commission Recommendation of 9 April 2013 on the use of common methods to measure and communicate the life cycle environmental performance of products and organisations
ISO (2006) ISO 14040:2006 Environmental management – Life cycle assessment – Principles and framework, The International Organization for Standardization (ISO), Geneve, Switzerland.
ISO (2006) ISO 14044:2006 Environmental management – Life cycle assessment – Requirements and guidelines, The International Organization for Standardization (ISO), Geneve, Switzerland.
ISO/DIS (2012) ISO/DIS 14067 Carbon footprint of products - Requirements and guidelines for quantification and communication [under development], The International Organization for Standardization (ISO), Geneve, Switzerland.
UNEP/SETAC Life Cycle Initiative (2011) Global Guidance Principles for LCA Databases. Paris, France, UNEP.
WRI/WBCSD (2011) GHG Protocol - Product life cycle accounting and reporting standard, World Resources Institute (WRI) and World Business Council for Sustainable Development (WBCSD), USA.
17
3.2. LCA DATA MODELLING: THE CONSEQUENTIAL APPROACH
Miguel Brandão1, Bo Weidema2
1ILCA (International Life Cycle Academy), Barcelona, Spain 22.-0 LCA consultants, Aalborg, Denmark
1. Question the approach/ methodology aims to answer (when baseline scenario is assessed)
Baseline scenario is the World as it is, now or in the future, without any action. The question that the approach aims is to answer is "what are the net impacts associated to a change (in a product system) relative to the baseline scenario, where that change does not take place?". In this way, the baseline scenario is not assessed per se.
2. Question the approach/ methodology aims to answer (when future-oriented scenarios are assessed)
The consequences of a decision relative to the “no action” baseline
3. Description of the data modelling approach
Definition: “System modelling approach in which activities in a product system are linked so that activities are included in the product system to the extent that they are expected to change as a consequence of a change in demand for the functional unit.” (UNEP/SETAC Life Cycle Initiative 2011). See more detail below.
4. Reference standards/guidelines ISO 14040, ISO 14044, ISO 14049, ILCD Handbook Situation B guidelines (EC 2010), CALCAS project guidelines on consequential LCA (Weidema et al 2009), Ecoinvent Data Quality Guidelines v3 (Weidema et al. 2013)
5. EU policy background
None
6. Reference principles Maintain mass, energy, economic and elementary balances. Model as close to reality as possible. Principles of ISO 14040 (e.g. “Priority of scientific approach: Decisions within an LCA are preferably based on natural science. If this is not possible, other scientific approaches (e.g. from social and economic sciences) may be used or international conventions may be referred to. If neither a scientific basis exists nor a justification based on other scientific approaches or international conventions is possible, then, as appropriate, decisions may be based on value choices.”
7. Object /focus and scale Any decision in any scale, time or space.
8. Functional unit 8.1 How is the functional unit framed when baseline scenario is assessed?
The obligatory product properties on the market where the product is sold – and the size depending on the size of the decision to be supported. (Weidema et al. 2004)
8.2 How is the functional unit framed when future-oriented scenarios are assessed?
Same as baseline
18
9. System boundaries
9.1 How and where system boundaries are set up for modelling baseline scenario
The whole World as it is (no system boundary)
9.2 How and where system boundaries are set up for modelling future-oriented scenarios are assessed
No system boundary (all activities affected by the decision are included, i.e. excluding constrained activities, but including first-order rebound effects)
10. Baseline scenario inventory data quality 10.1 Data typology Any unit process data available
10.2 Data sources Any
10.3 Time-related representativeness
Time of decision and its consequences
10.4 Possible geographical resolution
As detailed as possible
10.5 Technology representativeness As detailed as possible. Only affected technologies.
10.6 Completeness As complete as possible
10.7 Accuracy As high as possible
10.8 Precision / uncertainty As high precision as possible, as low uncertainty as possible. The focus is on identifying and including in the model activities that are expected to change as a result of the additional demand of a functional unit.
11. Future-oriented scenario inventory data quality 11.1 Data typology As for baseline
11.2 Data sources As for baseline
11.3 Time-related representativeness
As for baseline
11.4 Possible geographical resolution
As for baseline
11.5 Technology representativeness As for baseline
11.6 Completeness As for baseline
11.7 Accuracy As for baseline. Sources of uncertainty: As any other modelling approach. Specific modelling uncertainties included here: market trends, market delimitations, capital replacement rate, technology constraints, market constraints or elasticities.
19
11.8 Precision (uncertainty) As for baseline. There are uncertainties related to the composition of scenarios (e.g. choice of future or marginal technologies). If decisions or impacts in the future are studied, thus requiring forecasting, the uncertainty is higher than for decisions taken immediately and having more immediate impacts
12. Double counting at inventory level
Not allowed
13. Allocation procedure Combined production (i.e. variable output proportions): Subdivision according to determining physical parameters. Joint production (i.e. fixed output proportions): Substitution (moving by-product to be negative input) to reflect the avoided marginal production elsewhere in the economy. Allocation (in the sense of unit process partitioning) is not needed and not possible, since it would violate the reference principles.
14. Crediting of avoided burden (e.g. substitution technique in product end-of-life modelling)
Linear, static model. Production is determined by revenue. Producers are price-takers. Markets clear. Ceteris paribus relative to other decisions and the overall technology and productivity of the rest of society.
16. Consistency between reference principles (see point 6.) and data modelling approach requirements
Fully consistent
17. Impact categories and assessment methods
Consistent with LC impact modelling (which is consequential)
18. Variability of results
See uncertainty.
19. Maturity 19.1 Development and endorsement status
Endorsed by ISO 14040 series and ILCD Handbook (EC 2010)
19.2 Testing and dissemination Well tested in practice over the last 15 years. Examples and publications are numerous.
19.3 Good practices (max. 3 references)
- Ecoinvent database v3 (Weidema et al., 2013) - Schmidt J H and Dalgaard R (2012) - Searchinger et al. (2008)
20. Research gaps/limitations Better data on trends in volumes of markets and relative competitiveness of alternative suppliers or technologies
20
REFERENCES EC (2010) The International Reference Life Cycle Data System (ILCD) Handbook - General guide for Life
Cycle Assessment - Detailed guidance. European Commission, Joint Research Centre, Publications office of the European Union, Luxemburg.
Schmidt, J. H. and Dalgaard R. (2012) “National and farm level carbon footprint of milk - Methodology and results for Danish and Swedish milk 2005 at farm gate” & “Life cycle inventory for Danish and Swedish milk 2005 at farm gate”. Arla Foods, Aarhus, Denmark. http://www.lca-net.com/ArlaMain & http://www.lca-net.com/ArlaLCI
Searchinger, T., Heimlich, R., Houghton, R. A., Dong, F., Elobeid, A., Fabiosa, J., Tokgoz, S., Hayes, D., Yu T.-H. (2008) Use of U.S. Croplands for Biofuels Increases Greenhouse Gases Through Emissions from Land-Use Change. Science 319 (5867), 1238–1240.
UNEP/SETAC Life Cycle Initiative (2011) Global Guidance Principles for LCA Databases. Paris, France, UNEP.
Weidema, B. P., Bauer, C., Hischier, R., Mutel, C., Nemecek, T., Reinhard, J., Vadenbo, C. O., Wernet, G. (2013) Overview and methodology. Data quality guideline for the ecoinvent database version 3. Ecoinvent Report 1(v3). St. Gallen: The ecoinvent Centre.
Weidema, B. P., Ekvall, T., Heijungs, R. (2009) Guidelines for application of deepened and broadened LCA. Deliverable D18 of work package 5 of the CALCAS project.
Weidema, B. P., Wenzel, H., Petersen, C., Hansen, K. (2004) The product, functional unit and reference flows in LCA” København: Miljøstyrelsen. (Environmental News 70).
21
3.3. LCA DATA MODELLING: THE DECISIONAL APPROACH
Rolf Frischknecht
treeze Ltd., Uster, Switzerland
1. Question the approach/ methodology aims to answer (when baseline scenario is assessed)
What are the environmental impacts of a product in a given economic situation (recent past). Baseline scenarios, i.e. describing the current situation are described using an attributional approach. Due to the attributional nature of the approach, system expansion to determine avoided burdens is avoided/not feasible.
2. Question the approach/ methodology aims to answer (when future-oriented scenarios are assessed)
What is the environmental impact of a certain product system of anticipated future suppliers with which a company may establish financial and contracual relations.. It takes future supply situation in account and disregards market constraints. The decisional approach is one in a line of three approaches (attributional, decisional, consequential), which are distinguished according to the scope/size of the object of investigation, see Frischknecht and Stucki (2010).
3. Description of the data modelling approach
See definition of the decisional approach in the UNEP SETAC shonan guidance principles document (UNEP/SETAC Life Cycle Initiative 2011)
4. Reference standards/guidelines ISO 14044, although this standard does not explicitly cover the approach.
5. EU policy background None
6. Reference principles The decisional approach aims at supporting decisions in companies to improve the environmental profile of their products or their production.
7. Object /focus and scale Mostly larger investment decisions of companies, public authorities, NGOs and other economic actors.
8. Functional unit 8.1 How is the functional unit framed when baseline scenario is assessed?
According to ISO 14044
8.2 How is the functional unit framed when future-oriented scenarios are assessed?
Same
9. System boundaries 9.1 How and where system boundaries are set up for modelling baseline scenario
According to ISO 14044
22
9.2 How and where system boundaries are set up for modelling future-oriented scenarios are assessed
Following intended future economic (contractual) relationships (known by the decision making economic actor) and official forecasts of economic sectors producing commodities traded via markets.
10. Baseline scenario inventory data quality 10.1 Data typology Process-based absolute LCI datasets, sectoral statistics, sectorial
environmental data from e.g. agency reports, etc.; ecoinvent data v2.2
10.2 Data sources Process-based LCI databases, NAMEA, statistics, everything one needs to establish an attributional database
10.3 Time-related representativeness
Recent past
10.4 Possible geographical resolution
Any resolution as appropriate
10.5 Technology representativeness
Product average data, technology-specific data
10.6 Completeness
No restrictions
10.7 Accuracy Independent of approach, dependent on data availability
10.8 Precision / uncertainty Quantitatively indicated, dependent on dataset.
11. Future-oriented scenario inventory data quality 11.1 Data typology Process-based absolute LCI datasets, sectorial statistics, sectorial
Any resolution is possible and applicable if suiting the decision situation
11.5 Technology representativeness
Technology-specific data
11.6 Completeness Not restricted
11.7 Accuracy Independent of approach, dependent on data availability
11.8 Precision (uncertainty) Future is intrinsically uncertain, quantitatively indicated, dependent on dataset
12. Double counting at inventory level
No double counting allowed nor occurring
23
13. Allocation procedure Stepwise procedure according to the Shonan Guidance Principles published by the UNEP SETAC life cycle initiative, see Section 3.4.4.3.
14. Crediting of avoided burden (e.g. substitution technique in product end-of-life modelling)
Linear emission profiles attached to LCI datasets, current or future (if available) characterization factors used to assess future emission profiles, mutatis mutandis principle
16. Consistency between reference principles (see point 6.) and data modelling approach requirements
Fully consistent
17. Impact categories and assessment methods
Consistency is similar to that of other LCI modelling concepts
18. Variability of results
Variability of results is similar to attributional modelling. Forecast uncertainty related to “uncertain future”: uncertainty with regard to future (environmental) policy, future natural and manmade hazards, wars, economic developments, social developments and the like.
19. Maturity 19.1 Development and endorsement status
‐ Explicitly mentioned and described in the Shonan Guidance Principles published by the UNEP SETAC life cycle initiative, see Chapter 1 and 8 as well as 3.
‐ Peer-reviewed journal paper (see below) (Frischknecht and Stucki 2010)
‐ Dissertation (Frischknecht 1998) ‐ Part of the master curriculum of environmental engineers at
ETHZ
19.2 Testing and dissemination Has the modelling approach/ methodology been tested so far? Yes Prepared for testing on the application within a large service sector company in France.
19.3 Good practices - Frischknecht, R. and M. Stucki (2010)
20. Research gaps/limitations Approach is readily applicable, case study specific LCI data needed as well as future oriented background data of commodities required.
REFERENCES Frischknecht, R. (1998) Life cycle inventory analysis for decision-making: scope-dependent inventory
system models and context-specific joint product allocation. Eidgenössische Technische Hochschule. Zürich, Switzerland.
Frischknecht, R. and Stucki, M. (2010).Scope-dependent modelling of electricity supply in life cycle assessments. The International Journal of Life Cycle Assessment 15(8): 806-816.
UNEP/SETAC Life Cycle Initiative (2011) Global Guidance Principles for LCA Databases. Paris, France, UNEP.
24
4. THE ENVIRONMENTAL FOOTPRINT4
Erwin M. Schau, Camillo De Camillis, Rana Pant European Commission, DG Joint Research Centre, Institute for Environment and Sustainability (IES), Sustainability Assessment, Ispra, Italy
Reference data modelling approach: Attributional (with some elements adopting inspiration from consequential insights, however handled in an attributional context – not change oriented) 1. Question the approach/ methodology aims to answer (when baseline scenario is assessed)
What is the potential “environmental impacts of the flows of material/energy and resulting emissions and waste streams associated with a product from a supply chain perspective (from extraction of raw materials, through use, to final waste management)”? (EC 2013a p. 11)
2. Question the approach/ methodology aims to answer (when future-oriented/alternative scenarios are assessed)
No specific guidelines for assessment of future-oriented scenarios are given in the PEF. In the application context related to eco-design procedures (i.e. “Environmental performance improvement and tracking” (EC 2013a p. 12)), the PEF guide might be used to compare the environmental performance of alternative project proposals. The PEF might thus answer the following question: What is the environmental impact of a certain product in a given alternative scenario (to-BaselineB) if the product were designed differently? However, how to set up and assess future-oriented scenarios is not explicitly addressed in the PEF Guide.
3. Description of the data modelling approach
Attributional approach, although some elements take inspiration from consequential thinking if required to address the questions at stake (EC 2013a, Table 16; Chomkahmsri and Pelletier 2011). The consequential modelling elements are inherited from the ILCD Situation A “micro-level decision support” modelling approach (EC 2010) where the PEF Guide mainly comes from. In fact, the substitution technique, which is a typical approach in consequential assessments to model avoided burdens, is acknowledged in the hierarchy to solve allocation issues at both step 2 and 3 of the procedure in the PEF Guide. Unlike what is foreseen by guidelines on consequential data modelling approaches - see e.g. Situation B in EC (2010) - the substitution technique is applied with attributional thinking in the PEF Guide. The resource flows and environmental interventions connected to a product throughout its supply chain (from extraction of raw materials to waste management) are linked to the unit of analysis (functional unit) via the reference flow in each process and summarized into the resource use and emission profile.
4. Reference standards/guidelines
Product Environmental Footprint (PEF) Guide (EC 2013a). This PEF Guide has been developed building on the following standards and guidelines (EC 2013a, p 10):
4 With a focus on the Product Environmental Footprint (Annex II to the Recommendation) (EC 2013a)
25
• ISO standards, in particular: ISO 14044 (2006), Draft ISO/DIS 14067 (2012); ISO 14025(2006), ISO 14020 (2000);
• ILCD (International Reference Life Cycle Data System) Handbook – Situation A (EC 2010, EC 2011a);
• Ecological Footprint (Global Footprint Network 2009); • Greenhouse Gas Protocol (WRI/ WBCSD) (Greenhouse Gas Protocol
2011); • General principles for an environmental communication on mass
market products (AFNOR BP X 30-323 2011); • Specification for the assessment of the life cycle greenhouse gas
emissions of goods and services (PAS 2050 2011).
5. EU policy background COM(2011) 571: “Roadmap to a Resource Efficient Europe.” (EC 2011b) COM(2013) 196: “Building the Single Market for Green Products” (EC 2013b) COMMISSION RECOMMENDATION of 9 April 2013 on the use of common methods to measure and communicate the life cycle environmental performance of products and organisations (2013/179/EU). (EC 2013a)
European Council conclusion on the "Sustainable materials management and sustainable production and consumption" (December 2010) invites the Commission to "develop a common methodology on the quantitative assessment of environmental impacts of products, throughout their life-cycle, in order to support the assessment and labelling of products".
6. Reference principles Life cycle thinking, multi-criteria analysis (of several different environmental impacts) (EC 2013a) In addition, there are the following principles for conducting a PEF study: Relevance, completeness, consistency, accuracy and transparency (EC 2013a). In addition, when developing the PEF, providing for reproducibility/consistency and to maximise the physical representativeness of the model outcomes (i.e. realism) were underlying principle.
7. Object /focus and scale Single product system, European Union.
8. Functional unit 8.1 How is the functional unit framed when baseline scenario is assessed?
FU = The unit of analysis for a PEF study. Shall be defined according to the following aspects (EC 2013a): - The function(s)/service(s) provided: “what”; - The extent of the function or service: “how much”; - The expected level of quality: “how well”; - The duration/life time of the product: “how long”; - The NACE code(s).
8.2 How is the functional unit framed when future-oriented scenarios are assessed?
The same as above
26
9. System boundaries 9.1 How and where system boundaries are set up for modelling baseline scenario
All product life cycle stages shall be included in the system boundaries. Using a diagram to set up system boundary is recommended. On the top of the unit processes responsible of the potential impact as it is, relevant unit processes responsible for any avoided burdens are included in the system boundaries. The avoided burden represents a credit in the inventory (EC 2013a).
9.2 How and where system boundaries are set up for modelling future-oriented/alternative scenarios are assessed
Alternative scenarios are modelled on the basis of the assumptions made, e.g. by a designer (e.g. alternative raw materials chosen, project variants, alternative production processes). Alternative scenarios are assessed through sensitivity analysis. System boundaries are set as above. A few indirect effects are captured through direct substitution (see allocation procedure) and product EoL modelling.
10. Baseline scenario inventory data quality 10.1 Data typology Process-based absolute LCI datasets (EC 2013a ch. 5.)
10.2 Data sources Facility or product-specific data recommended, generic data (from e.g.
databases) can be used. (EC 2013a ch. 5.7 (specific) and 5.8 (generic)); generic data refers to data that are not based on direct measurements or calculation of the respective processes in the system.
10.3 Time-related representativeness
Retrospective - Time-related representativeness is part of the data quality rating (EC 2013a, formula 1)
10.4 Possible geographical resolution
Specific data that are “directly measured or collected representative of activities at a specific facility or set of facilities. […] Specific data shall be obtained for all foreground processes and for background processes, where appropriate. It is a good idea to use specific and generic data, at the highest geographical resolution level (e.g. central Europe), as the geographical representativeness is part of the data quality rating.
10.5 Technology representativeness
“Directly collected, facility-specific inventory data should be used wherever possible “(EC 2013a, ch. 5)
10.6 Completeness “All material/energy resource inputs/outputs and emissions into air, water and soil” (EC 2013a ch. 5.1) 14 different impact categories are provided (see Table 1)
10.7 Accuracy To be checked during pilot phase
10.8 Precision / uncertainty
High precision and low uncertainty ensured by data quality requirements: “at least 70% of contributions to each EF impact category, both specific and generic data shall achieve at least an overall “good quality” level”. (EC 2013a, ch. 5.6) A range of data quality levels and intervals are defined in the PEF as well as a formula (EC 2013a, Formula 1) to calculate the dataset quality performance.
11. Future-oriented scenario inventory data quality
11.1 Data typology
11.2 Data sources
11.3 Time-related representativeness
11.4 Possible geographical resolution
No specific guidelines for future-oriented scenario are given in the PEF.
27
11.5 Technology representativeness
11.6 Completeness
11.7 Accuracy
11.8 Precision (uncertainty) 12. Double counting at inventory level
Not allowed (EC 2013a, ch 5.4.8)
13. Allocation procedure I) Subdivision or system expansion (e.g. alter functional unit to include the additional function of the process in question, alter the system boundaries to include this new function and its related processes with its resource and emissions.) II) Allocation based on a relevant underlying physical relationship Identify, if possible, a direct substitution effect5, or Identify, if possible, some other relevant underlying physical relationship III) Allocation Based on Some Other Relationship Identify if possible, an indirect substitution effect6 Identify some other relationship, e.g. the economic value of the co-products (EC 2013a, ch 5.10 and Figure 4)
14. Crediting of avoided burden (e.g. substitution technique in product end-of-life modelling)
Allowed to a limited extent (e.g. in some end-of-life calculations).
Assumptions on production phase: Only direct effects are modelled and ideally captured. For example, historic direct land use change is to be assessed while indirect land use change not. Assumptions on use phase: Default consumption pattern assumed to come up with an average dataset for use phase. Consumption pattern assumed to be constant over time (i.e. the product has no effects on consumption patterns). No rebound effects.
Assumptions on product end-of-life: A default path is assumed as given for waste streams. On this basis, the entire amount of recyclable material (calculated from the product recycling rate) is assumed to undergo recycling processes d. Similarly, all waste coming out from the product system is supposed to be correctly disposed of (e.g. no illegal disposal in e.g. open field is captured in the model)
5 Direct substitution effects occur where an empirically-demonstrable substitution effect can be identified. For example, when manure nitrogen is applied to agricultural land, directly substituting an equivalent amount of the specific fertiliser nitrogen that the farmer would otherwise have applied, the animal husbandry system from which the manure is derived is credited for the displaced fertiliser production (taking into account differences in transportation, handling, and emissions). 6 Indirect substitution occurs when a product is substituted but you don’t know by which products exactly.
28
16. Consistency between reference principles (see point 6.) and data modelling approach requirements
Good (EC 2013a, ch. 5)
17. Impact categories and assessment methods
14 Impact categories (EC 2013a, ch. 4.4) based on the ILCD Handbook (EC 2011a). See Table 1 for detail. In addition, if these default impact categories do not properly cover the potential environmental impact, all relevant environmental aspects shall be reported as additional environmental information. Thus, additional impact categories with referenced and documented assessment methods may be used.
18. Variability of results In general, for LCA results the variability is high, due to high spatial and temporal variability and variability in choices made, both in the life cycle inventory and the impact assessment stage. The Environmental Footprint tries to reduce this trough more specific guidance on decisions and data used.
As the variability is regarded as still high, product environmental footprint category rules are required, if comparative assertions are to be made, to further specify e.g. decisions to take on functional units, system boundaries, allocation rules, generic data sources, with the objective to further reduce the variability within a given product group.
As there are no publically available PEF studies yet, the variability need to be further investigated.
19. Maturity
19.1 Development and endorsement status
The Environmental Footprint has been developed by the European Commission (EC 2012). The final guidelines were published as annexes to the Commission recommendation (EC 2013a). The environmental footprint builds on the ILCD Handbook, a series of technical reports, also reported in journal papers and validated in reports external of the authors (Lindfors at al. 2012).
19.2 Testing and dissemination
Has the modelling approach/ methodology been tested so far?
Yes, it has been tested through pilot studies (case studies on the following sectors; agriculture, retail, construction, chemicals, ICT, food and manufacturing (footwear, televisions, paper) There were 10 pilot studies (for the PEF), however, reports from the pilots are confidential. The environmental footprint underwent a stakeholder consultation (EC 2012).
19.3 Good practices
The development of PEF category rules is in the pilot phase,.
20. Research gaps/limitations
• Due to variability in PEF-results, Product Environmental Footprint Category Rules need to be established for the method to be applied on external communication with comparisons/comparative assertions.
• Life cycle inventory data that complies with all data quality criteria, including the ILCD format, are in the development stage
• Implementation of the correct characterisation factors for the impact assessment in commercial LCA software is under development.
• Some of the EF impact assessment methods should be used with care, several impact categories are missing (e.g. noise).
• So far, the Environmental Footprint is not tested on future scenarios.
29
Table 1: Impact assessment categories and methods
Based on the ILCD Handbook (EC 2011a)
Default EF impact categories (with respective EF impact category indicators) and EF impact assessment models for PEF studies
EF Impact Category EF Impact Assessment Model
EF Impact Category indicators Source
Climate Change Bern model - Global Warming Potentials (GWP) over a 100 year time horizon.
kg CO2 equivalent Intergovernmental Panel on Climate Change, 2007
Ozone Depletion EDIP model based on the ODPs of the World Meteorological Organization (WMO) over an infinite time horizon.
kg CFC-11 equivalent WMO, 1999
Ecotoxicity for aquatic fresh water
USEtox model CTUe (Comparative Toxic Unit for ecosystems)
Rosenbaum et al., 2008
Human Toxicity - cancer effects
USEtox model CTUh (Comparative Toxic Unit for humans)
Rosenbaum et al., 2008
Human Toxicity – non-cancer effects
USEtox model CTUh (Comparative Toxic Unit for humans)
Rosenbaum et al., 2008
Particulate Matter/Respiratory Inorganics
RiskPoll model kg PM2.5 equivalent Humbert, 2009*
Ionising Radiation – human health effects
Human Health effect model
kg U235 equivalent (to air) Dreicer et al., 1995
Photochemical Ozone Formation
LOTOS-EUROS model kg NMVOC equivalent Van Zelm et al., 2008 as applied in ReCiPe
Acidification Accumulated Exceedance model
mol H+ eq Seppälä et al.,2006; Posch et al., 2008
Eutrophication – terrestrial
Accumulated Exceedance model
mol N eq Seppälä et al.,2006; Posch et al., 2008
Eutrophication – aquatic
EUTREND model fresh water: kg P equivalent marine: kg N equivalent
Struijs et al., 2009 as implemented in ReCiPe
Resource Depletion – water
Swiss Ecoscarcity model m3 water use related to local scarcity of water
Frischknecht et al., 2008
Resource Depletion – mineral, fossil
CML2002 model kg antimony (Sb) equivalent van Oers et al., 2002
Land use Soil Organic Matter (SOM) model
Kg C (deficit) Milà i Canals et al., 2007
* Mainly based on Rabl and Spataro (2004) and Greco et al. (2007).
30
REFERENCES AFNOR BP X 30-323 (2011). General principles for an environmental communication on mass
market products - Part 0: General principles and methodological framework.
Chomkhamsri, K., Pelletier, N. (2011) Analysis of Existing Environmental Footprint Methodologies for Products and Organizations: Recommendations, Rationale, and Alignment. Ispra, European Commission, Joint Research Centre, Institute for Environment and Sustainability, Ispra, Italy.
Council (2010) European Council conclusion on the "Sustainable materials management and sustainable production and consumption" (December 2010). Brussels:Council of the European Union.
Dreicer, M., Tort, V. and Manen, P. (1995). ExternE, Externalities of Energy, Vol. 5 Nuclear, Centr d'étude sur l'Evaluation de la Protection dans le domaine nucléaire (CEPN), edited by the European Commission DGXII, Science, Research and development JOULE, Luxembourg.
EC (2013a).Commission Recommendation on the use of common methods to measure and communicate the life cycle environmental performance of products and organisations 2013/179/EU, Annex II: Product Environmental Footprint (PEF) Guide (pp. 140). European Commission, Brussels, Belgium.
EC (2013b) Communication from the Commission to the European Parliament and the Council - Building the Single Market for Green Products - Facilitating better information on the environmental performance of products and organisations COM(2013) 196 final. Brussels, Belgium.
EC (2012) Environmental footprint of products. European Commission, DG Environment. from http://ec.europa.eu/environment/eussd/product_footprint.htm. [Accessed Jan 24, 2012]
EC (2011a) The International Reference Life Cycle Data System (ILCD) Handbook - Recommendations for Life Cycle Impact Assessment in the European context. European Commission (EC), Joint Research Centre, Publications office of the European Union, Luxemburg.
EC (2011b) COM(2011) 571 final: Roadmap to a Resource Efficient Europe. European Commission (EC), Brussels, Belgium.
EC (2010) The International Reference Life Cycle Data System (ILCD) Handbook - General guide for Life Cycle Assessment - Detailed guidance. European Commission (EC), Joint Research Centre, Publications office of the European Union, Luxemburg.
Frischknecht, R., Steiner, R. and Jungbluth, N. (2008) The Ecological Scarcity Method – Eco-Factors 2006. A method for impact assessment in LCA. Environmental studies no. 0906. p. 188, Federal Office for the Environment (FOEN), Bern, Switzerland.
Greco, S.L., Wilson, A.M., Spengler J.D., and Levy J.I. (2007) Spatial patterns of mobile source particulate matter emissions-to-exposure relationships across the United States. Atmospheric
Environment (41), 1011-1025.
Global Footprint Network (2009) Ecological Footprint Standards 2009. Oakland, Global Footprint Network.
Greenhouse Gas Protocol (2011) Product Life Cycle Accounting and Reporting Standard, World Resources Institute, World Business Council for Sustainable Development.
Humbert, S. (2009) Geographically Differentiated Life-cycle Impact Assessment of Human Health. Doctoral dissertation, University of California, Berkeley, Berkeley, California, USA.
Intergovernmental Panel on Climate Change (2006) IPCC Guidelines for National Greenhouse Gas Inventories: Volume 4 Agriculture, Forestry and Other Land Use, IGES, Japan.
ISO 14020 (2000) Environmental labels and declarations - General principles. Geneva, ISO, Geneva, Switzerland.
ISO 14025 (2006) Environmental labelling and declarations - Type III environmental declarations - Principles and procedures. ISO, Geneva, Switzerland.
31
ISO 14044 (2006) Environmental management - Life cycle assessment - Requirements and guidelines. ISO, Geneva, Switzerland.
ISO/DIS 14067 (2012) Carbon footprint of products - Requirements and guidelines for quantification and communication. Berlin, Secretariat DIN: 52.
Lindfors L-G, Ekvall T, Eriksson E, Jelse K, Rydberg T (2012) The ILCD Handbook in a nutshell - A brief analysis of the ILCD Handbook and the Draft Guidance on Product Environmental Footprint. IVL, Stockholm, Sweden.
Milà i Canals, L., Romanyà, J. and Cowell, S.J. (2007) Method for assessing impacts on life support functions (LSF) related to the use of ‘fertile land’ in Life Cycle Assessment (LCA). Journal of Cleaner Production, 15, 1426-1440.
PAS 2050 (2011) Specification for the assessment of the life cycle greenhouse gas emissions of goods and services. British Standards Institution, London, United Kingdom.
Posch, M., Seppälä, J., Hettelingh, J.P., Johansson, M., Margni M. and Jolliet, O. (2008) The role of atmospheric dispersion models and ecosystem sensitivity in the determination of characterisation factors for acidifying and eutrophying emissions in LCIA. International Journal of Life Cycle Assessment (13), 477–486.
Rabl, A. and Spadaro, J.V. (2004) The RiskPoll software, version 1.051., Aug 2004, www.arirabl.com.
Rosenbaum R.K., Bachmann T.M., Gold L.S., Huijbregts M.A.J., Jolliet O., Juraske R., Köhler A., Larsen H.F., MacLeod M., Margni M., McKone T.E., Payet J., Schuhmacher M., van de Meent D. and Hauschild M.Z. (2008) USEtox - The UNEP-SETAC toxicity model: recommended characterisation factors for human toxicity and freshwater ecotoxicity in Life Cycle Impact Assessment. International Journal of Life Cycle Assessment 13(7), 532-546.
Seppälä, J., Posch, M., Johansson, M. and Hettelingh, J.P. (2006) Country-dependent Characterisation Factors for Acidification and Terrestrial Eutrophication Based on Accumulated Exceedance as an Impact Category Indicator. International Journal of Life Cycle Assessment 11(6), 403-416.
Struijs, J., Beusen, A., van Jaarsveld, H. and Huijbregts, M.A.J. (2009) Aquatic Eutrophication. Chapter 6 in: Goedkoop, M., Heijungs, R., Huijbregts, M.A.J., De Schryver, A., Struijs, J., Van Zelm, R. (2009). ReCiPe 2008 A life cycle impact assessment method which comprises harmonised category indicators at the midpoint and the endpoint level. Report I: Characterisation factors, first edition.
van Oers, L., de Koning, A., Guinee, J.B. and Huppes, G. (2002) Abiotic Resource Depletion in LCA. Road and Hydraulic Engineering Institute, Ministry of Transport and Water, Amsterdam, Netherlands.
van Zelm, R., Huijbregts, M.A.J., Den Hollander, H.A., Van Jaarsveld, H.A., Sauter, F.J., Struijs, J., Van Wijnen, H.J. and Van de Meent, D. (2008) European characterisation factors for human health damage of PM10 and ozone in life cycle impact assessment. Atmospheric Environment, 42, 441-453.
World Meteorological Organization (WMO) (1999) Scientific Assessment of Ozone Depletion: 1998. Global Ozone Research and Monitoring Project - Report No. 44, ISBN 92-807-1722-7, Geneva, Switzerland.
32
5. BOTTOM-UP LIFE CYCLE-BASED METHODOLOGIES
5.1. MACRO LIFE CYCLE ASSESSMENT (M-LCA), THE INTEGRATED GENERAL EQUILIBRIUM AND LCA MODELLING
Thomas Dandres CIRAIG (Interuniversity research centre for the life cycle of products, processes and services), École Polytechnique de Montréal, Montréal (Qc), Canada
Reference data modelling approach(es): A consequential prospective LCA framework is used to assess the environmental impacts tied to large changes and their consequences on the economy modelled through the global computable general equilibrium model GTAP 1. Question the approach/ methodology aims to answer (when baseline scenario is assessed)
M-LCA is not made to study a baseline scenario (assuming the baseline scenario is the scenario describing the current situation). M-LCA is made to compare different future-oriented scenarios.
2. Question the approach/ methodology aims to answer (when future-oriented scenarios are assessed)
Which policy (among several policies) is the best for the environment? What would be the indirect environmental impacts of a new policy? Would a new policy cause rebound effects?
Note that in M-LCA a business as usual scenario is always compared to a future-oriented scenario (new policy scenario). Therefore the business as usual scenario is always future-oriented and both scenarios are equivalent from a LCA perspective (time horizon, functional unit, etc.).
3. Description of the data modelling approach
M-LCA is a consequential prospective LCA designed to study large changes (consequential LCA was developed to study marginal changes). Environmental consequences of large changes are based on simulations conducted with GTAP (Hertel, 1997), a general equilibrium economic model. In a first step, GTAP computes the economic perturbation caused by large changes and provides the production variation of each economic sector in each region of the world with the exception of the economic sector of the region directly affected by the large change (this change being defined in the new policy and used as an input in the GTAP simulation). Then, LCA is used to compute environmental impacts attributed to these production variations for each economic sector and each region of the world. Prospective data are used to model future evolution of macroeconomic parameters (population, GDP, capital and labour forces) and technological innovation (both in GTAP for background processes and in LCA for foreground processes). Environmental impacts are computed for each region and each economic sector. Due to the economic growth expected in the future, the large change studied must be compared with a business as usual scenario in order to make a distinction between environmental impacts caused by the large change studied and those related to economic growth.
4. Reference standards/guidelines
"CGE Baseline Data and Documentation" on the GTAP website (Purdue University, 2011a): sources of prospective data for GTAP. Walmsley (2006): use of prospective data in GTAP.
33
5. EU policy background
6. Reference principles Published papers: Dandres et al. (2011, 2012) PhD Dissertation: Dandres (2012) Submited paper: Dandres et al. (xxxx)
7. Object /focus and scale One or several economic sectors at national, regional or continental scale.
8. Functional unit
8.1 How is the functional unit framed when baseline scenario is assessed?
N/A
8.2 How is the functional unit framed when future-oriented scenarios are assessed?
The same functional unit (FU) is used for all future-oriented scenarios. FU might be variable in order to reflect future changes. For instance, in a 2005-2025 European energy study, FU was "supply energy to European consumers for year X", X successively taking values of 2005, 2010, 2015, 2020 or 2025.
9. System boundaries
9.1 How and where system boundaries are set up for modelling baseline scenario
N/A
9.2 How and where system boundaries are set up for modelling future-oriented scenarios are assessed
Because GTAP simulates the world economy, by default there is no system boundaries (i.e. the whole world is included in the system). Both business as usual and future-oriented scenario include future evolution of macroeconomic and technological parameters. Business as usual and future-oriented scenario differs only for some political choices (most of the macroeconomic and technological parameters might be the same in both business as usual and future-oriented scenarios). For instance: a business as usual and a future-oriented scenario may differ only in the amount of biofuel used by a country while the evolution of GDP and other parameters is the same in both cases. The political choices can be expressed globally (e.g. 20% of renewable energy in 2020) or in details (e.g. specified amount of electricity generated in the future for each type of power plant) depending of the goal of the study. For that purpose, rough assumptions or partial equilibrium model can be used to define the studied policy. Macroeconomic parameters forecasts are obtained from public sources as mentioned in "CGE Baseline Data and Documentation". Technological innovation data for background processes are extrapolated from Total Factor Productivity (TFP) forecasts (obtained from literature, see PhD Dissertation: Dandres (2012) for more details). Technological innovation data for foreground processes are also obtained from literature but these data are more specific to the corresponding technologies.
34
10. Baseline scenario inventory data quality
10.1 Data typology
N/A
10.2 Data sources
N/A
10.3 Time-related representativeness
N/A
10.4 Possible geographical resolution
N/A
10.5 Technology representativeness
N/A
10.6 Completeness
N/A
10.7 Accuracy
N/A
10.8 Precision / uncertainty
N/A
11. Future-oriented scenario inventory data quality
11.1 Data typology
Input/output tables, economic sector production for reference year, macroeconomic data, processes LCI dataset
11.2 Data sources
GTAP model, UNDATA, FAO, IEA, US department of agriculture, CEPII, International Labor Organization, ecoinvent.
11.3 Time-related representativeness
Forecasts (macroeconomic parameters) and linear extrapolations from historical trends (technologies).
11.4 Possible geographical resolution
GTAP divides the world in 134 regions that can be aggregated. Therefore the resolution can be national, continental or world. Moreover, it is possible to disaggregate a region from a country and reach regional level if economic data are available. However, it may require a lot of work.
11.5 Technology representativeness
GTAP models the economy according to 57 economic sectors that can be aggregated. Each economic sector may regroup hundreds of economic activities. Like for regions, it is possible to disaggregate an economic activity from an economic sector. It seems to be easier for economic activities than for regions because there is a database (TASTE, Purdue University 2011b) for that purpose.
11.6 Completeness
M-LCA has been developed for IMPACT2002+ and Recipe but it can be easily adapted to any other impact assessment method.
11.7 Accuracy
Economic data are expected to be quite accurate and precise. Data used to model evolution of technologies are neither accurate nor precise, especially for background processes. The use of LCI data (M-LCA has been developed with ecoinvent) are not expected to be very accurate and precise because these data are used to model technological processes in other regions than Europe and for mid-term and long-term future. Two measures were taken to improve use of ecoinvent data in M-LCA: (1) electricity generation modelling is based on regional specificities for each region and (2) data from literature are used to adapt ecoinvent processes to the future for the foreground processes.
35
11.8 Precision (uncertainty)
Beyond the data, it should be mentioned the GTAP model highly contributes to uncertainty of results of M-LCA.
12. Double counting at inventory level
Not allowed. Ecoinvent database was modified in order to fit with GTAP database and avoid double counting.
13. Allocation procedure Up until now M-LCA was not used to assess specific multifunctional processes. Due to system boundaries, allocation was not needed.
14. Crediting of avoided burden (e.g. substitution technique in product end-of-life modelling)
Due to system boundaries and M-LCA principle, crediting for avoided burden was not needed. In M-LCA, the studied system includes all economic activities therefore it is impossible for a co-product to be out of the system. Also, there is no need to compute credits for avoided burden because the future-oriented scenario is always compared with the business as usual scenario. Thus, the avoided burden should appear at least in one of the scenarios.
It is assumed: • same assumptions than in GTAP model; • historic trends are representative of technological
innovation; • for a given process, technological innovation process leads
to a global reduction of all input/output of this process (e.g. no specific reduction of emission for a specific contaminant);
• technological innovation does not lead to technological breakthroughs among the background processes (technological breakthroughs are allowed only for foreground processes);
• ecoinvent processes are representative of Europe and rest of the world technologies (with the exception of electricity generation)
• chains of effects linking emissions to environmental impacts won't change in the future (fate and exposition remain unchanged)
16. Consistency between reference principles (see point 6.) and data modelling approach requirements
While not being perfect, the data used in M-LCA are assumed to be the best data available. This is also why uncertainty management is important when conducting a M-LCA. It is clear M-LCA results are expected to be very uncertain for a given scenario. However, it has been shown comparison of different policy is quite robust (see Dandres et al (xxxx) for more details)
17. Impact categories and assessment methods
Any impact assessment compatible with ecoinvent will work with M-LCA. Ideally, it is recommended to use an impact assessment method using regional impact factors like IMPACTWORLD+.
18. Variability of results Results for a given scenario are very sensitive to macroeconomic parameters modelling the economic growth. This is the reason why it is very important to always compare two scenarios (a new policy vs a baseline policy) having the same macroeconomic background. As mentioned in Dandres et al. (xxxx), the comparison of two policies (e.g. policy A causing less impacts than policy B) seems to be relatively unaffected when the macroeconomic background
36
changes in both policies at the same time (but more studies are needed to confirm it is generally true). Sensitivity of LCI data on M-LCA results is unknown since no investigation has been conducted yet for this purpose. Comparison of M-LCA results obtained with IMPACT2002+ and Recipe for some impact categories showed compatible results but more investigations would be necessary to conclude about the sensitivity of impact assessment method.
19. Maturity 19.1 Development and endorsement status
The M-LCA method has recently been published in a peer reviewed journal (Dandres et al., 2011 and 2012), in a PhD Dissertation (Dandres 2012) and presented in several international conferences: 14th GTAP annual meeting, SETAC (Berlin, Milan), LCA X, and Social Value of Material Seminars (Freiberg, Nancy, Metz, and Leuven). Sensitivity analyses and uncertainty management in M-LCA has been submitted to a peer reviewed journal (Dandres et al. xxxx). No organisation nor government currently use M-LCA as it is defined in Dandres et al. publications. However, some industrial corporations are already interested to use it.
19.2 Testing and dissemination Tests on sensitivity and uncertainty in M-LCA have been conducted in Dandres et al. (xxxx). This paper is currently being reviewed.
19.3 Good practices Dandres et al. (2011, 2012, xxxx)
20. Research gaps/limitations Data and data management • Improve data for technological innovation (TFP data are
very uncertain) • Improve technological innovation modelling (allows
breakthroughs and specific contaminants reduction) • Improve databases mapping between GTAP and
international databases (some data are missing for some economic sector, especially heat generation and transports).
• Improve databases mapping between GTAP and ecoinvent (some economic sectors are not modelled in ecoinvent. An I/O LCI database could be used for that purpose)
• Adapt ecoinvent data to take into account regional specificities (not only for electricity generation but also for heat, agriculture, etc.)
Impact assessment • Implement a dynamic approach for modelling emissions
where needed (Levasseur et al., 2010) • Develop impact factors to model impact occurring in the
future Uncertainty management
• Develop a method to manage all sources of uncertainty in M-LCA (Monte-Carlo simulations are not suitable considering the time required to run a single GTAP simulation)
• Develop a method to assess uncertainty on the future
37
REFERENCES Dandres, T. (2012) Développement d'une méthode d'analyse du cycle de vie conséquentielle
prospective macroscopique : évaluation d'une politique de bioénergie dans l'Union Européenne à l'horizon 2025. (Dissertation), University of Montreal, Montreal, Canada.
Dandres, T., Gaudreault, C., Tirado-Seco, P., & Samson, R. (2011) Assessing non-marginal variations with consequential LCA: Application to European energy sector. Renewable and Sustainable Energy Reviews, 15(6), 3121-3132.
Dandres, T., Gaudreault, C., Tirado-Seco, P., & Samson, R. (2012) Macroanalysis of the economic and environmental impacts of a 2005-2025 European Union bioenergy policy using the GTAP model and life cycle assessment. Renewable and Sustainable Energy Reviews, 16(2), 1180-1192.
Dandres, T., Gaudreault, C., Tirado-Seco, P., & Samson, R. (xxxx) Evaluating uncertainty of large models used to assess global environmental change caused by a 2005-2025 European bioenergy policy. Renewable and Sustainable Energy Reviews [under review].
.Hertel, T. W. (1997) Global Trade Analysis - Modeling and Applications. Cambridge University Press.
Levasseur, A., Lesage, P., Margni, M., Deschenes, L., & Samson, R. (2010) Considering Time in LCA: Dynamic LCA and Its Application to Global Warming Impact Assessments. Environmental Science & Technology, 44(8), 3169-3174.
Purdue University (2011a) CGE Baseline Data and Documentation, 2012, from https://www.gtap.agecon.purdue.edu/models/Dynamic/Baseline/default.asp. [Accessed November 2012].
Purdue University (2011b) TASTE: Tariff Analytical and Simulation Tool for Economists, 2012, from https://www.gtap.agecon.purdue.edu/resources/taste/taste.asp. [Accessed November 2012].
Walmsley, T. L. (2006) A baseline scenario for the dynamic GTAP model (pp. 14), from https://www.gtap.agecon.purdue.edu/resources/res_display.asp?RecordID=2204. [Accessed June 2010].
38
5.2. THE INTEGRATED PARTIAL MARKET EQUILIBRIUM AND LIFE CYCLE ASSESSMENT MODELLING (PME-LCA)
J. Mason Earles1, Anthony Halog2 1University of California Davis, Department of Plant Sciences, Davis, California, CA, USA 2University of Queensland, School of Geography, Planning and Environmental Management, Brisbane, Queensland, Australia
Reference data modelling approach(es): A consequential prospective LCA framework is used to assess the environmental impacts tied to large changes and their consequences on the economy modelled through a partial market equilibrium (PME) model 1. Question the approach/ methodology aims to answer (when baseline scenario is assessed)
Under business-as-usual, what are the expected environmental impacts directly resulting from the production of a good and indirectly resulting from its economic relationship with other goods?
2. Question the approach/ methodology aims to answer (when future-oriented scenarios are assessed)
For a given policy scenario, what are the expected environmental impacts directly resulting from the production of a good and indirectly resulting from its economic relationship with other goods? How do these impacts compare to the business-as-usual scenario?
3. Description of the data modelling approach
The expected environmental impacts directly resulting from the production of a good using an approach similar to attributional LCA (ALCA). Environmental impacts indirectly resulting from the good’s economic relationship with other goods are modelled using a partial market equilibrium (PME) framework.
4. Reference standards/guidelines N/A
5. EU policy background
N/A
6. Reference principles Same as in ISO 14040 Ekvall (2000); Ekvall and Andrae (2006); US EPA (2010); Earles et al. (2012)
7. Object /focus and scale PME models are typically used to analyse the possible effects of a policy on a market or set of markets. They permit the investigation of substitutable and complementary goods as they relate to a change in price. They can be relatively small and simplified, or large models which incorporate hundreds of goods across multiple sectors and/or multiple regions. In contrast, computable general equilibrium models include all sectors within the economic system, yet they typically lack the amount of sectoral level detail present in PME models.
8. Functional unit
8.1 How is the functional unit framed when baseline scenario is assessed?
The functional unit is framed in the same way as ALCA. Under the baseline scenario, the functional unit reflects business-as-usual.
8.2 How is the functional unit framed when future-oriented scenarios are assessed?
The functional unit is framed in the same way as ALCA. Under the future-oriented scenarios, the functional unit reflects the effects of policy decision under assessment on the functional unit.
39
9. System boundaries
9.1 How and where system boundaries are set up for modelling baseline scenario
The system boundary associated with expected environmental impacts directly resulting from the production of a good using an approach similar to attributional LCA (ALCA). The system boundary associated with the environmental impacts indirectly resulting from the good’s economic relationship with other goods is defined by the PME model being used. Again, PMEs can be relatively small and simplified, or large models which incorporate hundreds of goods across multiple sectors and/or multiple regions. The baseline scenario reflects the system without implementation of the policy under examination.
9.2 How and where system boundaries are set up for modelling future-oriented scenarios are assessed
Same as the baseline scenario description above, except that the future-oriented scenario reflects the system with implementation of the policy under examination.
10. Baseline scenario inventory data quality
10.1 Data typology Process-based LCI data; economic data (e.g. prices of goods, demand for goods, supply of goods, constraints on supply/demand, price elasticities of demand, etc.)
10.2 Data sources Process-based LCI databases; economic databases; literature for econometric estimates of relationships between goods, prices, etc.
10.3 Time-related representativeness
Prospective.
10.4 Possible geographical resolution
Minimum geographic resolution of 2 markets (spatially or sectorally defined). Many geographical scales possible. Coincident with geographic resolution of PME model.
10.5 Technology representativeness
Coincident with sectoral resolution of PME model.
10.6 Completeness
Unspecified.
10.7 Accuracy
Unspecified.
10.8 Precision / uncertainty
Unspecified.
11. Future-oriented scenario inventory data quality
11.1 Data typology
Same as baseline.
11.2 Data sources
Same as baseline.
11.3 Time-related representativeness
Same as baseline.
11.4 Possible geographical resolution
Same as baseline.
11.5 Technology representativeness
Same as baseline.
40
11.6 Completeness
Same as baseline.
11.7 Accuracy
Same as baseline.
11.8 Precision (uncertainty) Same as baseline.
12. Double counting at inventory level
Not allowed.
13. Allocation procedure
Same as consequential LCA (CLCA).
14. Crediting of avoided burden (e.g. substitution technique in product end-of-life modelling)
Consumers are price-takers. Consumers preferences and incomes constant. Prices of good and related goods are known. Either ignores effects of excluded industries in the economy or assumes that they are negligible. Other assumptions of PME models and ALCA apply.
16. Consistency between reference principles (see point 6.) and data modelling approach requirements
17. Impact categories and assessment methods
Same as ALCA.
18. Variability of results Same as ALCA for direct environmental impacts. Same as PME model for indirect environmental impacts.
19. Maturity
19.1 Development and endorsement status
While we are unaware of any official endorsement of the integrated PME-LCA method, such models have been used in policy-making for indirect land use change impacts associated with biofuel production by the US Environmental Protection Agency (US EPA 2010). Still, relatively few PME-LCA models exist.
19.2 Testing and dissemination See: Ekvall (2000), Ekvall and Andrae (2006), US EPA (2010), Earles et al. (2012)
19.3 Good practices See: Ekvall and Andrae (2006); US EPA (2010); Earles et al. (2012)
20. Research gaps/limitations A literature review could be conducted to identify available PME models for integration with LCA. Retrospective PME-LCA models could be performed for validation purposes. Uncertainty analysis of PME-LCA models, beyond simple sensitivity manipulations, has yet to be developed and could improve confidence assessment of PME-LCA models. Comparison between PME-LCA model results and those from integrated computable general equilibrium and LCA models (e.g. see Dandres 2012) could be conducted.
41
REFERENCES Dandres, T., Gaudreault, C., Tirado-Seco, P., & Samson, R. (2012) Macroanalysis of the economic and
environmental impacts of a 2005-2025 European Union bioenergy policy using the GTAP model and life cycle assessment. Renewable and Sustainable Energy Reviews, 16(2), 1180-1192.
Earles, J,, Halog, A., Ince, P., Skog, K. (2012) Integrated economic equilibrium and life cycle assessment modeling for policy-based consequential LCA. Journal of Industrial Ecology, 17(3), 375-384.
Ekvall, T. (2000) A market-based approach to allocation at open-loop recycling. Resource, Conservation and Recycling 29(1–2): 91–109.
Ekvall, T., Andrae, A. (2006) Attributional and consequential environmental assessment of the shift to lead-free solders. The International Journal of Life Cycle Assessment, 11(5), 344–353
US EPA (2010) Renewable Fuel Standard Program (RFS2) Regulatory Impact Analysis. EPA-420-R-10-006. February, 2010.
42
5.3. THE LCA DATA MODELLING APPROACH FOR BACKCASTING SCENARIO ASSESSMENTS
Reinout Heijungs Leiden University, Institute of Environmental Sciences (CML), Leiden, the Netherlands
Reference data modelling approach(es): Scenario-based data based on attributional thinking (so not average or marginal); no functional unit 1. Question the approach/ methodology aims to answer (when baseline scenario is assessed)
Not applicable
2. Question the approach/ methodology aims to answer (when future-oriented scenarios are assessed)
What consumption levels and/or technologies are appropriate for fulfilling society-wide demands that fit within sustainability constraints?
3. Description of the data modelling approach
The backcasting approach takes the society-wide perspective and tries to find what prosperity-technology combination fits in the sustainability limits of the earth.
4. Reference standards/guidelines
Not yet
5. EU policy background
None
1. Reference principles
None
7. Object /focus and scale
In principle world or other large territory
8. Functional unit
8.1 How is the functional unit framed when baseline scenario is assessed?
There is no functional unit; what “drives” the system is a scenario for total consumption
8.2 How is the functional unit framed when future-oriented scenarios are assessed?
See above
9. System boundaries 9.1 How and where system boundaries are set up for modelling baseline scenario
System boundaries are very inclusive; in practice, we may start by, e.g., society-wide input-output tables or a comprehensive database, like ecoinvent
9.2 How and where system boundaries are set up for modelling future-oriented scenarios are assessed
See above
43
10. Baseline scenario inventory data quality 10.1 Data typology
Mixed types of data, but probably best done with environmentally extended input-output, because full coverage of societal demand is difficult with process-based LCA
10.2 Data sources
See above
10.3 Time-related representativeness
Future-oriented in principle; in practice existing data will be used
10.4 Possible geographical resolution
National is perhaps the best feasible
10.5 Technology representativeness
In theory mixed; in practice we may start with the data that is available, which will often be a little bit outdated
10.6 Completeness As complete as possible, if priority dictates perhaps more focus on resources than on emissions
10.7 Accuracy Low-medium
10.8 Precision / uncertainty As we extend data for a full societal use, there may be quite some deviations with the real numbers. Accuracy will thus be medium. Uncertainty will be medium as well, because other studies may use different assumptions and find different results
11. Future-oriented scenario inventory data quality 11.1 Data typology
See above
11.2 Data sources
See above
11.3 Time-related representativeness
Future-oriented
11.4 Possible geographical resolution
National is perhaps the best feasible
11.5 Technology representativeness
In theory mixed; in practice we may start with the data that is available, which will often be a little bit outdated
11.6 Completeness As complete as possible, if priority dictates perhaps more focus on resources than on emissions
11.7 Accuracy Low-medium
11.8 Precision (uncertainty) Low-medium
12. Double counting at inventory level
Not allowed
13. Allocation procedure No allocation needed, as you don’t isolate a product
14. Crediting of avoided burden (e.g. substitution technique in product end-of-life modelling)
In theory nothing is fixed, and everything follows from a scenario; in practice mixed for now, it is a technique in development
16. Consistency between reference principles (see point 6.) and data modelling approach requirements
Idem
17. Impact categories and assessment methods
Any impact methodology may be appropriate; however the comparison with sustainable levels will be essential
18. Variability of results Mainly due to choices of technology specification and consumption patterns
19. Maturity
19.1 Development and endorsement status
Really in development; no endorsement whatsoever at this stage
19.2 Testing and dissemination Even testing has not yet been done
19.3 Good practices So far not
20. Research gaps/limitations Needs a lot of further work
REFERENCES Guinée, J. B. and Heijungs, R. (2011) Life cycle sustainability analysis. Framing questions for
approaches. Journal of Industrial Ecology 15(5), 656-658.
45
5.4. LIFE CYCLE INDICATORS FOR RESOURCES, PRODUCTS AND WASTE MANAGEMENT
Malgorzata Goralczyk European Commission, DG Joint Research Centre, Institute for Environment and Sustainability (IES), Sustainability Assessment unit, Ispra, Italy
Reference data modelling approach(es): ILCD Handbook Situation C (EC 2010), ISO 14044 1. Question the approach/ methodology aims to answer (when baseline scenario is assessed)
What is the environmental impact of the production, consumption and waste management in the European Union and each Member State, including the environmental impacts from trade? What is the environmental impact of the resource use (case of resource life cycle indicators), consumption (case of basket of products) and waste management (case of waste management indicators)? What is the environmental impact related to import and export? What is the total environmental impact of the European consumption (including trade)?
2. Question the approach/ methodology aims to answer (when future-oriented scenarios are assessed)
The framework allows the scenarios development to assess, e.g. what would be the impact of substituting whole car fleet with cars conforming to the Euro 5 or 6 emission standard.
3. Description of the data modelling approach
Life cycle indicators are calculated based on the attributional approach.
4. Reference standards/guidelines ISO 14044, ILCD Handbook.(EC 2010)
5. EU policy background (only for methodologies)
Initially: Thematic Strategy on Natural Resources, Integrated Product Policy Communication, Thematic Strategy on the Prevention and Recycling of Waste. Currently: Europe 2020 Strategy (under the goal of Sustainable growth), Flagship initiative Resource efficient Europe, Roadmap for a resource-efficient Europe.
7. Object /focus and scale Environmental impact of the defined territory (EU, Member State, region).
8. Functional unit 8.1 How is the functional unit framed when baseline scenario is assessed?
Territory (EU or Member state) including the environmental impact associated with the consumption, production and waste management of the population of this territory.
8.2 How is the functional unit framed when future-oriented scenarios are assessed?
If done, same as above.
46
9. System boundaries 9.1 How and where system boundaries are set up for modelling baseline scenario
Cradle-to-grave, except for trade which is modelled on the cradle-to-gate (following the territorial principle).
9.2 How and where system boundaries are set up for modelling future-oriented scenarios are assessed
If done, same as above.
10. Baseline scenario inventory data quality
10.1 Data typology Process-based absolute LCI datasets, sectoral statistics, sectorial environmental data from e.g. agency reports, territorial Eurostat data, PRODCOM, COMEXT (for details see the reports in point 19.1).
10.2 Data sources Process-based LCI databases, statistics (for details see the reports in point 19.1).
Sectorial average data, product average data, energy mix.
10.6 Completeness Follows the ILCD recommended impact categories, except for land use, ozone depletion, water (due to lack of data issue).
10.7 Accuracy Not yet fully assessed.
10.8 Precision / uncertainty Not yet assessed.
11. Future-oriented scenario inventory data quality
11.1 Data typology Same as above.
11.2 Data sources Same as above.
11.3 Time-related representativeness
Same as above.
11.4 Possible geographical resolution
Same as above.
11.5 Technology representativeness
Same as above.
11.6 Completeness
Same as above.
11.7 Accuracy
Same as above.
11.8 Precision (uncertainty) Same as above.
47
12. Double counting at inventory level
Not allowed, or minimised.
13. Allocation procedure
Depends on the indicators sets.
14. Crediting of avoided burden (e.g. substitution technique in product end-of-life modelling)
Allowed in the waste management indicators set (results presented with and without credit for better transparency). The savings from recovered secondary products and energy were credited by the system boundary expansion. This (as well as remaining modelling) corresponds to Situation C1 (monitoring) from ILCD Handbook. The share of credit depends on the particular waste stream treatment (real data).
16. Consistency between reference principles (see point 6.) and data modelling approach requirements
Consistent.
17. Impact categories and assessment methods
Impact categories and assessment methods follow ILCD recommendations.
18. Variability of results
Not tested yet
19. Maturity
19.1 Development and endorsement status
Reports issued by the European Commission: 1. Life cycle indicators for resources, products and waste:
framework (EC 2012a) 2. Life cycle indicators for resources, products and waste:
resources, resource-efficiency, decoupling (EC 2012b) 3. Life cycle indicators for resources, products and waste: basket-
of-products (EC 2012c) 4. Life cycle indicators for resources, products and waste: waste
management (EC 2012d) 5. Recommendations for life cycle based Indicators for
Sustainable Consumption and Production in the European Union - Outcomes of the 3rd International Life Cycle Thinking Workshop on "Sustainability and Decoupling Indicators: Life cycle based approaches" (Koneczny et al. 2007)
6. Background Review of Existing Weighting Approaches in Life Cycle Impact Assessment (LCIA) (Huppes and van Oers 2011a)
7. Evaluation of Weighting Methods for Measuring the EU-27 Overall Environmental Impact (Huppes and van Oers 2011b)
19.2 Testing and dissemination Results of the pilot studies are available online at:
http://lct.jrc.ec.europa.eu 1. Life cycle indicators for resources, products and waste: resources, resource-efficiency, decoupling 2. Life cycle indicators for resources, products and waste: basket-of-products 3. Life cycle indicators for resources, products and waste: waste management
48
19.3 Good practices See above.
20. Research gaps/limitations Status versus needs: 1. Indicators calculated for EU-27 and 1 member state
(Germany): needed increase in the number of covered Member States of European Union (in progress)
2. Time series: 2004-2006: needed increase in the length of time-series (in progress)
3. Impact categories not covered: land use, ozone depletion, water (in progress)
4. Improving the representativeness: increasing the number of representative products covered (in progress)
5. Import and export mass-wise upscale: improve to mixed mass/value upscaling
6. Closing the gaps in input data (statistical and life cycle)(in progress)
REFERENCES EC (2012a) Life cycle indicators framework: development of life cycle based macro-level monitoring
indicators for resources, products and waste for the EU-27. European Commission, Joint Research Centre, Institute for Environment and Sustainability, Ispra, Italy.
EC (2012b) Life cycle indicators for resources: development of life cycle based macro-level monitoring indicators for resources, products and waste for the EU-27. European Commission, Joint Research Centre, Institute for Environment and Sustainability, Ispra, Italy.
EC (2012c) Life cycle indicators basket-of-products: development of life cycle based macro-level monitoring indicators for resources, products and waste for the EU-27. European Commission, Joint Research Centre, Institute for Environment and Sustainability, Ispra, Italy.
EC (2012d) Life cycle indicators for waste management: development of life cycle based macro-level monitoring indicators for resources, products and waste for the EU-27. European Commission, Joint Research Centre, Institute for Environment and Sustainability, Ispra, Italy.
EC (2011) The International Reference Life Cycle Data System (ILCD) Handbook - Recommendations for Life Cycle Impact Assessment in the European context. European Commission (EC), Joint Research Centre, Publications office of the European Union, Luxemburg.
EC (2010) The International Reference Life Cycle Data System (ILCD) Handbook - General guide for Life Cycle Assessment - Detailed guidance. European Commission (EC), Joint Research Centre, Publications office of the European Union, Luxemburg.
Huppes, G., van Oers, L. (2011a) Background Review of Existing Weighting Approaches in Life Cycle Impact Assessment (LCIA). European Commission (EC), Joint Research Centre, Publications office of the European Union, Luxemburg.
Huppes, G., van Oers, L. (2011b) Evaluation of Weighting Methods for Measuring the EU-27 Overall Environmental Impact. European Commission (EC), Joint Research Centre, Publications office of the European Union, Luxemburg.
Koneczny, K., Bersani, R., Pennington, D. W., Wolf, M.-A. (2007) Recommendations for life cycle based Indicators for Sustainable Consumption and Production in the European Union. European Commission (EC), Joint Research Centre, Publications office of the European Union, Luxemburg.
49
6. TOP-DOWN LIFE CYCLE-BASED METHODOLOGIES
6.1. ENVIRONMENTALLY-EXTENDED INPUT-OUTPUT MODELLING AND ANALYSIS
Valeria Andreoni1, Sangwon Suh2 1European Commission, DG Joint Research Centre, Institute for Prospective Technological Studies (IPTS), Sustainable Production and Consumption unit, Seville, Spain 2University of California, Bren School of Environmental Science and Management, Santa Barbara, California, CA, USA
Reference data modelling approach(es): Input-Output Tables and Input-Output Analysis 1. Question the approach/ methodology aims to answer (when baseline scenario is assessed)
Input-Output approach is used to:
1) Analyse the interdependencies of industries in an economy (at a given point of time or over time)
2) Investigate economic, social and environmental impacts generated by economic sectors and activities or by final consumption of households and government (from a static or dynamic perspective)
3) Analyse trade relationships between countries and the related impacts on economy, environment and society
4) Decompose/determine the main drivers causing changes over time in economic, social or environmental variables
5) Investigate the economic, environmental and social impacts using scenario analysis, for example, a shutdown of an industry (short-run analysis)
6) Determine the main paths (direct and indirect) of factor generation due to final consumption using structural path analysis
7) Compute the volume of emissions, employment, or value added that is embodied in exports and imports which helps to better understand the global production/value chains issues
2. Question the approach/ methodology aims to answer (when future-oriented scenarios are assessed)
What is the economic, environmental or social consequences generated by changes in:
‐ production technologies ‐ quantities produced/consumed ‐ the amount of resources used ‐ households or government consumption ‐ market based instruments (e.g., taxes) to increase
sustainability ‐ exports and imports of final goods
3. Description of the data modelling approach
“The input-output modelling approach consists of a system of linear equations, each one of which describes the distribution of an industry’s product through the economy.” (Miller and Blair 2009).
Socio-environmental extensions and trade links between countries can also be introduced to describe the relationships between economic activities, environment and societies over time, dimensions and space.
50
4. Reference standards/guidelines
- Miller and Blair (2009) - Eurostat (2008) - Suh S (2009)
5. EU policy background Input-Output tables are annually compiled by Member States and are collected by Eurostat Input-Output methodology is largely used to investigate EU policy impacts
6. Reference principles - See chapter 2 of Eurostat Manual (2008) and chapter 13 for the extensions - See chapter 5 of Miller and Blair (2009)
7. Object /focus and scale Input-Output tables refer to national scale. Some regional I-O tables are also available. A consolidate EU27 I-O table is compiled by Eurostat. WIOD, EXIOBASE, GTAP and CREEA are examples of world databases that provide I-O tables for various countries and anon-covered countries are aggregated in the Rest of the World region (which defer from one database to the other)
8. Functional unit 8.1 How is the functional unit framed when baseline scenario is assessed?
The smaller functional unit is the sectoral disaggregation. For the environmental and social data, the functional unit can vary based on the disaggregation used during the compilation of the I-O extensions
8.2 How is the functional unit framed when future-oriented scenarios are assessed?
The smaller and functional unit is the sectoral disaggregation. For the environmental and social data, the functional unit can vary based on the disaggregation level used during the compilation of the I-O extensions
9. System boundaries 9.1 How and where system boundaries are set up for modelling baseline scenario
National level and multi-national level for MRIOs
9.2 How and where system boundaries are set up for modelling future-oriented scenarios are assessed
National level Static Input-Output models can be used to model future-oriented scenarios in the short time Input-Output framework can be used in dynamic models to investigate long term scenarios Rebound effects can be investigated by considering the second round effects
10. Baseline scenario inventory data quality 10.1 Data typology Input-Output tables
Input-Output extensions
10.2 Data sources National Input-Output tables and extensions provided by Member States or Eurostat Databases: e.g. WIOD, EXIOBASE, CREEA
51
10.3 Time-related representativeness
I-O tables are yearly available Short time projections can be estimated based on the available I-O tables
10.4 Possible geographical resolution
Data provided by Eurostat and Member States: National and EU-27 consolidated WIOD, EXIOBASE, CREEA: EU27 Member States and other non EU-Countries In a limited number of cases: Regional data
10.5 Technology representativeness
Sectoral disaggregation
10.6 Completeness
Main Databases Summary (see Table 2)
10.7 Accuracy
Accuracy is related to data availability and to criteria used in database construction. Eurostat database and National Tables are the only official data released within EU27
10.8 Precision / uncertainty
Precision is related to data availability and to criteria used in database construction.
11. Future-oriented scenario inventory data quality
11.1 Data typology Input-Output tables Input-Output extensions generally provided as social or environmental extended supply, use and input-output tables (EE-SUIOT) Data on constraint applied in one or more economic sectors Data on value added variations Data on natural resources availability variations Data on price variations Data on technological variations These data can be provided by statistics or can be related to constraints decided by policies (e.g. Market based instruments, tax variations...)
11.2 Data sources National Input-Output tables and extensions provided by Member States or Eurostat Databases: e.g. CEDA, WIOD, EXIOBASE, CREEA Statistical data
11.3 Time-related representativeness
I-O tables are yearly available Short time projections can be estimated based on the available I-O tables
11.4 Possible geographical resolution
Data provided by Eurostat and Member States: National and EU-27 consolidated WIOD, EXIOPOL, CREEA….: EU27 Member States and other non EU-Countries In a limited number of cases: Regional data
11.5 Technology representativeness
Sectoral disaggregation.
11.6 Completeness See 10.6
52
11.7 Accuracy Short time scenario and projections: good accuracy; long time scenario and projections: low accuracy
11.8 Precision (uncertainty) Short time scenario and projections: good precision; long time scenario and projections: low precision
12. Double counting at inventory level
It is generally avoided
13. Allocation procedure Different allocation rules and procedures can be used, depending on database construction philosophy
14. Crediting of avoided burden (e.g. substitution technique in product end-of-life modelling)
Scenario analysis using IO frameworks can change on e.g. technical coefficients between economic sectors, A recent example would be NTNU's hybrid assessment on low-carbon energy technologies' future that uses those coefficients as variables (Wiedmann et al., 2011)
16. Consistency between reference principles (see point 6.) and data modelling approach requirements
IO methodology is consistent within itself and with matrix-based LCIs
17. Impact categories and assessment methods
Estimation of employment or value added generated by economic sectors and activities, or assessment of environmental impacts, as for example the carbon, the material the energy of the water footprints can be calculated by using EEIO
18. Variability of results
Results variability is largely depend on the database used
19. Maturity 19.1 Development and endorsement status
Input-Output tables are compiled by Member States based on rules and principles defined by Eurostat
Input-Output modelling and analysis is defined by the analytical framework developed by Nobel Prize W. Leontief. Extensions and methodological improvements have been proposed during the last decades
19.2 Testing and dissemination Input-Output modelling and analysis is largely used both for research and policy support purposes.
19.3 Good practices Environmental Impact of Products (EIPRO) - Analysis of the life cycle environmental impacts related to the final consumption of the EU-25 (EC 2006)
20. Research gaps/limitations Input-output analysis and modelling is particularly useful to analyse the relationships between economic sectors and activities, to investigate the main drivers of change and to estimate the economic, environmental and social impacts generated by policies, unexpected shocks, market and resources constraints.
Countries 27 EU MS 27 EU MS 27 EU MS 27 EU MS 27 EU MS UK, USA, 16 trade
partners 16 trade partners
12 trade partners EU, EA EU, EA China
Tables MRSUIOT MRSUIOT MRSUIOT SUIOT SUIOT SUIOT * Not already available REFERENCES CEDA (2013) Comprehensive Environmental Data Archive (CEDA). Available at: www.cedainformation.net
[Accessed July 24th, 2013]
CREEA (2013) Compiling and Refining Environmental and Economic Accounts (CREEA). Available at: www.creea.eu [Accessed July 24th, 2013]
EXIOBASE (2013) EXIOBASE, A global, detailed Multi-regional Environmentally Extended Supply and Use / Input Output (MR EE SUT/IOT) database. Available at: www.exiobase.eu [Accessed July 24th, 2013]
European Commission (2006) Environmental Impact of Products (EIPRO) Analysis of the life cycle environmental impacts related to the final consumption of the EU-25. European Commission (EC), DG Joint Research Centre, Institute for Prospective Technological Studies (IPTS), Seville, Spain.
Eurostat (2008) Eurostat manual of supply, use and input-output tables. Eurostat, European Commission. Publications office of the European Union, Luxemburg. Available at http://epp.eurostat.ec.europa.eu/cache/ITY_OFFPUB/KS-RA-07-013/EN/KS-RA-07-013-EN.PDF
GTAP (2013), Global Trade Analysis Project. Available at: www.gtap.agecon.purdue.edu [Accessed July 24th, 2013]
Miller, R.E., Blair, P.D. (2009) Input-Output Analysis – Foundations and Extensions, Cambridge University Press, Cambridge, UK.
Suh, S. (2005) Developing Sectoral Environmental Database for Input-Output Analysis: Comprehensive Environmental Data Archive of the U.S., Economic Systems Research, 17 (4), 449 – 469.
Suh, S., Weidema, B., Schmidt, J., Heijungs, R. (2010) Generalized Make and Use Framework for Allocation in Life Cycle Assessment, Journal of Industrial Ecology, 14(2), 335-353.
Suh, S. (2010) Comprehensive Environmental Data Archive (CEDA), In: Murray J. and Wood, R. (Eds.), The
Sustainability Practitioner's Guide to Input-Output Analysis, Common Ground Publishing, Urbana-Champaign, Il, USA.
Suh, S. (Ed.) (2009) Handbook of Input-Output Economics in Industrial Ecology, Springer, New York, NY, USA
Suh, S., Kagawa, S. (2005) Industrial Ecology and Inter-industry Analysis, Economic Systems Research, 17 (4), 349 – 364.
54
Wiedmann, T. O., S. Suh, K. Feng, M. Lenzen, A. Acquaye, Scott and J. R. Barrett (2011) Application of Hybrid Life Cycle Approaches to Emerging Energy Technologies – The Case of Wind Power in the UK. Environnemental Science & Technology, 45 (13), 5900 – 5907.
WIOD (2013) World Input Output Database. Available at: www.wiod.org [Accessed July 24th, 2013]
55
7. LIFE CYCLE MODELLING APPROACHES FOR ENVIRONMENTAL ASSESSMENT OF FUTURE-ORIENTED SCENARIOS: TOWARDS RECOMMENDATIONS FOR POLICY MAKING AND BUSINESS STRATEGIES. Minutes of the workshop Fulvio Ardente1, Camillo De Camillis1, Alessandra Zamagni2, Miguel Brandão3, David Pennington1, Bo Weidema4, Reinout Heijungs5, Tomas Ekvall6, Rolf Frischknecht7, Valeria Andreoni8, Philip Strothmann9, Thomas Dandres10, Rana Pant1, Eckehard Rosenbaum1, Constantin Ciupagea1, Paolo Masoni2, Morten Birkved11, Richard Murphy12, Maurizio Cellura13, Cristobal Irazoqui14, Matthew Brander15, Jan Paul Lindner16, Antonino Marvuglia17, Nicole Kalas18, Serenella Sala1, Malgorzata Goralczyk1, Erwin Schau1 1European Commission, DG Joint Research Centre, Institute for Environment and Sustainability (IES), Sustainability Assessment unit, Ispra, Italy 2ENEA (Agenzia nazionale per le nuove tecnologie, l’energia e lo sviluppo economico sostenibile), LCA & Ecodesign Laboratory, Bologna, Italy 3ILCA (International Life Cycle Academy), Barcelona, Spain 42.-0 LCA consultants, Aalborg, Denmark 5Leiden University, Institute of Environmental Sciences (CML), Leiden, the Netherlands 6IVL Swedish Environmental Research Institute, Stockholm, Sweden 7treeze Ltd., Uster, Switzerland 8European Commission, DG Joint Research Centre, Institute for Prospective Technological Studies (IPTS), Sustainable Production and Consumption unit, Seville, Spain 9UNEP (United Nations Environment Programme), Sustainable Consumption and Production Branch, Paris, France 10CIRAIG (Interuniversity research centre for the life cycle of products, processes and services), École Polytechnique de Montréal, Montréal (Qc), Canada 11Technical University of Denmark, Department of Management Engineering, Kongens Lyngby, Denmark 12Imperial College London, Department of Life Sciences, London, United Kingdom 13University of Palermo, ‘Dipartimento di Energia, ingegneria dell'Informazione e modelli Matematici’ (DEIM), Palermo, Italy 14European Commission, DG Connect, ‘Smart Cities and Sustainability’ unit, Brussels, Belgium 15Ecometrica, Edinburgh, United Kingdom 16Fraunhofer Institute for Building Physics IBP, Stuttgart, Germany, United Kingdom 17Public Research Centre Henri Tudor, Resource Centre for Environmental Technologies (CRTE), Luxemburg 18Imperial College London, Centre for Environmental Policy, London
7.1. DAY 1, DECEMBER 6TH 2012
7.1.1. Opening
After the introduction of the participants, D. Pennington (DP) outlined the rationale, aims and objectives of the workshop, including a summary of its structure over the two days. It was also highlighted the interest of various Directorates General of the European Commission (EC) in the outcomes of the workshop. Subsequently, the presentations of invited speakers started. C. Ciupagea (CC), Welcome speech The presentation started with a welcome to participants and a brief description of the Joint Research Centre (JRC), the mission of the Institute for Environment and Sustainability (IES) and the objectives and goals of Unit H08 (Sustainability Assessment). CC highlighted that the inherent characteristics of LCA are fully suitable for Sustainability Assessments. The outcomes of the workshop will be of great importance for the unit. In particular, the topic of the workshop was introduced, based on the question “how do we design scenarios to investigate future sustainability based on a lifecycle approach?” D. Pennington (DP), Introductory remarks The presentation focused on the expectations from the workshop, session overview and follow-up. DP evidenced the controversial points in the scientific debate on the modelling of future-oriented scenarios. Different methods (voluntary/mandatory) have been developed by the European Commission, which require different modelling approaches. Common LCA applications focus on the past or present - e.g. the attributional approach of “dividing the pie” - but future scenarios would require even more the assessment of indirect and rebound effects. The main expectations from the workshop are: to provide an overview of
56
different methods, their inter-relationship, their uncertainty, the setting of the future scenarios and the modelling of indirect and rebounds effects. The presentation concluded with the planning of the workshop and the expected follow-up. 7.1.2. Overview of mainstream practice on LCA
R. Pant (RP), European guidelines on process LCA: rationale and data modelling principles R. Pant focused on some ongoing JRC-IES research projects on process-based LCA. First, the project “Life Cycle based monitoring Indicators” was presented. It concerned the accounting of total environmental impacts associated to European production and consumption. The presentation also illustrated some achievements concerning the trends of emissions. The main assumptions of the study were presented (use of attributional approach, cradle-to-gate, and the crediting for some avoided impacts concerning the energy recovery and material recycling. Subsequently, the draft ENVIFOOD Protocol developed in the context of the “European Food Sustainable Consumption and Production Round Table” project was presented (Bligny et al. 2013). This Round Table aims at promoting a science-based coherent approach to assessing sustainable consumption and production in the food sector. Finally, the Product Environmental Footprint (PEF) guide was introduced (EC 2013). The PEF aims at capturing the overall life cycle impacts of a product and to ensure comparability of performances among different products. The PEF is based on an attributional approach (except in the modelling of the product’s end-of-life and in the procedures to solve process multifunctionality where credits are introduced). The presentation concluded with the need of the use of different approaches to address different questions and the need of guidance on how to set future-oriented scenarios. P. Strothmann (PS), Global Guidance Principles for LCA Databases: Focus on different modelling approaches The presentation went trough the “Global Guidance Principles for LCA databases” (UNEP/SETAC Life Cycle Initiative 2011) in order to highlight relevant points related to the topics of the workshop. The document is the key source outlining global agreement on definitions of 105 technical terms and specific definitions of three approaches: 1) attributional, 2) consequential and 3) decisional. In particular, the first approach attempts to provide information on what portion of the global burdens can be associated with a product. The second approach attempts to provide information on the environmental burdens that occur, directly or indirectly, as consequence of a decision. While all approaches are meant to support decisions in companies to improve the environmental profile of their products, the decisional approach has been specifically developed to optimise impacts within a company and support decisions. However it was highlighted that distinction among the competing approaches is not always clear. The presentation then highlighted some needs for datasets. Some key issues concerning data include: development of exchangeable datasets, maximisation of transparency, improvement of data documentation and review. V. Andreoni (VA), Input-Output Modelling and Analysis: Global Resources Use and Pollution This presentation focused on the developments at the JRC-IPTS on the application of the Input/Output (I/O) analysis for the investigation of the effects generated on economy by policies or some constraints in the use of resources. The differences among various available I/O databases have been also discussed. Finally the presentation illustrated results of some pocketbooks on impacts of “production, consumption and trade” (based on 6 environmental dimensions) for all EU and some non-EU, and some country factsheets. Discussion These presentations were followed by a first discussion. CC underlined that these presentations already identified disputable elements (e.g. on suitable LCA approaches and impact assessment). Some key issues were identified: the need to spread the knowledge (e.g. by further guidance documents), the need for integrating micro and macro analysis, and the need to solve problems related to data gaps. B. Weidema (BW) raised several questions to RP about the Life Cycle Indicators project (EC 2012). In particular, questions were posed on the use of an attributional approach to assess alternatives, the use of indicators, and potential problems related to consistency in the method, especially concerning the use of different methods for dealing with multifunctionality (in particular the crediting for waste and the use of allocation for all the rest). BW also raised a few questions on the PEF Guide (EC 2013). In particular, he
57
questioned to what extent the attributional approach of the PEF adopted from ILCD situation A (EC 2010) is in line with the global guidance for LCA databases (UNEP/SETAC Life Cycle Initiative 2011). RP answered that in the Life Cycle Indicators project three different sets of indicators have been used with different basket of products. Different approaches for allocation have been used, depending on the specific need. Concerning situation A of the ILCD this is a mix of attributional and consequential, constructed mostly to answer to policy requests. Concerning the PEF Guide, it was designed to allow comparison of performance of products, and it is mostly based on an attributional approach, except for a mixed approach for the modelling of end-of-life. BW questioned to what extent the PEF Guide is suitable for comparative assessments of products on the shelf. BW pointed out that an attributional approach is not comparative in nature, while for comparison we need to look at changes. T. Ekvall (TE) largely agrees with BW. In particular, he argued that the use of an attributional LCA for comparison is questionable, although largely applied by practitioners. LCA should be intended as a learning process more than a calculation tool. The JRC should focus on how to make the LCA learning process more efficient within the EC and also how to organise a study to make the learning as much efficient as possible. P. Masoni (PM) agrees with TE about the LCA as a learning process, but he underlined the need to provide support to policies, including the identification of policy needs and then the identification of the most suitable tool. C. De Camillis (CdC) fully agrees with PM. Depending on the specific policy needs, modelling approaches can be best chosen. However, when future-oriented scenarios are assessed for setting up policies and long term strategies, accuracy is normally preferred over precision. BW also agrees on the use of LCA as a learning tool. Furthermore, he argued that two models can be used in parallel to assess products: what are the impacts of products in the market, and what are the potential consequences of buying them. RP underlined that the LCA as a learning tool is important; however policy makers need in some cases precise figures for benchmarking and communicating with consumers. PEF has been designed to allow the production of better products, with several efforts to make it as transparent as possible. PM pointed out the application dependence of methods and the relevance of human behaviour as parameter that is not usually taken into account. DP commented that practical answers have to be provided. However, suggestions for improvement are welcome especially during stakeholder-consultation processes. M. Brandão (MB) highlighted some of the limitations associated with the use of an attributional approach to support decisions, as well as the product-dependency of modelling. PS highlighted the difficulty of achieving a global consensus, which can only be achieved by several consultations over an extensive period of time. He emphasized that harmonizing the different available guidance documents requires stakeholders to understand that compromises are ultimately necessary to achieve consensus. TE highlighted that for a company it can be important to know the current share of the impacts (‘divide-the-pie’) but also the future evolution of this share (attributional LCA in the future, i.e. how part of the pie can look like in the future). C. De Camillis (CdC) underlined the importance of using the same attributional framework when assessing baseline and future-oriented scenarios. The ISO standards provide general guidance, but specific guidance is needed for policy makers. Concluding remarks were summarised by CC. He underlined that JRC does not take decisions but helps the EC take decisions. Integrated approaches generally show to be the most flexible to solve problems. Further presentations followed. 7.1.3. Introduction to life cycle modelling approaches that can be used to assess future-oriented scenarios E. Rosenbaum (ER), Environmental and Socio-economic Scenarios for 2050 – Purpose and Methods ER discussed some relevant issues about the setting of scenarios (why? how? covering what?). The main reason for studying scenarios is to get insights on possible future trends. However, long-term predictions are not possible. The time frame is one of the most important variables in setting scenarios. Furthermore, the scenarios do not necessarily have to be likely, but only plausible and internally consistent. Scenarios have to be in line with the policy context where they are required, and they should cover environmental as
58
well socio-economic issues. Some important variables to be considered are: population, societal issues, consumers’ choices. More guidance on how to develop sustainability scenarios was recently issued by the JRC (Rosenbaum et al. 2012). Discussion On this presentation DP commented the difficulty of predicting the future due also to changing of preferences. Time horizon was confirmed as very relevant (short-term predictions are more reliable). Furthermore DP pointed out the difficulties of setting more than a single scenario when modelling systems according to the consequential approach. A. Zamagni (AZ) pointed out the need of structured information to put the problem in the right context. Also qualitative information should be taken into account in the decision context, because relying only on quantitative data is not enough when long term developments are considered. When it comes to social assessments, it was acknowledged the work done on Social LCA by the UNEP/SETAC Life Cycle Initiative (2009). T. Ekvall (TE), Scenario types and possible approaches to implementation in LCA The presentation pointed out how scenarios can be used in LCA. Also the goals of scenarios can be different, e.g. to predict what will happen, or to assess the effects of a strategic decision in different plausible scenarios, or what transformation are needed to move the future towards a desired scenario. Based on this, the presentation illustrated different typologies of scenarios, mainly grouped on: predictive (how future will evolve), explorative (broader range not necessarily likely) and backcasting (what should be transformed to achieve some results). Different typologies also cover different time frames. The typologies of scenarios were then illustrated by the evolution of Nordic-electricity production systems and some recycling systems. Discussion DP raised some questions concerning: 1) the use of single or multiple scenarios (to avoid the idea that the future could only have a single direction), 2) the use of consequential vs attributional approaches, 3) application of backcasting for sustainability assessment. TE replied that a set of several scenarios can be used to cope with uncertainties and investigate the robustness of different options. Both attributional and consequential LCA can, at least in principle, be applied in all types of scenarios. Backcasting LCA could be useful for assessing the sustainability of possible options. CdC asked about the possibility of combining attributional and consequential approaches. TE replied that both approaches can be used separately, but their combination is not desirable to avoid inconsistencies. M. Brandão (MB), Overview of life cycle data modelling approaches This presentation gave an overview of life cycle data modelling approaches. MB argued that reality should be modelled as close as possible. Different dimensions and different approaches were illustrated in a chart. The presentation also highlighted the shortcomings associated with using hybrid (attributional and consequential) approaches, as well as making the adoption of the approach dependent upon different contexts, which would result in inconsistent messages. MB identified the trade-off between flexibility on one hand, and scientific robustness and consistency on the other. Furthermore, rebound effects are very relevant in the assessment of future scenarios, and these, according to him, are captured only by a consequential approach. Finally, the presentation pointed out the difference between precision and accuracy, and the preference in some cases of accurate results (e.g. close to reality) even if not precise. Discussion AZ highlighted that accuracy is certainly important because it allows being comprehensive in the description of the system and in its assessment. However, it is also important to understand in which situations we need to be accurate and in which one we need to be precise. . Moreover, she pointed out the limits of linear approaches: the scaling up of the functional unit from 1 kg to the total quantity is a process that involves dynamics and it is quite far from being linear. C Irazoqui (CI) asked if different approaches can be used as decision tools. MB replied that both are currently used, although an attributional approach has larger limitations due to the omission of the assessment of indirect effect (e.g. substitution and rebound).
59
DP stated the need of precise results for some policies, and this could be provided by the attributional approach on an absolute term. MB replied that the attributional LCA is however uncertain due e.g. to the application of arbitrary allocation rules. Furthermore, precise-enough results can be reached with a consequential approach. Greater precision does not justify the greater uncertainty associated, MB said. BW underlined the impossibility to mix different approaches. As soon as a consequential approach is adopted, it the whole system is to be modelled consistently. 7.1.4. Case studies: part 1 R. Frischknecht (RF) (via videoconference), Attributional and decisional LCA: an illustrative case study on electricity supply This presentation underlined the use of LCA for very different purposes. However, practical guidance is generally missing, also for very important examples as e.g. modelling of electricity. This presentation raised the question of whether decision support implies a consequential approach. For example, a stone in a calm pound would cause visible effects (waves) while the same stone in a storming see would cause similar effects that, however, cannot be seen. Individual decisions are generally overlaid by several simultaneous decisions that cannot be modelled. Therefore, an innovative approach was proposed: the decisional approach, to support companies to improve their environmental profile based on some adopted decisions (e.g. changes of suppliers). The decisional approach could be used for modelling LCA with the purpose of medium-scale decision making (e.g. strategic decisions of large companies). During the presentation, RF provided also a criterion, based on the relative economic size, to classify objects of investigation and the LCA goals related to them into three groups, which represent the three modelling approaches of attributional (reporting, product labelling and declaration), decisional (strategic decisions of large companies) and consequential (large scale decision making). Finally, the decisional approach was illustrated with reference to the assessment of an electricity mix. Discussion RF agrees with BW on the lack of internal consistency when mixing up approaches as it is now in the PEF Guide. TE argued that the use of such decisional approach is not clear, especially in the accounting of the overall effects. RF replied that the aim of the decisional approach is not to calculate the overall effect but those related to the considered product for the considered scope. BW referred to previous publications of RF on the decisional approach, in which RF states that the approach is aiming at an optimization within a societal target, and asked whether the fact that RF did not mention this in his presentation, means that this position has now been abandoned. RF replies that the approach has not been changed and that a societal target is indeed still required. RF also added that decisional LCAs are used to effiicently allocate the scarce environmental resources as defined in the societal target. BW questioned why the scale of the decision should imply different modelling. BW also wondered why the decisional approach should be considered different from consequential. RF replied that this approach splits the impacts similarly to attributional, but however it helps to optimise impacts within a company and support decisions. J.P. Lindner (JPL) asked how to set the boundary between the application of different approaches, and RF recognised that this is a critical issue to be further investigated. DP asked if the decisional approach can be seen as a hybrid approach. RF showed reservations on the use of hybrid approaches: decisional is still the “divide the pie” approach with the modelling of some ‘holes’ (or parts of the pie that will change). R. Heijungs (RH), Back-casting LCA: deriving methodological rules for assessments of normative scenarios This presentation focused on the modelling of backcasting LCA. The use of LCA for sustainability assessment implies the modelling of environmental, economic and social issues. To some extent the sustainability assessment is easier than modelling these three dimensions separately, but each pillar is more difficult than how it is normally modelled (e.g. the economic pillar is much more than just costs). Subsequently, the differences between attributional and consequential approaches were discussed. In particular, it was highlighted that an attributional approach is based on arbitrary choices about the partitioning of impacts. Conversely, the consequential approach focuses on introducing something new and measuring the effects (in principle, consequential effects could also be checked empirically). The use of LCA
60
for sustainability assessment would require a rethink process of the LCA, starting e.g. from the functional unit that should be substituted by a complex vector (commodity basket). Also, impact assessment (oriented to the targets) and algebra should be changed. Discussion JPL agreed on the classification of the attributional approach as arbitrary. Furthermore IAN (PE) and subsequently PS highlighted the need in the backcasting approach of setting thresholds (targets) for the assessment. RH agreed that this is a critical issue of the method but, anyway, thresholds have to be set even if not largely accepted/agreed. RF underlined some similarities between the decisional approach and the previously described backcasting approach, especially in the setting of the functional unit. TE underlined the different meaning of backcasting in his presentation, mostly focused on how to assess the foreground system in the context of a desired background system. DP argued about the risk of moving away from the functional unit that is nowadays largely adopted in the policies. Furthermore, DP wondered how backcasting could be practically used to provide some “numbers”, as this is the need of policy makers for their decisional processes. RH replied that backcasting could be an additional method, but this does not exclude traditional micro-analyses. PM asked how social issues should be modelled, and RH replied that a lot of work still has to be done. A. Marvuglia (AM) highlighted the need of setting thresholds to the ‘h’ vector (related to the life cycle impacts), and the risks that the results could be a mathematical solution without a physical sense. In particular, if the matrix “B” modelling the economy is supposed to be unchangeable, the backcasting approach could result only in a reduction in consumption. RH agreed on these comments, including the need of a careful setting of thresholds. 7.1.5. Case studies: part 2 B. Weidema (BW). Consequential LCA: a case study capturing indirect land use change BW highlighted that LCA at the computational level is very easy, but that the main difficulties are related to the way of modelling the systems, including the identification of what is comparable, what datasets are to be used and how to handle co-products. The principles of consequential LCA have been then illustrated on a case-study on the intensification of land use. It was underlined the relevance of indirect land-use, which in some cases can be larger than those of the direct land-use. These differences cannot be assessed through the attributional approach. Discussion PM raised some concerns about the uncertainties of a consequential approach, especially about the assumptions or the marginal technologies considered. For example, for developing countries, marginal technologies can involve the use of old and not “environmental-friendly” production processes. Furthermore, land use changes can be cause of food shortage in some areas. BW confirmed that temporary effects are possible. It is assumed that the purchase of e.g. 1 kg of steel will stimulate the production of an equivalent amount, to be produced with the most competitive available technology, which is not necessarily the cleanest one. RH underlined that results of attributional and consequential are not comparable. Furthermore, attributional LCA generally does not respect mass balances but this is not necessarily a problem, being linked to the goals of the analysis. Finally Impacts of systems “A” and “B” are not equivalent to impacts of the system “A+B”, being the two not really independent. DP also underlined some uncertainties related to consequential LCA, especially due to the system expansion and the associated identification of the products substituted by co-products, which are generally not the same. Furthermore, DP raised some concerns about how to mathematically model the consequential approach and how to identify the marginal suppliers. BW underlined that when using prices in the modelling, it is preferable the use of long-term trends to minimise the effects of price fluctuations. He also underlined that attributional LCA is similarly affected by uncertainties (e.g. allocation problems). System expansion was difficult some years ago due to missing data; however, now databases are generally complete and system expansion is no longer a problem. VA and JPL asked how to model future technologies and substitution when referring to long-term previsions. BW replied that the considered time frame is an essential assumption and uncertainties depend on the considered technology. Repeating the same question in the future could have different results, due to different background information.
61
T. Dandres (TD). Consequential and prospective LCA at a macro level: a case study on electricity supply TD highlighted that policies may harm the environment and the human society. There is a need to assess policies from a global perspective. The modelling has to be therefore consequential (to capture indirect effects) and prospective (over a long period of time). To model economic changes caused by polices TD suggested the use of the GTAP (1997) model, which uses a publicly available global database containing bilateral trade information, transport and protection linkages. Subsequently, TD presented a method (based on GTAP and international databases) to study large changes due to policies occurring in several life cycles, and an application to a case-study (comparison of two energy policies). Indirect land use change was not included. The main conclusion was that the European bioenergy policy seems better than the baseline policy for human health, climate change and natural resources, but not for impacts on ecosystems. Also, an uncertainty analysis was illustrated, showing however minor changes in the comparison of the two policies. Discussion DP recognised the high relevance of this approach for European policies, involving also various departments dealing with similar issues. PM highlighted about some crucial aspects of the presented study, as the mapping of the processes, the setting of the scenarios, the need to model the whole economy and the use of databases (Ecoinvent). TD recognised the risk of double accounting in the modelling, which is solved by cutting the process chains. TE recognised the potential interest for this innovative approach combining different models and would be glad to see further researches on this topic (e.g. scientific publications). DP asked why indirect land use changes are not modelled. TD replied that these changes are not taken into account in the GTAP standard version 7 and cannot be simply modelled by GTAP. However, recent developments allow now modeling of land use change in the extended version of the GTAP model. AZ asked about the robustness of the results, given the many sources of uncertainties (economic forecast, GTAP database, GTAP model, mapping of the processes in the Ecoinvent database). TD replied that although assumptions are largely uncertain, few differences have been observed in the uncertainty analysis in that specific case study. TE underlined the risks of using “black box” tools, such as GTAP. TD replied the need of involving GTAP developers to increase the transparency of results. The meeting day was concluded by DP who summarised the main issues of the day and, in particular, the need for an interdisciplinary approach for the analyses of policies.
7.2. DAY 2, DECEMBER 7TH 2012
7.2.1. Opening
D. Pennington (DP), Summary of day 1 The meeting started with a summary of the previous day's presentations by DP. He highlighted that different interesting models/methods/approaches have been illustrated. In particular DP recalled the following discussed issues:
- LCA as a learning tool, also for policy makers. - Several discussions are possible at the micro/meso/macro level, with different methods suitable for
each one and, in particular, the use of attributional vs consequential approaches. - How to ensure consistency of results? How to handle data-gaps? - Setting of relevant scenarios, involving multidisciplinary domains. - Modelling of uncertainties. - Selection of relevant indicators - Understanding of relationships between different approaches - Differences between absolute results and marginal changes - Direct vs. indirect effects and their relevance for various sectors (i.e. non only for agriculture) - Relevance of different approaches depending on the considered time frame and/or geographical
context. - There are well-established examples of Environmentally-extended I/O models and economic tools
combined with LCA tools
62
- Difficulties in modelling substitution and potential credits in system expansion. However, this is more an academic issue than an issue for the scope of the workshop.
- The difficulties of setting thresholds and system boundaries in the backcasting modelling. Some further considerations were also presented by CdC. He recalled the aims of the workshop, including:
- To provide an overview of different methods/approaches focused on future-orientated modelling - What is their interrelationship and complementary nature is - How they can be linked to e.g. scenario analysis and existing baselines - What business/policy questions can they can help answer, and what not - How to capture e.g. future indirect and rebound effects
In particular, CdD underlined that the workshop intended to analyse the technical specificities of the different approaches (e.g. modelling assumptions, internal consistency, accuracy, etc.). This is crucial to best understand to what extent each approach is able to meet the needs of policy makers in various contexts. The relevance of the scenario types depends on the question at hand. Different types of scenarios have been, for example, presented by TE. Predictive and exploratory scenarios can be particularly relevant for policy makers. Furthermore, explorative scenarios can be useful to evaluate different alternatives, while backcasting could be relevant for long-term planning. Also indirect land use changes have been highlighted as a key issue by some speakers: these changes can be captured only by the consequential approach. Finally CdC illustrated some of the open questions for discussion, including:
- Which modelling approaches are able to capture substitution, indirect effects, rebounds? - What are the key modelling assumptions? - How different approaches can be complementary?
DP added the general emphasis during the workshop on the use of economic models and the need of modelling changes in the considered systems. Subsequently, some new presentations followed, aimed at providing further inputs for the discussion. 7.2.2. Life cycle modelling approaches, scenario typologies, application contexts
A. Zamagni (AZ). What data modelling approaches for what application context AZ highlighted the differences in the perspective of policy makers (mainly comparison of scenarios and implementation of improvement actions) and business sectors (mainly corporate decisions). However, AZ noticed that it is still not fully acknowledged the need of different models and the need to tailor the models to the nature of the questions. Some relevant issue include: the need of involving stakeholders in the “goal and scope” definition, the model of trade-offs, the focus on framing the question, as different decisions imply different modelling approaches and the need of having a meta structure that can guide the assessment. In addition, the setting of future scenarios is affected by several uncertainties, such as: complexity of the system, insufficient knowledge, role of human volition and reflexivity of knowledge. The combined use of different approaches is potentially useful but is affected by additional uncertainties related to their integration. Uncertainties increase with the time frame adopted. Different approaches can deal with the future, as for example: attributional in the future (how to share impacts of systems in the future?); consequential (Insights into the future provided by the scenarios in the background); decisional (still under development); macro-LCA (to model large changes). Regarding consequential LCA, two main aspects were highlighted: the role of transient periods (which are neglected) and the identification of marginal technologies (not just one but a mix). Four main questions for the discussion have been identified:
1. How environmental footprint methodologies can be used to assess future scenarios 2. How can life cycle modelling approaches be combined with scenario analysis? 3. How to assess future scenarios and the enforcement of alternative policies? 4. How to assess the implications of long-term business strategies?
M. Brandão (MB). Overview of life cycle data modelling approaches MB presented a graphical overview of different models, considering different dimensions e.g.: time frame (short/middle/long term), approaches (consequential, decisional, attributional), data (process analysis, I/O and hybrid methods). Different combinations of these aspects are proposed by several modelling guidelines, for example, related to different goals (ILCD situations A/B/C). However, MB questioned the real necessity of using different modelling approaches for different contexts, which is both inconsistent and uncertain. Excessive flexibility could lead to inconsistent assessments and to conflicting messages. Furthermore, the use of different modelling approaches can affect the reproducibility, comparability and
63
robustness of results. MB stimulated a discussion on this issue, specific to the main goal of the workshop, which is to support for EC's objectives. Some open questions for discussion are: What are the key features of data modeling approaches? What questions different models can answer? How different models can capture indirect and rebound effects? What are the relationships between attributional vs. consequential to model future scenarios? Finally, the differences between precise (low variability) and accurate results (close to reality) from modelling have been illustrated. Discussion BW highlighted the relevance of using graphical representations of the available approaches to narrow the discussion. However, not all possible combinations are relevant, while other dimensions could be added such as the extent of the analysis (BW) or the question that is intended to be answered (PM). Additional issues were raised:
- JPL underlined that it is more relevant to discuss how to define future scenarios than discussing the use of attributional and consequential approaches,.
- TE presented a slide about how to model the background system: modelling depends on the considered time horizon. For example, short/medium term analyses allow assessing the performance of the scenarios; medium/long term analyses allow assessing the robustness of the scenarios; while long-term analyses allow assessing the sustainability of future scenarios.
- ER reiterated the relevance of setting time frames and scenarios. The key issues are transparency and the use of realistic assumptions. For example, the total failure of economic models to predict the current economic crisis was due to the inherent assumptions of the economic models.
- RH iterated the need to move away from standard LCAs, e.g. from the traditional definition of the functional unit.
- PM discussed different goals of the analyses, as the assessment of future implementation of policies and/or the allocation of responsibilities to different actors.
- DP highlighted that the Product Environmental Footprint (PEF) Guide is currently focusing on the impacts of products. Consequences of decisions are not captured by PEF Guide but should be observed by other specifically focused methods. Furthermore, the robustness of models (especially economic ones) should be assessed.
- BW highlighted the relevance of using hybrids methods in terms of IO and LCA, which try to use the best of both process-based and I/O models. According to his experience, BW supported the use of consequential approaches independent from the scale of the analysis. The biggest limitation is the data availability.
- PS highlighted the relevance of considering policy constraints in developing scenarios. - PM argued that, although a full harmonisation of models is not possible, procedures to drive policy
makers could be helpful. These procedures could include the definition of the objectives, the optimal method for each objective and the running of the tool. Furthermore, there is a need of control tools to assess the results and avoid unrealistic conclusions.
- DP reiterated the need of recalling a general life cycle thinking approach integrated to policies, before setting any specific calculation models. Good policies take into account changes in the systems.
- TD supported the idea of a toolbox. Furthermore, it is relevant to set the considered technologies in the background system. Economic models can be useful to model the complexity of our economy as well as to explore specific sectors.
- AM highlighted that, being the problem complex, it is probably not worth to simply it excessively. - DP agrees that the complexity of the questions influence the modelling. However, it is already
useful for policy makers to understand what method could be useful. - JPL noticed that both attributional and consequential have large limits: the former approach is
based on arbitrary choices (e.g. allocation) while the latter is not focusing in real changes in the world but in the assumed ones.
- BW identified the difference between a complex and a complicated system7. A complex system can be modelled by simple rules. There is a strong need of policy makers for simplified tools. The
7 A complex system is “a system in which large networks of components with no central control and simple rules of operation give rise to complex collective behavior, sophisticated information processing, and adaptation via learning or evolution” (M. Mitchell 2009).
64
objective is to make models as complex as needed and as simple as possible. Furthermore, BW criticised the adoption of Product Category Rules (PCRs) and, in general, the use of different rules for different products, which does not avoid inconsistencies.
- DP and RP, on the other hand, supported the use of PCRs to handle specific issues. However, PCRs cannot deviate from the general approach. Finally, also communication of results is an important issue.
- Furthermore, DP noticed the need of modelling the transient periods and the use of non linear models. The difficulty of modelling is particularly relevant for indirect effects. Some indirect effects could be, for instance, counterbalanced by other indirect effects of other economies.
7.2.3. Panel on how to assess future-oriented scenarios
During the afternoon, a panel of experts was established involving: BW, RH, TD and TE. The panel had the objective of summarising their conclusions from the two-day discussion, providing some recommendations and responding to the questions from other participants. The main comments from experts were the following:
- TE summarised that there is not a unique model available. Consequential and attributional LCA are both valid approaches. Situations A, B and C1 in the ILCD Handbook and the Decisional LCA seem to be hybrids and, therefore, should be avoided. However, more relevant to the topic of this workshop is the type of information we can obtain about the future. Then the selected time frame is an essential parameter: short-term analyses should be based on forecasts; medium-term on plausible scenarios; long-term on sustainable scenarios. Different methods can be used for predictions / explorations / backcasting. In particular, two types of backcasting are possible: top-down and bottom-up. LCA should be considered as a learning tool. Harmonisation is potentially important. In addition, TE underlined that simplified approaches are good, but in some cases, complex answers can be useful.
- BW voiced the opinion that situation B in the ILCD Handbook is purely consequential and not a hybrid.
- TD reiterated the need for using different methods and tools for different scopes. Very important is the setting of the right questions that the tool is intended to answer. It is not a problem if different tools bring different results, because this is a learning process. However, it is important to ensure the transparency of the analysis. Guidance documents are needed.
- RH highlighted that the tools adopted depend on the considered time frame. There is not only one method for all possible questions (no “one fits all”). For use in policies, it is necessary to set the scale of the analysis. Furthermore, it is important to handle some key issues differently from traditional LCAs as: displacement effects, allocation, functional units.
- BW pointed out that, when studying the consequence of decisions, the only relevant model is a consequential model. A combination of consequential and attributional is never good (loosing the internal consistency of the approaches). Decisional approach is not a hybrid, but a third possible approach relevant for optimization within a target. Some additional slides were then presented. BW noticed that the most important issue in future analyses is the setting of the scenarios. It is always necessary to use the best available data. IPAT equation was illustrated as concept at the basis of the assessment. LCA is already based on it, with due simplifications on the type of dependencies among the parameters of the equation.
AZ asked TE whether or not guidance documents, like the one described in her presentation, can be useful setting the problem and identifying then the different models. TE replied that this is possible but it is necessary to involve stakeholders to draft said guidance. AZ also asked BW if non-linear models can be adopted. BW replied that non-linear models applied in a complex model might potentially cause chaotic behavior. Linear models can be a reasonable reflection of non-linear situations. It can therefore even preferable to apply more difficult linear models than a simpler non-linear one, BW said.
Unlike complicated systems, complex systems are made up of multiple components that interact with each others to various extents. Emerging behaviours cannot be inferred just summing the actions of each single component, AM said.
65
BW reiterated that the consequential approach is useful to account for rebound effects. TD highlighted the need for avoiding double counting. AZ asked also how to account for ethical values and normative positions in the assessment. BW replied that LCA is an optimisation model, and there is just one position, i.e. the utilitarian perspective. CdC reiterated the need of using the consequential approach to model macro-LCAs and the general consensus on the transparency of the model. CdC also highlighted the relevance of the introduction of the life cycle thinking concept into policies. On this topic, PS added that life cycle thinking can help policy makers to broaden their knowledge of the problems. However, RH argued that it is always better to quantify: life cycle thinking can be good for communications but potentially not for policies. Also, MB highlighted the need for quantitative assessments of policies. In addition, he raised some concerns on the use of differentiated approaches depending on the potential questions/applications, as consistency is more important than flexibility. On this topic, RH added that the need of flexibility does not imply that everything is ok: some rules are however necessary. TE added that LCA practitioners can influence the results and, therefore, the policies through the methodological choices of system boundaries, assumptions, etc. RH said that LCT is perfect for communication but not for policy. S Sala (SS) provided arguments against this point, making reference to the present European policies (e.g. bio-fuels). SS questioned how to best calibrate impact assessment relatively to the scope each policies. Some issues are in fact missing in the impact category framework and, for comprehensiveness, should be better investigated. MB said that if you cannot measure it, you cannot manage it. RH replied that also things that we do not know can be included in the assessment anyway. BW replied that the real issue is about data availability more than other LCA issues. AZ reiterated the need of tools (as that provided by TD), however raising some concerns about the combination of different models and their combined uncertainties. TD replied that combining tools is potentially good, but this should be limited to some specific extents: a tool fitting for everything is not possible. BW is not in favour of combining different models, because each model has its own consistency. They can be used in parallel, since one can inform the other, but not integrated: they should be run independently. Finally, DP summarized the main conclusions of the workshop, in relation with the expected objectives. In particular, DP underlined that:
- the workshop was successful in providing an overview of different methods/approaches - the inter-relationships among different modelling approaches have been raised by several
participants - examples on how different models can be linked have been presented and discussed - concerning questions to be answered, this largely depends on the considered time frame and the
scale of the analysis - the accounting of indirect/rebounds effects has been discussed, although the positions of experts
on this topic are not converging. Finally, CdC summarized the follow-up of the workshop, including:
- distribution of slides presented during the workshop - preparation of a workshop report, including remarks and feedback from the expert panel - distribution of the workshop minutes for comments and their subsequent publication - preparation of a journal paper (by the organisers and the speakers) summarising main outcomes of
the workshop.
66
REFERENCES
Bligny, J.-C., Pennington, D., De Camillis, C., Palyi, B., Bauer, C, Schenker, U., King, H., Martin, N., Ponsioen, T., Unger, N., Lundquist, L., Draucker, L., Blomsma, C., Sueys, R., Papagrigoraki, A.,Vessia, O. (2012) ENVIFOOD Protocol. Environmental assessment of food and drink products Protocol. The European Food Sustainable Consumption and Production (SCP) Round Table, Brussels, Belgium [under testing].
EC (2010)The International Reference Life Cycle Data System (ILCD) Handbook - General guide for Life
Cycle Assessment - Detailed guidance. European Commission (EC), Joint Research Centre, Institute for Environment and Sustainability. Publications office of the European Union, Luxemburg.
EC (2012) Life cycle indicators framework: development of life cycle based macro-level monitoring
indicators for resources, products and waste for the EU-27, European Commission (EC), Joint Research Centre, Institute for Environment and Sustainability. Publications office of the European Union, Luxemburg.
EC (2013) Product Environmental Footprint (PEF) Guide. Annex II to the Communication from the
Commission to the European Parliament and the Council, Building the Single Market for Green Products Facilitating better information on the environmental performance of products and organisations. COM(2013) 196 final. European Commission (EC) Brussels, 9.4.2013.
Mitchell, M. (2009) Complexity: A Guided Tour. Oxford University Press. Oxford, USA Rosenbaum, E.F., L. Benini, and B. Ciuffo (2012) Development of Sustainability Scenarios. European
Commission (EC), Joint Research Centre, Institute for Environment and Sustainability. Publications office of the European Union, Luxemburg.
UNEP/SETAC Life Cycle Initiative (2009) Guidelines for Social LCA of Products, United Nations
Environmental Programme, Paris, France. UNEP/SETAC Life Cycle Initiative (2011) Global Guidance Principles for Life Cycle Assessment Databases -
A Basis for Greener Processes and Products, United Nations Environment Programme, Paris, France.
67
8. ADDITIONAL REMARKS
This chapter presents remarks submitted during the consultation period by either those members of the advisory boards who could not make to join the workshop or by those who wanted to share further thoughts on top of those already captured in the previous chapter. Workshop participants as well as members of the advisory board and scientific committee were not invited to further comment on this chapter after the consultation period.
For useful use of LCA in policy making, the policy maker needs to understand the context of its use and potential impacts in the real world, in particular where LCA results are used to regulate access to markets, which may pose a set of challenges never encountered by LCA practitioners in peer-reviewed journals and other areas where LCA knowledge normally is exchanged. Therefore, guidance for policy makers in the use of LCA in such circumstances needs to take into account the context and the potential political ramifications its employment may entail. Recent serious political ramifications arising from LCA results applied to policies in Europe can be found for example in the context of: a) the implementation of the sustainability criteria for biofuels under the Renewable Energy and Fuel Quality Directives (EC 2013a); b) the discussions about indirect land-use change emissions from biofuels (under the same Directives) and finally (EC 2013b); c) the implementation of a methodology to calculate emissions from fossil fuels used in the EU under the Fuel Quality Directive(EC 2013c). All these 3 examples offer important lessons to learn in the context of using LCA to regulate prices or the access to premium markets, and may be a starting point for criteria guiding the use of LCA in such circumstances (note that this is different from assessing the impact of a policy, or LCA applied for policy making support, where the key criterion is accuracy):
• Firstly, the LCA method and scope needs to be relevant for the regulated parties, and the LCA result under their control or influence. As way of example, the operative sustainability criteria for biofuels are based on attributional LCA, where the biofuel producers are in control of the emissions occurring along their supply chain.
• Secondly, the LCA results needs to be re-produce-able and transparent. This make "black-boxes" difficult to use, as all assumptions and input data need to be available and e.g. complex modelling of market interactions are not accessible for those being regulated. As an example, the "black-box" nature of consequential LCA modelling for estimating indirect land-use change emissions has constantly been highlighted by the biofuel industry.
• Thirdly, the LCA methodology needs to be highly consistent. Any market actor that is e.g. loosing market shares due to the LCA results will use every power available to find inconsistencies, with the aim of undermining the process and the proposed legislation. This is in particular important when the products in question are traded internationally and WTO rules may apply. This means that any arbitrary assumptions and value-based choices will be detected and pressure to change the method will build up. An example is the implementation of a methodology to calculate
68
emissions from fossil fuels used in the EU, where the proposed higher LCA value for oil sands (compared to conventional fossil fuels) has brought to a halt the entry into force of the Fuel Quality Directive, due to claims that the method is unfair and not consistent.
• Fourthly, as a LCA would typically only regulate a sub-sector of an economy (like biofuels among agricultural products), it's moreover important that the scope and rules takes into account potential shifting of emissions to sectors that are not regulated. If e.g. milk would have a GHG obligation, while the obligated party (the farmer) would have great incentives to allocate as much emissions as possible to the meat, skin, and other co-products of the cow other than the milk.
• Finally, one sometimes need precision above accuracy if specific thresholds for performance are applied, or high level of competitiveness, as 1% difference can determine whether a product performs above or below the threshold or relevant benchmark.
Different LCA methodologies fair worse or better against the above mentioned criteria, and without attempting to judge which is the best suited approach for regulating biofuels (as way of example of how the political ramifications influence the final success of using LCA in policy making), one may observe that while consequential LCA modelling may be more relevant to answer the policy question "should the EU support biofuels to save global GHG emissions?", the methodology may not provide the transparency, re-produce-ability and consistency needed for regulating premium market access for specific batches of biofuels in a competitive market environment8. Therefore, for certain applications of LCA and contrary to intuition, it is necessary to have precise, transparent results (although not necessarily covering all indirect effects), rather than being approximately right. Such subtle differences are complex, and guidance is needed to help the successful uptake of LCA for legislative merit-based LCA modelling product policy making, aiming at using LCA results e.g. for determining prices and market access. REFERENCES EC (2013a) Biofuels – Sustainability Criteria, European Commission (EC), Energy. Available at
http://ec.europa.eu/energy/renewables/biofuels/sustainability_criteria_en.htm [Accessed July 24th 2013]
EC (2013b) Biofuels – Land use change, European Commission (EC), Energy. Available at http://ec.europa.eu/energy/renewables/biofuels/land_use_change_en.htm [Accessed July 24th 2013] EC (2013c) Fuel Quality, European Commission (EC), Climate Action. Available at http://ec.europa.eu/clima/policies/transport/fuel/documentation_en.htm [Accessed July 24th 2013]
8 That is also one of the reasons why the Commission has not included consequential ILUC-factors in the sustainability criteria in its proposal of October 2012. Proposal and Impact Assessment available here: http://ec.europa.eu/energy/renewables/biofuels/land_use_change_en.htm
69
8.2. ADDITIONAL THOUGHTS TO STEER THE PROCESS TOWARDS RECCOMMENDATIONS Alessandra Zamagni ENEA (Agenzia nazionale per le nuove tecnologie, l’energia e lo sviluppo economico sostenibile), LCA & Ecodesign Laboratory, Bologna, Italy
There could be two aspects that could be considered, as a basis for further discussion in the future:
• The perspective of stakeholders, when setting the assessment at different scales; • How to connect (or “reconcile”, according to Felix Creutzig), the top-down and the bottom-up
modelling.
Regarding the question of stakeholders, they play a fundamental role when complex problems – such as those related to policy – are discussed, and they are strictly connected to the type of answer and problem we are addressing. Theoretically, in the goal and scope phase of LCA, the interested parties should be involved in order to better define the decision context and the purpose of the study, but in practice an LCA is carried out for one actor only. Depending on the scale of the problem and of its consequences, different types of stakeholders can be involved, and it would be relevant to map those potentially affected by the environmental, economic and social aspects of the proposed project. This would have a twofold purpose:
i) to identify mechanisms (cause-effect relationships) relevant for the analysis, and the type of mechanisms to address defines the type of modelling technique to be adopted;
ii) to bring values (that are an unavoidable elements of the analysis) into the analysis in a more robust way. Moreover, stakeholders will not only serve as audience but as active, informed and responsible parties in the decision making process.
As far as the reconciliation of top-down and bottom-up approaches is concerned, I consider an important aspect to be discussed how to link the different levels of the analysis and consequences, i.e. how many decisions at the micro level work out at the macro level, for total society and viceversa. Creutzig et al. (2012) wrote a nice paper on this aspect, with an example in the bioenergy assessment, and they proposed an integrated hierarchical modelling framework in which consequential LCA and integrated assessment models are main ingredients. Overall, in my perspective the discussion on approaches for environmental assessment of future-oriented scenarios should consider these three main ingredients, which are common to any sustainability assessment: - Complexity (multi-disciplinary knowledge, multi-spatial and time scales). - Uncertainty (many variables to take into account, and poor information and data available). - Urgency (urgency of processes, such as climate change). Strengths and weaknesses of the different modeling approaches could be evaluated against these criteria. REFERENCES Creutzig, F., Popp, A., Plevin, R., Luderer, G., Minx, J., Edenhofer, O. (2012) Reconciling top-down and bottom-
up modelling on future bioenergy deployment, Nature Climate Change, 2(5), 320–327
70
ANNEX A: WORKSHOP AGENDA
Life cycle modelling approaches for environmental assessment of future-oriented scenarios: towards recommendations for
policy making and business strategies
Grand Hotel dei Laghi, via Lazzaretto 1, Somma Lombardo (Va), Italy December 6th‐7th, 2012
DAY 1
[08:45 – 09:00] Registration of participants
OPENING
Constantin Ciupagea, EC, JRC, IES, Head of Unit, Sustainability Assessment unit, Italy [09:00 – 09:10] Welcome speech
David Pennington, EC, JRC, IES, Sustainability Assessment unit, Action leader, Italy [09:10 – 09:20] Introductory speech on the importance of quantitative life cycle thinking approaches to support sustainability assessments and workshop expectations
[09:20 – 09:30] Coffee break OVERVIEW OF MAINSTREAM PRACTICE ON LCA Chairs: Constantin Ciupagea and David Pennington (EC, JRC, IES)
Rana Pant, EC, JRC, IES, Sustainability Assessment unit, Italy [09:30 – 09:50] European guidelines on process LCA: rationale and data modelling approaches (ILCD Handbook, Environmental Footprint methodologies, ENVIFOOD Protocol, PCRs, Life Cycle Indicator methodology)
Philip Strothmann, UNEP/SETAC Life Cycle Initiative, France [09:50 – 10:10] Global Guidance Principles for LCA databases
Valeria Andreoni, JRC, IPTS, Spain [10:10 – 10:30] Input‐Output Modelling and Analysis: Global Resources Use and Pollution [10:30 – 10:50] Discussion
INTRODUCTION TO LIFE CYCLE MODELLING APPROACHES THAT CAN BE USED TO ASSESS FUTURE‐ORIENTED SCENARIOS Chairs: Alessandra Zamagni (ENEA) and Camillo De Camillis (EC, JRC, IES)
Eckehard Rosenbaum, EC, JRC, IES, Sustainability Assessment unit, Italy [10:50 – 11:10] Environmental and Socio‐economic Scenarios for 2050 – Purpose and Methods [11:10 – 11:30] Discussion
71
Tomas Ekvall, IVL Swedish Environmental Research Institute, Sweden [10:30 – 11:50] Scenario types and possible approaches to implementation in LCA [11:50 – 12:10] Discussion
[12:10 – 13:40] Lunch Miguel Brandão, International Life Cycle Academy, Spain [13:40 – 14:00] Overview of life cycle data modeling approaches [14:00 – 14:20] Discussion
CASE STUDIES PART 1 Chairs: Paolo Masoni (ENEA) and Rana Pant (EC, JRC, IES)
Rolf Frischknecht, ESU‐services Ltd., Switzerland (via videoconference) [14:20 – 14:40] Attributional and decisional LCA: an illustrative case study on electricity supply [14:40 – 15:00] Discussion
[15:40 – 16:00] Coffee break CASE STUDIES PART 2 Chairs: David Pennington (EC, JRC, IES) and Alessandra Zamagni (ENEA)
Bo Weidema, 2.‐0 LCA consultants, Denmark [16:00 – 16:20] Consequential LCA: a case study capturing indirect land use change [16:20 – 16:40] Discussion
Thomas Dandres, CIRAIG, Canada [16:40 – 17:00] Consequential and prospective LCA: a case study on electricity supply [17:00 – 17:20] Discussion
[17:20 – 17:40] Closure [19:30] Dinner
DAY 2
LIFE CYCLE MODELLING APPROACHES, SCENARIO TYPOLOGIES, APPLICATION CONTEXTS David Pennington and Camillo De Camillis (EC, JRC, IES) [08:45 – 09:00] Summary of day 1
Miguel Brandão, International Life Cycle Academy, Spain [09:00 – 09:20] Review of the features of life cycle data modeling approaches presented in day 1 [09:20 – 10:20] Discussion
[10:20 – 10:40] Coffee break
Alessandra Zamagni, ENEA, Italy [10:40 – 11:00] What data modelling approaches for what application context (Zamagni, Buonamici et al. 2009; Earles and Halog 2011; Zamagni, Guinée et al. 2012) [11:30 – 12:00] Discussion
72
[12:00 – 13:30] Lunch
PANEL ON HOW TO ASSESS FUTURE‐ORIENTED SCENARIOS Chairs: Constantin Ciupagea and David Pennington (EC, JRC, IES)
[13:30 – 13:40] Reinout Heijungs (Leiden University, Netherlands), Bo Weidema (2.‐0 LCA consultants, Denmark), Tomas Ekvall (IVL Swedish Environmental Research Institute, Sweden), Thomas Dandres, (CIRAIG, Canada)
[13:40 – 14:30] Discussion
[14:30 – 14:50] Coffee break
[14:50 – 16:20] Discussion
[16:20 – 17:30] Wrap up, next steps, and closure
73
ANNEX B: GLOSSARY
This glossary lists some terms and definitions on life cycle assessment, modelling approaches, statistics and economics. Where possible, terms and definitions from ISO standards were used. Terms relating to life cycle assessment and modelling approaches come from the glossary of the Global Guidance on LCA databases (UNEP/SETAC Life Cycle Initiative 2011). The terms and definitions relating to rebound effects are those reported in a technical report commissioned by the EC’s DG ENV (Maxwell, Owen et al. 2011). B.1. TERMS RELATING TO LIFE CYCLE ASSESSMENT AND MODELLING APPROACHES
Allocation Partitioning the input or output flows of a process or a product system between the product system under study and one or more other product systems. (ISO 2006)
Attributional approach
System modelling approach in which inputs and outputs are attributed to the functional unit of a product system by linking and/or partitioning the unit processes of the system according to a normative rule.
Average LCI dataset
LCI dataset obtained via averaging (producer-) specific LCI datasets. Typically referring to horizontally averaged data of complete product systems (e.g., global average steel billet data), unit processes (e.g., EU air transport fleet mix), or partly terminated systems (e.g., Australian average wastewater treatment plant). Also used for so-called “vertically averaged data,” i.e., LCI result datasets. (EC 2010)
Average technology (also called 'production mix')
The average technology (mix) is represented by a technology (mix) used to cover the demand for a certain functional unit within a specific area and a certain time period (e.g. a calendar year). (ESU-services Ltd. 2009)
Background system
The background system consists of processes on which no or, at best, indirect influence may be exercised by the decision-maker for which an LCA is carried out. Such processes are called “background processes.” (Frischknecht 1998)
By-product
Ability to adapt, change or replace specific unit processes in a life cycle A marketable good or service that is not the primary good or service being produced. (European Commission - Joint Research Centre - Institute for Environment and Sustainability 2010) Note: “primary good or service” = reference product (see definition provided in this glossary)
Consequential approach
System modelling approach in which activities in a product system are linked so that activities are included in the product system to the extent that they are expected to change as a consequence of a change in demand for the functional unit.
Constrained supplier
Supplier that is unable to increase production as a result of an increase in demand for its product. These constraints can be due to a number of factors such as regulation (e.g., quotas), shortage in raw materials or other production factors, and market failures. The use of the output of a constrained producer results in the output being unavailable to another potential user. (Based on the definition of "constrained technology"; Weidema et al. 1999)
74
Consumption mix
The weighted average of the suppliers providing a specific product to a geographical area, equal to the production mix plus imports minus exports of products produced in the territory.
Co-product
Any of two or more products coming from the same unit process or product system. (ISO 2006)
Critical review
Process intended to ensure consistency between a life cycle assessment and the principles and requirements of the International Standards on Life Cycle Assessment. (ISO 2006)
Cut-off criteria
Specification of the amount of material or energy flow or the level of environmental significance associated with unit processes or product system to be excluded from a study. (ISO 2006)
Data gaps
Data (elementary flows) that are missing in a dataset and that impair the data quality (completeness criteria) of the dataset required for the LCI database and/or the application of impact assessment for a certain impact category.
Data quality Characteristics of data that relate to their ability to satisfy stated requirements. (ISO 2006)
Dataset (LCI or LCIA dataset)
A document or file with life cycle information of a specified product or other reference (e.g., site, process), covering descriptive metadata and quantitative life cycle inventory and/or life cycle impact assessment data, respectively. (European Commission - Joint Research Centre - Institute for Environment and Sustainability 2010)
Decisional approach
System modelling approach in which activities in a product system are linked to anticipated future suppliers with which one may establish financial and contractual relations even if the said suppliers are constrained.
Elementary flow
Material or energy entering the system being studied that has been drawn from the environment without previous human transformation, or material or energy leaving the system being studied that is released into the environment without subsequent human transformation. (ISO 2006)
The data presented by national statistical agencies as supply-use tables (also known as “make-use tables”) and direct requirements tables. The environmental extension is an inventory of the elementary flows for each unit process in these tables.
Evaluation
Element within the life cycle interpretation phase intended to establish confidence in the results of the Life Cycle Assessment. (ISO 2006)
Foreground system
The foreground system consists of processes which are under the control of the decision-maker for which an LCA is carried out. They are called foreground processes. (Frischknecht 1998)
Input-output table
A means of presenting a detailed analysis of the process of production and the use of goods and services (products) and the income generated in that production; they can be either in the form of (a) supply and use tables or (b) symmetric input-output tables. (UNSD 1993)
75
Inventory dataset
A set of input and output data of a process. All of them are related to the same reference of this process. Usually, an inventory dataset also contains metadata describing, for example, geography, time reference, and ownership of the dataset. The process can be a unit process or an aggregated process.
Life cycle
Consecutive and interlinked stages of a product system, from raw material acquisition or generation from natural resources to final disposal. (ISO 2006)
Life cycle assessment
Compilation and evaluation of the inputs, outputs and the potential environmental impacts of a product system throughout its life cycle. (ISO 2006)
Life cycle impact assessment
Phase of Life Cycle Assessment aimed at understanding and evaluating the magnitude and significance of the potential environmental impacts for a product system throughout the life cycle of the product. (ISO 2006)
Life cycle interpretation
Phase of Life Cycle Assessment in which the findings of either the inventory analysis or the impact assessment, or both, are evaluated in relation to the defined goal and scope in order to reach conclusions and recommendations. (ISO 2006)
Life cycle inventory analysis
Phase of Life Cycle Assessment involving the compilation and quantification of inputs and outputs for a product throughout its life cycle. (ISO 2006)
Long-term changes Changes are classified long-term if the factors of production are variable and one may choose between different technologies available. The performance of the technologies available is given. Long-term corresponds to the extension or downsizing of production capacities within a couple of years to a few decades to follow the predicted development of demand. (ESU-services Ltd. 2009)
Marginal technology (production)
A marginal technology is represented by a technology or technology mix which is put in or out of operation next due to a short- or long-term change in demand. (ESU-services Ltd. 2009)
Market mix
The weighted average of the suppliers providing a specific product to a specific market. This can be equal to a consumption mix when the market boundaries and the geographic boundaries are equal. When the market is global, the market mix is equal to the global production mix.
Nomenclature Set of rules to name and classify data in a consistent and unique way. (ISO 2002)
Primary data
Data determined by direct measurement, estimation or calculation from the original source. (Weidema et al. 2003)
Process Set of interrelated or interacting activities that transforms inputs into outputs. (ISO 2005)
Product Any goods or service. (ISO 2006)
Product flow
Products entering from or leaving to another product system. (ISO 2006)
Product system
Collection of unit processes with elementary and product flows, performing one or more defined functions, and which models the life cycle of a product. (ISO 2006)
Production mix
The production-volume-weighted average of the suppliers of a specific product within a geographical area. (Weidema et al. 2011)
76
Raw data
Data used in unit process inventory modelling to deliver inventory data at the end, which are extracted from various data sources, such as bookkeeping of a plant, national statistics, or journal literature.
Raw material Primary or secondary material that is used to produce a product. (ISO 2006)
Recycling
The use of a by-product output of one product system as input to another product system.
Reference flow
Measure of the outputs from processes in a given product system required to fulfil the function expressed by the functional unit. (ISO 2006)
Reference product
Product of an activity for which a change in demand will affect the production volume of the activity (also known as the determining products in consequential modelling). (Weidema et al. 2011)
Scaling Adjusting process input and output flows in relation to the functional unit.
Short-term changes
Changes are classified short-term if the factors of production and the technology available are fixed. Short-term corresponds to a one time only change in demand and helps to better use existing production capacities. (ESU-services Ltd. 2009)
Substitution Solving multi-functionality of processes by expanding the system boundaries and substituting the non-reference products with an alternative way of providing them, i.e., the processes or products that the non-reference product supersedes. Effectively the non-reference products are moved from being outputs of the multi-functional process to be negative inputs of this process, so that the life cycle inventory of the superseded processes or products is subtracted from the system, i.e., it is "credited." Substitution is a special (subtractive) case of applying the system expansion principle. (Definition prepared by merging the definitions from ISO 14040ff and the European Commission - Joint Research Centre - Institute for Environment and Sustainability 2010)
System boundary
Set of criteria specifying which unit processes are part of a product system. (ISO 2006)
System expansion Expanding the product system to include the additional functions related to the co-products. (ISO 2006)
Unit process Smallest element considered in the life cycle inventory analysis for which input and output data are quantified. (ISO 2006)
Unit process model
A group of mathematical relations that transforms raw data into a unit process dataset.
Unit process modeling
Procedures of defining mathematical relations and collecting raw data to obtain a unit process dataset.
Unit process output Product, material or energy flow that leaves a unit process. (ISO 2006)
Waste
Substances or objects which the holder intends or is required to dispose of. (ISO 2006)
77
B.2. TERMS RELATING TO STATISTICS Accuracy Closeness of agreement between a test result(3.4.1) or measurement result
(3.4.2) and the true value (3.2.5) ISO 3534-2:2006, 3.3.1 Statistics -- Vocabulary and symbols -- Part 2: Applied statistics As the errors can be measurement errors but also choice-errors, accuracy is used complementary to the ISO usage of precision, i.e. accuracy is the combination of representativeness and methodological consistency. (EC 2010)
Precision Closeness of agreement between independent test/measurement results obtained under stipulated conditions ISO 21748:2010, 2.5 Guidance for the use of repeatability, reproducibility and trueness estimates in measurement uncertainty estimation ISO 3534-2:2006, 3.3.4 Statistics - Vocabulary and symbols - Part 2: Applied statistics Precision is synonymous with reproducibility (EC 2010)
Uncertainty Parameter, associated with the measurement result(3.4.2), or test result (3.4.1), that characterizes the dispersion of the values that could reasonably be attributed to the particular quantity subject to measurement (3.2.1) or characteristic (1.1.1)subject to test (3.2.3) ISO 3534-2:2006, 3.4.5 - Vocabulary and symbols - Part 2: Applied statistics Parameter associated with the result of quantification which characterizes the dispersion of the values that could be reasonably attributed to the quantified amount ISO 14050:2009, 5.17 – Environmental management - Vocabulary
Uncertainty analysis
Systematic procedure to quantify the uncertainty (5.17) introduced in the results of a life cycle inventory analysis (7.2.1) due to the cumulative effects of model imprecision, input (6.17) uncertainty and data variability
Note: Either ranges or probability distributions are used to determine uncertainty in the results.
ISO 14050:2009, 7.2.1.2 – Environmental management - Vocabulary ISO 14044: 2006, 3.33 – Environmental management — Life cycle assessment — Requirements and guidelines
Input (ISO 14050:2009, 6.17 – Environmental management – Vocabulary):
Product (6.11), material or energy flow (6.13) that enters a unit process (6.4.1) Note 1 to entry: Products (6.2) and materials include raw materials (6.12), intermediate products (6.2.1) and co-products (6.2.2).
78
Irreducible uncertainty
“Irreducible uncertainty refers to events which remain unpredictable whatever the amount of data available; in many cases, however, the regularity of their frequential behaviour in long series is classically considered to be amenable to probability calculations (for example, weather patterns or natural risks), which explains the alternative classical denomination of ‘aleatory’ for many examples of irreducible uncertainty.”(de Rocquigny, Devictor et al. 2008)
Reducible or epistemic uncertainty
“Reducible or epistemic uncertainty refers to types of uncertainty which can be directly reduced by an increase in the data available. This may include situations in which there is somehow a deeper lack of knowledge of the uncertainty, less (or even not at all) amenable to probabilistic treatment or estimation.”(de Rocquigny, Devictor et al. 2008)
Variability vs. uncertainty
“This distinction is used when the system inputs mix a population of objects (or scenarios), a spatial distribution of properties within a system, or even a temporal distribution of properties affecting a system: in which case, the variation in properties from one object (or part of the system, or instant in time, respectively) to another within the population considered is distinguished from any uncertainty attached to the properties of a given object (or part, or instant), such as lack of knowledge, measurement error, etc.”(de Rocquigny, Devictor et al. 2008)
Sensitivity analysis
Systematic procedures for estimating the effects of the choices made regarding methods and data on the outcome of a study. ISO 14050:2009, 7.2.1.3 – Environmental management - Vocabulary ISO 14044: 2006, 3.31 – Environmental management — Life cycle assessment — Requirements and guidelines
79
B.3. TERMS RELATING TO ECONOMICS Ceteris paribus “Latin expression meaning ‘all other things being equal’. A term popular
especially…when the relationship between two variables is investigated, all other variables which might be influential being assumed to have unchanging values. A ceteris paribus assumption allows the researcher to explore a theoretical relationship between an explanatory variable and performance outcomes without modelling the entirety of the system.” (Rutherford 2002)
Elasticity of demand
The responsiveness of quantity demanded of a good or service to a change in price or in a consumer’s income. (Rutherford 2002)
General equilibrium “The state of an economy in which all its markets for consumer goods, capital goods, labour services, financial assets and money are in equilibrium and the economy is in overall balance.” (Rutherford 2002)
“Today, the basic questions about a general equilibrium always include whether the solution proposed exists, whether it is unique and whether it is stable. General equilibrium analysis has the advantage of being flexible enough to be able to incorporate many goals and resources in a model. It is contrasted with Marshall’s Partial Equilibrium Analysis and is a half-way house between microeconomics and macroeconomics.” (Rutherford 2002)
Mutata mutandis Ceteris paribus contrasts with mutata mutandis. The latter is a Latin expression meaning ‘changing [only] those things which need to be changed’. The expression is commonly used in economics. Mutata mutandis is popular in the study of counter-factuals, wherein the requisite change in the factual basis of the past is made and the resulting causalities are followed.
Rebound effect “Increase in consumption due to environmental efficiency interventions that can occur through a price reduction (i.e. an efficient product being cheaper and hence more is consumed) or other behavioural responses. The magnitude of the rebound effect is typically expressed as the percentage of potential savings taken back from the maximum efficiency improvement expected. To accurately measure the rebound effect it is necessary to define and distinguish it from other micro/macro economic factors. There is a good evidence base for this and the relationships with key factors have been explored e.g. price (price elasticities), income (income elasticities), substitution (cross price/substitution elasticity) and saturation effects. Overall, the economic factors underpinning energy efficiency price induced rebound effects are that efficiency improvements result in an effective cut in energy prices, which produces output, substitution, competitiveness and income effects that stimulate energy demands (Hanley et al, 2009). The relationship between these effects can be complex which adds to the challenge in measuring the rebound effect. Isolating the rebound effects from other factors that cause increased consumption is a key issue that needs resolution in the definition and measurement techniques for estimating the magnitude of rebound effects.
80
Current measurement approaches include income/price elasticity studies (for direct rebound effects), econometric modelling, general equilibrium modelling and expenditure surveys.”(Maxwell, Owen et al. 2011) Direct Rebound Effect “Increased efficiency and associated cost reduction for a product/service results in its increased consumption because it is cheaper”(Maxwell, Owen et al. 2011) Indirect Rebound Effect “Savings from efficiency cost reductions enable more income to be spent on other products and services” (Maxwell, Owen et al. 2011) Economy wide Rebound Effect “More efficiency drives economic productivity overall resulting in more economic growth and consumption at a macroeconomic level”(Maxwell, Owen et al. 2011)
REFERENCES de Rocquigny, E., N. Devictor, et al. (2008) Uncertainty in Industrial Practice: A guide to Quantitative
Uncertainty Management, John Wiley & Sons, Ltd., Chichester, UK.
EC (2010) The International Reference Life Cycle Data System (ILCD) Handbook - General guide for Life Cycle Assessment - Detailed guidance. European Commission, Joint Research Centre. European Commission (EC), Publications office of the European Union, Luxemburg.
Maxwell, D., P. Owen, et al. (2011) Addressing the Rebound Effect. A report for the European Commission DG Environment, Brussels, Belgium.
Rutherford, D. (2002) Dictionary of Economics. Routledge, London, UK.
UNEP/SETAC Life Cycle Initiative (2011) Global Guidance Principles for Life Cycle Assessment Databases - A Basis for Greener Processes and Products. United Nations Environment Programme (UNEP), Paris, France.
European Commission
EUR 26088 – Joint Research Centre – Institute for Environment and Sustainability
Title: Sustainability assessment of future-oriented scenarios: a review of data modelling approaches in Life Cycle Assessment.
Towards recommendations for policy making and business strategies.
Luxembourg: Publications Office of the European Union
2013 – 82 pp. – 21.0 x 29.7 cm
EUR – Scientific and Technical Research series –ISSN 1831-9424 (online)
ISBN 978-92-79-32522-9 (pdf)
doi: 10.2788/95227
Abstract
Steering policy-making processes and business long term strategies entails tasks such as e.g. setting up sound environmental long term
objectives and targets, assessing implications, and comparing options. To best run these tasks in the context of sustainability
assessment, two fundamental ingredients are indispensable: life cycle thinking and analysis of future-oriented scenarios.
Considering the whole life cycle of goods and services is necessary to avoid the shifting of problems from one life cycle stage to another,
from one geographic area to another and from one environmental medium or protection target to another.
Given the proliferation of life cycle thinking-based data modelling approaches, a review was conducted to detect where we stand in
defining and framing life cycle thinking-based approaches and related data modelling approaches, what their key features are, and how
mature they are. In addition, a scientific workshop was arranged to further discuss data modelling approaches and to screen how
Environmental Footprint methodologies can be used to assess future-oriented scenarios.
This review represents a stepping stone towards recommendations for sustainability assessment of future-oriented scenarios.
As the Commission’s in-house science service, the Joint Research Centre’s mission is to provide EU policies with independent, evidence-based scientific and technical support throughout the whole policy cycle. Working in close cooperation with policy Directorates-General, the JRC addresses key societal challenges while stimulating innovation through developing new standards, methods and tools, and sharing and transferring its know-how to the Member States and international community. Key policy areas include: environment and climate change; energy and transport; agriculture and food security; health and consumer protection; information society and digital agenda; safety and security including nuclear; all supported through a cross-cutting and multi-disciplinary approach.