1 Sustainability of Earnings: A Framework for Quantitative Modeling of Strategy, Risk, and Value Neil M. Bodoff, FCAS, MAAA ________________________________________________________________________ Abstract The value of a firm derives from its future cash flows, adjusted for risk, and discounted to present value. Much of the existing literature addresses the quantitative techniques for calculating probability distributions of future cash flows, calculating values of risk adjustment factors, and calculating values of discount factors. Yet strategy and strategic risk – for example, the risk of adverse consequences arising from the actions of new competitors, governmental intervention, customer changes, etc. – often cannot easily be incorporated into this quantitative framework. As a result, strategic concerns are addressed in a parallel track of qualitative analysis, which supplements the quantitative analysis but never integrates with it. The goal of this paper is to propose in detail a quantitative framework in which strategic considerations can be incorporated into a quantitative model of the value of the firm. The resulting framework seeks to measure not only the amount, growth rate, and variability of earnings, but also the firm’s “sustainability of earnings” and value in the face of strategic forces. Keywords. Strategy, Risk, Value, ERM, Sustainability of Earnings. 1. INTRODUCTION Strategy is a source of risk to the firm and thus ought to be included within enterprise risk management (ERM), enterprise risk analysis, and measurement of the firm’s value. Yet while detailed quantitative models describe other sources of risk such as financial risk, operational risk, and hazard risk, the quantitative apparatus for incorporating strategy into a model of the firm is often underdeveloped or simply lacking. As a result, analysts address strategic forces in a parallel track of qualitative analysis, which supplements the quantitative analysis but cannot integrate with it. This paper proposes a detailed framework in which strategic considerations can be incorporated into a quantitative model of the firm. Such a framework incorporates a scenario-based paradigm, which allows one to develop a range of future strategic conditions; one must estimate the likelihood of such conditions materializing and what the ramifications would be for the firm’s earnings. This framework thus requires one to reflect upon and estimate the relative vulnerability of the firm’s earnings to changes in the strategic landscape; or, equivalently, the invulnerability or “sustainability” of the firm’s earnings with respect to strategic forces. By incorporating strategic forces into the quantitative risk model, one captures a broader range of variability in future earnings. Such a model could be used for measuring risk and volatility in a classic risk modeling framework; further, following the
Transcript
1
Sustainability of Earnings: A Framework for Quantitative Modeling of Strategy, Risk, and Value
Abstract The value of a firm derives from its future cash flows, adjusted for risk, and discounted to present value. Much of the existing literature addresses the quantitative techniques for calculating probability distributions of future cash flows, calculating values of risk adjustment factors, and calculating values of discount factors. Yet strategy and strategic risk – for example, the risk of adverse consequences arising from the actions of new competitors, governmental intervention, customer changes, etc. – often cannot easily be incorporated into this quantitative framework. As a result, strategic concerns are addressed in a parallel track of qualitative analysis, which supplements the quantitative analysis but never integrates with it. The goal of this paper is to propose in detail a quantitative framework in which strategic considerations can be incorporated into a quantitative model of the value of the firm. The resulting framework seeks to measure not only the amount, growth rate, and variability of earnings, but also the firm’s “sustainability of earnings” and value in the face of strategic forces. Keywords. Strategy, Risk, Value, ERM, Sustainability of Earnings.
1. INTRODUCTION
Strategy is a source of risk to the firm and thus ought to be included within enterprise risk
management (ERM), enterprise risk analysis, and measurement of the firm’s value. Yet while
detailed quantitative models describe other sources of risk such as financial risk, operational
risk, and hazard risk, the quantitative apparatus for incorporating strategy into a model of the
firm is often underdeveloped or simply lacking. As a result, analysts address strategic forces
in a parallel track of qualitative analysis, which supplements the quantitative analysis but
cannot integrate with it.
This paper proposes a detailed framework in which strategic considerations can be
incorporated into a quantitative model of the firm. Such a framework incorporates a
scenario-based paradigm, which allows one to develop a range of future strategic conditions;
one must estimate the likelihood of such conditions materializing and what the ramifications
would be for the firm’s earnings. This framework thus requires one to reflect upon and
estimate the relative vulnerability of the firm’s earnings to changes in the strategic landscape;
or, equivalently, the invulnerability or “sustainability” of the firm’s earnings with respect to
strategic forces. By incorporating strategic forces into the quantitative risk model, one
captures a broader range of variability in future earnings. Such a model could be used for
measuring risk and volatility in a classic risk modeling framework; further, following the
Sustainability of Earnings: A Framework for Quantitative Modeling of Strategy, Risk, and Value
2
paradigm of Panning [4], one can use such a framework to calculate the value of a business
based on its future earnings. This has particular application to the problem of estimating the
relative value of two businesses with differing degrees of earnings sustainability in the face of
strategic forces. It also provides a pathway towards quantifying a cost-benefit evaluation of
expenditures on strategic maneuvers designed to enhance the firm’s strategic posture.
1.1 Research Context
Slywotzky and Drzik [7] address strategy and strategic risk, but their focus is on deploying
countermeasures to strategic risk. Their treatment is mostly qualitative; although they state
the importance of estimating the likelihood and severity of various strategic risks, this
recommendation leads only to a risk map that does not integrate into an overall quantitative
risk model of the firm. Mango [3] provides a general introduction to strategic risk issues,
with a focus on scenario planning and risk modeling; he notes the lack of precision in the
terms “strategy” and “strategic risk”. Schelling [6] serves as our starting point for how
strategy is defined in this paper, leading to the crystallization by Porter [5]. We incorporate
our risk model of strategy into the framework for the value of the firm developed by
Panning [4], who was not addressing strategy per se but rather the risk of downside financial
variability; the framework nevertheless is suitable for our purposes. Finally, we note that an
antecedent to the proposed model can be found in Feldblum [2], who proposed the
approach at a more granular policy level rather than at the business unit or firm level.
1.2 Objective
The objective of this paper is to describe a practical framework that can incorporate the
quantitative modeling of risks emanating from a firm’s strategic position.
2. STRATEGY
2.1 Schelling and the Theory of Games
In this paper, we will use as a starting point the description presented by Schelling [6]. He
notes that in the field of Game Theory, a game of strategy refers to:
“[a situation] in which the best course of action for each player depends on what the
other players do. The term is intended to focus on the interdependence of the
Sustainability of Earnings: A Framework for Quantitative Modeling of Strategy, Risk, and Value
3
adversaries’ decisions and on their expectation about each other’s behavior”.
Schelling directs our attention to how the firm’s results can be affected by other players
whose rational actions interact with and impact upon the firm. This point is crucial because
so much of current practice in the property-casualty insurance industry focuses on modeling
the variability of a firm’s financial results based on fortuitous events, for example property
damage claims from natural catastrophes or liability claims from car crashes. Thus Schelling’s
definition of strategy, focusing on the actions of competing players, leads us to consider a
category of risk that is not currently encapsulated in other risk categories such as operational
risk, hazard risk, or financial risk.
2.2 Buffet’s Economic Moat and Porter’s Five Forces
Our focus on the actions of other players leads us to consider competition and
competitive forces. How do competitive forces potentially affect the firm? One vivid
metaphor, articulated by Warren Buffet, is the “economic moat”. The idea behind this
metaphor is to consider the relative safety or vulnerability of a business’s earnings and value
in the face of competitive forces.
In order to gain greater insight into competitive forces, we invoke the classification
system devised by Porter [5]. To describe competition, he details the Five Forces that govern
the competitive landscape:
1. Threat of new entrants
2. Jockeying for position among current competitors
3. Bargaining power of suppliers
4. Bargaining power of customers
5. Threat of substitute products
6. [Threat of government intervention]
2.3 Sustainability of Earnings
Porter’s classification accentuates that a firm’s current earnings and value are potentially
vulnerable to the competitive forces of suppliers, customers, and new competitors. Thus in
evaluating a business, one must consider not only the amount of the business’s earnings and
Sustainability of Earnings: A Framework for Quantitative Modeling of Strategy, Risk, and Value
4
the growth rate of its earnings, but also its “sustainability of earnings”.
We define “sustainability of earnings” as the likelihood that a business’s earnings will not
be eroded by the strategic moves of competitive forces.
Sustainability of earnings provides a framework for evaluating the value of a firm, the
price of an acquisition, and the value of a business unit or product line within a
conglomerate.
For example, in the property-casualty insurance industry, one can ask of each line of
business:
1. Threat of new entrants:
a. What kind of barriers to entry does this line of business have?
i. To what extent does it require hard to obtain, specialized,
technical underwriting skills?
ii. To what extent does it require access to distribution channels?
iii. To what extent does obtaining business require a proven track
record of claims paying and reliability?
2. Bargaining power of suppliers:
a. To what extent do the suppliers of capital have pricing power and
availability power over this business?
i. To what extent does writing this line of business require the
support of suppliers of reinsurance capital?
ii. Could the business easily switch to alternative forms of capital,
including capital markets instruments such as cat bonds, or,
alternatively, rely on the firm’s held equity capital?
3. Bargaining power of customers:
a. To what extent do customers have the ability to change their purchasing
behavior?
i. Do they have the ability and willingness to choose not to
purchase the insurance product that the firm offers and simply
Sustainability of Earnings: A Framework for Quantitative Modeling of Strategy, Risk, and Value
5
retain the risk for themselves?
All of these questions are relevant whenever:
1. A conglomerate’s senior management is measuring the value of various
subsidiaries or lines of business in its portfolio of products and businesses.
2. A company is estimating how much to pay to acquire another company or to
pay for new talent to develop a new line of business.
3. Senior management is evaluating strategic moves to enhance the value of the
firm and thus to increase its stock price.
3. MODELING
One might desire to describe strategy and competitive forces via a quantitative or even a
probabilistic model, especially a probabilistic model that incorporates other sources of risk to
the firm, such as financial risk and hazard risk. How might one go about doing so? By
focusing on sustainability of earnings, we can begin to develop such a framework.
3.1 Modeling the Risk to the Firm: Single Period Variability of Earnings
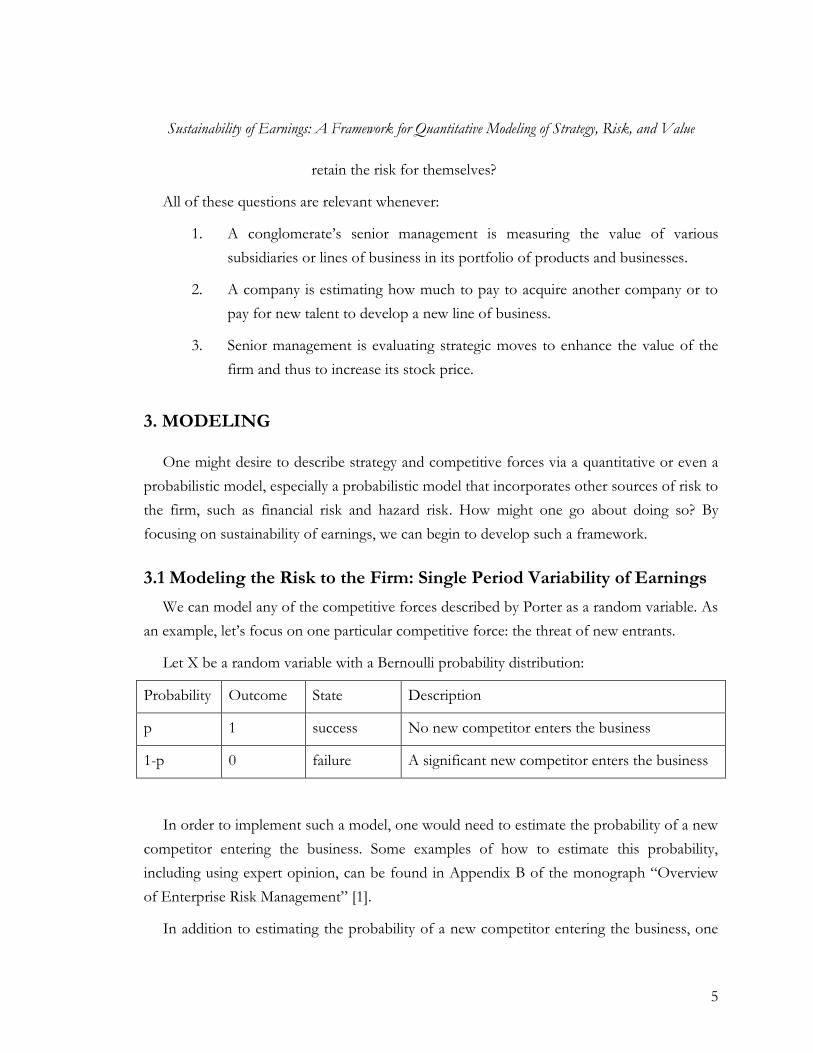
We can model any of the competitive forces described by Porter as a random variable. As
an example, let’s focus on one particular competitive force: the threat of new entrants.
Let X be a random variable with a Bernoulli probability distribution:
Probability Outcome State Description
p 1 success No new competitor enters the business
1-p 0 failure A significant new competitor enters the business
In order to implement such a model, one would need to estimate the probability of a new
competitor entering the business. Some examples of how to estimate this probability,
including using expert opinion, can be found in Appendix B of the monograph “Overview
of Enterprise Risk Management” [1].
In addition to estimating the probability of a new competitor entering the business, one
Sustainability of Earnings: A Framework for Quantitative Modeling of Strategy, Risk, and Value
6
should also evaluate the severity of such an event on business’s amount of earnings, as noted
by Slywotzky and Drzik [7]. In the context of a full probability distribution model of
earnings, a new competitor could affect not only the firm’s mean level of earnings but also
the shape, volatility, and downside of its earnings.
Thus one could stipulate as follows:
Probability Description Ramification
P No new competitor enters the
business
Company earnings follow distribution
function F1(x)
1-p A significant new competitor enters
the business
Company earnings follow distribution
function F2(x)
For example:
1. Simulate a uniform distribution on [0,1]
a. If simulated output is on the interval [0,p] then you have a “success”, no
new competitor has entered.
i. Simulate the business’s earnings via probability distribution #1.
b. If simulated output is on the interval (p,1] then you have a “failure”, a
significant new competitor has entered the business.
i. Simulate the business’s earnings via probability distribution #2.
Sustainability of Earnings: A Framework for Quantitative Modeling of Strategy, Risk, and Value
We can use the model of the value of the firm not only to compare two different
businesses, but also for a given firm to evaluate two alternative strategic moves.
Let’s say a firm is considering whether or not to increase its expenditures on initiatives
that will increase the sustainability of earnings. For example, it might be considering
increasing expenditures on advertising to enhance brand name recognition. Or it might be
thinking about increasing research and development expenditures; the product
enhancements from the additional R&D are not foreseen as increasing the firm’s earnings,
but rather the enhanced product offering could serve as a barrier to entry to potential
competitors. Or the firm might be contemplating spending more money on customer loyalty
programs.
In all of these instances, the firm ought to forecast whether the benefit of the plan
exceeds the cost. While ultimately there would be several different perspectives influencing
the final decision, one would ideally like to be able to contribute a quantitative analysis as
one component of the decision making process.
First we would need a basic description of the key aspects of the firm in its current state.
Sustainability of Earnings: A Framework for Quantitative Modeling of Strategy, Risk, and Value
11
We’ll start with the same information for Firm A as in Exhibit 2: we assume the firm has
earnings of 100 and an annual probability p of sustainability of 96%, i.e. (1-p) probability of
4% that a new competitor will enter the business and decimate the firm’s earnings. Now the
firm is considering how much (if any) additional expenditures it should make to strengthen
its strategic position and reduce the likelihood of a new entrant to the market. Since the firm
is currently spending some money on these activities and its probability p of sustainability is
96%, we assume that the additional expenditures will increase this probability from 96% at a
minimum towards a maximum of 100%.
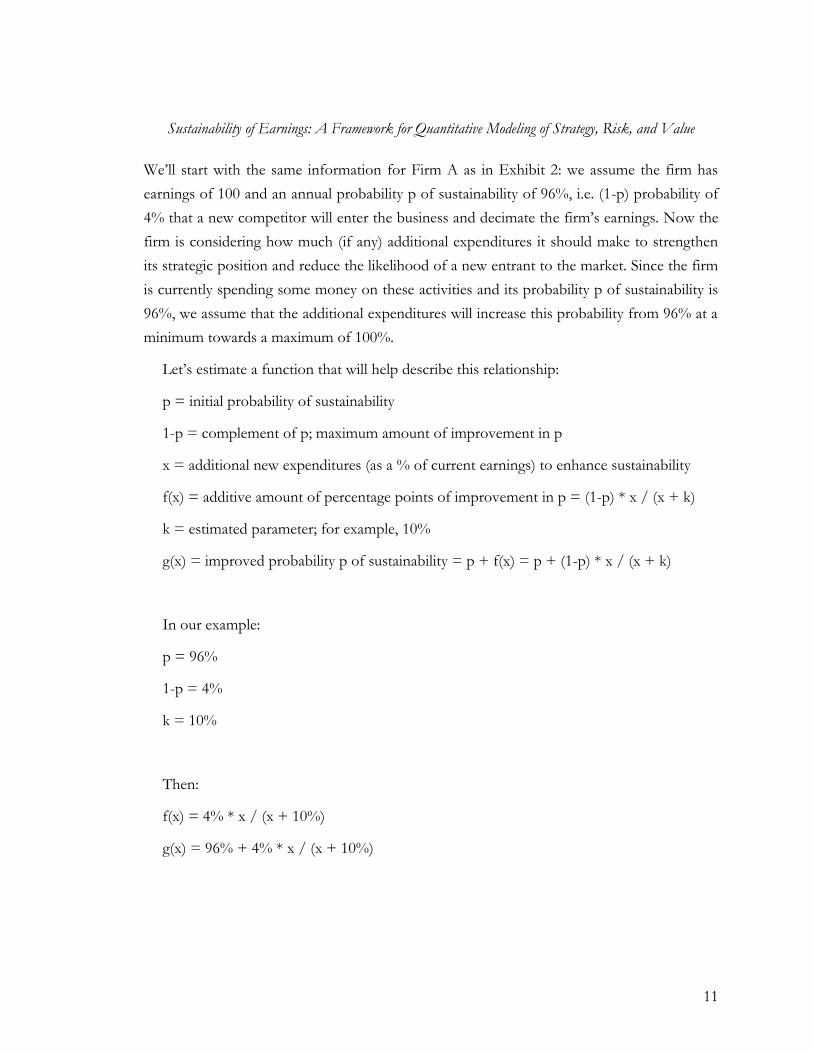
Let’s estimate a function that will help describe this relationship:
p = initial probability of sustainability
1-p = complement of p; maximum amount of improvement in p
x = additional new expenditures (as a % of current earnings) to enhance sustainability
f(x) = additive amount of percentage points of improvement in p = (1-p) * x / (x + k)
k = estimated parameter; for example, 10%
g(x) = improved probability p of sustainability = p + f(x) = p + (1-p) * x / (x + k)
In our example:
p = 96%
1-p = 4%
k = 10%
Then:
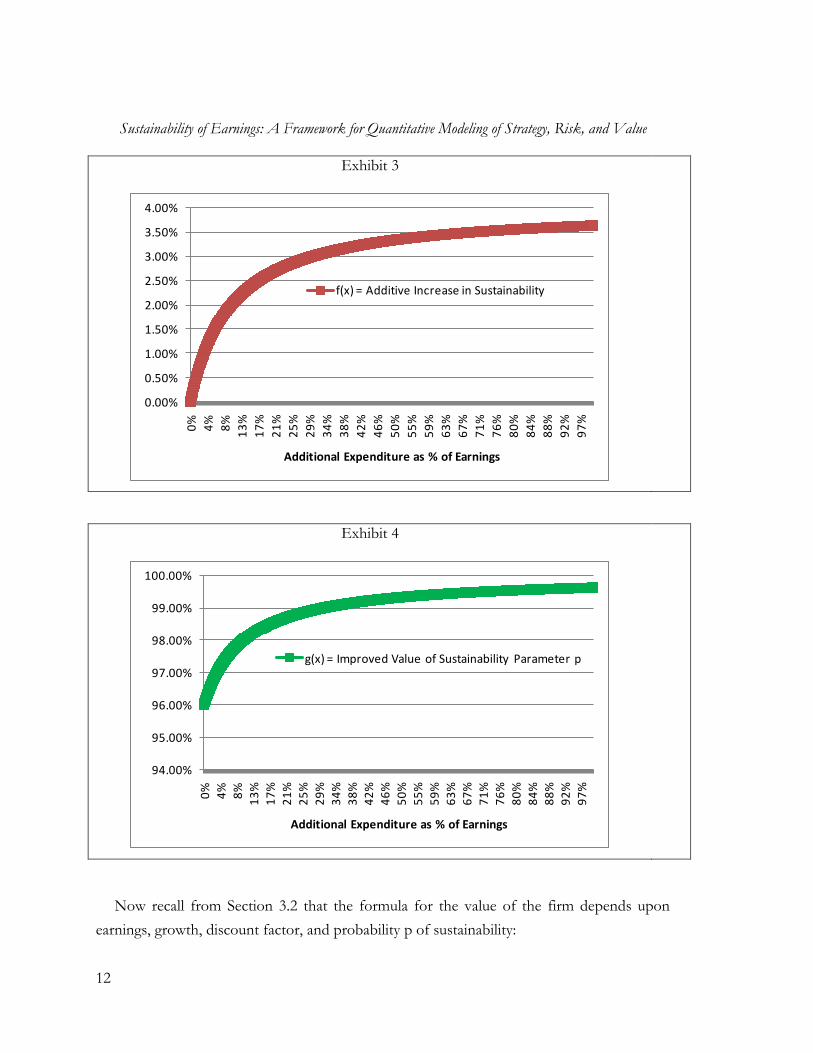
f(x) = 4% * x / (x + 10%)
g(x) = 96% + 4% * x / (x + 10%)
Sustainability of Earnings: A Framework for Quantitative Modeling of Strategy, Risk, and Value
12
Exhibit 3
0.00%
0.50%
1.00%
1.50%
2.00%
2.50%
3.00%
3.50%
4.00%
0%
4%
8%
13
%
17
%
21
%
25
%
29
%
34
%
38
%
42
%
46
%
50
%
55
%
59
%
63
%
67
%
71
%
76
%
80
%
84
%
88
%
92
%
97
%
Additional Expenditure as % of Earnings
f(x) = Additive Increase in Sustainability
Exhibit 4
94.00%
95.00%
96.00%
97.00%
98.00%
99.00%
100.00%
0%
4%
8%
13
%
17
%
21
%
25
%
29
%
34
%
38
%
42
%
46
%
50
%
55
%
59
%
63
%
67
%
71
%
76
%
80
%
84
%
88
%
92
%
97
%
Additional Expenditure as % of Earnings
g(x) = Improved Value of Sustainability Parameter p
Now recall from Section 3.2 that the formula for the value of the firm depends upon
earnings, growth, discount factor, and probability p of sustainability:
Sustainability of Earnings: A Framework for Quantitative Modeling of Strategy, Risk, and Value
13
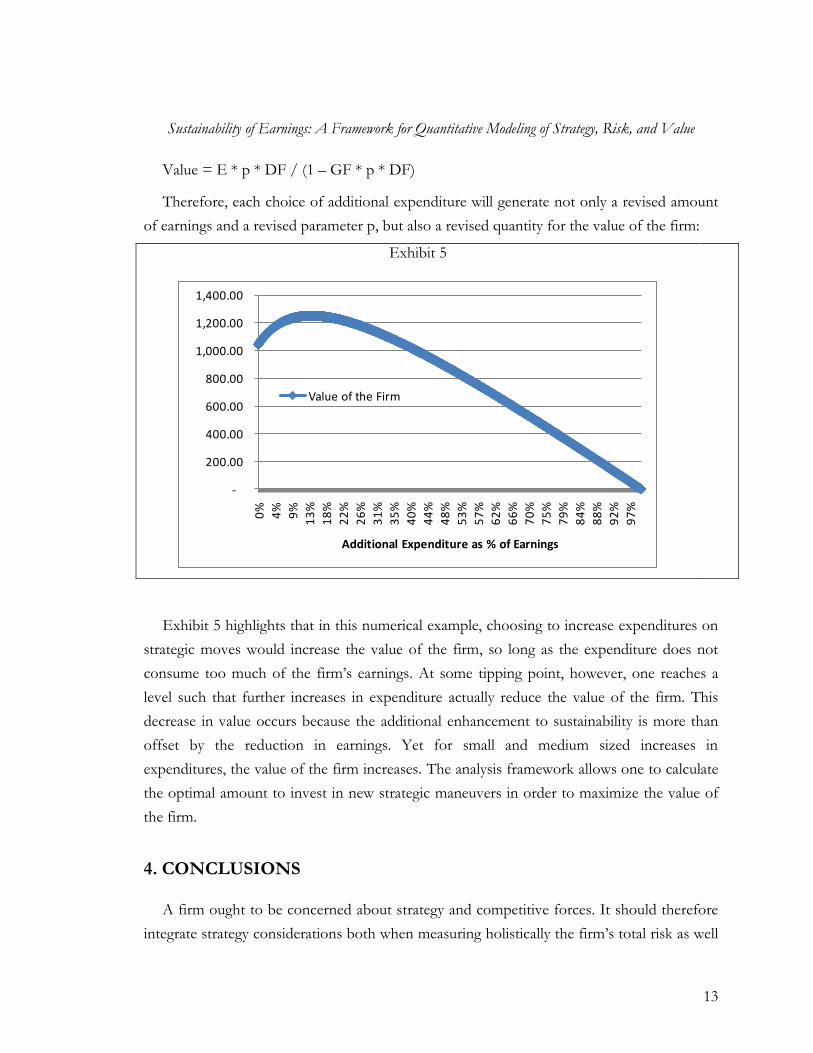
Value = E * p * DF / (1 – GF * p * DF)
Therefore, each choice of additional expenditure will generate not only a revised amount
of earnings and a revised parameter p, but also a revised quantity for the value of the firm:
Exhibit 5
-
200.00
400.00
600.00
800.00
1,000.00
1,200.00
1,400.00
0%
4%
9%
13
%
18
%
22
%
26
%
31
%
35
%
40
%
44
%
48
%
53
%
57
%
62
%
66
%
70
%
75
%
79
%
84
%
88
%
92
%
97
%
Additional Expenditure as % of Earnings
Value of the Firm
Exhibit 5 highlights that in this numerical example, choosing to increase expenditures on
strategic moves would increase the value of the firm, so long as the expenditure does not
consume too much of the firm’s earnings. At some tipping point, however, one reaches a
level such that further increases in expenditure actually reduce the value of the firm. This
decrease in value occurs because the additional enhancement to sustainability is more than
offset by the reduction in earnings. Yet for small and medium sized increases in
expenditures, the value of the firm increases. The analysis framework allows one to calculate
the optimal amount to invest in new strategic maneuvers in order to maximize the value of
the firm.
4. CONCLUSIONS
A firm ought to be concerned about strategy and competitive forces. It should therefore
integrate strategy considerations both when measuring holistically the firm’s total risk as well
Sustainability of Earnings: A Framework for Quantitative Modeling of Strategy, Risk, and Value
14
as when seeking to maximize the firm’s total value. In order to do so, we introduce the
framework of “sustainability of earnings”; the various strategic forces that are described
qualitatively in the strategy literature can thus be quantified as sources of risk whose
outcomes can be described via probabilistic models. Such an approach allows one to
incorporate strategic forces into the existing framework of probabilistic enterprise risk
models. It also allows one to incorporate strategic considerations when calculating the value
of a business, when comparing the relative attractiveness of two different businesses, and
when calculating the benefits of various strategic maneuvers.
5. REFERENCES
[1] CAS Enterprise Risk Management Committee, “An Overview of Enterprise Risk Management”, 2003, http://www.casact.org/research/erm/overview.pdf
[2] Feldblum, Sholom, “Personal Automobile Premiums: An Asset Share Pricing Approach for Property/Casualty Insurance”, Proceedings of the CAS, 1996, Vol. LXXXIII, Part 2, 190-296, http://www.casact.org/pubs/proceed/proceed96/96190.pdf
[4] Panning, William H., “Managing the Invisible: Measuring Risk, Managing Capital, Maximizing Value”, 2006 ERM Symposium, http://www.ermsymposium.org/2006/pdf/papers/Panning%204-10-06.pdf
[5] Porter, Michael E., “How Competitive Forces Shape Strategy”, Harvard Business Review, 1979 [6] Schelling, Thomas C., The Strategy of Conflict, 1980 [7] Slywotzky, Adrian J., and John Drzik, “Countering the Biggest Risk of All”, Harvard Business Review, 2005