TE106/8 Sustainability Options for Retrofitting New Zealand Houses – theoretical cost benefit analysis Final A report prepared for Beacon Pathway Limited October 2007 The work reported here was funded by Beacon Pathway Limited and the Foundation for Research, Science and Technology
Transcript
TE106/8
Sustainability Options for Retrofitting New Zealand Houses – theoretical cost benefit analysis Final A report prepared for Beacon Pathway Limited October 2007
The work reported here was funded by Beacon Pathway Limited and the Foundation for Research, Science and Technology
Sustainability Options for Retrofitting New Zealand Houses – theoretical cost benefit analysis: TE106/8
Page ii
About This Report Title Sustainability Options for Retrofitting New Zealand Houses – theoretical cost benefit analysis Authors Phillips, M., BRANZ Ltd Reviewer Page, I. and Burgess, J., BRANZ Ltd Abstract A theoretical cost benefit for options to retrofit for water and energy was carried out using ALF. At a national level, the following options have a theoretical internal rate of return greater than 5% making them worthwhile implementing from a financial perspective:
Rainwater tanks (2,000 litre) for Auckland only (assuming 100% water retention) Low flow shower heads for high pressure systems Water efficient (“AAA”) washing machines Water heating upgrade (if current water heating tank needs replacing)
- Solar hot water heating - Heat pump hot water heating - Instant gas hot water heating
Floor insulation Ceiling insulation
Reference Phillips, M., October 2007. Sustainability Options for Retrofitting New Zealand Houses – theoretical cost benefit analysis. Report TE106/8 for Beacon Pathway Limited. Rights Beacon Pathway Limited reserves all rights in the Report. The Report is entitled to the full protection given by the New Zealand Copyright Act 1994 to Beacon Pathway Limited.
Disclaimer The opinions provided in the Report have been provided in good faith and on the basis that every endeavour has been made to be accurate and not misleading and to exercise reasonable care, skill and judgment in providing such opinions. Neither Beacon Pathway Limited nor any of its employees, subcontractors, agents or other persons acting on its behalf or under its control accept any responsibility or liability in respect of any opinion provided in this Report.
Sustainability Options for Retrofitting New Zealand Houses – theoretical cost benefit analysis: TE106/8
3.1 Theoretical Cost Benefit for Water Efficiency .............................................................. 5 3.2 Theoretical Energy Conservation Through Retrofit ...................................................... 9 3.3 Waste ........................................................................................................................... 25
4 Conclusions........................................................................................................................... 26 5 References............................................................................................................................. 27 Appendix1 Climate characteristics............................................................................................. 30 Appendix 2 Insulation Status of the Housing Stock................................................................. 32
Total housing stock............................................................................................................... 32 Insulation information .......................................................................................................... 33 Conclusions........................................................................................................................... 35
Appendix 3 Residential energy use ........................................................................................... 36 Total Energy ......................................................................................................................... 36 Space heating ........................................................................................................................ 37
Sustainability Options for Retrofitting New Zealand Houses – theoretical cost benefit analysis: TE106/8
Page iv
Tables Table 1 Rainwater Supply and Potential Use................................................................................ 5 Table 2 Water use analysis by region........................................................................................... 7 Table 3 Cost increase of window frame with the same glazing type compared to a standard
aluminium frame, expressed as a percentage increase ....................................................... 11 Table 4 Theoretical Energy Efficiency Cost Benefit Analysis – AUCKLAND ........................ 13 Table 5 Theoretical Energy Efficiency Cost Benefit Analysis - WELLINGTON...................... 14 Table 6 Theoretical Energy Efficiency Cost Benefit Analysis – CHRISTCHURCH................ 15 Table 7 Theoretical Energy Efficiency Cost Benefit Analysis – DUNEDIN ............................. 16 Table 8 Theoretical Energy Efficiency Cost Benefit Analysis - ROTORUA............................ 18 Table 9 Theoretical Energy Efficiency Cost Benefit Analysis – GISBORNE............................ 19 Table 10 Theoretical Energy Efficiency Cost Benefit Analysis – MASTERTON ..................... 20 Table 11 Theoretical Energy Efficiency Cost Benefit Analysis – INVERCARGILL ............... 21 Table 12. Potential Greenhouse Gas Emissions ......................................................................... 23 Table 13 Climate characteristics of a range of sites throughout New Zealand .......................... 31 Table 14. Number of pre 1980 houses (as proxy to those built prior to insulation requirements)
............................................................................................................................................ 32 Table 15 Percentage of houses with insulation – Warm Homes Survey (Wilton, 2005) ............ 33 Table 16 Ceiling insulation coverage in pre-1980 houses (owner-occupier) (% of households)35 Table 17 Ceiling insulation thickness – all houses with insulation (owner-occupier) ............... 35 Table 18 Wall, floor and window insulation – House Condition Survey 2005.......................... 35 Table 19 Estimated energy use in residential buildings 2004 (PJ)............................................. 36 Table 20 Energy costs of heating 2005 ...................................................................................... 38
Figures Figure 1 Estimated energy use profile by month (Source: composite based on this study)....... 37
Sustainability Options for Retrofitting New Zealand Houses – theoretical cost benefit analysis: TE106/8
A theoretical cost benefit analysis was carried out on a range of options detailed in Section 3 for both water and energy efficiency retrofit levels of existing New Zealand houses. The energy benefits were based on modelling using the BRANZ ALF model, and the water and waste benefits were based on the experience from the Waitakere NOW Home®. As the improvements were not able to be quantified, the indoor environment quality and associated health improvements which result from insulation have not been included in these theoretical cost benefit analyses.
At a national level, the following options have a theoretical internal rate of return greater than 5% making them worthwhile implementing from a financial perspective:
Rainwater tanks (2,000 litre) for Auckland only (assuming 100% water retention) Low flow shower heads for high pressure systems Water efficient (“AAA”) washing machines Water heating upgrade (if current water heating tank needs replacing)
- Solar hot water heating - Heat pump hot water heating - Instant gas hot water heating
Floor insulation Ceiling insulation
1.2 Further Work The work outlined in this report is the result of theoretical equations and modelling, not actual examples of retrofitting. In addition it does not consider the impacts on health which result from insulation retrofits in particular. Some potential next steps arising from this work are:
to undertake research into actual retrofit outcomes and derive cost–benefit analyses from these, both from a national perspective, and also with consideration to regional differences; and
to undertake research into the costs and benefits of insulation from an Indoor Environment Quality (health) perspective and review the theoretical cost benefit analyses in light of this research.
With regard to the TE106 retrofit project, these theoretical cost benefit analyses can be used to assist in development of a priority matrix for testing retrofit technologies, essentially providing the hypothesis which the research will address.
Sustainability Options for Retrofitting New Zealand Houses – theoretical cost benefit analysis: TE106/8
Page 2
2 Introduction Beacon Pathway Ltd is investigating the case for accelerating the retrofitting of sustainability measures into existing New Zealand homes to improve health, reduce energy and water consumption and minimise the environmental impact of energy use in the home.
This report is the second of two reports for the first stage of the retrofit program to provide input to the monitoring of 10 houses that will be retrofitted sustainably. A companion report which outlines a desktop study on energy retrofit research projects in New Zealand has also been completed. This report provides information to assist the decision making for the second stage of the Beacon Retrofit Program, being a cost benefit analysis focusing on energy, water and waste. The outputs will define achievable retrofit options that can be applied to the 10 houses to be retrofitted and identify the gaps indicating potential new opportunities for further research or technologies.
Sustainability Options for Retrofitting New Zealand Houses – theoretical cost benefit analysis: TE106/8
Page 3
3 Theoretical cost benefit analysis of retrofit options There are varying degrees of energy and water efficiency measures available in New Zealand today, some of which are designed to make a dwelling almost completely independent of the reticulated infrastructure. Many of the measures involved in achieving this sort of efficiency are not financially feasible with present energy and water prices. As the intentions of this analysis are to establish a cost effective way to retrofit from the homeowner’s perspective, the analysis has been carried out in the following areas:
Water Efficiency - Rainwater tanks - Low flow shower heads - Low flow taps/flow restrictors on taps - Dual flush toilets - Water efficient washing machines
Energy Efficiency - Water heating – if replacement of old system is required.
a) Solar hot water b) Heat pump c) Instant gas
- Glazing systems – both full replacement and alteration of existing frames. - Insulation
a) Timber floors b) Walls – retrofitted from both interior and exterior c) Ceiling
- Compact fluorescent light bulbs - Energy efficient bundle (draught stoppers, hot water cylinder wraps and pipe lagging,
thermal curtains with pelmets) Waste (costs only)
- Worm farm - Compost
The materials for these were priced using discount rates that an average-sized residential building company should have available to them. This was achieved using a price guide from a major national building supplier, Rawlinsons, and local contractor rates for each region and appliance prices. Eight regions were selected to represent different areas of New Zealand, metro/city, urban and rural. These are:
The analysis in this report is based on three people living in a 150m2 single storey building. It is intended to highlight where the most cost effective savings could be made.
The threshold set for water conservation and energy efficiency measures was an Internal Rate of Return (IRR) of at least 5%. This is because the expected return should be at least equal to a bank term deposit (currently about 7.5% less tax @ 33% i.e. a 5% return).
Internal Rate of Return (IRR)
The IRR is the return achieved in the extra initial expenditure, (i.e. more than code standard insulation) compared to the cost savings (i.e. extra energy savings compared to standard insulation). The calculations are based on a 20 year analysis period.
The formula is: P=R*USPWFr/n
Where P = Extra initial cost R = Value of the additional energy/water savings.
USPWFr/n = Uniform series discount factor for period n years and a discount rate of r.
The r value is trialled until the two sides of the equation are equal, giving the internal rate of return.
Simple Payback
An energy investment's simple payback period is the amount of time it will take to recover the initial investment in energy savings divided by the extra initial installed cost by the annual energy cost savings. For example, a heat pump HWC costs $3,728 more than a standard electric HWC; and saves $312 per year giving it a simple payback of 3,728 divided by 312 or 11.9 years.
SIMPLE PAYBACK = Additional Extra Initial Costs = years
Annual Savings
Sustainability Options for Retrofitting New Zealand Houses – theoretical cost benefit analysis: TE106/8
Page 5
3.1 Theoretical Cost Benefit for Water Efficiency
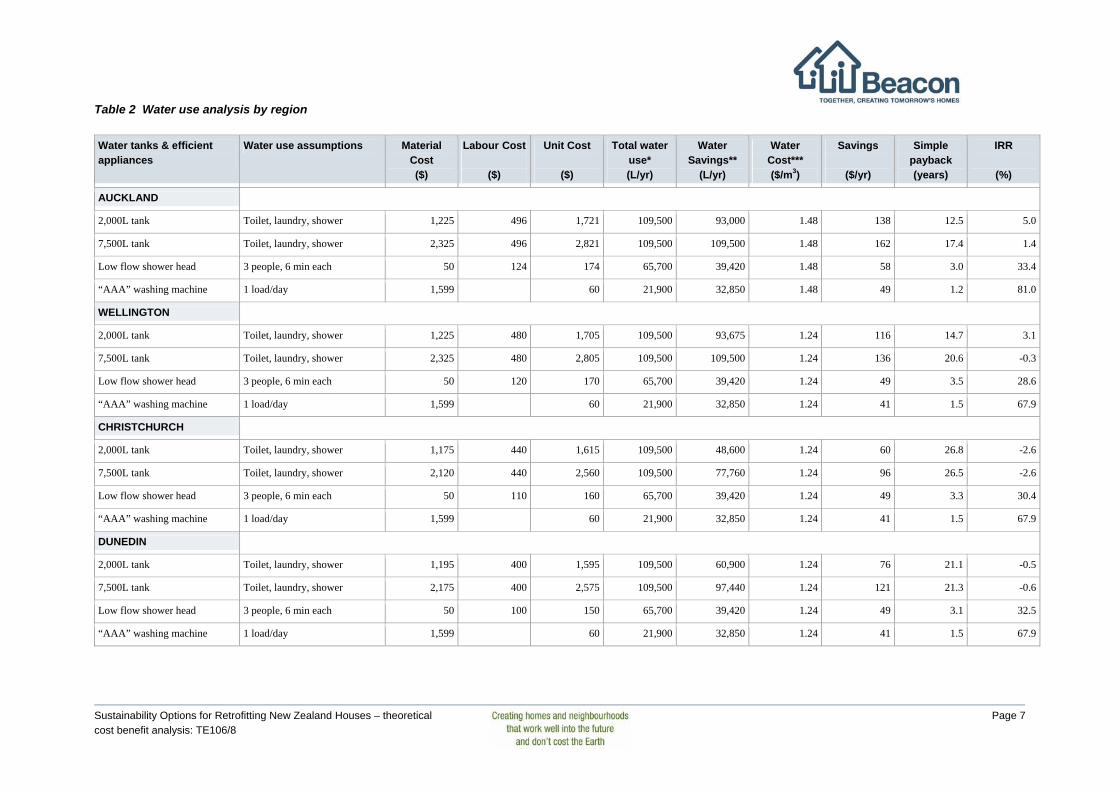
Table 1 is a summary of the amount of water that can potentially be captured annually from a 150m2 roof. It also shows how many times (cycles) the captured rainwater could be used for each appliance if only used for that particular purpose. This is to show the total potential rain water captured.
The water costs per m3 are derived from local council rates and where no water charges apply, estimates have been made using figures from nearby councils. (Of the centres used in this study only Auckland currently has water charges in place.) These have been included to show the regional variations in water costs and therefore potential savings made from installing a water tank vary. Some Regional Councils also have rebates in place to provide further incentives for households to install water storage tanks. For analysis purposes, rebates have been excluded.
In reality, due to seasonal changes, evaporation, first-flush diverters, and tank size availability, the total rainfall is unlikely to be used. Table 2 shows the water savings for two tank sizes (2,000L and 7,500L). For the 2,000L rainwater tank, the total amount of rain captured from the roof is 50% and for the large tank (7,500L) it has been assumed to be 80%. The material cost of the water storage tanks allows for a low pressure water pump, but does not allow for the down pipes required to deliver the water to the tanks as each situation is different.
Low flow shower heads are a cost effective and simple way to lower water usage which have been evaluated on the basis of a straight replacement. For the cost benefit analysis, information from the HEEP data (Isaacs et al, 2004) was used. This stated the average mains pressure shower system uses approximately 12L/min which could be reduced to 5 to 7L with a low flow
Sustainability Options for Retrofitting New Zealand Houses – theoretical cost benefit analysis: TE106/8
Page 6
shower head. Therefore the savings were based on 6L/min with an average shower time of six minutes.
Water efficient washing machines (60L/wash) on the other hand have been evaluated under the basis that the washing machine in place is due for an upgrade and therefore the additional cost of $60 is that over a new standard washing machine (150L/wash). This assumption has been used because it is highly unlikely someone will buy a new washing machine whilst their current one is working.
The water savings provided in Table 2 show the amount of water used compared to not retrofitting a home with the selected water efficiency measure. For example, if in Auckland, a family installs a 2,000L rainwater tank, they could potentially collect and use about 50% of the rainfall from the roof which gives water savings of 93,000L. However, this amount of rainwater is not enough to provide for the total needs of their laundry, shower and toilet (109,500L) even with water efficiency measures in place for all three end uses. A 7,500L tank, however, can harvest more water (estimated at 80%) and therefore not only can provide water for all three designated end uses, but will have some left over for other uses such as watering the garden.
For the low flow shower heads and “AAA” washing machines, the total use is the amount used with the water efficient measure in place and the savings are the difference between this and a non-water efficient appliance or device.
Sustainability Options for Retrofitting New Zealand Houses – theoretical cost benefit analysis: TE106/8
* Total amount of water used assuming water efficient measures have been retrofitted. ** Water saved by using a rainwater tank or installing a water efficiency measure (reduced shower flow or water efficient washing machine). *** Note 1m3 is equivalent to 1,000L. Note: Low flow shower heads reduce normal head flow rate from 10L/min to 6L/min
Sustainability Options for Retrofitting New Zealand Houses – theoretical cost benefit analysis: TE106/8
Page 9
3.1.1 Cost benefit The results of the cost benefit analysis show that homes in all regions, with the exception of Rotorua, choosing to install a water efficient washing machine when replacement is needed and a low flow showerhead, achieve a financial benefit from retrofitting. In Rotorua, only the washing machine replacement has an IRR over 5%, although the low flow shower head was close, with an IRR of 4.4% (albeit a payback period of 13.1 years). The reason for this is the very low unit cost for water in Rotorua.
The only region where rainwater tanks meet the 5% IRR (at payback of 12.5 years) was in Auckland for the 2,000L tank (the 7,500L tank IRR equals 1.4%). With a payback period at best over 10 years, it is not surprising the harvesting of rainwater through installation of tanks has been minimal. Rotorua had the worst payback at -10.9%. In some areas councils provide subsidies for homeowners to install rainwater tanks and it seems likely this will be necessary (or a considerable increase in the price of water) for consumers to take this up without any regulation.
However, given the likelihood that water shortages are going to become more of an issue in the future and water metering is likely to increase in many areas, the cost of water should be expected to increase. With this in mind, it could be assumed these calculations are on the conservative side. Outside of Auckland a range of other councils (Nelson, Tauranga, and soon Kapiti Coast) also charge a significant amount for water, and the IRR of 5% may well be achieved in these areas if retention approaches 100%.
3.2 Theoretical Energy Conservation Through Retrofit The savings represented in this report are based on three people living in a 150m2 single story building with a 3:1 wall to window ratio facing solar noon. A three person house is the closest full number to the average household in New Zealand of 2.9 persons and 150m² is representative of a typical existing house. However there is no ‘typical or representative’ amount for north facing glazing. The energy benefits of insulation have been simulated using ALF3. Each level of the above measures was simulated one at a time using the following as base levels:
Glazing – Single glazing R0.16 Timber floors – no insulation as this is the state of approximately 65% of New Zealand
houses. Walls – no insulation as this is the state of approximately 55% of New Zealand houses. Ceiling – R0.3 no insulation because approximately 36% of New Zealand houses have less
than 50mm insulation. It must be noted that adding the benefits of each measure together will overstate the level of savings achieved from multiple measures. To cover the variability in both pricing and climate, the four main centres (Auckland, Wellington, Christchurch and Dunedin) and four smaller regions (Rotorua, Gisborne, Masterton and Invercargill) were used for the cost benefit analysis calculations.
Sustainability Options for Retrofitting New Zealand Houses – theoretical cost benefit analysis: TE106/8
Page 10
Water Heater Replacement Due to the expense of replacing a hot water cylinder (HWC), the analysis of hot water heating has been calculated on the basis that the existing cylinder is in need of replacement, similar to the washing machine. The feasibility of each system is then compared to that of a standard HWC on day rates. The extra material cost incurred in electric night store HWCs is due to the need for an extra meter to be installed for night rates if one is not already in place. Due to differences in power prices from region to region, it is more cost effective in some locations to leave the HWC on day rates. The fuel prices for gas fired water systems are based on the cheapest options for each region. For the North Island this is mostly reticulated natural gas. Where natural gas is not available, 45kg LPG bottle prices have been used. The energy savings gained through the adoption of solar water heaters were calculated using a program designed by RetScreen International1. The coefficient of performance for the heat pump water heaters were estimated using figures from a report by Carrington2.
Glazing types Other than the glazing units that have been retrofitted into rerouted timber frames, all glazed windows have been analysed on the basis that the windows require replacement due to rot, settling of the building or general replacement. All frame prices are for standard aluminium frames fitted back into the same sized opening and rearchitraved. Note that no painting of architraves or window sills has been allowed for.
Table 3 below shows the percentage change from a standard aluminium frame window to an alternative with a more energy efficient frame. For example, the additional capital cost of using a composite aluminium frame instead of a standard aluminium frame when installing double glazing in Wellington is 71%. These more efficient frames were not included in the main analysis as the additional cost was not justifiable.
1 http://www.retscreen.net 2 Carrington G., Demonstration of a hot water heat pump system. Report 102, New Zealand Energy Research and Development Committee.
Sustainability Options for Retrofitting New Zealand Houses – theoretical cost benefit analysis: TE106/8
Page 11
Table 3 Cost increase of window frame with the same glazing type compared to a standard aluminium frame, expressed as a percentage increase
Percentage change of window prices for alternative frame types
The minimum Building Code level of insulation is used for each region, which varies between the North and South Islands. From there, the levels of insulation are increased by a factor of 1.5 and 2, which are then matched to the closest R-value of an actual insulation product currently available in New Zealand. However in the South Island, for the walls, it was not possible to use a double code R-value, due to inadequate cavity space in a standard 100x50 framed building.
Timber Floor Insulation The floor insulation has been calculated on the basis that there is sufficient access and crawl space (600mm) under the building to fit the insulation. Underfloor foil with fibre cement sheet is more expensive than two layers of expanded polystyrene foam as the labour required to fit the product for the latter is much less.
Wall Insulation The cost of insulating the walls of the dwellings have been calculated in two different ways; firstly by tearing down the interior plasterboard linings, insulating and then fitting new plasterboard, skirting and scotia followed by painting. Secondly, if the dwelling has weatherboard cladding that requires repainting or replacement of rotten boards, the insulation can be fitted by pulling off the weatherboards and fitting the insulation from the exterior. The external weatherboard analysis has been broken down into three groups: 10, 20, and 30% replacement of old weatherboards which are damaged during removal and need to be replaced. The costs allow for new building paper, cavity battens and fixing of weatherboards on a single storey house on a flat section (does not allow for scaffolding). Painting costs are not included, as these would have been incurred by the owner as repainting was already required. Also, some weatherboards may be rotten and need replacing in any case. This cost has not been included in
Sustainability Options for Retrofitting New Zealand Houses – theoretical cost benefit analysis: TE106/8
Page 12
the analysis. Although the second option is more expensive, less waste is produced in this application as the majority of weatherboards are re-used.
Ceiling Insulation As mentioned earlier the base line level of insulation is R-0.3, because BRANZ Ltd research has shown that 36% of houses in New Zealand have less than 50mm of insulation in place.
3.2.1 Auckland Cost Benefit In the Auckland region the theoretical cost benefit analysis for any retrofit space heating savings is well below the desired IRR of 5%. This is primarily due to the warmer climate than in the rest of the country. Benefits arising from improvements to indoor environment quality and improved health have not been considered as part of the equation. With the proportionally large number of houses in the Auckland region, this suggests any market transformation on space heating savings alone will need to be different for the Auckland region (and north of Auckland) compared to the rest of the country as the financial drivers are not as strong. It is likely other drivers such as comfort and health benefits outweigh the financial ones.
The theoretical energy saving from water heating options that are financially feasible include instant gas hot water and solar hot water. Heat pump hot water systems are just below the 5% threshold at IRR 4.6%.
Sustainability Options for Retrofitting New Zealand Houses – theoretical cost benefit analysis: TE106/8
Page 13
Table 4 Theoretical Energy Efficiency Cost Benefit Analysis – AUCKLAND
Products Material Cost ($)
Labour Cost ($)
Additional installed costs ($)
Fuel efficiency
Input (kWh/yr)
Fuel ($/kWh)
Savings (kWh)
Running Cost ($/yr)
Savings in running
costs($/yr)
Simple payback (years)
IRR (%)
Water Heating Replacement unit
Electrical HWC Electric night store HWC
1,095 1,230
150 150
0 135
1.00 1.00
2,665 3,197
0.183 0.151
0 -533
487 482
0 4
31.3
-3.9
Gas Instant 26L Gas Storage
1,332 3,439
320 320
408 2,814
0.90 0.90
2,261 2,961
0.086 0.086
404 -296
333 393
154 93
2.7 30.1
37.6 -3.6
Solar Heat pump HWC
4.720 4,657
1,500 500
5,275 4,213
1.00 1.00
311 871
0.183 0.183
2,354 1,794
57 159
430 328
12.3 12.9
5.2 4.6
Glazing types – min. code = R-0.26 unit
Single Rerout & fit DG units in ex timber frame Double, 4-12-4 Double Low-E, 4-12-4 Double Low-E Argon, 4-12-4
Material costs: for the night store heater the cylinder size needs to be latger (say 300L instead of the assumed 250L HWC) kWh/yr input: the LPG instant heat cylinder avoids standing losses of 700kWh/yr Fuel efficiency: gas fired cylinders are less efficient than electric cylinders due to flue head losses IRR: the base case for calculating the IRR are: electric HWC, single glazing, no floor insulation and no or 50mm ceiling insulation.
Sustainability Options for Retrofitting New Zealand Houses – theoretical cost benefit analysis: TE106/8
Page 14
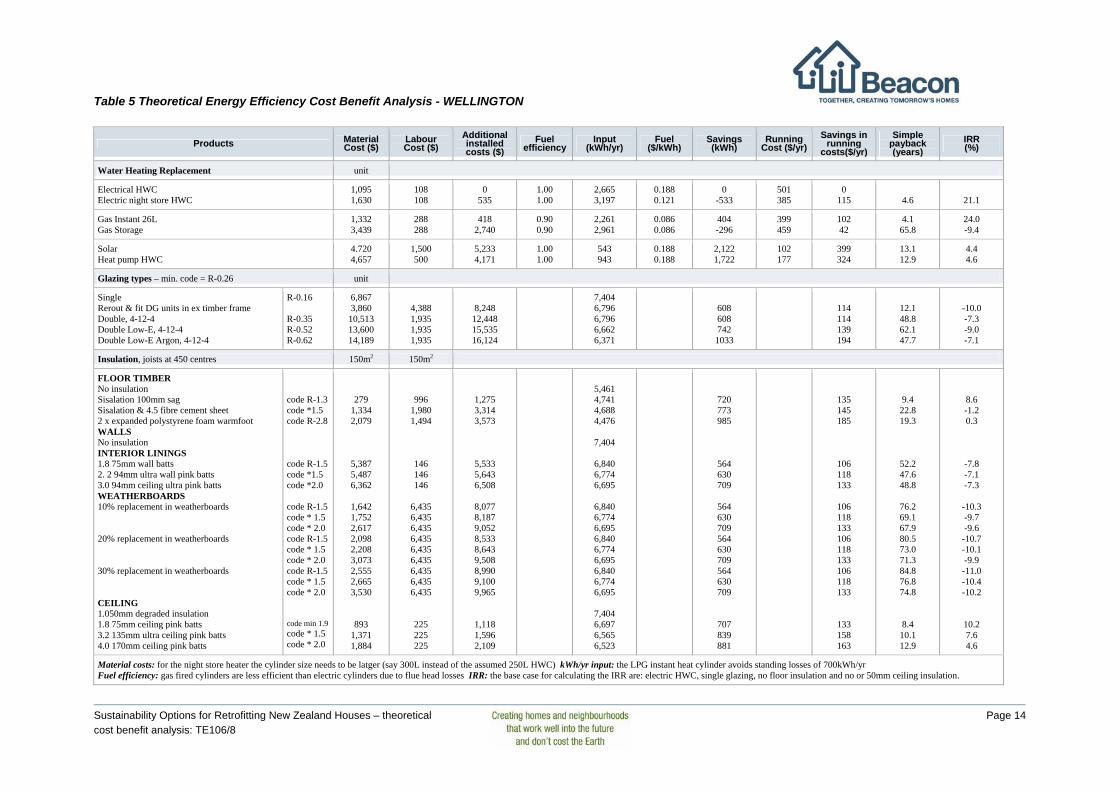
Table 5 Theoretical Energy Efficiency Cost Benefit Analysis - WELLINGTON
Products Material Cost ($)
Labour Cost ($)
Additional installed costs ($)
Fuel efficiency
Input (kWh/yr)
Fuel ($/kWh)
Savings (kWh)
Running Cost ($/yr)
Savings in running
costs($/yr)
Simple payback (years)
IRR (%)
Water Heating Replacement unit
Electrical HWC Electric night store HWC
1,095 1,630
108 108
0 535
1.00 1.00
2,665 3,197
0.188 0.121
0 -533
501 385
0 115
4.6
21.1
Gas Instant 26L Gas Storage
1,332 3,439
288 288
418 2,740
0.90 0.90
2,261 2,961
0.086 0.086
404 -296
399 459
102 42
4.1 65.8
24.0 -9.4
Solar Heat pump HWC
4.720 4,657
1,500 500
5,233 4,171
1.00 1.00
543 943
0.188 0.188
2,122 1,722
102 177
399 324
13.1 12.9
4.4 4.6
Glazing types – min. code = R-0.26 unit
Single Rerout & fit DG units in ex timber frame Double, 4-12-4 Double Low-E, 4-12-4 Double Low-E Argon, 4-12-4
Material costs: for the night store heater the cylinder size needs to be latger (say 300L instead of the assumed 250L HWC) kWh/yr input: the LPG instant heat cylinder avoids standing losses of 700kWh/yr Fuel efficiency: gas fired cylinders are less efficient than electric cylinders due to flue head losses IRR: the base case for calculating the IRR are: electric HWC, single glazing, no floor insulation and no or 50mm ceiling insulation.
Sustainability Options for Retrofitting New Zealand Houses – theoretical cost benefit analysis: TE106/8
Page 15
Table 6 Theoretical Energy Efficiency Cost Benefit Analysis – CHRISTCHURCH
Products Material Cost ($)
Labour Cost ($)
Additional installed costs ($)
Fuel efficiency
Input (kWh/yr)
Fuel ($/kWh)
Savings (kWh)
Running Cost ($/yr)
Savings in running
costs($/yr)
Simple payback (years)
IRR (%)
Water Heating Replacement unit
Electrical HWC Electric night store HWC
1,095 1,227
135 135
0 132
1.00 1.00
2,665 3,197
0.183 0.151
0 -533
488 361
0 127
1.0
96.1
Gas Instant 26L Gas Storage
1,332 3,439
360 360
463 2,569
0.90 0.90
2,261 2,961
0.086 0.086
404 -296
376 477
112 11
4.1 236.6
23.9 -17.0
Solar Heat pump HWC
4.720 4,657
1,500 500
4,990 3,928
1.00 1.00
595 980
0.183 0.183
2,070 1,684
109 180
379 309
13.2 12.7
4.4 4.8
Glazing types – min. code = R-0.26 Unit
Single Rerout & fit DG units in ex timber frame Double, 4-12-4 Double Low-E, 4-12-4 Double Low-E Argon, 4-12-4
Material costs: for the night store heater the cylinder size needs to be latger (say 300L instead of the assumed 250L HWC) kWh/yr input: the LPG instant heat cylinder avoids standing losses of 700kWh/yr Fuel efficiency: gas fired cylinders are less efficient than electric cylinders due to flue head losses IRR: the base case for calculating the IRR are: electric HWC, single glazing, no floor insulation and no or 50mm ceiling insulation.
Sustainability Options for Retrofitting New Zealand Houses – theoretical cost benefit analysis: TE106/8
Page 16
Table 7 Theoretical Energy Efficiency Cost Benefit Analysis – DUNEDIN
Products Material Cost ($)
Labour Cost ($)
Additional installed costs ($)
Fuel efficiency
Input (kWh/yr)
Fuel ($/kWh)
Savings (kWh)
Running Cost ($/yr)
Savings in running
costs($/yr)
Simple payback (years)
IRR (%)
Water Heating Replacement unit
Electrical HWC Electric night store HWC
1,095 1,225
108 108
0 130
1.00 1.00
2,665 3,197
0.214 0.173
0 -533
570 553
0 16
7.9
11.1
Gas Instant 26L Gas Storage
1,332 3,439
288 288
418 2,524
0.90 0.90
2,261 2,961
0.143 0.143
404 -296
339 499
171 71
2.4 35.5
40.9 -4.9
Solar Heat pump HWC
4.720 4,657
1,500 500
5,017 3,955
1.00 1.00
798 1031
0.214 0.214
1,867 1,633
171 221
399 349
12.6 11.3
4.9 6.2
Glazing types – min. code = R-0.26 Unit
Single Rerout & fit DG units in ex timber frame Double, 4-12-4 Double Low-E, 4-12-4 Double Low-E Argon, 4-12-4
Material costs: for the night store heater the cylinder size needs to be larger (say 300L instead of the assumed 250L HWC) kWh/yr input: the LPG instant heat cylinder avoids standing losses of 700kWh/yr Fuel efficiency: gas fired cylinders are less efficient than electric cylinders due to flue head losses IRR: the base case for calculating the IRR are: electric HWC, single glazing, no floor insulation and no or 50mm ceiling insulation.
Sustainability Options for Retrofitting New Zealand Houses – theoretical cost benefit analysis: TE106/8
Page 17
3.2.2 Wellington Cost Benefit Electric night store and instant gas heaters both have very favourable theoretical cost benefit analysis results, when an upgrade of a hot water cylinder is required in the Wellington region. The payback period is between 4-5 years.
For thermal efficiency, improvements installing insulation in the ceiling and underfloor insulation (foil) have the most significant benefit in terms of theoretical energy saved. It is interesting to note the higher value options are theoretically less cost effective, since you achieve greater savings per R-value at the lower end compared to the higher R-values.
With the work required to install insulation in the walls (by either taking off the internal lining or removing the external weatherboards) this analysis based on the modelling results shows wall insulation is not cost effective. The return rates are as low as -11.0% and paybacks are between 60 and 80 years. This is typical for all centres used for this analysis.
3.2.3 Christchurch Cost Benefit A similar pattern to Wellington is seen with the Christchurch data. Theoretically night-store heaters are a much more favourable option, although it is likely to be dependent on the charging cost structure of the electricity company chosen by the homeowner.
Despite a theoretical low (negative) return rate for retrofitting double glazing, it is an option available in the Christchurch area that has been increasing in popularity over the last years. The financial benefits are not the only reasons for people to choose a more energy efficient retrofit option. Research into improvements in Indoor Environment Quality as well as monitoring of actual retrofit situations may give reasons why this is the case.
Solar hot water and heat pumps for hot water heating are theoretically just below 5% IRR at 4.4% and 4.8% respectively.
3.2.4 Dunedin Cost Benefit The theoretical savings from hot water are similar to Christchurch although instant gas has a better IRR than night-store. The solar hot water and heat pumps IRR’s hover between the 4-6% mark.
With the colder climate in Dunedin the theoretical payback for ceiling insulation is between 5-10 years with all three of the ceiling insulation options over the IRR 5% threshold. Retrofit trials for walls to look at ways to reduce costs for this retrofit option may be useful. All options for insulating underfloor insulation look acceptable with theoretical internal return rates from 4.4% to 16.4%. The low cost of foil and ease of installation provides a very good theoretical IRR for this option. However, this is assuming it will last 20 years, which requires that it be protected from wind, salts and animals.
Sustainability Options for Retrofitting New Zealand Houses – theoretical cost benefit analysis: TE106/8
Page 18
Table 8 Theoretical Energy Efficiency Cost Benefit Analysis - ROTORUA
Products Material Cost ($)
Labour Cost ($)
Additional installed costs ($)
Fuel efficiency
Input (kWh/yr)
Fuel ($/kWh)
Savings (kWh)
Running Cost ($/yr)
Savings in running
costs($/yr)
Simple payback (years)
IRR (%)
Water Heating Replacement unit
Electrical HWC Electric night store HWC
1,095 1,230
165 165
0 135
1.00 1.00
2,665 3,197
0.223 0.170
0 -533
593 543
0 50
2.7
37.1
Gas Instant 26L Gas Storage
1,332 3,439
440 440
513 2,619
0.90 0.90
2,261 2,961
0.070 0.070
404 -296
263 312
330 281
1.6 9.3
64.4 8.7
Solar Heat pump HWC
4.720 4,657
1,500 500
4,960 3,898
1.00 1.00
432 925
0.223 0.223
2,233 1,740
96 206
497 387
10.0 10.1
7.8 7.7
Glazing types – min. code = R-0.26 unit
Single Rerout & fit DG units in ex timber frame Double, 4-12-4 Double Low-E, 4-12-4 Double Low-E Argon, 4-12-4
Material costs: for the night store heater the cylinder size needs to be latger (say 300L instead of the assumed 250L HWC) kWh/yr input: the LPG instant heat cylinder avoids standing losses of 700kWh/yr Fuel efficiency: gas fired cylinders are less efficient than electric cylinders due to flue head losses IRR: the base case for calculating the IRR are: electric HWC, single glazing, no floor insulation and no or 50mm ceiling insulation.
Sustainability Options for Retrofitting New Zealand Houses – theoretical cost benefit analysis: TE106/8
Page 19
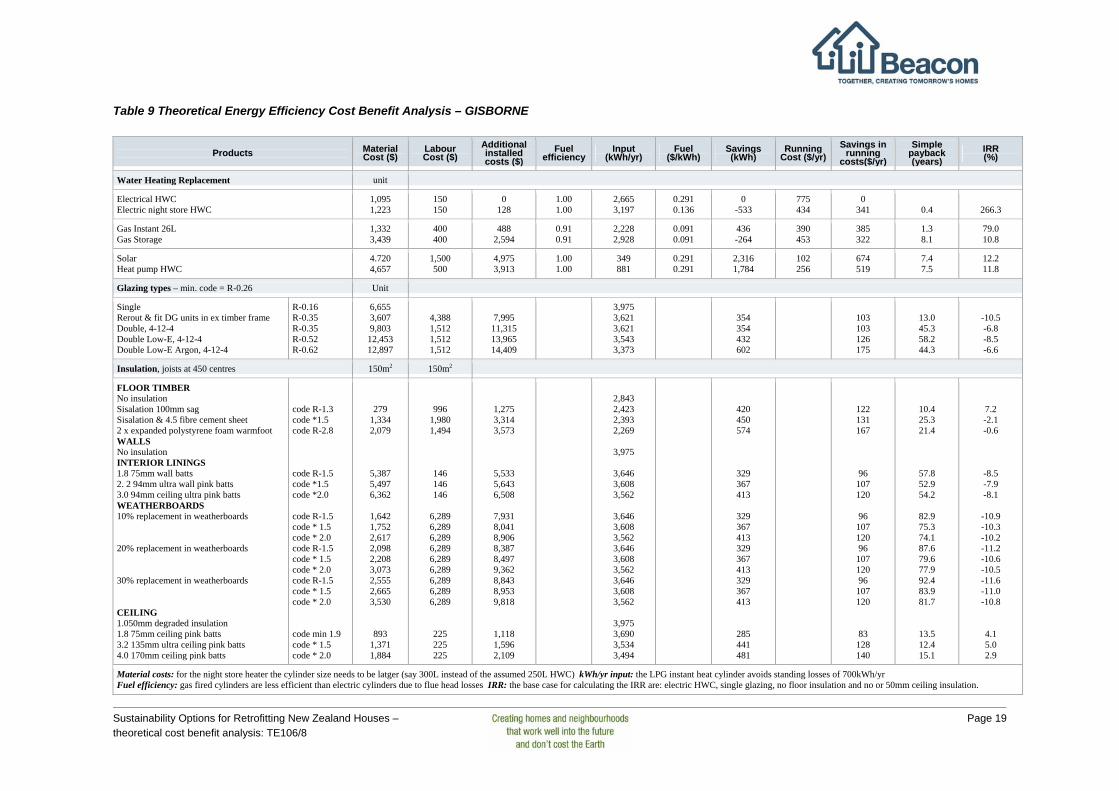
Table 9 Theoretical Energy Efficiency Cost Benefit Analysis – GISBORNE
Products Material Cost ($)
Labour Cost ($)
Additional installed costs ($)
Fuel efficiency
Input (kWh/yr)
Fuel ($/kWh)
Savings (kWh)
Running Cost ($/yr)
Savings in running
costs($/yr)
Simple payback (years)
IRR (%)
Water Heating Replacement unit
Electrical HWC Electric night store HWC
1,095 1,223
150 150
0 128
1.00 1.00
2,665 3,197
0.291 0.136
0 -533
775 434
0 341
0.4
266.3
Gas Instant 26L Gas Storage
1,332 3,439
400 400
488 2,594
0.91 0.91
2,228 2,928
0.091 0.091
436 -264
390 453
385 322
1.3 8.1
79.0 10.8
Solar Heat pump HWC
4.720 4,657
1,500 500
4,975 3,913
1.00 1.00
349 881
0.291 0.291
2,316 1,784
102 256
674 519
7.4 7.5
12.2 11.8
Glazing types – min. code = R-0.26 Unit
Single Rerout & fit DG units in ex timber frame Double, 4-12-4 Double Low-E, 4-12-4 Double Low-E Argon, 4-12-4
Material costs: for the night store heater the cylinder size needs to be latger (say 300L instead of the assumed 250L HWC) kWh/yr input: the LPG instant heat cylinder avoids standing losses of 700kWh/yr Fuel efficiency: gas fired cylinders are less efficient than electric cylinders due to flue head losses IRR: the base case for calculating the IRR are: electric HWC, single glazing, no floor insulation and no or 50mm ceiling insulation.
Sustainability Options for Retrofitting New Zealand Houses – theoretical cost benefit analysis: TE106/8
Page 20
Table 10 Theoretical Energy Efficiency Cost Benefit Analysis – MASTERTON
Products Material Cost ($)
Labour Cost ($)
Additional installed costs ($)
Fuel efficiency
Input (kWh/yr)
Fuel ($/kWh)
Savings (kWh)
Running Cost ($/yr)
Savings in running
costs($/yr)
Simple payback (years)
IRR (%)
Water Heating Replacement unit
Electrical HWC Electric night store HWC
1,095 1,230
135 135
0 135
1.00 1.00
2,665 3,197
0.258 0.126
0 -533
691 404
0 287
0.5
Gas Instant 26L Gas Storage
1,332 3,439
360 360
463 2,569
0.90 0.90
2,261 2,961
0.148 0.148
404 -296
402 505
289 186
1.6 13.8
62.5 3.8
Solar Heat pump HWC
4.720 4,657
1,500 500
4,990 3,928
1.00 1.00
493 931
0.259 0.259
2,172 1,734
128 241
563 450
8.0 8.7
9.4 9.6
Glazing types – min. code = R-0.26 unit
Single Rerout & fit DG units in ex timber frame Double, 4-12-4 Double Low-E, 4-12-4 Double Low-E Argon, 4-12-4
Material costs: for the night store heater the cylinder size needs to be larger (say 300L instead of the assumed 250L HWC) kWh/yr input: the LPG instant heat cylinder avoids standing losses of 700kWh/yr Fuel efficiency: gas fired cylinders are less efficient than electric cylinders due to flue head losses IRR: the base case for calculating the IRR are: electric HWC, single glazing, no floor insulation and no or 50mm ceiling insulation.
Sustainability Options for Retrofitting New Zealand Houses – theoretical cost benefit analysis: TE106/8
Page 21
Table 11 Theoretical Energy Efficiency Cost Benefit Analysis – INVERCARGILL
Products Material Cost ($)
Labour Cost ($)
Additional installed costs ($)
Fuel efficiency
Input (kWh/yr)
Fuel ($/kWh)
Savings (kWh)
Running Cost ($/yr)
Savings in running
costs($/yr)
Simple payback (years)
IRR (%)
Water Heating Replacement unit
Electrical HWC Electric night store HWC
1,095 1,225
168 168
0 130
1.00 1.00
2,665 3,197
0.180 0.100
0 -533
480 319
0 161
0.8
124.1
Gas Instant 26L Gas Storage
1,332 3,439
448 448
518 2,624
0.90 0.90
2,261 2,961
0.281 0.281
404 -296
698 895
-218 -415
-2.4 -6.3
-ve -ve
Solar Heat pump HWC
4.720 4,657
1,500 500
4,957 3,895
1.00 1.00
798 1,035
0.180 0.180
1,867 1,630
144 187
336 294
14.7 13.3
3.1 4.3
Glazing types – min. code = R-0.26 Unit
Single Rerout & fit DG units in ex timber frame Double, 4-12-4 Double Low-E, 4-12-4 Double Low-E Argon, 4-12-4
Material costs: for the night store heater the cylinder size needs to be latger (say 300L instead of the assumed 250L HWC) kWh/yr input: the LPG instant heat cylinder avoids standing losses of 700kWh/yr Fuel efficiency: gas fired cylinders are less efficient than electric cylinders due to flue head losses IRR: the base case for calculating the IRR are: electric HWC, single glazing, no floor insulation and no or 50mm ceiling insulation.
Sustainability Options for Retrofitting New Zealand Houses – theoretical cost benefit analysis: TE106/8
Page 22
3.2.5 Compact Fluorescent Lights (CFLs) Potentially one of the simplest ways of saving money is by replacing standard incandescent lights with CFLs. If a high CFL is used with a lifetime of 10,000 hours then a basic calculation shows that at 18c/kWh a CFL lamp will save approximately $100 over the lifetime of the bulb, which is a significant saving.
Wider benefits of using CFLs throughout New Zealand are a reduced winter peak load on the electricity network, which delays the need for new transmission lines, reduces greenhouse gas emissions and waste to landfill given the fact they last 10 times longer than a standard light.
To achieve this level of savings, high quality CFLs must be used with a good power factor (above 0.9) and good harmonics.
Depending on the heating type used, it may be that the theoretical savings from the CFLs are reduced because the heat released by the incandescent bulbs (which makes them inefficient) will need to be replaced by another heating source. If this other source is an electric resistance heater, (which typically is low wattage), it is likely that some of the savings will be taken back in additional heating costs. This will not only reduce the savings for the homeowner but also reduce the peak load savings. However, if another source of fuel is used and particularly if it has high wattage (and by default higher internal temperatures), it is less likely that this take back will occur, as the room will be sufficiently warm.
3.2.6 Greenhouse Gas Emissions The Kyoto Protocol is an international treaty that is aimed at lowering greenhouse gas emissions to 1990 levels. One of the leading contributors to these emissions on an international level is carbon emissions. By lowering our energy use through insulating our homes to a better level, the carbon emissions are also reduced. The results from lowering the carbon emissions (by location) through insulating all housing stock to standard Building Code level is shown in the tables below.
For the carbon emissions to be “collected” it has to be assumed all the savings of an insulation retrofit will be taken as energy savings and there will be no take back from increased temperatures. So, emissions savings are in direct competition to comfort improvement through temperature increase (and hence health benefits). Therefore it is not possible to claim the carbon savings as calculated below and comfort and health benefits together. Indeed this is also true for the energy savings.
In all regions theoretically more emissions are saved through insulating the floors with underfloor foil than the other insulation retrofits options (i.e. increasing the R-value of the ceiling or insulating the walls). This is based on the number of houses that require that improvement in each region. For the ceiling insulation, the percentage of houses was determined using the BRANZ House Condition Survey (Clark et al, 2006) based on the percentage of houses (compared to total number of houses in the region) that have 50mm or less insulation. The percentage of houses requiring underfloor insulation and wall insulation was estimated to be the number of houses built before 1979.
Sustainability Options for Retrofitting New Zealand Houses – theoretical cost benefit analysis: TE106/8
Page 23
Table 12. Potential Greenhouse Gas Emissions
Auckland CO2 Annual Emission Savings (kg) with insulation levels lifted to meet the Building Code
Annual CO2
Emission Savings (kg)
Carbon Emissions
Savings (kg)
Cost to Insulate ($000)
21% of houses with 0-50mm ceiling insulation 3,321,511 905,867 100,319
60% of houses with no wall insulation 7,592,026 2,070,553 1,419,177
60% of houses with no floor insulation 9,926,061 2,707,108 327,021
Wellington CO2 Annual Emission Savings (kg) with insulation levels lifted to meet the Building Code
Annual CO2
Emission Savings (kg)
Carbon Emissions
Savings (kg)
Cost to Insulate ($000)
32% of houses with 0-50mm ceiling insulation 3,308,163 902,226 52,290
75% of houses with no wall insulation 6,185,260 1,686,889 606,805
74% of houses with no floor insulation 7,709,795 2,124,762 137,962
Christchurch CO2 Annual Emission Savings (kg) with insulation levels lifted to meet the Building Code
Annual CO2
Emission Savings (kg)
Carbon Emissions Savings (kg)
Cost to Insulate ($000)
24% of houses with 0-50mm ceiling insulation 3,562,992 971,725 50,745
66% of houses with no wall insulation 6,949,670 1,895,365 563,840
62% of houses with no floor insulation 8,321,912 2,269,612 210,986
Dunedin CO2 Annual Emission Savings (kg) with insulation levels lifted to meet the Building Code
Annual CO2
Emission Savings (kg)
Carbon Emissions Savings (kg)
Cost to Insulate ($000)
31% of houses with 0-50mm ceiling insulation 1,697,876 463,057 20,666
85% of houses with no wall insulation 3,305,997 901,636 226,874
83% of houses with no floor insulation 4,113,363 1,121,826 51,067
Rotorua CO2 Annual Emission Savings (kg) with insulation levels lifted to meet the Building Code
Annual CO2
Emission Savings (kg)
Carbon Emissions Savings (kg)
Cost to Insulate ($000)
23% of houses with 0-50mm ceiling insulation 262,973 71,720 5,608
66% of houses with no wall insulation 871,266 237,618 79,683
65% of houses with no floor insulation 1,093,501 298,228 18,083
Sustainability Options for Retrofitting New Zealand Houses – theoretical cost benefit analysis: TE106/8
Page 24
Gisborne CO2 Annual Emission Savings (kg) with insulation levels lifted to meet the Building Code
Annual CO2
Emission Savings (kg)
Carbon Emissions
Savings (kg)
Cost to Insulate ($000)
29% of houses with 0-50mm ceiling insulation 109,969 29,992 4,312
83% of houses with no wall insulation 363,330 99,090 61,105
81% of houses with no floor insulation 452,649 123,450 13,741
Masterton CO2 Annual Emission Savings (kg) with insulation levels lifted to meet the Building Code
Annual CO2
Emission Savings (kg)
Carbon Emissions
Savings (kg)
Cost to Insulate ($000)
35% of houses with 0-50mm ceiling insulation 518,892 141,516 10,798
82% of houses with no wall insulation 1,403,591 382,797 125,262
81% of houses with no floor insulation 1,766,636 481,810 28,512
Invercargill CO2 Annual Emission Savings (kg) with insulation levels lifted to meet the Building Code
Annual CO2
Emission Savings (kg)
Carbon Emissions
Savings (kg)
Cost to Insulate ($000)
30% of houses with 0-50mm ceiling insulation 857,562 233,881 8,928
84% of houses with no wall insulation 2,001,280 545,804 100,085
82% of houses with no floor insulation 2,490,614 679,258 22,522
New Zealand CO2 emission savings with insulation levels lifted to meet the Building Code
CO2 emission savings (tonnes)
Carbon emission savings (tonnes)
National GWh/yr savings
Cost to Insulate
($million)
$/tonne CO2
emission saved per year
25% of houses with 0-50mm ceiling insulation
25,826 7,044 256 480 19,000
67% of houses with no wall insulation 53,619 14,623 797 5,943 111,000
62% of houses with no floor insulation 63,707 17,375 785 1,265 20,000
From the figures provided, large potential savings in greenhouse gas emissions can be achieved, by insulating older houses if no take back occurs. Until a reasonable average temperature level in our homes is reached, evidence from the analysis of actual retrofit programmes clearly shows that low income people at least are more likely to choose comfort over savings, especially over time. Therefore it is likely any savings in greenhouse gas emissions will have to wait until New Zealand houses are warm and comfortable.
Sustainability Options for Retrofitting New Zealand Houses – theoretical cost benefit analysis: TE106/8
Page 25
3.3 Waste A significant amount of landfill waste (approximately 35% by weight) comes from the construction of residential buildings. Of this waste, the majority is from the construction of new houses. Hence, renovations (unless significant) do not have much of an impact on the total amount of construction waste.
When renovating, people should consider recycling or reusing any materials or products. Most cities will have metal (or just steel) recycling options for plumbing fixtures and fittings. It is also possible to recycle or on-sell timber frames and doors, bathroom and laundry fittings, floors and larger support beams. Auckland also has concrete crushing facilities although it may not be economic for domestic/residential jobs.
It should be noted that if a substantial programme of retrofitting occurs, as is needed to achieve Beacon’s sustainability goals, then construction waste from retrofitting could become a significant part of the waste stream. As part of a sustainable retrofit therefore it is also important to look at minimising ongoing waste. Simple options available for this include:
Organic materials
Worm farm (cost approximately $45 at local hardware store) that can be used on the garden etc. This is practical for most houses with a small open space.
Compost bins (cost approximately $60 - $100) for people with a larger area and gardens. Both of these simple options only require a small change in routine for a household collecting food scraps etc and putting them either in the worm farm or compost bin.
Inorganic materials
Recycling (either curbside or local recycling stations) are set up by local councils or businesses and are available in most larger population areas. They require a commitment from a household to sort their rubbish and recycle where possible.
Sustainability Options for Retrofitting New Zealand Houses – theoretical cost benefit analysis: TE106/8
Page 26
4 Conclusions At a national level the following options have a theoretical internal rate of return greater than 5% making them worthwhile implementing from a financial perspective:
Rainwater tanks (2,000L) for Auckland only, assuming 100% retention Low flow shower heads for high pressure systems Dual flush toilets Low flow taps/flow restrictors Water efficient (“AAA”) washing machines Water heating upgrade (if current water heating tank needs replacing)
- Solar hot water heating - Heat pump hot water heating - Instant gas hot water heating
Floor insulation Ceiling insulation
Energy efficiency bundle
Sustainability Options for Retrofitting New Zealand Houses – theoretical cost benefit analysis: TE106/8
Page 27
5 References Beattie, Diana, 2005, “The best thing that could have happened for me and my whanau”: An Evaluation of the Rotorua Healthy Homes Project – Pilot 2005, Rotorua Healthy Homes Steering Committee, 96pp.
BRANZ, 2005, House Insulation Guide, BRANZ Ltd, 104pp.
Caddet, 1997, Saving energy with energy efficiency in hospitals, http://www.fire-italia.it/eell/ospedali/energy efficiency_in_hospitals_maxi_brochure_5_CADDET.pdf
Chapman, R., Howden-Chapman, P., O’Dea, D, 2005, A cost-benefit evaluation of housing insulation: results from the New Zealand Housing, Insulation and Health study, Report to EECA, February 2005.
Clark, Susan J., Jones, Mark, and Page, Ian C., 2005, New Zealand 2005 House Condition Survey, Study Report 142, BRANZ, 146pp.
Community Energy Action, 1994, Report of the Te Whare Roimata Neighbourhood Energy Improvement Project, Community Energy Action, Christchurch, 25pp.
Cunningham, M. J., 2001, A Report for Tasman Insulation on Insulation Retrofitting to a Private Dwelling, BRANZ Report, Judgeford, Porirua.
Cunningham, Malcolm, Viggers, Helen, Camilleri, Michael, Matheson, Anna, Howden-Chapman, Phillipa, 2004, Changes of exposure to low temperatures and high humidities on retrofitting houses with insulation, World Health Organisation, pp.423-433.
EECA & the Ministry for the Environment, 2001, National Energy Efficiency and Conservation Strategy, Energy Efficiency and Conservation Authority, Wellington, 24pp.
EECA, 2005, Briefing to the incoming Minister of Energy from the Energy Efficiency and Conservation Authority, 16 Sept 2005, Energy Efficiency and Conservation Authority, Wellington, 24pp.
EECA, 2006, Consultation paper on proposed changes to EnergyWise home grants, Energy Efficiency and Conservation Authority, Wellington, 16pp.
Fyfe, Caroline, 2005, Heat Pump Survey – Report 2: Winter 2004, Community Energy Action, Christchurch, 22pp.
Fyfe, Caroline and McChesney, Ian, 2006, An Assessment of Current Levels of Home Insulation in Christchurch, Community Energy Action, Christchurch (in preparation).
Howden-Chapman, Philippa, Crane, Julian, Blakely, Tony, Cunningham, Malcolm, O’Dea, Des, Woodward, Alistair, Saville-Smith, Kay, Waipara, Nick, Douwes, Jeroen, Matheson, Anna, Viggers, Helen, Marshall, Cara, Skelton, Pounamu, 2002, A national study of the health effects of insulating homes: the baseline data (Report 1), He Kainga Oranga Housing and Health Research Programme, Department of Public Health, Wellington School of Medicine and Health Sciences, University of Otago.
Sustainability Options for Retrofitting New Zealand Houses – theoretical cost benefit analysis: TE106/8
Page 28
Howden-Chapman, P., Matheson, A., Crane, J., Viggers, H., Cunningham, M., Blakely, T., O’Dea, D., Cunningham, C., Woodward, A., Saville-Smith, K., Baker, M., Waipara, N., Kennedy M., Davie, G., 2004, Retrofitting houses with insulation to reduce health inequalities: a community-based randomised trial, Paper presented at Second WHO Conference on Housing and Health. Vilnius, Lithuania, October 2004.
Howden-Chapman, P., Crane, J., Matheson, A., Viggers, H.; Cunningham, M., Blakely, T., O’Dea, D., Cunningham, C., Woodward, A., Saville-Smith, K., Baker, M., Waipara, N., 2005, Retrofitting houses with insulation to reduce health inequalities: Aims and methods of a clustered, randomised community-based trial, Social Science and Medicine 61: pp. 2600-2610.
Isaacs, Nigel, 1993, Thermal Efficiency in N.Z. Buildings – An Historical Overview, Centre for Buildings Performance Research, Victoria University of Wellington, 36pp.
Isaacs, Nigel, Amitrano, Lynda, Camilleri, Michael, Pollard, Andrew, Stoecklein, Albrecht. 2003. Energy Use in New Zealand Households: Report on the Year 7 Analysis for the Household Energy End-use Project (HEEP). Study Report No. SR122. BRANZ. Judgeford, Porirua.
Isaacs, Nigel, Camilleri, Michael, French, Lisa, Pollard, Andrew, Saville-Smith, Kay, Fraser, Ruth, Rossouw, Pieter, Jowett, John, 2005, Energy Use in New Zealand Households: Report on the Year 9 Analysis for the Household Energy End-use Project (HEEP), Study Report No. SR141, BRANZ, Judgeford, Porirua. 123pp.
Kalkstein, L. S., and Valimont, K.M., 1987, Climate effects on human health. In potential effects of future climate changes on forests and vegetation, agriculture, water resources, and human health. EPA Science and Advisory Committee, Monograph no. 25389, pp.122-52, Washington, D.C.: U.S. Environmental Protection Agency.
NFO New Zealand, 2002, New House Survey Report, Prepared for EECA.
Orion, 2004, Effect of improved insulation on peak period demand, Orion Ltd. Christchurch, 13pp.
Shannon, Sarah, Lloyd, Bob, Roos, Jacob and Kohlmeyer, January 2003, EVH3 – Impact of Housing on Health in Dunedin NZ, University of Otago, 39pp.
Shen, Mill and Lloyd, Bob, 2004, Monitoring of Energy Efficiency upgrades of Public Housing in Southern New Zealand, University of Otago (Power point presentation).
Storey J., Page I., van Wyk, L., Collins H., and Krehl T., 2005, RI Housing Retrofit, Housing Interventions, Stocks and Market, Beacon Pathway Ltd.
Strategic Energy and EnergyConsult, 2005, Warm Homes Technical Report: Detailed Study of Heating Options in New Zealand: Phase 1 Report, Ministry for the Environment, Wellington, 48pp.
Taylor Baines & Associates, Smith, Norman, McChesney, Ian, and Butcher, Geoff, 2005a, Warm Homes Technical Report: Social Drivers Phase 1: Interim Progress Report, Ministry for the Environment, Wellington, 63pp.
Sustainability Options for Retrofitting New Zealand Houses – theoretical cost benefit analysis: TE106/8
Page 29
Taylor Baines & Associates, Smith, Norman, McChesney, Ian, and Butcher, Geoff, 2005b, Warm Homes Technical Report: Social Drivers Phase 2 Report, Ministry for the Environment, Wellington, 43pp.
Walker, Russell, 2004, Heat Pump Survey, Community Energy Action, Christchurch.
Wilton, Emily, 2005, Warm Homes Technical Report: Home Heating Methods and Fuels in New Zealand, Ministry for the Environment, Wellington, 223pp.
World Health Organisation, 1990, Indoor Environment: Health Aspects of Air Quality, Thermal Environment and Noise, HO/EHE/RUD/90.
Sustainability Options for Retrofitting New Zealand Houses – theoretical cost benefit analysis: TE106/8
Page 30
Appendix1 Climate characteristics NIWA identifies nine distinct climate zones in New Zealand, which include: the northern zone, with a distinctly sub-tropical, maritime influenced climate; the inland South Island zone, which is more continental in character with much greater extremes of heat and cold; and the cool temperate southern New Zealand zone. Using this zonal distinction, Table 13 presents a number of climate parameters for a range of sites throughout the country. The table cells are colour-coded to provide an indicative range of more to less favourable conditions for human comfort and warmth, with the darker blue indicating less favourable conditions.
Sustainability Options for Retrofitting New Zealand Houses – theoretical cost benefit analysis: TE106/8
Page 31
Table 13 Climate characteristics of a range of sites throughout New Zealand
Sunshine Radiation Temperature Wind Gale days Wet days
Sustainability Options for Retrofitting New Zealand Houses – theoretical cost benefit analysis: TE106/8
Page 32
Appendix 2 Insulation Status of the Housing Stock Total housing stock The latest estimates from Statistics New Zealand indicate 1.55 million households existed in New Zealand at the end of 2005, although not necessarily all were occupied3. An estimate from Quotable Value suggested a total of 1.36 million in 2004 (Table 14). In this review a total of 1.4 million occupied houses in 2005 has been used.
Based on Table 14, 75% of houses are in the North Island and 25% in the South Island. About 0.55 million are in the warmest climate zone of the country (northern New Zealand).
In 1991, 74% of homes were owner occupied. By 2005 this had dropped to less than 68% (i.e. approximately 0.95 million owner occupier households, and some 0.45 million rented or rent-free).
Table 14. Number of pre 1980 houses (as proxy to those built prior to insulation requirements)
Region Pre-1980 Total % pre-
1980 Northland 28,558 49,898 57%
Auckland 237,883 401,800 59%
Waikato 84,140 139,814 60%
Bay of Plenty 47,497 90,639 52%
Gisborne 11,276 13,964 81%
Hawkes Bay 35,954 48,588 74%
Taranaki 26,200 34,681 76%
Manawatu-Wanganui 58,581 78,001 75%
Wellington 116,365 157,079 74%
NORTH ISLAND 646,454 1,014,464 64%
Tasman/Nelson/Marlborough 26,872 46,726 58%
West Coast 7,911 10,110 78%
Canterbury 129,389 194,818 66%
Otago 45,805 64,257 71%
Southland 27,737 33,723 82%
SOUTH ISLAND 237,776 349,765 68%
NEW ZEALAND TOTAL 884,230 1,364,229 65% Source: From Quotable Value NZ (information provided by EECA) Approximately 0.9 million houses were built prior to 1978 when insulation became mandatory on new houses. The breakdown in Table 14 shows the range in pre-1980 houses according to areas of the country. Those areas experiencing more rapid population growth over the last two
Sustainability Options for Retrofitting New Zealand Houses – theoretical cost benefit analysis: TE106/8
Page 33
decades tend to have higher proportions of new houses (e.g. Auckland, Bay of Plenty, and sub-regional areas such as Queenstown); conversely, areas without much population change tend to have much higher proportions of pre-1978 houses (e.g. Southland, and sub-regional areas including Dunedin and Timaru).
Insulation information No single study exists which provides an accurate picture of the insulation status of houses in New Zealand. A number of studies each provide a partial picture, and these have been used to provide a composite picture of the current insulation status of houses.
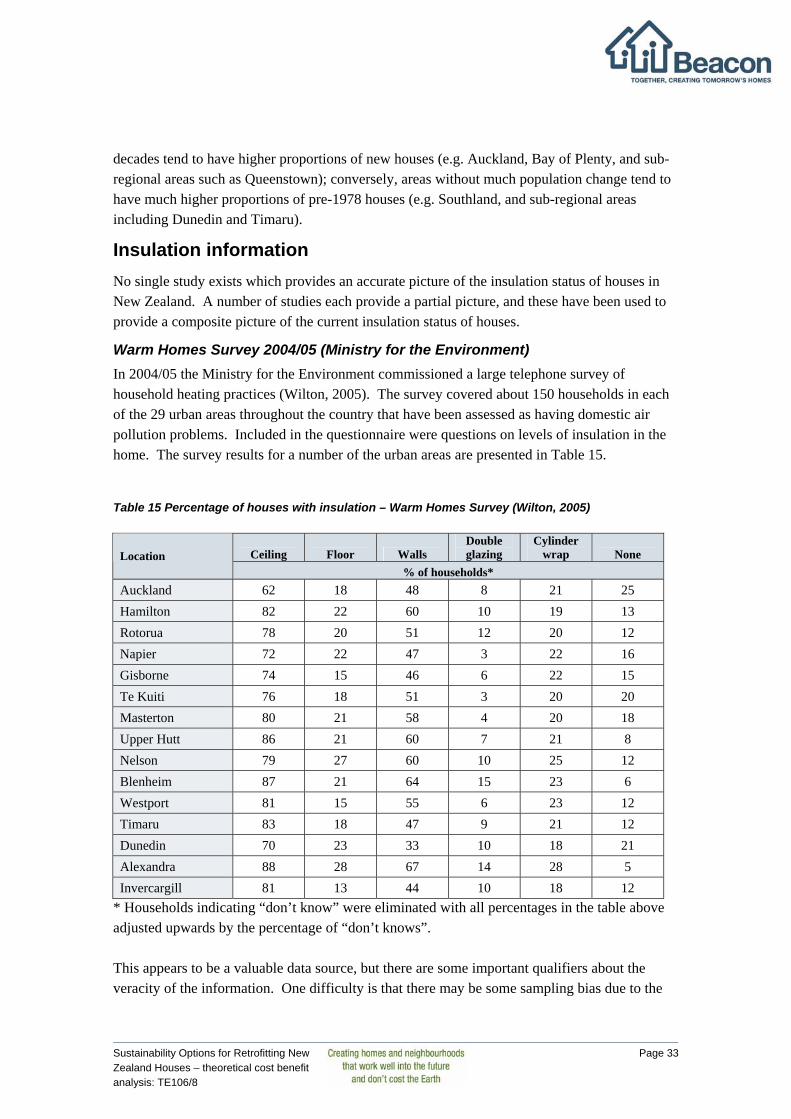
Warm Homes Survey 2004/05 (Ministry for the Environment) In 2004/05 the Ministry for the Environment commissioned a large telephone survey of household heating practices (Wilton, 2005). The survey covered about 150 households in each of the 29 urban areas throughout the country that have been assessed as having domestic air pollution problems. Included in the questionnaire were questions on levels of insulation in the home. The survey results for a number of the urban areas are presented in Table 15.
Table 15 Percentage of houses with insulation – Warm Homes Survey (Wilton, 2005)
* Households indicating “don’t know” were eliminated with all percentages in the table above adjusted upwards by the percentage of “don’t knows”. This appears to be a valuable data source, but there are some important qualifiers about the veracity of the information. One difficulty is that there may be some sampling bias due to the
Sustainability Options for Retrofitting New Zealand Houses – theoretical cost benefit analysis: TE106/8
Page 34
small sample in each urban area4. A second, and perhaps more significant issue, is the lack of knowledge of the respondents. For example, when the Christchurch sub-sample was subjected to cross-checking it was found that the inaccuracy of responses from tenants within the sample was over 50% (Fyfe and McChesney, 2006). There are likely to be levels of error in the other sub-samples as well (e.g. the levels of ceiling insulation reported above for Auckland appear to be lower than expected (see the House Condition Survey below).
Hence it is concluded that the survey has most value as an indicative comparative guide, showing for instance:
Generally less insulation in houses in warmer areas e.g. Auckland/Gisborne/Napier compared with most South Island areas
Higher levels of ceiling and wall insulation (and low percentage of houses with no insulation) where there are higher proportions of new (post-1978) houses e.g. Blenheim, Alexandra (note also Table 14 for areas with high proportions of new houses).
Some places stand out for a combination of reasons e.g. Dunedin, with relatively low levels of insulation despite the cold climate. The main reasons appear to be the relatively low level of new house building in the last two decades and thus a high proportion of pre-1980 houses (>80%), and high level of rental properties (university flats).
House Condition Survey 2005 BRANZ’s House Condition Survey 2005 provides detailed, and measured insulation parameters for a sample of 400 houses in Auckland, Wellington and Christchurch as part of a much wider assessment of overall house condition (Clark et al, 2005). The important qualifier of this survey is that the survey is confined to owner-occupier homes—rental properties were not part of the sample of houses surveyed5. Also it is a small survey sample with only three centres included, and aggregated results are not weighted according to overall population distribution.
The series of three tables below sets out insulation details by coverage of ceiling insulation in pre-1980s houses (Table 16), thickness of ceiling insulation for all insulated homes (Table 17), and extent of other forms of insulation recorded (Table 18). In comparison with the Warm Homes Survey, the findings are reasonably similar except that the House Condition Survey indicated lower levels of wall insulation overall.
4 For example, in the Christchurch sub-sample 43% were rental properties, compared with about 31% in the Christchurch population as a whole. 5 The importance, as related to insulation, is that the incentives on rental property owners to invest in insulation are generally not strong; hence insulation levels in owner-occupied homes are likely to be higher overall.
Sustainability Options for Retrofitting New Zealand Houses – theoretical cost benefit analysis: TE106/8
Page 35
Table 16 Ceiling insulation coverage in pre-1980 houses (owner-occupier) (% of households)
100% cover 50-100% Sub-total 50% or more
<50% None Sub-total 50% or less
Auckland 70 10 80 6 14 20
Wellington 52 33 85 3 12 15
Christchurch 91 4 94 3 3 6
Table 17 Ceiling insulation thickness – all houses with insulation (owner-occupier)
Thickness % of houses Approx R value
50mm or less 28 R1.0
75mm 45 R1.5-1.8
100mm 24 R2.0-2.2
150mm and over 3 R3.6
Table 18 Wall, floor and window insulation – House Condition Survey 2005
% with insulation*
% without Comment
Walls 44 56 30% of the sample comprised post-1978 houses, so the implied overall percentage of pre-1978 houses with wall insulation is 20%
Floors 30 70 Percentages only apply to houses where the sub-floor was accessible (i.e. excludes houses with concrete slab on ground)
Double glazing
Auckland <1 99
Wellington 3 97
Christchurch 13 87
Large percentage increases since the 1999 survey for Christchurch – the evidence is that most is occurring in new-builds, and only a small amount as retrofits
* Also includes partial insulation (e.g. over 50%)
Conclusions The various surveys present some coherency and consistency, although there are still some data gaps or inconsistencies. Nevertheless, the following conclusions about the current numbers of houses still lacking insulation measures seem reasonably robust. Throughout the country, it is estimated that:
Some 200,000 houses either have no ceiling insulation at all or insulation is installed in less than half of the available ceiling space
About 300,000 houses (mainly pre-1978 but includes some post-1978) have a very inadequate thickness of ceiling insulation (R1.2 or less)
Some 700,000 houses have no, or very little, wall insulation Some 500,000 houses have no underfloor insulation (in situations where insulation is able to
be fitted).
Sustainability Options for Retrofitting New Zealand Houses – theoretical cost benefit analysis: TE106/8
Page 36
Appendix 3 Residential energy use This appendix sets out a breakdown of total residential energy use, and a further analysis of the space heating component. This is the aspect of energy use most influenced by thermal efficiency retrofits.
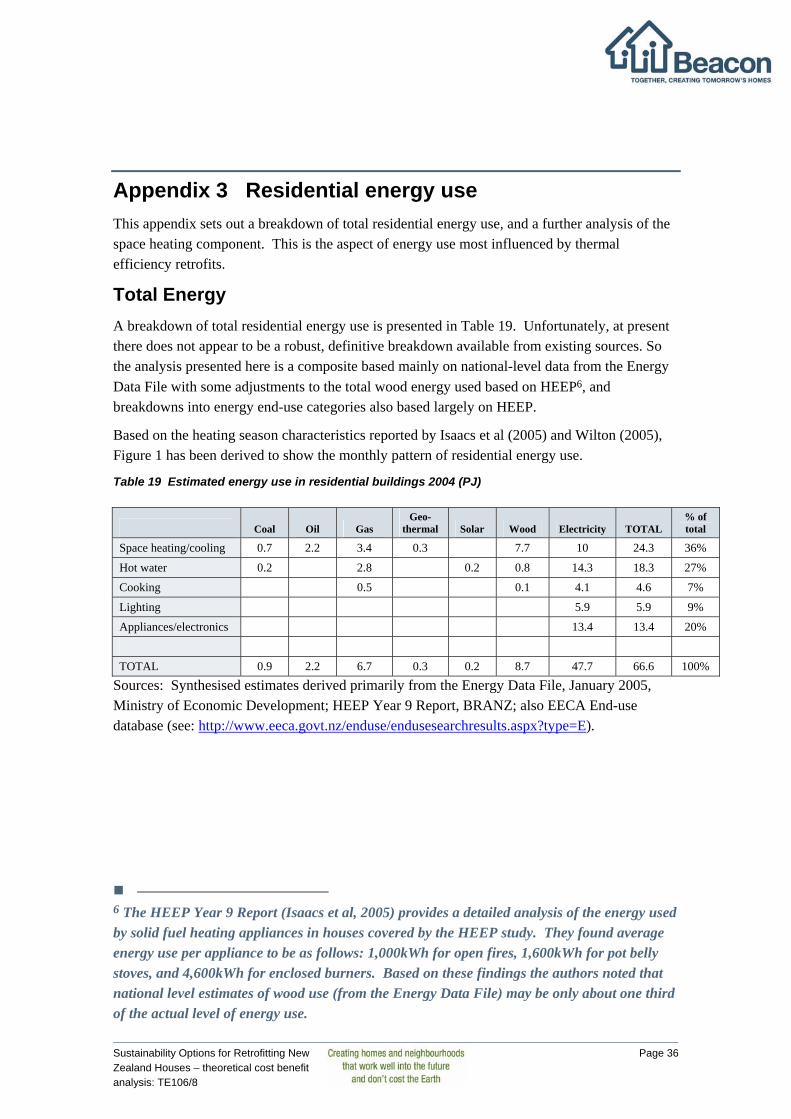
Total Energy A breakdown of total residential energy use is presented in Table 19. Unfortunately, at present there does not appear to be a robust, definitive breakdown available from existing sources. So the analysis presented here is a composite based mainly on national-level data from the Energy Data File with some adjustments to the total wood energy used based on HEEP6, and breakdowns into energy end-use categories also based largely on HEEP.
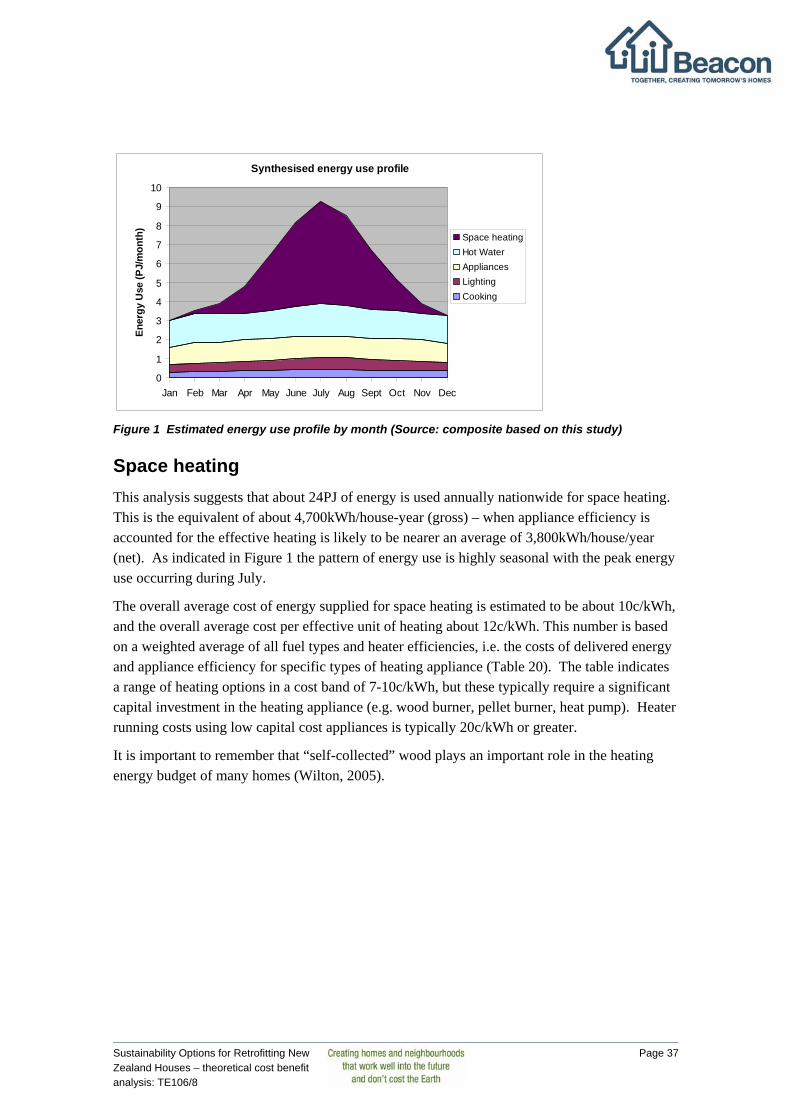
Based on the heating season characteristics reported by Isaacs et al (2005) and Wilton (2005), Figure 1 has been derived to show the monthly pattern of residential energy use.
Table 19 Estimated energy use in residential buildings 2004 (PJ)
Coal Oil Gas Geo-
thermal Solar Wood Electricity TOTAL % of total
Space heating/cooling 0.7 2.2 3.4 0.3 7.7 10 24.3 36%
Hot water 0.2 2.8 0.2 0.8 14.3 18.3 27%
Cooking 0.5 0.1 4.1 4.6 7%
Lighting 5.9 5.9 9%
Appliances/electronics 13.4 13.4 20%
TOTAL 0.9 2.2 6.7 0.3 0.2 8.7 47.7 66.6 100%
Sources: Synthesised estimates derived primarily from the Energy Data File, January 2005, Ministry of Economic Development; HEEP Year 9 Report, BRANZ; also EECA End-use database (see: http://www.eeca.govt.nz/enduse/endusesearchresults.aspx?type=E).
6 The HEEP Year 9 Report (Isaacs et al, 2005) provides a detailed analysis of the energy used by solid fuel heating appliances in houses covered by the HEEP study. They found average energy use per appliance to be as follows: 1,000kWh for open fires, 1,600kWh for pot belly stoves, and 4,600kWh for enclosed burners. Based on these findings the authors noted that national level estimates of wood use (from the Energy Data File) may be only about one third of the actual level of energy use.
Sustainability Options for Retrofitting New Zealand Houses – theoretical cost benefit analysis: TE106/8
Page 37
Synthesised energy use profile
0
1
2
3
4
5
6
7
8
9
10
Jan Feb Mar Apr May June July Aug Sept Oct Nov Dec
Ener
gy U
se (P
J/m
onth
)
Space heatingHot WaterAppliancesLightingCooking
Figure 1 Estimated energy use profile by month (Source: composite based on this study)
Space heating This analysis suggests that about 24PJ of energy is used annually nationwide for space heating. This is the equivalent of about 4,700kWh/house-year (gross) – when appliance efficiency is accounted for the effective heating is likely to be nearer an average of 3,800kWh/house/year (net). As indicated in Figure 1 the pattern of energy use is highly seasonal with the peak energy use occurring during July.
The overall average cost of energy supplied for space heating is estimated to be about 10c/kWh, and the overall average cost per effective unit of heating about 12c/kWh. This number is based on a weighted average of all fuel types and heater efficiencies, i.e. the costs of delivered energy and appliance efficiency for specific types of heating appliance (Table 20). The table indicates a range of heating options in a cost band of 7-10c/kWh, but these typically require a significant capital investment in the heating appliance (e.g. wood burner, pellet burner, heat pump). Heater running costs using low capital cost appliances is typically 20c/kWh or greater.
It is important to remember that “self-collected” wood plays an important role in the heating energy budget of many homes (Wilton, 2005).
Sustainability Options for Retrofitting New Zealand Houses – theoretical cost benefit analysis: TE106/8
Page 38
Table 20 Energy costs of heating 2005
Heating Source Appliance type Delivered cost (c/kWh)
Efficiency of use (%)
Cost per effective unit of heating (c/kWh)
Resistance – instantaneous 18-21 100 18-21
Resistance – storage 10 100 10
Electricity
Heat pump 18-21 220-300 7-9
Open fire 4-8 10-15 27-54 Wood – commercial Enclosed burner 4-8 55-75 5-10
Wood – self collected
Open fire and/or enclosed burner
? As above ?
Open fire 5 10-15 37-55 Coal
Multi-fuel burner 5 55-75 7-10
Wood pellets Enclosed pellet burner 6-8 75-92 7-9
LPG Gas Unflued portable heater 18 80-90 20-22
In-place flued heater 18 60-85 14-21
Natural gas In place flued heater 9-12 60-85 12-17
Central heating 9 90 10
Diesel Convection/ central heater 8 65-80 9-13
Source: Based on Strategic Energy and EnergyConsult (2005)