40
1 elcome to my presentati
| Date post: | 11-Apr-2017 |
| Category: |
Engineering |
| Upload: | masrur-ahmed |
| View: | 91 times |
| Download: | 1 times |

1
Welcome to my presentation
Dept. of Farm Structure & Environmental Engineering
Bangladesh Agricultural University, Mymensingh2
Presented by:
MASRUR AHMEDID. No. 15FSEEJD-
03MReg. No. 37789
Session: 2010-11Supervisor
Prof. Dr. Md. Zainul AbedinCo-Supervisor
Prof. Dr. Md. Abdur Rashid

STUDY TITLESUSTAINABILITY STUDY OF BIOGAS PLANTS UNDER OPERATION IN LOCAL MYMENSINGH.
3

BackgroundObjectiveMethodologyResultConclusion
Outline of the study
4

CompositionBiogas originates from the bio-degradation of organic material contains 60-70% methane and 30-40% carbon dioxide.
Background
Feeding materialBiogas is produced from livestock manure, sludge and municipal, livestock and organic waste.
Bio-slurryBio-slurry, as by-product from biogas plant, is a nutrient-rich organic fertilizer having 20-30% more nutrients than ordinary organic fertilizers.
Background of Biogas
5

Raw MaterialsBangladesh is a favorable position in respect of availability of raw materials , due to rapid expansion of poultry and dairy enterprises (5.6% growth rate) .
Background
EfficiencyOnly 40%-60% of anticipated average gas production is obtained, whereas smaller plants show better results than bigger plants.
Size selectionMost cost-effective and sustainable biogas plant size selection is of utmost important to eliminate major complication in biogas plants due to under-feeding and over-sizing.
Status of Biogas Plant
6
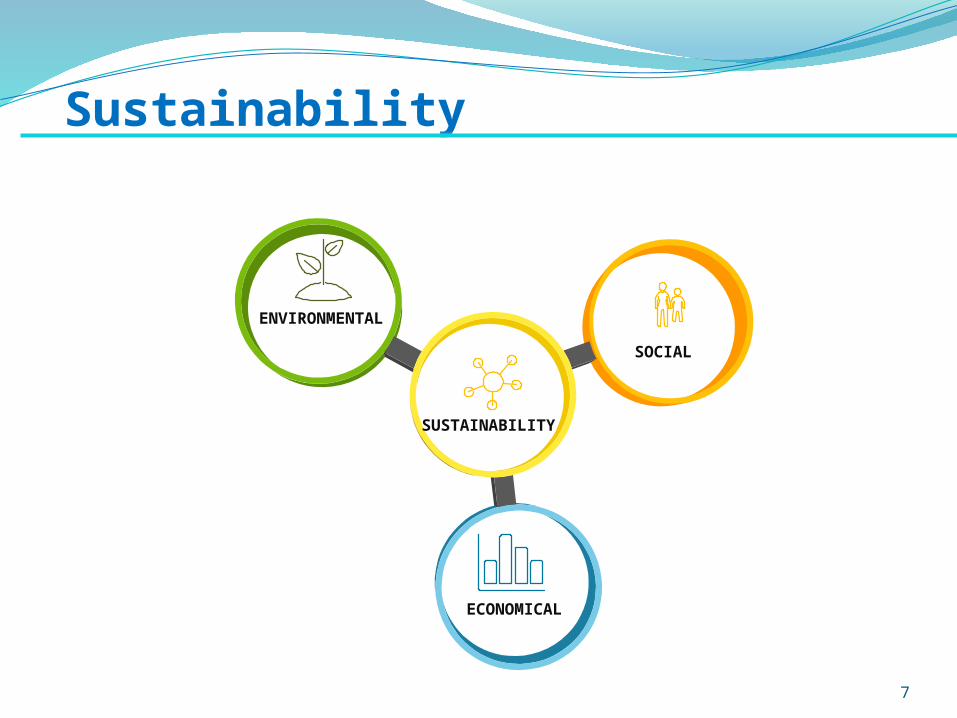
Sustainability
ENVIRONMENTAL
SUSTAINABILITY
ECONOMICAL
SOCIAL
7

Research objectives
1. To identify the capacity of the plants commonly used in local Mymensingh.
2. To analysis cost effectiveness and sustainability of the plants under operation.
8
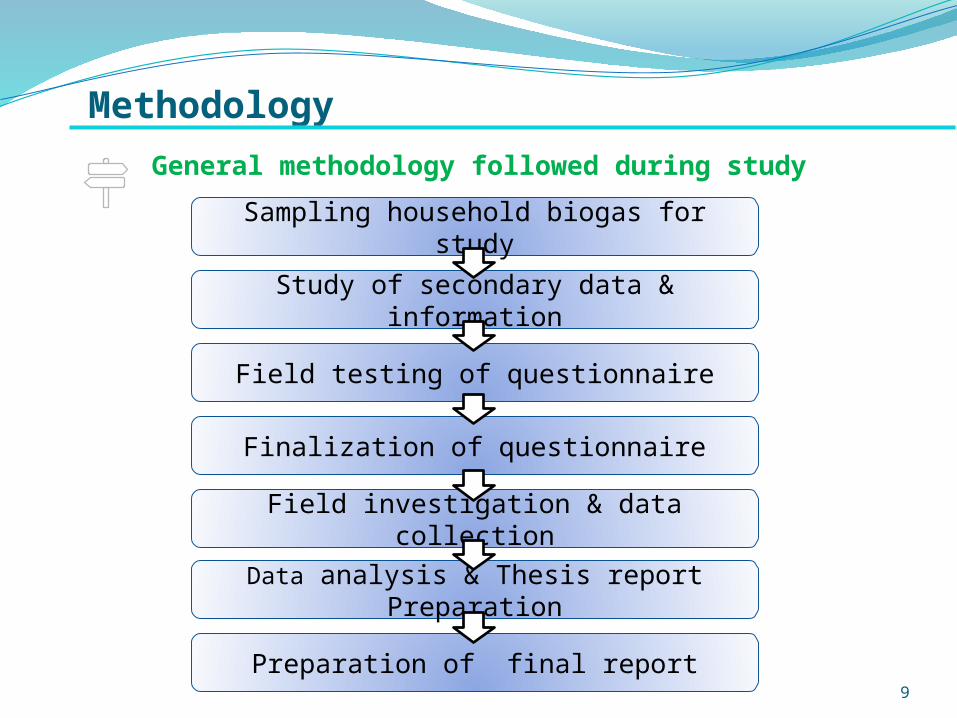
MethodologyGeneral methodology followed during study
Study of secondary data & information
Sampling household biogas for study
Field testing of questionnaire
Finalization of questionnaire
Field investigation & data collection
Data analysis & Thesis report Preparation
Preparation of final report9

Methodology (cont.)I. Selection of Study Areas:These areas were selected due to location,
availability of poultry farm, amount of cow dung produced, shortage of fund and socio-economic condition of the community. These areas are
1. Mymensingh sadar, 2. Haluaghat, 3. Phulpur
10
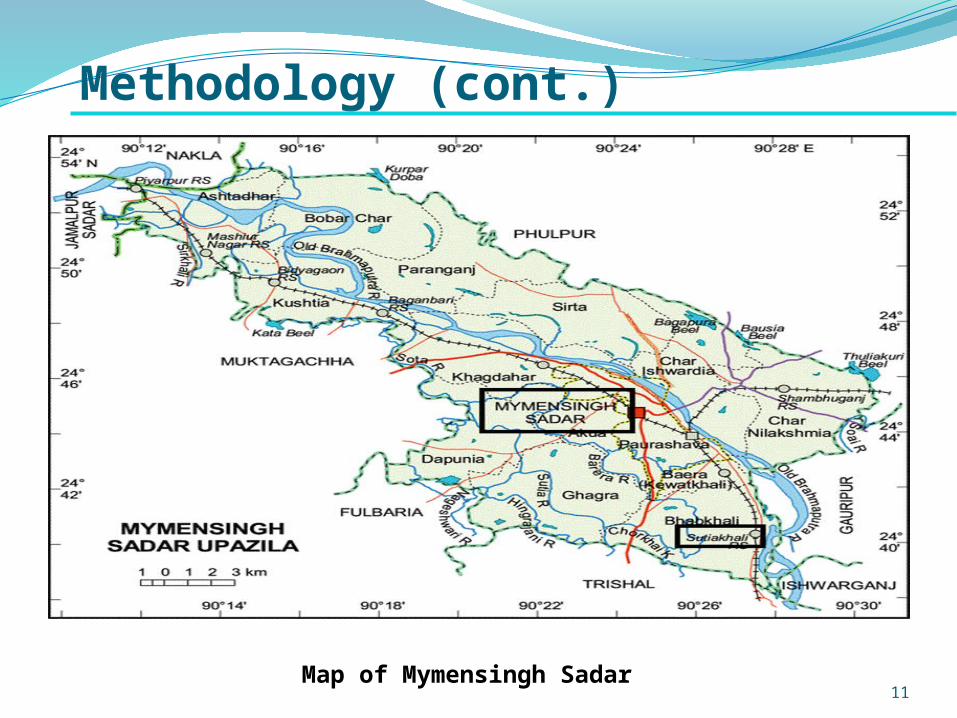
Methodology (cont.)
Map of Mymensingh Sadar11

Methodology (cont.)
Map of Haluaghat12

Methodology (cont.)
Map of Phulpur Upazilla 13

Methodology (cont.)
II. Sizes of biogas plants in the study area:Five different sizes of biogas plant were installed by Grameen Shakti (GS) in local Mymensingh. The sizes of biogas plants are as follows:
• 1.6 m3 • 2.0 m3 • 2.4 m3
• 3.2 m3
• 4.8 m3
14

Methodology (cont.)
Field TestingOnce the survey objectives, associated data and analytical design were specified and questionnaire was developed for field testing.
III. Preparation of a Questionnaire
Final QuestionnaireAfter completion of field testing final questionnaire was prepared to record the information needed for analysis.
15

Methodology (cont.)
Financial and economic appraisal of different domestic biogas plants are based on decision making tools including
1. Benefit cost ratio (BCR)2. Net present value (NPV)3. Internal Rate of Return (IRR)
16

Methodology (cont.)Benefit cost ratio: It is the ratio of benefit obtained from biogas plants to its cost.
𝐁𝐂𝐑=𝐏𝐕𝐛𝐞𝐧𝐞𝐟𝐢𝐭𝐬
𝐏𝐕𝐜𝐨𝐬𝐭𝐬
Where:PVbenefits = Present value of benefitsPVcosts = Present value of costs
17

Methodology (cont.)Net Present Value (NPV): It is the difference between the present value of cash inflows and the present value of cash outflows.
𝐍𝐏𝐕=∑𝐭=𝟎
𝐧 (𝐁𝐞𝐧𝐞𝐟𝐢𝐭𝐬−𝐂𝐨𝐬𝐭𝐬)𝐭(𝟏+𝐫)𝐭
Where:R = discount ratet = yearn = analytic horizon (in years)
18

Methodology (cont.)
Internal rate of return (IRR): It is a discount rate that makes the net present value (NPV) of all cash flows from a particular project equal to zero.
𝐈𝐑𝐑=𝐫𝐚+𝐍𝐏𝐕𝐚
𝐍𝐏𝐕 𝐚−𝐍𝐏𝐕𝐛(𝐫𝐛−𝐫𝐚 )
ra = lower discount rate chosenrb = higher discount rate chosenNa = NPV at ra
Nb = NPV at rb19

The existing condition of different components of biogas plant was observed in detail during the field investigation
Methodology (cont.)
1. To assess the quality of construction
2. effectiveness of maintenance activities carried out
3. the operational status prior to categorizing them
Condition of biogas
20

in qualitative manner, dependent on the physical observation of the plant made during field investigation.
Methodology (cont.)
Condition of biogas PlantThe existing physical status of different components of biogas plant have been categorized in three different headings
1.Good (functioning without defects)2. Fair (defective but functioning)3. Poor (defective and not functioning)
21
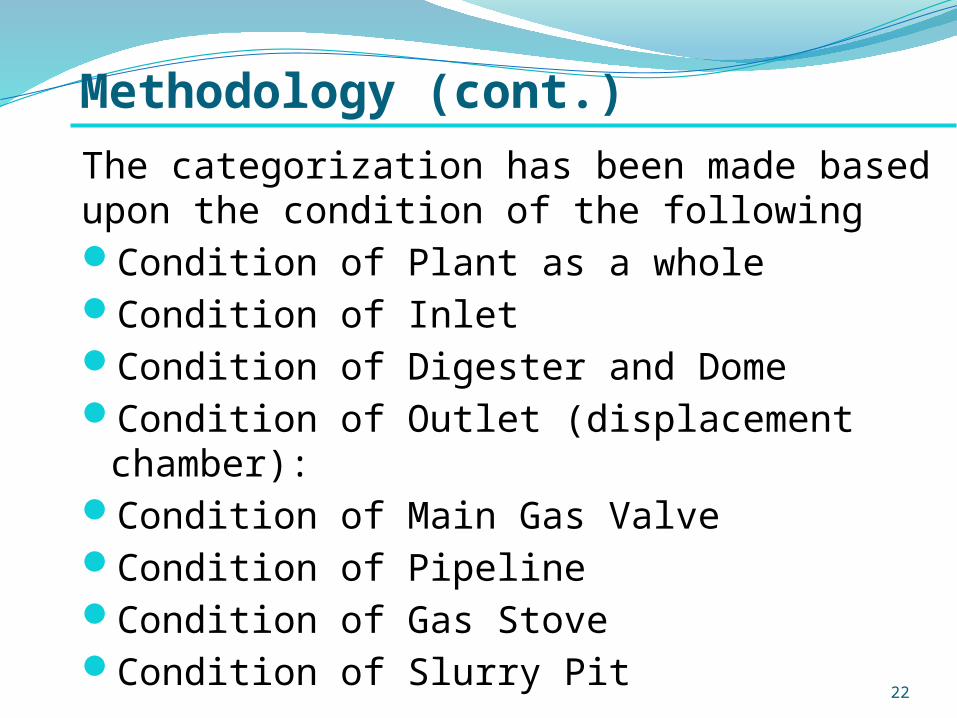
The categorization has been made based upon the condition of the following Condition of Plant as a wholeCondition of InletCondition of Digester and DomeCondition of Outlet (displacement chamber):Condition of Main Gas ValveCondition of PipelineCondition of Gas StoveCondition of Slurry Pit
Methodology (cont.)
22

Number of Plants surveyedThe field study was carried out in 36 randomly sampled biogas plants from three selected upazillas in local Mymensingh region.
Locations No. of biogas plants in each size category
1.6 m3 2.0 m3 2.4 m3 3.2 m3 4.8 m3 Total Nos. of plants
Mymensingh sadar 2 2 3 2 2 12
Haluaghat 3 2 2 3 2 12
Phulpur 2 3 3 2 2 12
Grand Total 7 7 8 7 6 36
RESULTS
23
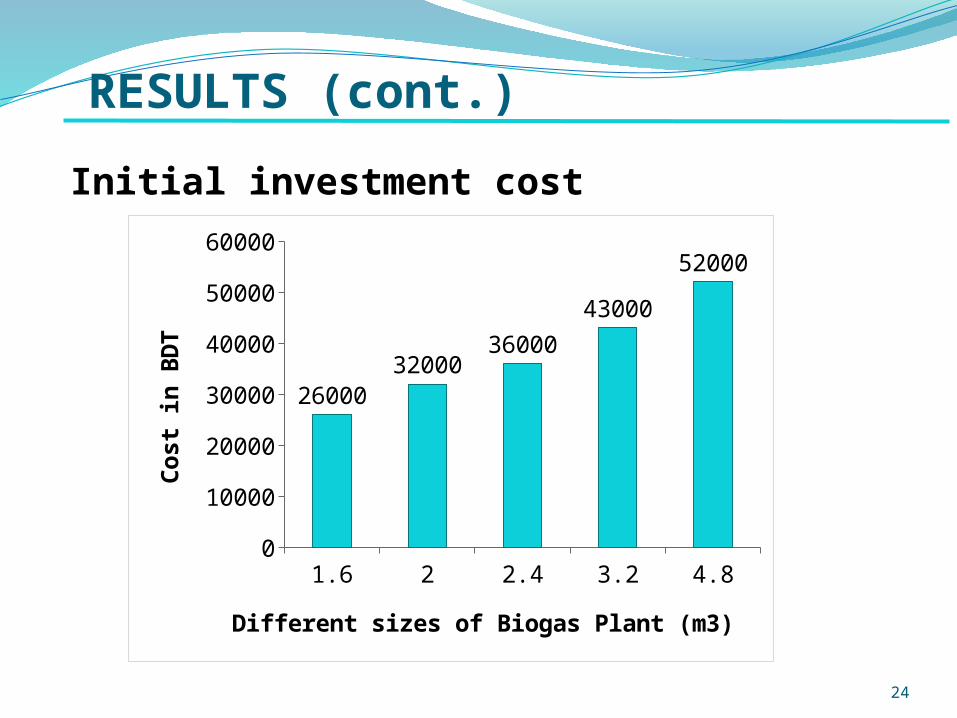
1.6 2 2.4 3.2 4.80
10000
20000
30000
40000
50000
60000
2600032000
3600043000
52000
Different sizes of Biogas Plant (m3)
Cos
t in
BD
TInitial investment cost
RESULTS (cont.)
24

1.6 2 2.4 3.2 4.80
0.5
1
1.5
2
2.5
3
3.5
1.58 1.75
2.35 2.51
3.17
Gas Production (m3)
Plant Size in (m3)
Gas
Pro
duct
ion
in C
ubic
m
eter
RESULTS (cont.)
25
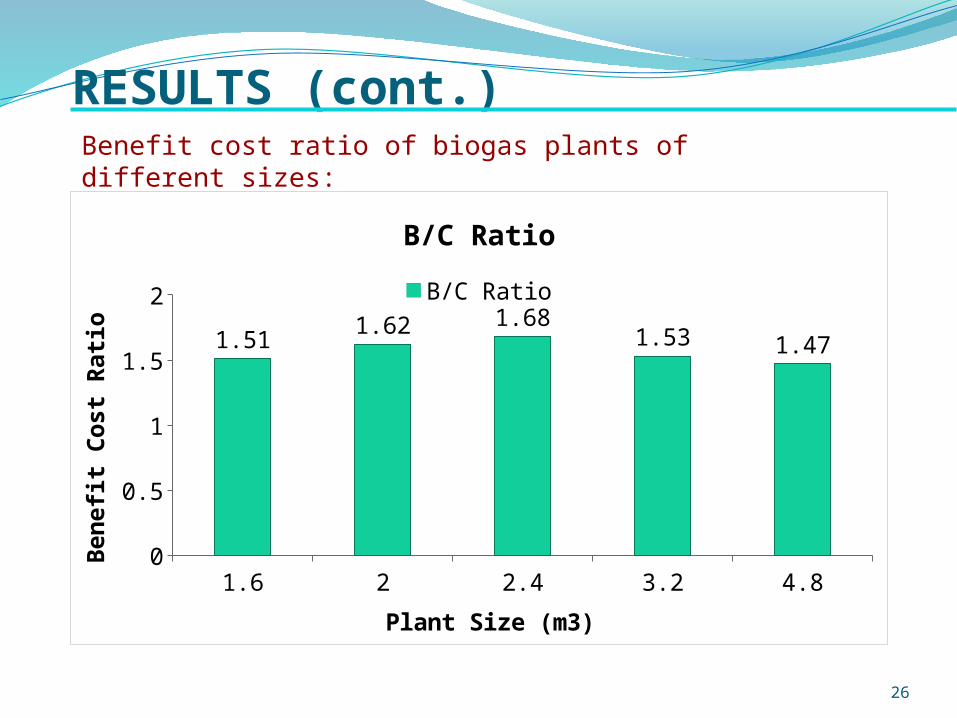
RESULTS (cont.)Benefit cost ratio of biogas plants of different sizes:
1.6 2 2.4 3.2 4.80
0.20.40.60.8
11.21.41.61.8
1.511.62 1.68
1.53 1.47
B/C RatioB/C Ratio
Plant Size (m3)
Ben
efit
Cos
t Rat
io
26

RESULTS (cont.)Internal rate of return of biogas plants of different sizes:
1.6 m3 2.0 m3 2.4 m3 3.2 m3 4.8 m30
10
20
30
40
50
60
42.5448.5
54.47
45.47 46.67
Internal Rate of Return
Plant Size (m3)
IRR
(%)
27

RESULTS (cont.)Net present value of biogas plants of different sizes:
1.6 2 2.4 3.2 4.80
5000
10000
15000
20000
25000
30000
35000
16815
26005
32290 3072532990
Net Present Value
Plant Size in Cubic meter
Net
Pre
sent
Val
ue in
BD
T
28

RESULTS (cont.)General condition of biogas plant:
Plant Component
Plant under study different categoryGood
(functioningwithout defects)
Fair (defective but
functioning)
Poor (defective and not
satisfactorily functioning)
Nos. % Nos. % Nos. %1. Biogas Plant as a whole 2 6 28 78 6 16
2. Inlet tank 3 8 27 75 6 163. Digester and dome (gas holder) 2 6 25 69 9 25
4. Outlet (displacement chamber) 1 3 26 72 9 25
5. Pipeline 2 6 25 70 9 256. Main gas valve 1 3 27 75 8 217. Gas stove 2 6 28 78 6 168. Slurry pit 1 3 2 6 33 91
29

RESULTS (cont.)General condition of biogas plant:
Who
le pla
nt
Inlet
tank
Digeste
r
Outlet
Pipelin
e
Main ga
s v...
Gas st
ove
Slurry
pit05
101520253035
2 3 2 1 2 1 2 1
28 27 25 26 25 27 28
226 6
9 9 8 6
33
Good (functioningwithout defects)
Fair (defective butfunctioning)
Poor (defective andnot functioning)
Component
No.
of p
lant
30

RESULTSRelationship between Training Received and Functional Status of Plant
Type of Training ReceivedFunctional Status of Plant (No of Plants)
NotFunctioning
PartlyFunctioning
FunctioningSatisfactorily Total
1. No training received 1 2 2 5
2. Training not provided butleaflet/booklet/manual provided 2 0 5 7
3. One day orientation training provided byservice provider 0 1 1 2
4. Short term O & M training (7days or less) 0 0 1 1
5. Long term O & M training (more than 7 days) 0 1 1 2
6. On the spot instructions from mason/companysupervisors etc. 4 8 6 18
7. Training provided by other NGOs (not theservice provider) 0 0 1 1
Total 7 12 17 3631
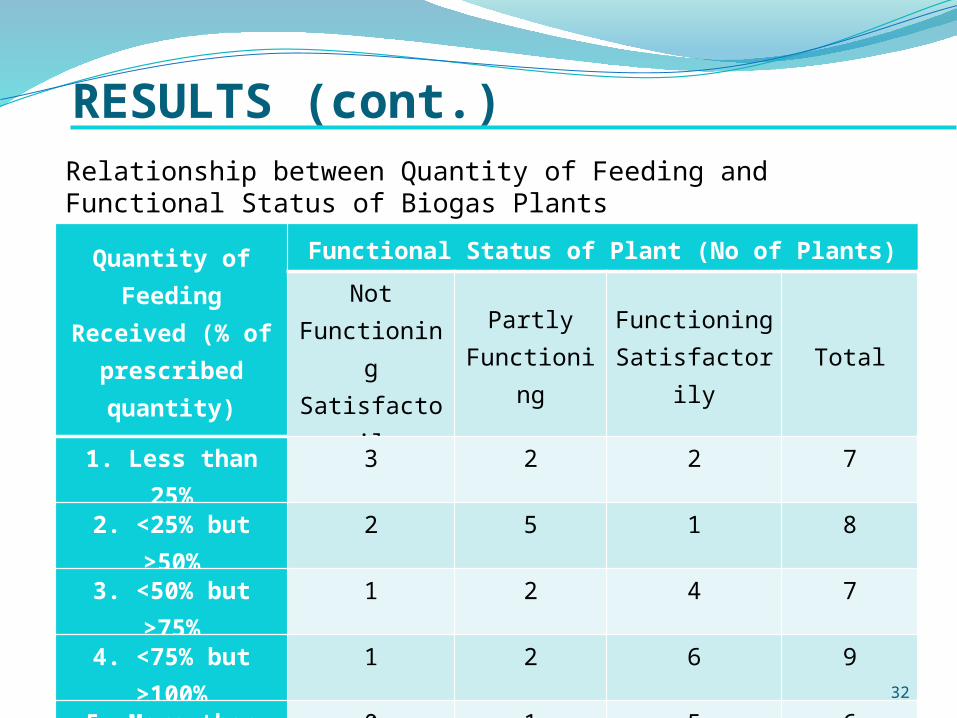
RESULTS (cont.)Relationship between Quantity of Feeding and Functional Status of Biogas Plants
Quantity of Feeding Received (% of prescribed
quantity)
Functional Status of Plant (No of Plants)
NotFunctioning Satisfactorily
PartlyFunctioning
FunctioningSatisfactorily
Total
1. Less than 25% 3 2 2 7
2. <25% but >50% 2 5 1 8
3. <50% but >75% 1 2 4 7
4. <75% but >100% 1 2 6 9
5. More than 100% 0 1 5 6
Total 7 12 17 3632

RESULTS (cont.)Relationship between Quantity of Feeding and Functional Status of Biogas Plants
> 25% 25%-50% 50%-75% 75%-100% < 100%01234567
32
1 10
2
5
2 21
21
4
65
Not SatisfactorilyFunctioning
PartlyFunctioning
FunctioningSatisfactorily
Quantity of feeding type in Percentage
No.
of b
ioga
s pl
ant
33

RESULTS (cont.)Relationship between User’s Satisfaction and Plant Efficiency
Efficiency of PlantUsers’ Level of Satisfaction
Not Satisfied Partly satisfied Satisfied Total
Nil (No gas production) 0 0 0 0
1. Less than 20% 3 1 1 52. >20% but < 40% 2 4 6 123. >40% but < 60% 1 6 4 114. >60% but < 80% 0 1 3 45. >80% but < 100% 0 0 3 36. More than 100% 0 0 1 1Total 6 12 18 36
34

RESULTS (cont.)Relationship between User’s Satisfaction and Plant Efficiency
<20% 20%-40% 40%-60% 60%-80% 80%-100% >100%0
1
2
3
4
5
6
7
3
2
1
0 0 0
1
4
6
1
0 0
1
6
4
3 3
1
Not Satisfied Partly satisfied Satisfied
Efficiency type
No.
of b
ioga
s pl
ant
35

RESULTS (cont.)
17%
33%
50%
Users’ Level of Satisfaction
Not Satisfied Partly satisfied Satisfied
36

CONCLUSIONS
Condition of Biogas PlantOut of 36 plants under study, 18 plants were functioning at full capacity, 12 were functioning partly and the remaining 6 plants were not functioning satisfactorily.
Financial AnalysisAll the five sizes are sustainable as well as cost effective but 2.4 m3 plant is most cost effective and sustainable with highest B/C ratio, IRR and NPV is slightly less than 4.2 m3 plant size.
37

CONCLUSIONS
Cost Effectiveness & SustainabilityThe cost effectiveness of the biogas plants would suggest the farmers to adopt the biogas technology specially 2.4m3 both for cooking and use bio-slurry for crops, and ultimately relief the huge dependency on firewood and chemical fertilizer and thus the technology would be a sustainable one contributing to national economy.
38

ACKNOWLEDGEMENT Ministry of Science and Technology for their special grants to
conduct this research.
Grameen shakti, Phulpur for providing necessary information.
Rural development Academy, Bogra for providing necessary information for completion of this research work.
Department of Farm Structure and Environmental Engineering for providing me with all the necessary supports for the successful completion of this research work.
39

40


