34
1 / Sustainability through Smart Grid Distribution Automation Solutions Dr. Wajdi Ahmad SASG 2012 GE - Digital Energy Dec. 2012

1 /
Sustainability through Smart Grid
Distribution Automation Solutions
Dr. Wajdi Ahmad SASG
2012
GE - Digital Energy Dec. 2012

2 /
• Introduction to DA…what, why, why now?
• DA solution building blocks
• Reliability enhancement through FDIR and smart line
monitoring solutions
• Peak load reduction and line loss reduction through Volt-
VAR Control
• Impact of communications infrastructure on the success
of DA solutions
• Role of DA in achieving sustainability
• Conclusion
Outline…

3 / GE /
GE Proprietary © Copyright 2011 General Electric Company. All rights reserved.
Economical, Societal and Environmental Sustainability
Smart
Substatio
n
Monitor &
Diagnostics
Microgrid Demand
Response
Smart
Appliance
Automatio
n
Generation
Renewabl
e
Generatio
n
Complex Event Processing, Analytics, and Visualization
DER
M
Volt/VAR
Control
Energy
Efficienc
y
Smart
Meters
Modula
r
Design
Workforce
Management
Modular
Substation
s
Desig
n
Tools
Head End Systems
Multiple Applications Platforms
Backhaul
Plant
LAN
System
WAN
Substation
LAN
Field
LAN
Customer
Area
Networks,
HAN
Transmission
Substation
s Distribution
Customer
Premise
Efficient, Reliable, Productive, Clean, Empowered
Distributed Generation and Storage
Domain
Services
Federated
Data Model Data Services
System
Security
Services
Electrical
Network
Model
Adapters
Business Process
Management
EV
Charging
Asset
Managemen
t
FDIR Energy
Storag
e
SENSING & CONTROL
DATA ANALYTICS
COMMUNICATIONS

4 /
Resistance
Hurdles to change…
Readiness
I want you to be
innovative…
I want you to find a
way to do
everything exactly
the same way it’s
been done
30 years ago!
Smart grid road

5 /
Introduction to Distribution
Automation
A Key Component of the Smart Grid
imagination at work g

6 /
DA Drawing Focused Attention…
Focused Conference & Exhibition
2nd Smart Grid Distribution Automation
February 27-28, 2013 - Sheraton, Raleigh, NC
• Control Systems and Control Software
• Improving Distribution Reliability with FLISR
• Using Volt/VAR to Target Energy Efficiency
• Regulatory Policy
• Navigating the Assorted Distribution Communications Networks
• How Distribution Automation can Facilitate the Integration of
Renewable Energy

7 / GE /
GE Proprietary © Copyright 2011 General Electric Company. All rights reserved.
Completion
Date
Acquired
Company
Acquirer Category Amount ($m)
August 2012 Elster Melrose PLC AMI 2,300
July 2012 ZIV Group Crompton
Greaves
Distribution
Automation
185
August 2012 Kaon Holdings Siemens Distribution
Automation
Undisclosed
Q4 2012E Cooper Power
Systems
Eaton Distribution
Automation
11,800
Q4 2012E Vivint Blackstone
Group
HEMS, Solar 2,000
Market Activity…Latest Acquisitions
Source: GTM Research 2012

8 /
Utility CAPEX Shift from AMI…
• AMI plans … long payback periods, negative short term Net
Present Values…consumer benefits difficult to quantify in the
short run
• Cost benefits of AMI come primarily from reducing utility Opex
…not a huge interest for a public utility!
• The combination of Distribution Automation (DA) and Demand
Response (DR) can mitigate the costs of outages and peak
demand
Source: GTM Research 2012
The benefits of DA are both more
predictable and quantifiable than AMI

9 /
Distribution automation is
increasingly being cited by utilities
as justification for smart grid
network investment … in particular
reclosers, capacitor banks and
voltage regulators
Smart grid Spending…Global Trend
Source: GTM Research -
2012
Distribution automation is believed
to represent the greatest
opportunity to reap the benefits of
smart grid deployment
U.S. Energy Information
Administration
reducing distribution losses in the
U.S. by just 1% would save about
2.6 TWh of electricity

10 /
What is Distribution Automation (DA)?
• DA refers to the capabilities of an electric utility to remotely
monitor, control and regulate its distribution assets and networks
• Optimizes the flow of electricity from the utility to consumers
• Ensures that the service is delivered EFFICIENTLY and RELIABLY
Distribution Automation?
DA moves the decision-
making process closer to
the sensor

11 /
Why Distribution Automation?
DA systems provide:
• Remote monitoring & control of
distribution assets
• Identify, isolate, and restore
service automatically
• Reliability, Efficiency, power
quality
Reference : Report prepared for the U.S. Department of Energy by Litos Strategic
Communication under contract No. DE-AC26-04NT41817, Subtask 560.01.04
Most utilities have long wished
for real-time monitoring and
remote control of system &
assets such as substations,
voltage regulators, capacitor
banks, feeder switches,
distribution transformers, and
other physical facilities.
Energy
Efficiency
Operational
Efficiency
Grid
Reliability
Grid
Performance
Voltage
managemen
t
Crew
managemen
t
Outage
managemen
t
Power
quality

12 /
Distribution Automation Solution Building Blocks
/FLISR
Distribution system Reliability
Distribution system Efficiency
Control
system
+ Field Devices

13 /
Distribution Automation Benefits
Efficiency (with VVC) • Improves load management and power
quality
• Enhances and optimizes asset
utilization
• Decreases electrical losses in the
distribution systems
Reliability (with FDIR/FLISR)
• Improves customer service and
reliability indexes (SAIDI, SAIFI, CAIDI)
• Optimizes assets, reduces maintenance
and related repair costs
A rolling blackout across Silicon Valley
totaled $75 million in losses.
In 2000, the one-hour outage that hit the
Chicago Board of Trade resulted in $20
trillion in trades delay.
Sun Microsystems estimates that a
blackout costs the company $1 million
every minute.
The Northeast blackout of 2003 resulted
in a $6 billion economic loss to the
region.
Reference : Report prepared for the U.S. Department of Energy by Litos Strategic
Communication under contract No. DE-AC26-04NT41817, Subtask 560.01.04
DA allows us to move from time-based
maintenance to condition-based
maintenance

14 /
Distribution Reliability
Improvement System
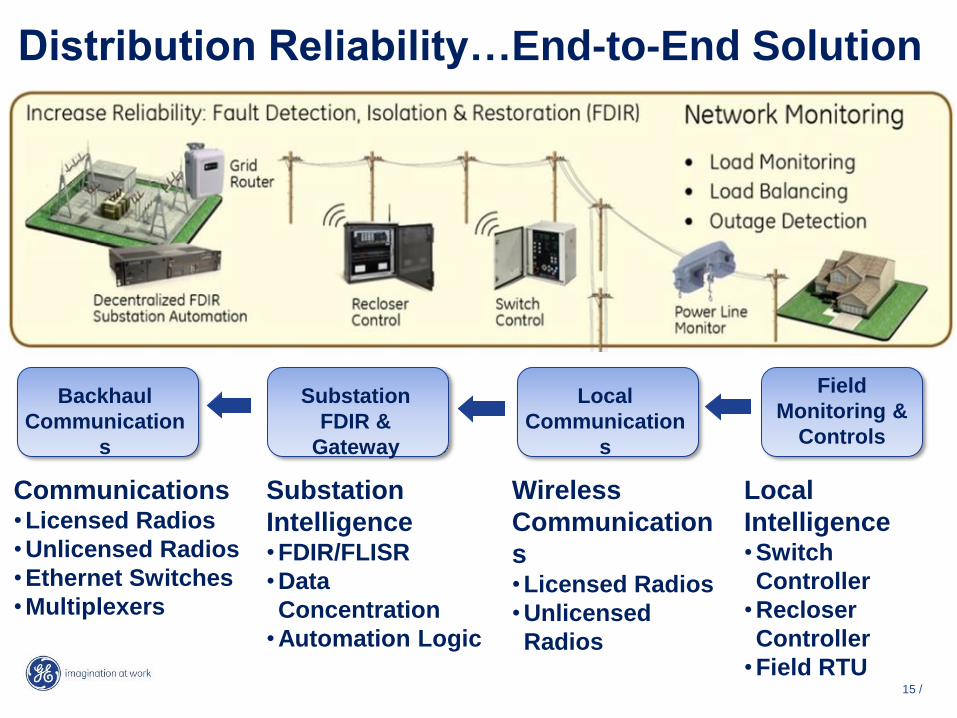
15 /
Local
Intelligence • Switch
Controller
• Recloser
Controller
• Field RTU
Distribution Reliability…End-to-End Solution
Field
Monitoring &
Controls
Wireless
Communication
s • Licensed Radios
• Unlicensed
Radios
Substation
Intelligence • FDIR/FLISR
• Data
Concentration
• Automation Logic
Communications • Licensed Radios
• Unlicensed Radios
• Ethernet Switches
• Multiplexers
Local
Communication
s
Substation
FDIR &
Gateway
Backhaul
Communication
s

17 /
Grid Reliability through FDIR/FLISR
What is Fault Detection, Isolation, and Restoration FDIR/FLISR)?
FDIR / FLISR Benefits:
• Maintain service through fault isolation and re-routing of power
• Improved efficiency due to decrease in repair/ restoration
• Quickly identify fault location and dispatch appropriate work crews
• Improved reliability as measured through utility indexes (SAIDI, SAIFI,
CAIDI)
FDIR /FLISR systems enable the utility to reconfigure the electric
grid remotely or automatically in response to unplanned outages.

18 /
Centralized FDIR System • System-wide system…usually part of the DMS
• Used for complex network switching
• Often based on load flow analysis
Distribution Reliability Improvement - Architectures
Distributed or Peer to Peer System • Devices communicate with each other to determine the
fault location and appropriate action
• Difficulty addressing multiple faults
• Need to re-program local controllers if the system is
expanded
Substation Based (De-centralized) System • Cost effective and scalable deployment
• High degree of reliability with independent systems
deployed across network

21 /
Automatic Reconfiguration - FDIR
Since there is communication,
crews are dispatched
immediately following a faulty
segment isolation. FDIR can be
set up to work fully automatic,
or with Operator confirmation.
FDIR makes the decision to
open SW 2 & SW 3, close OVR 1
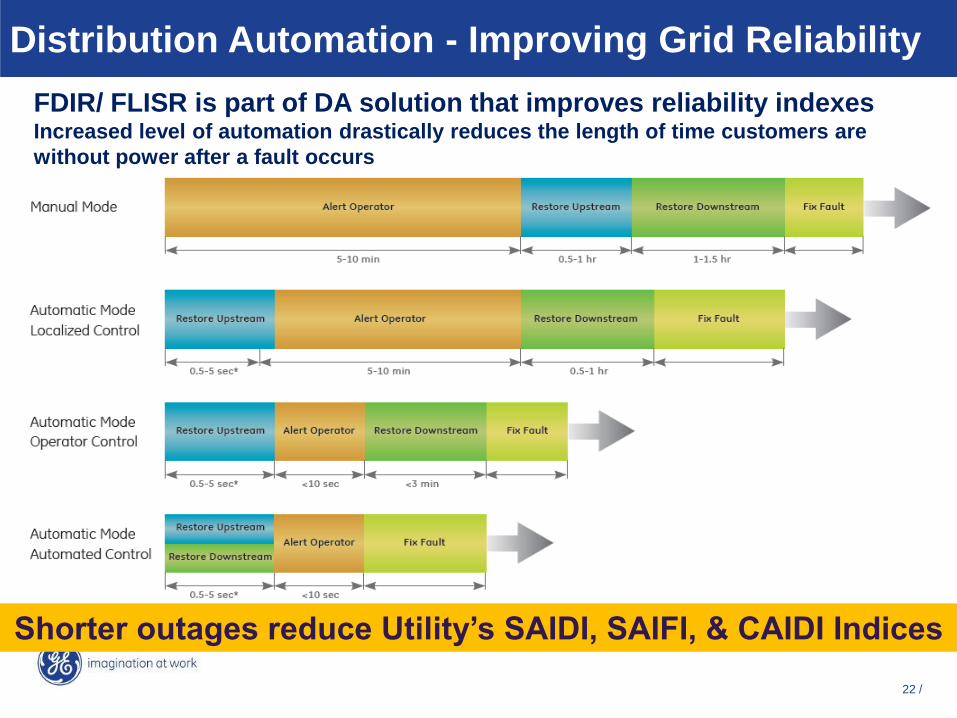
22 /
Distribution Automation - Improving Grid Reliability
FDIR/ FLISR is part of DA solution that improves reliability indexes Increased level of automation drastically reduces the length of time customers are
without power after a fault occurs
Shorter outages reduce Utility’s SAIDI, SAIFI, & CAIDI Indices

23 /
Outage Restoration Improvement… Cali-Columbia
Source: GTM Research, 2012

Condition-Based Ratings
• Most Overhead Transmission Lines
Today Operated Based on Conservative
Static Ratings
• Line Ampacity Constrained by “Sag”,
and “Thermal Capacity” - both
Dependent on Conductor Temperature
• With Accurate Assessment of Conductor
Temperature, Potential to Safely Unlock
Hidden Operating Capacity
• Avoid / delay new construction or re-
conductoring
• Avoid re-dispatch, renewable
curtailment
Condition-Based Ratings

• Most network problems (faults) occur on
overhead network
• Little visibility between substations and
end customers
• AMI and Substation data only provides
visibility of end points
• Need to optimize use of assets in Medium
voltage network
• Enable the Network to Manage Distributed
Generation
Reliability - Line monitoring
Distributed intelligence across the HV/MV network provides more
visibility & opportunity for improving efficiency and reliability

• Regulatory pressure to reduce outage time on distribution network
• Need to reduce truck roll time and dispatches for false notifications
• Capacity restrictions on Sub-transmission due to increase in Distributed Generation
• Detect locations causing non-technical losses on MV circuit
• Focus maintenance activity
Why Monitor Overhead Networks?
Reduced SAIDI, CAIDI, cost of maintenance, crew
repair time, CAPEX, and MV energy theft

Intelligent Line Monitoring Solution - System
Architecture Line Sensor
• Measures critical
parameters of the
overhead lines and
stores in it’s own
buffer.
Analytical Applications
• Fault location and
Maintenance planning
• Dynamic Line Rating
Calculation and Analysis
Software
Sensor Network Gateway
• Collects Sensor Data and
provides Backhaul
Communications
GPS Satellite
provides
timing
reference

Key Differentiators Intelligent Line Monitoring Solution
• Automatically
identifies fault
location
• Strategic
notification to field
crews
• Determines max
safe loading of lines
• Determines Sag
caused by loading
• Identifies lines
indicating problems
• Prioritizes
maintenance
requirements
Fault Location Dynamic Line Rating Maintenance Planning

Distribution Efficiency
Improvement System

30 /
Coordinated Control of:
• Substation transformer
tap changers
• Feeder voltage
regulators
• Capacitor banks
To ensure an optimal VAR
flow and voltage profile for
improved efficiency &
power quality
Efficiency…Volt-VAR Control (VVC)
Optimize Voltage - through
‘Conservation of Voltage’ that leads
to reduced peak demand
Increase efficiency- through
improved power factor and reduced
VAR flow, which helps to reduce
power line losses

32 / GE /
GE Proprietary © Copyright 2009 General Electric Company. All rights reserved.
Volt/VAR Optimization – Benefit Calculation
VAR Optimization:
• Distribution line loss reduction
• Distribution demand reduction to improve capacity
• Cap Bank inspection savings
• Loss of use from blown fuses
Volt Optimization:
Load Reduction (to manage demand and reduce energy
costs)
Environmental Benefits:
CO2 Reduced (Metric Tons)

Volt VAR Control can reduce customer peak
demand and energy consumption
123 Volts
1,056 KW
607,600 kwh
119 Volts
3%
2%
1,034 KW
595,448 kwh

Volt-VAR Control…13kV Feeder
Substation
EOL 55 CAP 1 CAP 3 CAP 4 REG 1 REG 2 CAP 2
116.0
118.0
120.0
122.0
124.0
126.0
Normal Operation With VVC
Source: Tom Weaver – Distributech 2011

Demanding Requirements of DA
36 Source: GTM Research, 2012

37 /
Communications Network
• The business case for a DA communications network cannot be
isolated from the business case for the overall SG program
• The following parameters need to be considered in order to determine
the cost of communications network:
• Coverage area characteristics (population density, terrain, etc.)
• Bandwidth and latency requirements…most DA devices do not
require large bandwidths
• Reliability…communications system must continue working
during service disruption
• Spectrum availability for wireless systems
• Total cost of ownership…wide variation in operational cost
Private or public??
No “one-size-fits-all”...
However, in the US, private
networks dominate the DA market

38 /
A saving of only 1% of T&D losses, saves
177.12 GWh!!
@ 7427 kWh per capita … 2400 customers!
@ 0.25 SAR/kWh … ~ 44M savings per year
17712000000 kWh
204200000000 kWh
186488000000 kWh
+
=
Electricity Production
Electricity Landscape in KSA 2009 World Bank Report on KSA:
http://www.tradingeconomics.com/saudi-arabia
Electricity Consumption
T & D Losses
8.7%
7427kWh
per capita

39 /
So…what’s holding back investments in DA?
Technical issues
Policy issues
Management issues
Cost issues
DA in general continues to be a
“hard sell” upwards within the utility
organization:
• To avoid near-term cost
• Business mentality…“if it’s not
broke, don’t fix it!”
• Competing with other utility
budget priorities
• “We’re piloting some DA now!”…
(And probably have been for 20
years!)
Nonetheless…it is time to put DA
on top of our agenda in our pursuit
for sustainability…It is our
obligation!!


![[Industry report] U.S. Grid Automation Report](https://static.documents.pub/doc/80x56/55d5141bbb61eb8a6b8b4570/industry-report-us-grid-automation-report.jpg)


