Sustainability under siege: Transport costs and corruption on WestAfrica’s trade corridors
Daniel Bromley and Jeremy Foltz
Abstract
We use recent data on transport costs in West Africa, including the added burden of bribes and enforced delays, to show howsuch costs represent a deterrent to investment in — and therefore the sustainability of — agricultural assets. We focus on datafor two important tree crops in West Africa, cashew and shea. We also have data for the transport of onions between Niger andthe urban market in Accra, Ghana. Our data allow us to predict plausible increases in farm-gate prices from a reduction intransport costs and bribes. A 10% reduction in the total transport costs (actual costs plus corruption costs) of onions fromNiger could result in a 12-13% price increase to onion farmers. Similar elasticities are 2% for cashew in Ghana and 7% forshea in Mali. These feasible price increases would encourage farmers to improve onion production, and to protect and improveproduction from cashew and shea trees, thereby enhancing the sustainability of agro-forestry in West Africa. We call theseprice increases the “sustainability dividend”.narf_1342 32..48
1. The problem
The sustainability of agriculture in sub-Saharan Africacontinues to raise concerns among those in the developmentcommunity. Evidence from 34 countries in the regiondepicts an ominous secular decline in per capita foodproduction — a process we call immiserization — over theperiod during which most countries gained theirindependence in the early 1960s (Figure 1).1 While there aremany explanations for this trend, we suggest that oneplausible explanation is to be found in the nature and qualityof the economic infrastructure in much of the continent.Here we use the term infrastructure to refer to two distinctideas. In the current vernacular, there is “hardware” andthere is “software”. In most discussions of infrastructure thefocus is on the hardware — roads, rail networks, bridgesand communications. Our emphasis here will be on thesoftware — what we call the institutional architecture of aneconomy (Bromley, 1989; 2006). The two infrastructures
work together to determine the efficacy with which theeconomy can accomplish its necessary signaling. If roads,rail, bridges and telecommunications are in seriousdisrepair, even the most efficacious institutionalarrangements will be unable to create the conditions of highproductivity and the prospects for growth. On the otherhand, if the physical assets are ideal, and yet the legal andcustomary arrangements enable or encourage theft, bribery,and other forms of predatory behaviour, economicperformance and livelihoods suffer.
Studies of institutional problems in marketing andtransport have increased our understanding of thisimportant component of a nation’s economy (Shleifer andVishny, 1993; Campos et al., 1999; Fafchamps and Hill,2005; Lambsdorff, 2006; Rose-Ackerman, 2006; Raballandand Macchi, 2008; Olken and Barron, 2009; Portugal andWilson, 2009; Teravaninthorn and Raballand, 2009; Freundand Rocha, 2010). Some of this literature seeks to make adistinction between corruption that facilitates transactions(“grease”) and corruption that impedes transactions(“sand”) (Méon and Sekkat, 2005). The first corruption,familiar to those who study large multinational firmsoperating across many countries, actually facilitatesinvestment and business in countries where obtaininglicenses and permits can otherwise represent seriousdeterrents. One may think of this class of corruption as alicense to do business. Indonesia and the Philippines areoften cited as exemplars of this form of “crony capitalism”
Daniel Bromley and Jeremy Foltz are at the University of Wisconsin,Department of Agricultural and Applied Economics. E-mail:[email protected] and [email protected] The 34 countries included in this series are Benin, Botswana, BurkinaFaso, Burundi, Chad, Democratic Republic of the Congo, Congo, Côted’Ivoire, Gabon, Gambia, Ghana, Guinea, Guinea-Bissau, Kenya, Lesotho,Liberia, Malawi, Mali, Mauritania, Morocco, Mozambique, Namibia,Niger, Nigeria, Rwanda, Senegal, Sierra Leone, South Africa, Sudan,Swaziland, Tanzania, Uganda, Zambia and Zimbabwe.
— also known as “pay to play” corruption. We refer to thisas wholesale corruption. Indeed, several large Germancompanies, presumed to be paragons of commercialprobity, fell under investigation for making payments toforeign suppliers to enhance the chances of favourable long-term contracts (Wall Street Journal, November 24-26,2006).2 The justification by those implicated in suchpractices is that one must participate in order to do businessin particular countries.
The other corruption, here called retail corruption,concerns those settings in which frequent exactions aredemanded to be allowed to continue to operate a business.This is precisely the context in which a number of the abovestudies are situated. The problem of weak (“soft”) states andcorruption has recently brought attention to the transportsector — that crucial logistical realm that joins producersand consumers — including exports to world markets(Olken and Barron, 2009; Portugal and Wilson, 2009;Freund and Rocha, 2010).
In a recent study, Freund and Rocha seek to understanddelays in the transport sector of sub-Saharan Africa. Indiscussing delays at the port versus delays in transit, theywrite:
All else equal, a one day delay should affect exports thesame way no matter when it occurs. However, one reasonit may not is if there is more uncertainty associated withhigh delays in some procedures than in others.Uncertainty will reduce exports because it makesdelivery deadlines harder to meet (Freund and Rocha,2010, p.11).
They then test this proposition by asking whether or notgreater uncertainty related to inland transport times is moredeleterious to exports than are the delays driven by theprocess of obtaining proper documents in ports. Theyestimate the effects of “time uncertainty” in eachcomponent of export times for a subset of the 24 countriesin sub-Saharan Africa for which they have data.3 They finda significant negative impact of “inland transit time” on thevalue of traded goods. A one-day increase in this variableseems to be associated with a 13% reduction in exports. Inlogs this means that a 1% increase in uncertainty leads to a0.7% reduction in exports. The point is that delays in roadtransport times indeed jeopardize delivery targets. In termsof effects on economic performance, transport delays aremore deleterious because port-related delays can often bereduced through preemptive arrangements. That is, these“bureaucratic” delays are, to some extent, similar androutine and such delays can often be factored into theplanning process. But sending a truck across country is adifferent sort of problem. Unlike port delays, in which casetrucking firms are dealing with a small and reasonablystable set of inspectors, the situation along several thousandkilometres of roads entails frequent interaction with anunstable and therefore unpredictable group of idiosyncraticofficials representing customs bureaus, police, armysecurity guards, and union officials. Here, unlike paymentsto expedite processing, a truck on a long-haul trip is out ofthe control of the exporter. The empirical work of Freund
2 When the Foreign Corrupt Practices Act of 1977 was passed, foreign (butnot domestic) bribes were tax deductible. Germany changed this underforeign pressure. However, European views on “side payments” remaingenerally unchanged.
3 The data concern uncertainty between the maximum and the averagenumber of days it takes for an exporter to complete each of the exportingprocedures. The countries are: Benin, Botswana, Burkina Faso, Burundi,Cameroon, Republic of the Congo, Côte d’Ivoire, Ghana, Kenya,Madagascar, Malawi, Mali, Mauritania, Mozambique, Namibia, Nigeria,Rwanda, Sierra Leone, South Africa, Sudan, Tanzania, Uganda, Zambiaand Zimbabwe.
Figure 1. Creeping immiserization in sub-Saharan Africa.Source: World Bank (2008).
33Daniel Bromley and Jeremy Foltz / Natural Resources Forum 35 (2011) 32–48
and Rocha (2010) tends to show that road transit times, andthe uncertainty associated with road transit, are bothsignificant. That is our emphasis here.
We are interested in what we call the institutionalcoherence of an economy — in particular, the transportsector of West Africa. Access to recent data on bribes anddelays along the transport corridors of West Africa offersus a unique opportunity to explore the implications ofinstitutional incoherence for enterprise choice and marketbehaviour. And to the extent that institutional incoherenceresults in flawed price signals to farmers, we suggest thatthere is a link between corruption and the sustainability ofagriculture in West Africa.
Below we will first present a general model of bribes andassociated corruption across space. We will then draw onrecent data from major transport corridors in West Africa toillustrate the implications of bribes and transit delays on themovement of three agricultural commodities — onions,shea and cashew.
2. A spatial model of transport corruption
Bromley and Chavas (1989) offered a spatial modelillustrating how risky economic environments tend toundermine the willingness of economic agents to engagethe market. The point in that work was to illustrate theconcept of a willingness to pay for institutional coherence.Following up on that model, Bromley (2008) offered aspatially explicit elaboration of that same problem tosuggest that agricultural assets — both those assetsconsidered part of the “village commons” and those underthe exclusive control of individual agents (that is, privatelycontrolled assets) — face inevitable degradation ifprevailing institutional arrangements are defective. Thisconclusion is important because the standard accountsuggests that private assets are optimally managed whileassets managed in common will inevitably be dissipated.However, when institutional incoherence erodes net returnsto land, even privately-owned assets become degraded.Degradation sets in because of the lack of adequate netreturns from the farming operation to allow maintenance of— and investments in — the underlying asset base.
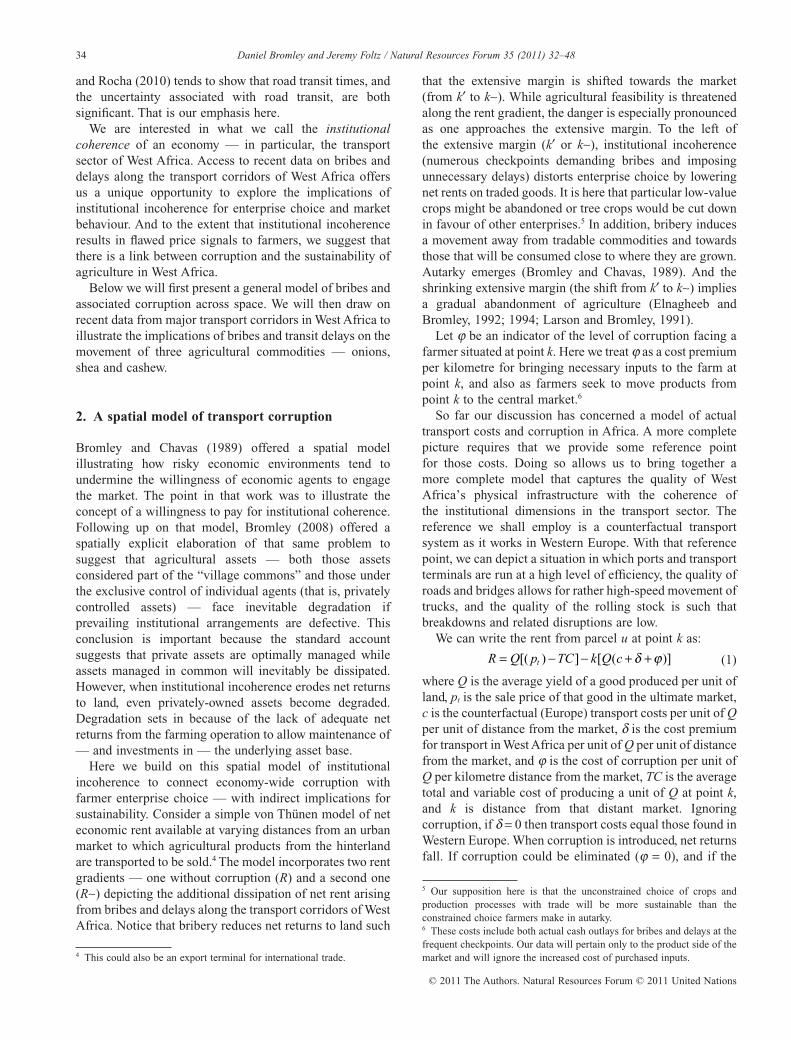
Here we build on this spatial model of institutionalincoherence to connect economy-wide corruption withfarmer enterprise choice — with indirect implications forsustainability. Consider a simple von Thünen model of neteconomic rent available at varying distances from an urbanmarket to which agricultural products from the hinterlandare transported to be sold.4 The model incorporates two rentgradients — one without corruption (R) and a second one(R~) depicting the additional dissipation of net rent arisingfrom bribes and delays along the transport corridors of WestAfrica. Notice that bribery reduces net returns to land such
that the extensive margin is shifted towards the market(from k′ to k~). While agricultural feasibility is threatenedalong the rent gradient, the danger is especially pronouncedas one approaches the extensive margin. To the left ofthe extensive margin (k′ or k~), institutional incoherence(numerous checkpoints demanding bribes and imposingunnecessary delays) distorts enterprise choice by loweringnet rents on traded goods. It is here that particular low-valuecrops might be abandoned or tree crops would be cut downin favour of other enterprises.5 In addition, bribery inducesa movement away from tradable commodities and towardsthose that will be consumed close to where they are grown.Autarky emerges (Bromley and Chavas, 1989). And theshrinking extensive margin (the shift from k′ to k~) impliesa gradual abandonment of agriculture (Elnagheeb andBromley, 1992; 1994; Larson and Bromley, 1991).
Let j be an indicator of the level of corruption facing afarmer situated at point k. Here we treat j as a cost premiumper kilometre for bringing necessary inputs to the farm atpoint k, and also as farmers seek to move products frompoint k to the central market.6
So far our discussion has concerned a model of actualtransport costs and corruption in Africa. A more completepicture requires that we provide some reference pointfor those costs. Doing so allows us to bring together amore complete model that captures the quality of WestAfrica’s physical infrastructure with the coherence ofthe institutional dimensions in the transport sector. Thereference we shall employ is a counterfactual transportsystem as it works in Western Europe. With that referencepoint, we can depict a situation in which ports and transportterminals are run at a high level of efficiency, the quality ofroads and bridges allows for rather high-speed movement oftrucks, and the quality of the rolling stock is such thatbreakdowns and related disruptions are low.
We can write the rent from parcel u at point k as:
R Q p TC k Q ct= − − + +[( ) ] [ ( )]δ ϕ (1)
where Q is the average yield of a good produced per unit ofland, pt is the sale price of that good in the ultimate market,c is the counterfactual (Europe) transport costs per unit of Qper unit of distance from the market, d is the cost premiumfor transport in West Africa per unit of Q per unit of distancefrom the market, and j is the cost of corruption per unit ofQ per kilometre distance from the market, TC is the averagetotal and variable cost of producing a unit of Q at point k,and k is distance from that distant market. Ignoringcorruption, if d = 0 then transport costs equal those found inWestern Europe. When corruption is introduced, net returnsfall. If corruption could be eliminated (j = 0), and if the
4 This could also be an export terminal for international trade.
5 Our supposition here is that the unconstrained choice of crops andproduction processes with trade will be more sustainable than theconstrained choice farmers make in autarky.6 These costs include both actual cash outlays for bribes and delays at thefrequent checkpoints. Our data will pertain only to the product side of themarket and will ignore the increased cost of purchased inputs.
34 Daniel Bromley and Jeremy Foltz / Natural Resources Forum 35 (2011) 32–48
cost premium in West Africa could be eliminated (d = 0),then Equation 1 reduces to the ideal von Thünen rentgradient (R* in Figure 2). Eliminating corruption wouldbring R~ coincident with R, while eliminating otherextraordinary transport costs in West Africa would bring Rcoincident with R*. We see that the transport cost premiumand corruption work to shrink the zone of economic activityaround the market centre. High transport costs andcorruption fuel autarky and conspire to isolate ruraleconomic activity, which in turn threatens agriculturalsustainability.
3. The data: Transport costs in West Africa
Our data come from several sources. In a recent reportconcerning transport prices and costs in Africa we find datathat allow assessment of transport costs in West Africa(Teravaninthorn and Raballand, 2009). A second source ofdata is two ongoing surveys of bribes and delays at the manycheckpoints along the main trucking corridors of WestAfrica (WATH, 2009; WATH, 2010). These data sourcesallow us to estimate three essential parameters. First, we canderive a reference level of transport costs per kilometrebased on data from Western Europe. Second, we cancalculate a West Africa “premium” to reflect the additionalcosts per kilometre over and above transport costs inWestern Europe. Finally we can calculate the costs ofcorruption in West Africa, focusing on the actual monetaryvalue of requisite bribes per kilometre, as well as theimplicit costs of enforced delays at the many checkpointsalong the highways.
Our data on bribes and enforced delays at checkpoints(the combined effects will be called “corruption”) comefrom two current studies sponsored by the West AfricaTrade Hub (WATH). The first study is being conducted bythe Improved Road Transport Governance (IRTG) project.The second study is being conducted by the Agribusinessand Trade Promotion (ATP) project. While seeking similarinformation, these two studies are conducted quitedifferently.
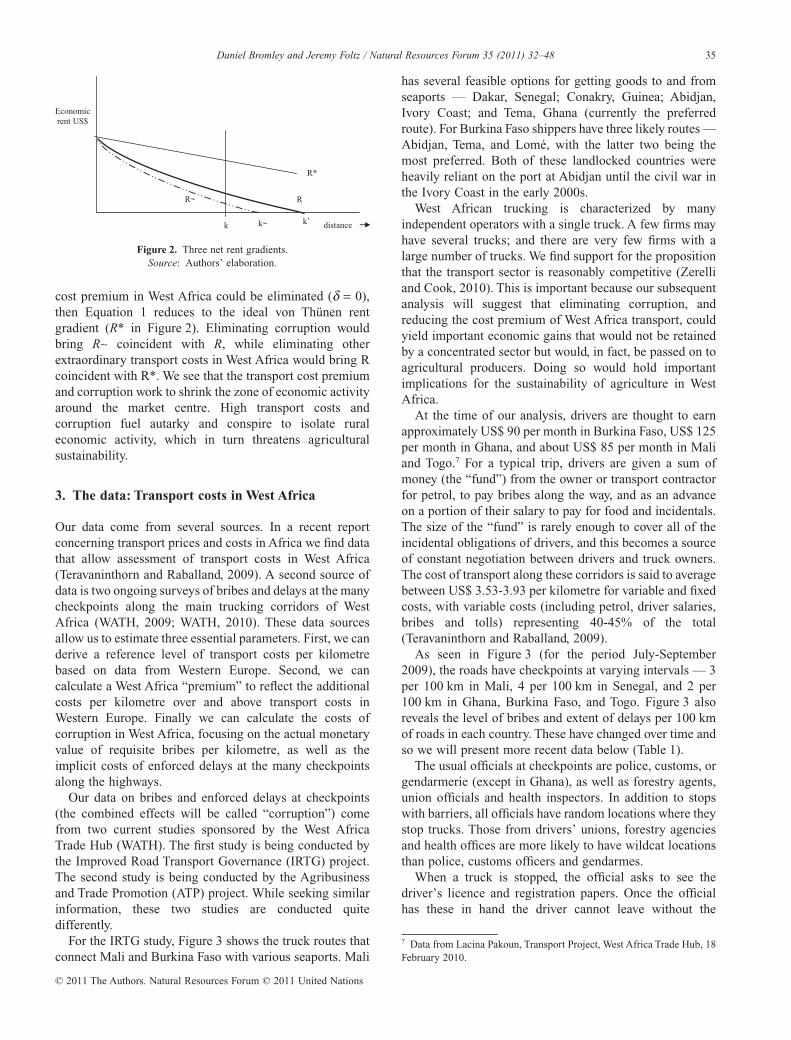
For the IRTG study, Figure 3 shows the truck routes thatconnect Mali and Burkina Faso with various seaports. Mali
has several feasible options for getting goods to and fromseaports — Dakar, Senegal; Conakry, Guinea; Abidjan,Ivory Coast; and Tema, Ghana (currently the preferredroute). For Burkina Faso shippers have three likely routes —Abidjan, Tema, and Lomé, with the latter two being themost preferred. Both of these landlocked countries wereheavily reliant on the port at Abidjan until the civil war inthe Ivory Coast in the early 2000s.
West African trucking is characterized by manyindependent operators with a single truck. A few firms mayhave several trucks; and there are very few firms with alarge number of trucks. We find support for the propositionthat the transport sector is reasonably competitive (Zerelliand Cook, 2010). This is important because our subsequentanalysis will suggest that eliminating corruption, andreducing the cost premium of West Africa transport, couldyield important economic gains that would not be retainedby a concentrated sector but would, in fact, be passed on toagricultural producers. Doing so would hold importantimplications for the sustainability of agriculture in WestAfrica.
At the time of our analysis, drivers are thought to earnapproximately US$ 90 per month in Burkina Faso, US$ 125per month in Ghana, and about US$ 85 per month in Maliand Togo.7 For a typical trip, drivers are given a sum ofmoney (the “fund”) from the owner or transport contractorfor petrol, to pay bribes along the way, and as an advanceon a portion of their salary to pay for food and incidentals.The size of the “fund” is rarely enough to cover all of theincidental obligations of drivers, and this becomes a sourceof constant negotiation between drivers and truck owners.The cost of transport along these corridors is said to averagebetween US$ 3.53-3.93 per kilometre for variable and fixedcosts, with variable costs (including petrol, driver salaries,bribes and tolls) representing 40-45% of the total(Teravaninthorn and Raballand, 2009).
As seen in Figure 3 (for the period July-September2009), the roads have checkpoints at varying intervals — 3per 100 km in Mali, 4 per 100 km in Senegal, and 2 per100 km in Ghana, Burkina Faso, and Togo. Figure 3 alsoreveals the level of bribes and extent of delays per 100 kmof roads in each country. These have changed over time andso we will present more recent data below (Table 1).
The usual officials at checkpoints are police, customs, orgendarmerie (except in Ghana), as well as forestry agents,union officials and health inspectors. In addition to stopswith barriers, all officials have random locations where theystop trucks. Those from drivers’ unions, forestry agenciesand health offices are more likely to have wildcat locationsthan police, customs officers and gendarmes.
When a truck is stopped, the official asks to see thedriver’s licence and registration papers. Once the officialhas these in hand the driver cannot leave without the
7 Data from Lacina Pakoun, Transport Project, West Africa Trade Hub, 18February 2010.
distance
Economic rent US$
R
k’k~
R~
k
R*
Figure 2. Three net rent gradients.Source: Authors’ elaboration.
35Daniel Bromley and Jeremy Foltz / Natural Resources Forum 35 (2011) 32–48
paperwork. It is here that the official threatens to delay thedriver unless a bribe is paid, usually under the pretext thatthe papers are not in order or perhaps that the truck isoverweight. Appiah (2010) suggests that many drivers donot wait to be asked for a bribe but simply include apayment when handing over the requested documents.Rarely is merchandise confiscated, although small giftsof certain types of goods might be asked for or
offered.8 Eventually the driver is allowed to proceed. In thecountries using the CFA Franc as currency (Burkina Faso,Mali, Senegal and Togo), most bribes are for the amount ofthe smallest bills: 500, 1,000, and 2,000 with a fewcombinations of them. In Ghana, the amounts vary morewidely with bribe levels in 1 and 2 new cedi price points.9
Drivers can negotiate these bribes, sometimes evenreceiving change for large bills from officials, and oftenthere is a standard rate for infractions. In these transactions,each side negotiates delay as a threat point — the officialcan delay the driver indefinitely, while the driver can delaythe official, taking up his time and blocking the road withthe offending truck.10
Our data below pertain to two quite different sampleframes. The first frame (the IRTG study) is for trucks thatare “legal” — that is, their papers are in order, they areconfidently within weight limits, and the driver is a member
8 Drivers can be convenient couriers of valued commodities from onecountry to another (e.g. cigarettes).
9 For simplicity, all Cedi’s (new and old) are converted to CFA francs anddollar values. We use 481 FCFA = US$ 1.00. There are 1.42 Ghana cedis(GHC) per US$ 1.00.10 Most of the truck stops have limited parking for trucks except for thoseat the entry and exit of major cities. The roads themselves are often twolanes wide so a large number of trucks waiting to pay bribes can easilyblock traffic.
Figure 3. The IRTG Survey corridors and data for 1 July-30 September 2009.Source: IRTG, 9th Report, 10 November 2009.
Table 1. Bribes on the truck corridors of West Africa
Country Cargo Bribe per kilometre
Burkina Faso1 General 0.17Burkina Faso2 Onions for Accra Market 0.44Ghana3 General 0.02Ghana4 Onions for Accra Market 0.11Mali5 General 0.18Niger6 Onions for Accra Market 0.47
1 WATH (2010). Data are from the IRTG study.2 Average of WATH (2009) and WATH (2010). Data are from theATP study.3 WATH (2010). Data are from the IRTG study.4 WATH (2010). Data are from the ATP study.5 WATH (2010). Data are from the IRTG study.6 WATH (2009). Data are from the ATP study.
36 Daniel Bromley and Jeremy Foltz / Natural Resources Forum 35 (2011) 32–48
of the appropriate union. For this survey, enumerators gavethe surveys to truck drivers at the beginning of their trips inports or inland depots. Notice that the IRTG study surveysonly those trucks that are legal in their documentation andaxle weight. When those conducting the survey approachedthe drivers with a survey, a trucking expert checked theirpapers and assessed if the papers for the truck and cargo werein order. If so, and if the driver agreed to take the survey, theywere given a survey to fill out which was collected at the endof the trip. Only trucks scheduled to drive the whole trip weregiven surveys. Those conducting the survey estimate thattrucks with their papers in order represented about one-thirdof the long-haul trucks on these routes.
Our IRTG data therefore, while accurately depicting thebribes and delays per truck along these corridors, representan underestimate of the total bribes actually paid by alltrucks along the corridors studied here. This follows fromthe fact that approximately two thirds of the trucking fleetsurveyed by IRTG researchers do not have the appropriatepapers and are, therefore, likely to have paid even higherbribes to be allowed to proceed. The delays to which thelegal trucks are exposed are also much less than the delaysimposed on the entire fleet of trucks — the vast majority ofwhich are of dubious legal provenance.
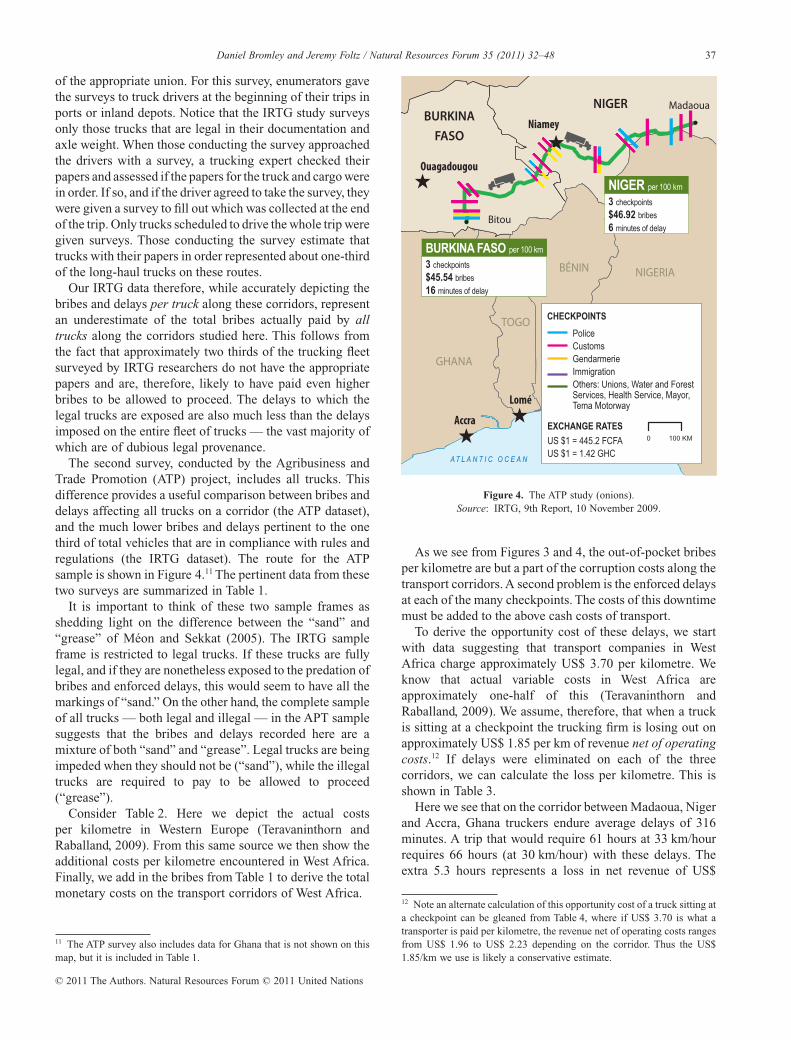
The second survey, conducted by the Agribusiness andTrade Promotion (ATP) project, includes all trucks. Thisdifference provides a useful comparison between bribes anddelays affecting all trucks on a corridor (the ATP dataset),and the much lower bribes and delays pertinent to the onethird of total vehicles that are in compliance with rules andregulations (the IRTG dataset). The route for the ATPsample is shown in Figure 4.11 The pertinent data from thesetwo surveys are summarized in Table 1.
It is important to think of these two sample frames asshedding light on the difference between the “sand” and“grease” of Méon and Sekkat (2005). The IRTG sampleframe is restricted to legal trucks. If these trucks are fullylegal, and if they are nonetheless exposed to the predation ofbribes and enforced delays, this would seem to have all themarkings of “sand.” On the other hand, the complete sampleof all trucks — both legal and illegal — in the APT samplesuggests that the bribes and delays recorded here are amixture of both “sand” and “grease”. Legal trucks are beingimpeded when they should not be (“sand”), while the illegaltrucks are required to pay to be allowed to proceed(“grease”).
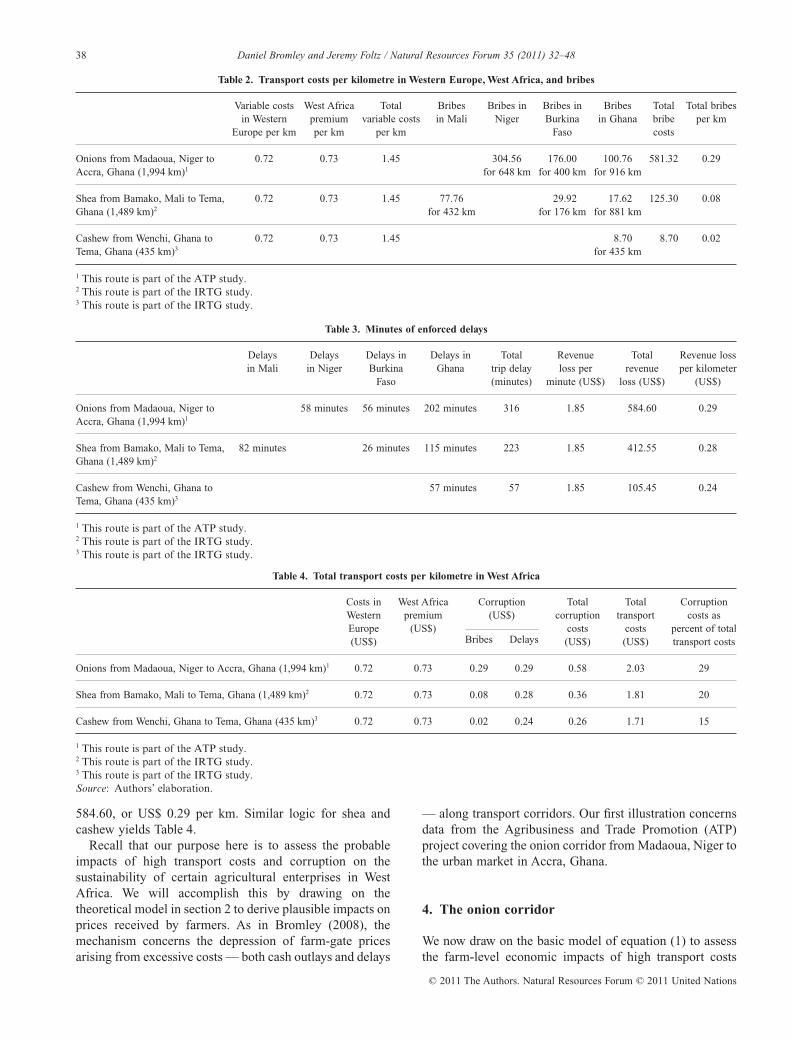
Consider Table 2. Here we depict the actual costsper kilometre in Western Europe (Teravaninthorn andRaballand, 2009). From this same source we then show theadditional costs per kilometre encountered in West Africa.Finally, we add in the bribes from Table 1 to derive the totalmonetary costs on the transport corridors of West Africa.
As we see from Figures 3 and 4, the out-of-pocket bribesper kilometre are but a part of the corruption costs along thetransport corridors. A second problem is the enforced delaysat each of the many checkpoints. The costs of this downtimemust be added to the above cash costs of transport.
To derive the opportunity cost of these delays, we startwith data suggesting that transport companies in WestAfrica charge approximately US$ 3.70 per kilometre. Weknow that actual variable costs in West Africa areapproximately one-half of this (Teravaninthorn andRaballand, 2009). We assume, therefore, that when a truckis sitting at a checkpoint the trucking firm is losing out onapproximately US$ 1.85 per km of revenue net of operatingcosts.12 If delays were eliminated on each of the threecorridors, we can calculate the loss per kilometre. This isshown in Table 3.
Here we see that on the corridor between Madaoua, Nigerand Accra, Ghana truckers endure average delays of 316minutes. A trip that would require 61 hours at 33 km/hourrequires 66 hours (at 30 km/hour) with these delays. Theextra 5.3 hours represents a loss in net revenue of US$
11 The ATP survey also includes data for Ghana that is not shown on thismap, but it is included in Table 1.
12 Note an alternate calculation of this opportunity cost of a truck sitting ata checkpoint can be gleaned from Table 4, where if US$ 3.70 is what atransporter is paid per kilometre, the revenue net of operating costs rangesfrom US$ 1.96 to US$ 2.23 depending on the corridor. Thus the US$1.85/km we use is likely a conservative estimate.
Figure 4. The ATP study (onions).Source: IRTG, 9th Report, 10 November 2009.
37Daniel Bromley and Jeremy Foltz / Natural Resources Forum 35 (2011) 32–48
584.60, or US$ 0.29 per km. Similar logic for shea andcashew yields Table 4.
Recall that our purpose here is to assess the probableimpacts of high transport costs and corruption on thesustainability of certain agricultural enterprises in WestAfrica. We will accomplish this by drawing on thetheoretical model in section 2 to derive plausible impacts onprices received by farmers. As in Bromley (2008), themechanism concerns the depression of farm-gate pricesarising from excessive costs — both cash outlays and delays
— along transport corridors. Our first illustration concernsdata from the Agribusiness and Trade Promotion (ATP)project covering the onion corridor from Madaoua, Niger tothe urban market in Accra, Ghana.
4. The onion corridor
We now draw on the basic model of equation (1) to assessthe farm-level economic impacts of high transport costs
Table 2. Transport costs per kilometre in Western Europe, West Africa, and bribes
Variable costsin Western
Europe per km
West Africapremiumper km
Totalvariable costs
per km
Bribesin Mali
Bribes inNiger
Bribes inBurkina
Faso
Bribesin Ghana
Totalbribecosts
Total bribesper km
Onions from Madaoua, Niger toAccra, Ghana (1,994 km)1
0.72 0.73 1.45 304.56 176.00 100.76 581.32 0.29for 648 km for 400 km for 916 km
Shea from Bamako, Mali to Tema,Ghana (1,489 km)2
0.72 0.73 1.45 77.76 29.92 17.62 125.30 0.08for 432 km for 176 km for 881 km
Cashew from Wenchi, Ghana toTema, Ghana (435 km)3
0.72 0.73 1.45 8.70 8.70 0.02for 435 km
1 This route is part of the ATP study.2 This route is part of the IRTG study.3 This route is part of the IRTG study.
Table 3. Minutes of enforced delays
Delaysin Mali
Delaysin Niger
Delays inBurkina
Faso
Delays inGhana
Totaltrip delay(minutes)
Revenueloss per
minute (US$)
Totalrevenue
loss (US$)
Revenue lossper kilometer
(US$)
Onions from Madaoua, Niger toAccra, Ghana (1,994 km)1
and corruption on the continued feasibility of onionproduction in West Africa. The interesting dimension ofthis dataset is that it includes all trucks — not just thosethat are legal. We have seen in Tables 1-4 the implicationsof this for bribe costs and the opportunity costs of delaysat checkpoints. Here we are interested in deriving theimplications of these costs for net returns to onionproduction — a major export to Ghana and a lucrativecrop for farmers in Niger.
Typical yields for onions in the region appear to be from20-35 MT per hectare (USAID, 2005). The trucks to Accra,Ghana carry 202 bags of onions, each weighing 120 kg, fora total of 24,240 kg. Notice that this is close to the averageyield of a hectare of onions near Madaoua. Assume thataverage onion yields are 24.24 MT (24,240 kg) per hectare.This assumption means that each truck hauls the typicalyield of a hectare of onions. A recent study reveals that atruckload would bring the farmer US$ 3,394 (US$ 0.14 perkg), and the production costs are estimated to be US$ 1,454(US$ 0.06 per kg), implying a net return per hectare ofonions of US$ 1,940 (US$ 0.08 per kg) (Martinez Rivas,2009). The gross market value of a truckload of onions inAccra is US$ 8,726 (at US$ 0.36 per kg during the mainonion season). But costs of moving the onions must beconsidered.
We see in Table 4 that transport costs along the onioncorridor have three components: (1) the reference costs ofUS$ 0.72 per km in Western Europe; (2) a West Africanpremium of US$ 0.73 per km; and (3) total corruption costsof US$ 0.58 per km. Thus, the transport of a truckloadof onions costs US$ 2.03 per km. Referring to equation (1)we have:
Q = 24 240, kg;TC = US$ per kg0 06. ;pt = US$ 0.36 per kg at Accra;c = US$ 0.72 per km of reference transport costs;δ = US$ 0.73 per km cost premium in West Africa;ϕ = US$ 0.58 per km of corruption costs; andk = 1,994 km.
The data here require that we now modify equation (1).Specifically, we are no longer considering transport costsper unit of agricultural produce from a unit of land kkilometres from the ultimate market. Rather, we areconsidering the net value of a truckload of onionsoriginating k kilometres from that market. This means thatequation (1) must now be rewritten as:
R Q p TC k ct= − − + +[ ] ( )δ ϕ (2)
That is, our unit of analysis is not a hectare of land butrather the aggregate yield of a number of hectaressurrounding a collection terminal k kilometres from theurban market (Accra). We know the weight of that cargo(Q), we know the price per kilogram of that cargo in thedistant market (pt), and we know the costs of producing a
kilogram of cargo (TC). The assumption in equation (2) isthat transport costs and corruption costs do not vary by theweight or the value of the cargo being hauled.13 One otherfact about equation (2) warrants mention here. The net rentR is not concerned with the farm-gate price of thecommodity under consideration. Prices paid to producersare derived from the residual to the marketing agent orexporter and this is dependent on the ultimate market (orexport) price and the costs of moving the product to market.
Below we will derive a schedule of possible offer pricesas a function of transport costs. When those offer prices fallbelow farmers’ break-even price they will cease to engagethe market and will withdraw into subsistence production.Or they will modify their choice of enterprise.
Hence, the net value of the cargo is a function of onlythree variables: per kilogram production costs (TC), perkilogram price in the distant market (pt), and the total costof moving the cargo to the distant market t (where t = c +d+ j).
We now have:
R = − −24 240 0 36 0 06 1 994 0 72, [($ . ) ($ . )] ( , )($ . ) Western Europe
TrransportCosts
West AfricaTransportP
� ��� ��� −
( , )($ . )1 994 0 73
rremium
CorruptionCosts
� ��� ��� � ��� ���− ( , )($ . )1 994 0 58 (3)
Equation (3) indicates that the net value of the onioncargo at the collection terminal is US$ 7,272. Moving thatcargo to market will cost US$ 2.03 per kilometre, for a totaltransport cost of US$ 4,048. This means the actual value ofonions net of transport costs is US$ 3,224.
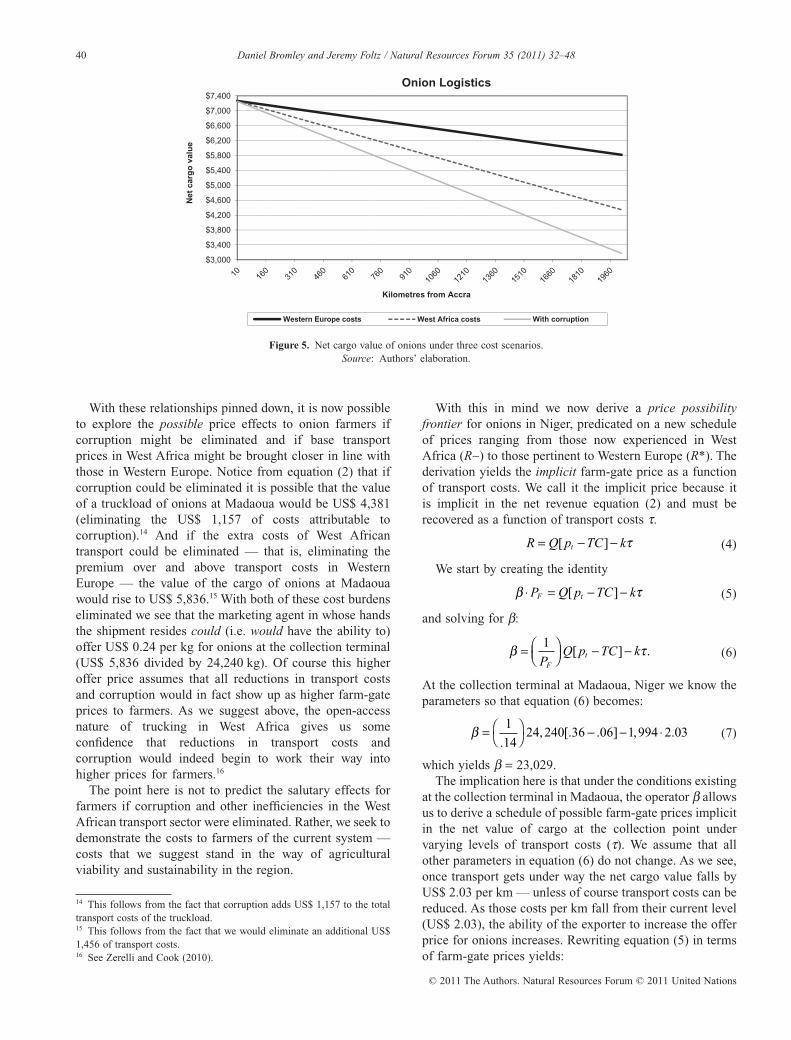
The obvious question concerns the impact on farm-gateprices and net returns to onion farmers if transport costs —including corruption — might be reduced or eliminated.Understanding the possible price effects of theseimprovements will help us apprehend the costs of what wecall institutional incoherence on farming practices andsustainability. As above, the curves R and R* in Figure 2 arereflective of the willingness to pay on the part of onionproducers to have access to the benefits of improvedtransport services. That is, both R and R* representcounterfactual rent possibility frontiers. Each shows, forproducers at point k, the new income possibilities assumingthat corruption might be eliminated (moving from R~ to R),and that high West African transport costs might be broughtmore in line with those in Western Europe (moving from Rto R*). We can derive R by calculating this new revenuecurve with corruption costs (j) removed from considerationin equation (2). We can then derive R* by positing theelimination of the West African cost premium (d) fromequation (2). These three rent gradients for onions areshown in Figure 5.
13 Bribes in West Africa are not easily correlated to the value of the cargo.
39Daniel Bromley and Jeremy Foltz / Natural Resources Forum 35 (2011) 32–48
With these relationships pinned down, it is now possibleto explore the possible price effects to onion farmers ifcorruption might be eliminated and if base transportprices in West Africa might be brought closer in line withthose in Western Europe. Notice from equation (2) that ifcorruption could be eliminated it is possible that the valueof a truckload of onions at Madaoua would be US$ 4,381(eliminating the US$ 1,157 of costs attributable tocorruption).14 And if the extra costs of West Africantransport could be eliminated — that is, eliminating thepremium over and above transport costs in WesternEurope — the value of the cargo of onions at Madaouawould rise to US$ 5,836.15 With both of these cost burdenseliminated we see that the marketing agent in whose handsthe shipment resides could (i.e. would have the ability to)offer US$ 0.24 per kg for onions at the collection terminal(US$ 5,836 divided by 24,240 kg). Of course this higheroffer price assumes that all reductions in transport costsand corruption would in fact show up as higher farm-gateprices to farmers. As we suggest above, the open-accessnature of trucking in West Africa gives us someconfidence that reductions in transport costs andcorruption would indeed begin to work their way intohigher prices for farmers.16
The point here is not to predict the salutary effects forfarmers if corruption and other inefficiencies in the WestAfrican transport sector were eliminated. Rather, we seek todemonstrate the costs to farmers of the current system —costs that we suggest stand in the way of agriculturalviability and sustainability in the region.
With this in mind we now derive a price possibilityfrontier for onions in Niger, predicated on a new scheduleof prices ranging from those now experienced in WestAfrica (R~) to those pertinent to Western Europe (R*). Thederivation yields the implicit farm-gate price as a functionof transport costs. We call it the implicit price because itis implicit in the net revenue equation (2) and must berecovered as a function of transport costs t.
R Q p TC kt= − −[ ] τ (4)
We start by creating the identity
β τ⋅ = − −P Q p TC kF t[ ] (5)
and solving for b:
β τ= ⎛⎝⎜
⎞⎠⎟ − −
1
PQ p TC k
Ft[ ] . (6)
At the collection terminal at Madaoua, Niger we know theparameters so that equation (6) becomes:
β = ⎛⎝
⎞⎠ − − ⋅
1
1424 240 36 06 1 994 2 03
., [. . ] , . (7)
which yields b = 23,029.The implication here is that under the conditions existing
at the collection terminal in Madaoua, the operator b allowsus to derive a schedule of possible farm-gate prices implicitin the net value of cargo at the collection point undervarying levels of transport costs (t). We assume that allother parameters in equation (6) do not change. As we see,once transport gets under way the net cargo value falls byUS$ 2.03 per km — unless of course transport costs can bereduced. As those costs per km fall from their current level(US$ 2.03), the ability of the exporter to increase the offerprice for onions increases. Rewriting equation (5) in termsof farm-gate prices yields:
14 This follows from the fact that corruption adds US$ 1,157 to the totaltransport costs of the truckload.15 This follows from the fact that we would eliminate an additional US$1,456 of transport costs.16 See Zerelli and Cook (2010).
$3,000
$3,400
$3,800
$4,200
$4,600
$5,000
$5,400
$5,800
$6,200
$6,600
$7,000
$7,400
Onion Logistics
Net
car
go
val
ue
Kilometres from Accra
Western Europe costs West Africa costs With corruption
Figure 5. Net cargo value of onions under three cost scenarios.Source: Authors’ elaboration.
40 Daniel Bromley and Jeremy Foltz / Natural Resources Forum 35 (2011) 32–48
And thus for a given reduction in transport costs (t) we canderive a price possibility curve indicating the possiblechange in farm-gate prices. This is shown in Figure 6.
From this relationship we can now introduce a novel formof price elasticity — the elasticity of farm-gate onion priceswith respect to changes in total transport costs:
dP
d PF
Fττ⎛
⎝⎞⎠
⎛⎝⎜
⎞⎠⎟ , (12)
which yields:
−( )⎛⎝
⎞⎠ = −.
.
.. .0866
2 03
141 256 (13)
This implies that a 10% reduction in transport costs couldpossibly give rise to a 12.56 % increase in onion prices tofarmers at Madaoua. As above, if these reductions incorruption costs and basic transport costs in West Africa aresimply retained by the transport sector then farmers will notbenefit at all. We believe the transport is competitive enoughthat this would not be the case.
We now turn to a similar analysis of two tree crops.
5. Tree crops: Cashew and shea
While the sustainability of arable agriculture is aprofoundly important matter (see Figure 1), the challengeof sustainability is most often discussed in the context ofagro-forestry. This is especially the case in areas where soilerosion is a prominent concern. We will carry out a similaranalysis for cashew and shea, two important agro-forestryproducts in West Africa. For this, the transport corridorsshown in Figure 3, and the associated costs shown inTable 4, are pertinent.
5.1. Cashew
The Ghana cashew region is shown as the darkly shadedportion of Figure 7. The ideal rainfall regime is between750-1300 mm. Cashew tends to grow well on marginalland, and it is considered an ideal crop for soilconservation and afforestation in the savanna belt of WestAfrica. Other countries where cashew thrives are shown inTable 5.
In Ghana, cashew production is generally undertaken bysmallholders — those families with farms ranging between0.8-2.5 ha. In 2007, it was estimated that approximately60,000 farmers were cultivating cashew trees. At that timethere were approximately 59,000 hectares of cashew inGhana, with annual production estimated at 15,000 MT ofraw cashew nuts (WATH, 2007). Cashew is an ideal agro-forestry crop, planted along with maize, millet, sorghum,yam, cassava, soybean, groundnuts or chillies. With closespacing and a closed canopy, or as young trees mature,inter-cropping ceases to be feasible.
In collaboration with researchers from the University ofGhana we collected data from 80 farmers for the 2009
0
0.02
0.04
0.06
0.08
0.1
0.12
0.14
0.16
0.18
0.2
0.22
0.24
0.26
0.28
0.3
Pri
ce t
o f
arm
ers
($ p
er k
g)
Transport costs per km
Figure 6. Price possibility frontier for onions with different transport costs.Source: Authors’ elaboration.
41Daniel Bromley and Jeremy Foltz / Natural Resources Forum 35 (2011) 32–48
cashew season around Wenchi-Jaman-Techiman of theBrong-Ahafo region of Ghana. These farmers had averageyields of 545 kg of raw cashew kernels per hectare whichthey sold to exporters at a nearby town (a “selling point”)for an average price of US$ 0.31 per kg. This point of salefor the farmers to the exporters was 435 km from the exportterminal at Tema. As we see in Table 4, costs of moving atruck of cashews is estimated to be US$ 1.71 per km. Theraw kernels are usually transported in 20 foot containerswith a loaded weight of 16 MT (16,000 kg) to the exporthub at Tema.17
To illustrate the impact of high transport costs on cashewwe return to the basic model in equation (2). The relevantparameters are:
Q = 16 000, kg;TC = US$ 0.28 per kg;pt = US$ 0.60 per kg Free on Board (FOB) at Tema;c = US$ 0.72 per km of reference transport costs;δ = US$ 0.73 per km cost premium in West Africa;ϕ = US$ 0.26 per km of corruption costs; andk = 435 km.
These parameters indicate the net value of the container ofcashew at the selling terminal 435 km from the terminal atTema.
To summarize, the total net value of a 16,000 kg load ofraw cashew nuts at the collection terminal is US$ 5,120. Itthen costs an additional US$ 631 to move the container toTema, plus the exporter (or the transport firm) mustpay bribes and absorb the implicit costs of delays totalingUS$ 113. The trajectory of net revenue attributable tocashew production is shown in Figure 8. We also depict a“reference” net revenue trajectory showing transport costsin Western Europe (see Table 4). This line corresponds toR* in Figure 2. The line “West Africa” is the actual trans-port cost for moving a 16 MT container to Tema. Thiscorresponds to the curve R in Figure 2 and it lies below R*because of the higher costs of transporting goods in WestAfrica. In addition, the lowest line in Figure 8 depictsthe additional decrement to net revenues arising fromcorruption. This corresponds to R~ in Figure 2.
As we did for onions, we want to derive the implicit pricepossibility frontier for reductions in transport costs andbribes. As previously, the relevant operator b is derived as:
β = ⎛⎝
⎞⎠ − − ⋅ =
1
3116 000 60 28 435 1 71 14 116
., [. . ] . , .
And so:
PF = ⎛⎝
⎞⎠ − ⎛
⎝⎞⎠
5120
14 116
435
14 116, ,( ).τ (15)
For cashew, the implicit price relation is:
PF = −$ . . .0 3627 0308τ (16)
We see that:
dP
dF
τ⎛⎝
⎞⎠ = −0 0308. . (17)
The price elasticity with respect to a change in transportcosts and bribes is given by:
dP
d PF
Fττ⎛
⎝⎞⎠
⎛⎝⎜
⎞⎠⎟ , (18)
which yields:
− ⎛⎝
⎞⎠ = −0 0308
1 71
0 311699.
.
.. . (19)
This implies that a 10% reduction in transport costs(including both corruption as well as underlying transportcosts) could yield a 1.7% increase in cashew prices tofarmers. This is depicted in Figure 9.
It may be wondered why this elasticity is so much lessthan that for onions coming from Niger. The answer has two
17 Calculations for various cargo weights have a minimal effect in terms ofprice possibilities.
Figure 7. Major cashew production areas in Ghana.Source: Authors’ elaboration.
42 Daniel Bromley and Jeremy Foltz / Natural Resources Forum 35 (2011) 32–48
parts: (1) cashew is being moved 435 km as opposed to1,994 km for onions; and (2) transport costs for cashew(US$ 1.71 per km) are just over 80% of those costs on theonion corridor (2.03).
In a recent survey, 62 cashew farmers in central Ghanawere asked how they would respond to a 10% increase incashew prices if that price increase was expected to last forseveral years. These same farmers were also asked theirlikely response to a 10% drop in cashew prices that wasexpected to persist for several years. Their responses, whichshow reasonably high levels of price responsiveness in theirplanning, are summarized in Table 6.
We conclude by considering the case for shea nuts.
5.2. Shea
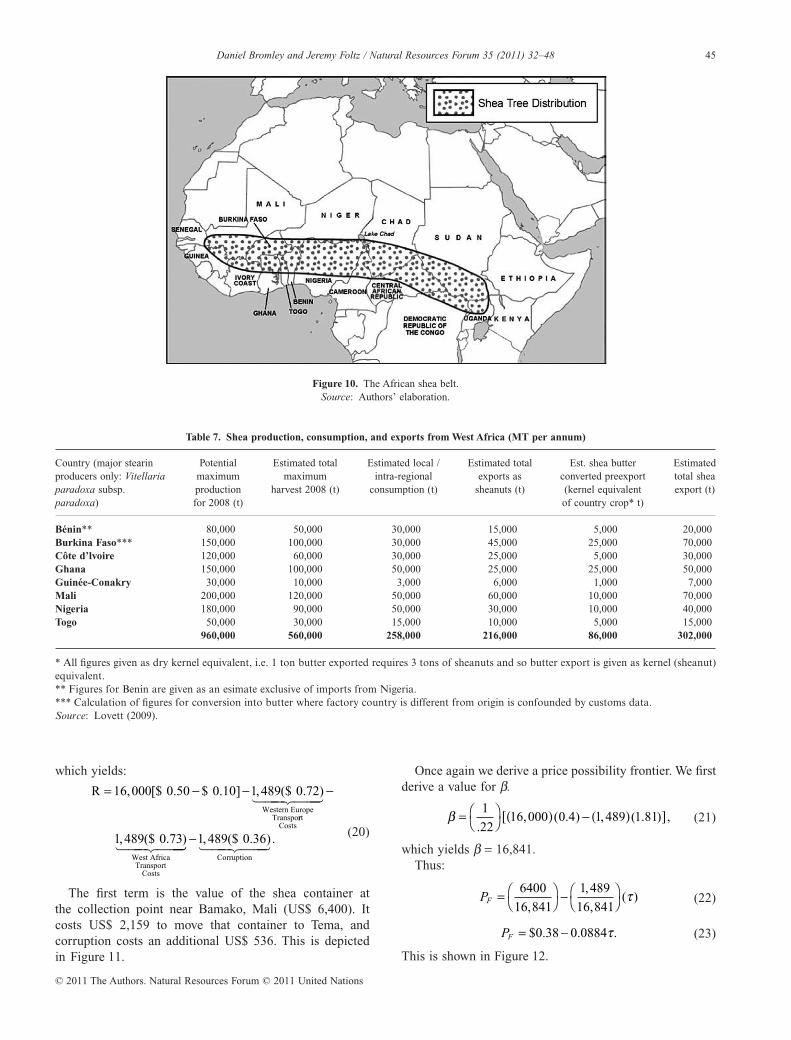
The shea tree (Vitellara paradoxa) is found in a long narrowswathe approximately 600 km wide and 5,000 km longacross northern sub-Saharan Africa, encompassing 18countries from Senegal in the west to Sudan and Uganda(and a small corner of Ethiopia) in the east (Figure 10).18
18 Subspecies paradoxa occurs in the western range of the shea beltcovering 15 countries: Benin, Burkina Faso, Cameroon, Central AfricanRepublic, Chad, Côte d’Ivoire, Gambia, Ghana, Guinea, Guinea Bissau,Mali, Niger, Nigeria, Senegal and Togo. Subspecies nilotica occupies theeastern range and is found in four countries: Ethiopia, Sudan, Uganda andthe Democratic Republic of Congo (FAO, 2004, pp. 52-53).
* No official statistics exist for raw nut production in any of these countries. These numbers are estimates based on recent studies and interviews withtraders.Source: WATH (2007).
$4,300
$4,400
$4,500
$4,600
$4,700
$4,800
$4,900
$5,000
$5,100
$5,200
Net
car
go
val
ue
Kilometres from Tema
Cashew Logistics
Western Europe costs West Africa costs With corruption
Figure 8. Net cargo value of cashews along the trade route.Source: Authors’ elaboration.
43Daniel Bromley and Jeremy Foltz / Natural Resources Forum 35 (2011) 32–48
The shea fruit is used in a variety of ways: the fruit pulp andthe nut are eaten; cooking oil may be extracted from it; andedible butter and cosmetics may be manufactured from it.The shea belt is said to contain over 500 million trees acrossthis semi-arid strip of Africa. In West Africa, the primaryexport market for shea butter is as a substitute for cocoabutter (Cocoa Butter Equivalent (CBE)) in the making ofchocolate and various confections. A second export market— much smaller in volume but not in value — is for sheabutter used in cosmetics. A third export market is forpharmaceuticals and edible fats (Ferris et al., 2001).
Given the scattered nature of the shea-forest savanna, andthe informal nature of the shea economy, it is difficult toobtain accurate data on total production of nuts, the fractionof nuts kept for home use, the quantity sold to traders, andthe proportion exported as nuts or as butter. It is estimatedthat only about half the available shea nuts are actuallycollected. There are very few exporters of processed sheaand so reliable data — for confidentiality reasons — arevirtually impossible to obtain. Table 7 shows estimates forwhat is thought to be the case in 2008 (Lovett, 2009).
We collected data from 40 shea compounds containing239 adults in Koulikoro District, Mali (northeast ofBamako). Since shea is a nut crop from the open accessforest-savanna, our data are not on a per-hectare basis aswith onions and cashews but rather show yields for thecompound. Women in these two villages produce shea fortheir own consumption and for making butter. Eachcompound sold, on average, 200 kg of shea kernels in 2009.The price received for these shea kernels was FCFA 100 perkg (approximately US$ 0.22 per kg). In Tema, the FOBprice for shea kernels is assumed to be US$ 0.50 per kg.19
With reference to equation (1), we encounter a problembecause of the absence of costs of production of shea nuts.As above, we know that the farm-gate price of shea is US$0.22 per kg. And we find it reasonable to assume thatwomen would not bother to collect shea nuts if the costs ofdoing so, including the subsequent costs of drying andstoring shea nuts, did not cover the market price of the nuts.This suggests that the costs of producing a kilogram of sheanuts must be less than US$ 0.22 per kg — how much lessmust remain unknown. But, it must be kept in mind thatshea nuts are not actually produced — they are merelycollected lying about on the ground. On the assumption thatwomen have other important things to do with their time wewill assign a shadow price of their labour at US$ 0.10 perkg. Drawing on equation (1) we have:
Q = 16 000, kg;TC = US$ 0.10 per kg;pt = US$ 0.50 per kg FOB at Tema;c = US$ 0.72 per km reference transport costs;δ = US$ 0.73 per km West Africa transport costs;ϕ = US$ 0.36 per km of corruption costs; andk = 1,489 km.
19 There is considerable seasonal variation in prices.
0.29
0.295
0.3
0.305
0.31
0.315
0.32
0.325
0.33
0.335
0.34
0.345
Pri
ce t
o f
arm
ers
(US
$ p
er k
g)
Transport costs per km
Figure 9. Price possibility frontier for cashew under different transport costs.Source: Authors’ elaboration.
Table 6. Likely action in response to changes in cashew prices(multiple responses)
Actions by farmers Yes Percentage
Persistent price increase of 10%Expand land area devoted to cashew 50 80.6Spend more time on tree improvement 38 71.7Increase spending on agrochemicals 49 79.0Replace old trees with new ones 18 51.4Plant new trees 1 1.6Persistent price decrease of 10%Replace cashew trees with other crops 19 50Abandon cashew farm 19 50Spend less time on tree improvement 28 66.7
Source: Kwadzo and Kuwornu (2010).
44 Daniel Bromley and Jeremy Foltz / Natural Resources Forum 35 (2011) 32–48
The first term is the value of the shea container atthe collection point near Bamako, Mali (US$ 6,400). Itcosts US$ 2,159 to move that container to Tema, andcorruption costs an additional US$ 536. This is depictedin Figure 11.
Once again we derive a price possibility frontier. We firstderive a value for b.
β = ⎛⎝
⎞⎠ ( ) − ( )[ ]1
2216 000 0 4 1 489 1 81
., ( . ) , ( . ) , (21)
which yields b = 16,841.Thus:
PF = ⎛⎝
⎞⎠ − ⎛
⎝⎞⎠
6400
16 841
1 489
16 841,
,
,( )τ (22)
PF = −$ . . .0 38 0 0884τ (23)
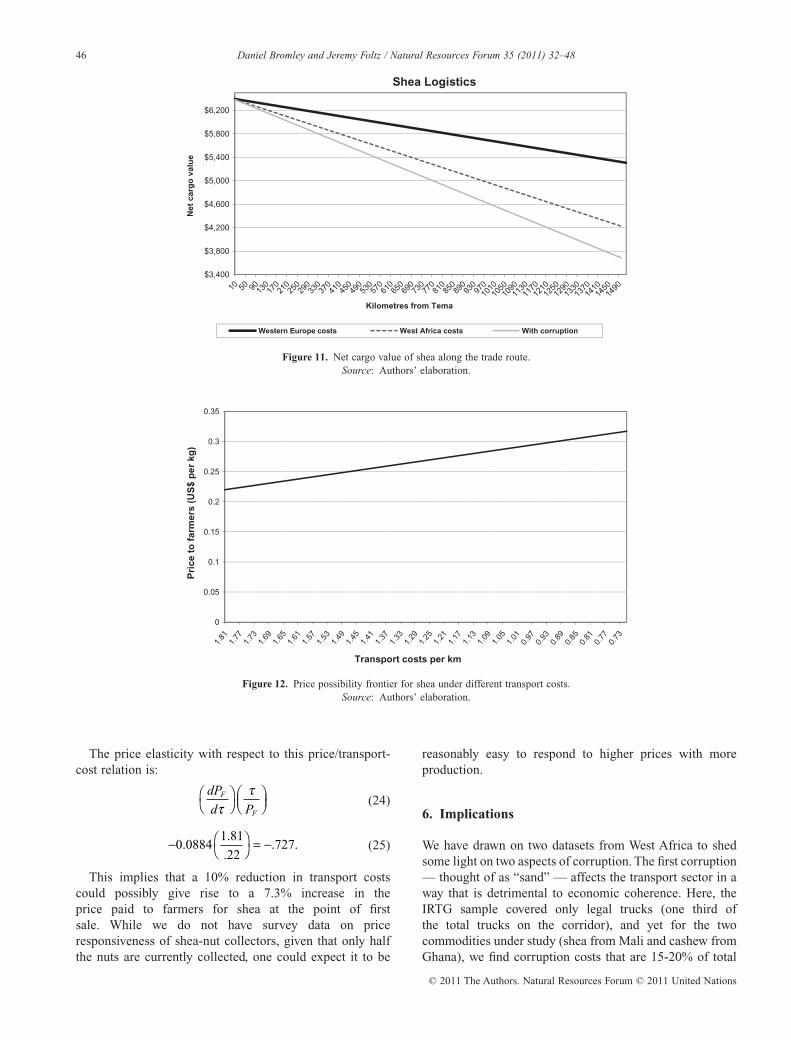
This is shown in Figure 12.
Figure 10. The African shea belt.Source: Authors’ elaboration.
Table 7. Shea production, consumption, and exports from West Africa (MT per annum)
Country (major stearinproducers only: Vitellariaparadoxa subsp.paradoxa)
Potentialmaximumproductionfor 2008 (t)
Estimated totalmaximum
harvest 2008 (t)
Estimated local /intra-regional
consumption (t)
Estimated totalexports as
sheanuts (t)
Est. shea butterconverted preexport(kernel equivalentof country crop* t)
* All figures given as dry kernel equivalent, i.e. 1 ton butter exported requires 3 tons of sheanuts and so butter export is given as kernel (sheanut)equivalent.** Figures for Benin are given as an esimate exclusive of imports from Nigeria.*** Calculation of figures for conversion into butter where factory country is different from origin is confounded by customs data.Source: Lovett (2009).
45Daniel Bromley and Jeremy Foltz / Natural Resources Forum 35 (2011) 32–48
The price elasticity with respect to this price/transport-cost relation is:
dP
d PF
Fττ⎛
⎝⎞⎠
⎛⎝⎜
⎞⎠⎟ (24)
− ⎛⎝
⎞⎠ = −0 0884
1 81
22727.
.
.. . (25)
This implies that a 10% reduction in transport costscould possibly give rise to a 7.3% increase in theprice paid to farmers for shea at the point of firstsale. While we do not have survey data on priceresponsiveness of shea-nut collectors, given that only halfthe nuts are currently collected, one could expect it to be
reasonably easy to respond to higher prices with moreproduction.
6. Implications
We have drawn on two datasets from West Africa to shedsome light on two aspects of corruption. The first corruption— thought of as “sand” — affects the transport sector in away that is detrimental to economic coherence. Here, theIRTG sample covered only legal trucks (one third ofthe total trucks on the corridor), and yet for the twocommodities under study (shea from Mali and cashew fromGhana), we find corruption costs that are 15-20% of total
$3,400
$3,800
$4,200
$4,600
$5,000
$5,400
$5,800
$6,200
Net
car
go
val
ue
Kilometres from Tema
Shea Logistics
Western Europe costs West Africa costs With corruption
Figure 11. Net cargo value of shea along the trade route.Source: Authors’ elaboration.
0
0.05
0.1
0.15
0.2
0.25
0.3
0.35
Pri
ce t
o f
arm
ers
(US
$ p
er k
g)
Transport costs per km
Figure 12. Price possibility frontier for shea under different transport costs.Source: Authors’ elaboration.
46 Daniel Bromley and Jeremy Foltz / Natural Resources Forum 35 (2011) 32–48
transport costs. For the entire sample of trucks covered inthe ATP project, meaning that both legal and illegal truckswere sampled, we find corruption costs that are almost 30%of total transport costs. It is here that one encounters both“sand” and “grease”. The legal trucks in the ATP datasetmust pay bribes for no good reason, while the illegal trucksmust pay “grease” to be allowed to proceed when in factthey should be halted entirely.
We have used the high transport costs of West Africa,plus the additional burden of corruption, to draw sometentative implications for price possibility frontiers foronions, shea and cashew. These price possibility frontiersshow the upper bounds on farm-gate prices from variousreductions in transport costs in West Africa. We derivefarm-gate price elasticities of transport costs that reveal a10% reduction in total transport costs — actual costs pluscorruption costs along each corridor — yielding priceincreases of 12-13% for onions, 2% for cashews, and 7%for shea.
The obvious question is whether or not reductions intransport costs (including corruption costs) would in factresult in higher prices to farmers. We suggest that truckingin West Africa is reasonably competitive and that there aregood reasons to believe that farmers would indeed benefitfrom reductions in these costs. One piece of evidence forthis assumption that the transport sector is reasonablycompetitive arises from the evidence that two thirds of totaltrucks on the major corridors are, in fact, running as illegalparticipants in the sector. If the transport sector were highlyconcentrated, it would be a surprise to see this proportion ofillegal trucks operating. There are simply no barriers toentry — except, perhaps access to capital, and credit is nota relevant “barrier” to entry.
Finally we draw mild inferences about sustainability. Ourchain of reasoning is that corruption and other problems inthe transport sector strip economic rents out of theagricultural sector operating at considerable distances fromthe final market — either the export terminal at Tema,Ghana for shea and cashew, or the urban onion market inAccra. With rents suppressed, the net profitability of thesecommodities is undermined. When net returns aresuppressed, investment is postponed or forsaken entirely,yields fall, net returns suffer, and farmers are caught in acycle of falling productivity, reduced critical mass oftradable production, and perhaps even higher costs toarrange shipments. Shea trees become vulnerable toclearance for cotton or other crops. Cashew gives wayto other enterprises. Onion cultivation ceases and the landreverts back to desert.
References
Appiah, I.S.K., 2010. The movement of vehicles and corruption on WestAfrican international highways: Case study of Tema-Paga corridor.Accra, Ghana, Ghana Institute of Journalism, July.
Bromley, D.W., 1989. Economic interests and institutions: the conceptualfoundations of public policy, Oxford: Blackwell.
Bromley, D.W., 2006. Sufficient reason: Volitional pragmatism and themeaning of economic institutions, Princeton, NJ: Princeton UniversityPress.
Bromley, D.W., 2008. Resource degradation in the African commons:Accounting for institutional decay, Environment and DevelopmentEconomics, 13: 539–563.
Bromley, D.W., Chavas, J.-P., 1989. On risk, transactions and economicdevelopment in the semiarid tropics, Economic Development andCultural Change, 37(4): 719–736.
Campos, J.E., Lien, D., Pradhan, S., 1999. The impact of corruption oninvestment: Predictability matters, World Development, 27(6):1059–1067.
Elnagheeb, A.H., Bromley, D.W., 1992. Rainfed mechanized farming anddeforestation in Sudan, Environmental and Resource Economics, 2:359–371.
Elnagheeb, A.H., Bromley, D.W., 1994. Extensification of agricultureand deforestation: Empirical evidence from Sudan, AgriculturalEconomics, 10: 193–200.
FAO, 2004. International Workshop on Processing and Marketing of SheaProducts in Africa, Proceedings of a Workshop held by the Food andAgriculture Organization of the United Nations, the Common Fund forCommodities, and the Centre de Suivi Ecologique. Centre de SuiviEcologique, Dakar, Sénégal, 4–6 March 2002.
Fafchamps, M., Hill, R. Vargas, 2005. Selling at the market or traveling tomarket, American Journal of Agricultural Economics, 87(3): 717–734.
Ferris, R.S.B., Collinson, C., Wanda, K., Jagwe, J., Wright, P., 2001.Evaluating the marketing opportunities for shea nut and shea nutprocessed products in Uganda, Natural Resources Institute, Foodnet.
Freund, C., Rocha, N., 2010. What constrains Africa’s exports? PolicyResearch Working Paper 5184, Washington, D.C.: The World Bank.
IRTG, 2009. Integrated Road Transport Group: 9th Report, West AfricaTrade Hub, November 10, 2009.
Kwadzo, G.T-M., Kuwornu, J.K.M., 2010. Production, employment, andincome generation in the cashew sector of Ghana: A multiplier study,Accra, Ghana, West Africa Trade Hub, August.
Lambsdorff, J.G., 2006. The causes and consequences of corruption: Whatdo we know from a cross-section of countries? In Rose-Ackerman, S.(Ed.), International Handbook on the Economics of Corruption.Cheltenham, UK: Edward Elgar Publishing.
Larson, B., Bromley, D.W., 1991. Natural resource prices, export policies,and deforestation: The case of Sudan, World Development, 19(10):1289–1297.
Lovett, P., 2009. Estimates of shea production in West Africa, Accra,Ghana, West Africa Trade Hub.
Martinez Rivas, M., 2009. Onion transport and logistics study along theMadaoua-Ouagadougou-Accra corridor, Agribusiness and TradePromotion (ATP) Project, West Africa. Carana Corporation, August.
Méon, P.-G., Sekkat, K., 2005. Does corruption grease or sand the wheelsof growth? Public Choice, 122: 69–97.
Olken, B., Barron, P., 2009. The simple economics of extortion: Evidencefrom trucking in Aceh, Journal of Political Economy, 117(3): 417–452.
Portugal, A., Wilson, J., 2009. Why trade facilitation matters to Africa,Policy Research Working Paper, 4719, Washington, D.C.: The WorldBank.
Raballand, G., Macchi, P., 2008. Transport prices and costs: The need torevisit donors’ policies in transport in Africa, Bureau for Research andEconomic Analysis of Development (BREAD).
Rose-Ackerman, S. (Ed.), 2006. International handbook on the economicsof corruption, Cheltenham, UK: Edward Elgar.
Shleifer, A., Vishny, R.W., 1993. Corruption, The Quarterly Journal ofEconomics, 108(3): 599–617.
Teravaninthorn, S., Raballand, G., 2009. Transport prices and costs inAfrica: A review of international corridors, Washington, D.C.: WorldBank.
47Daniel Bromley and Jeremy Foltz / Natural Resources Forum 35 (2011) 32–48
USAID, 2005. How market gardens can alleviate Sahelian small holderfood insecurity: Case of AFRICARE in Abeche, Chad. West AfricanRegional Food for Peace Office, June, Series No. 2.
WATH, 2007. Cashew marketing and consumption in West Africa: Currentstatus and opportunities, West Africa Trade Hub Technical Report #22,September 2007.
WATH, 2009. 9th improved road transport governance, survey results fromthe 3rd quarter, 2009, Accra, West Africa Trade Hub (WATH),November 10, 2009.
WATH, 2010. 12th improved road transport governance, survey resultsfrom the 2nd quarter, 2010, Accra, West Africa Trade Hub (WATH),August 10, 2010.
Wall Street Journal (Europe), 2006. November 24–26.Zerelli, S., Cook, A., 2010. Trucking to West Africa’s land locked
countries: Market structure and conduct, West Africa Trade HubTechnical Report #32, September.
48 Daniel Bromley and Jeremy Foltz / Natural Resources Forum 35 (2011) 32–48